Article

The Impact of the Feed Rate and the Binder Concentration on the Morphology of Spray-Dried Alumina–Polymer Nanocomposites

1
Institute of Mechanical Process Engineering and Minerals Processing, TU Bergakademie Freiberg, Agricolastr. 1, 09599 Freiberg, Saxony, Germany
2
Institute of Stochastics, Ulm University, Helmholtzstr. 18, 89069 Ulm, Baden-Württemberg, Germany
3
Institute of Particle Process Engineering, University of Kaiserslautern-Landau (RPTU), Gottlieb-Daimler-Strasse 74, 67663 Kaiserslautern, Rhineland-Palatinate, Germany
*
Author to whom correspondence should be addressed.
Processes 2025, 13(6), 1643; https://doi.org/10.3390/pr13061643
Submission received: 28 April 2025 / Revised: 18 May 2025 / Accepted: 20 May 2025 / Published: 23 May 2025
(This article belongs to the Section Materials Processes)

Abstract

:
Spray-drying is a flexible method for creating fine porous composites with controlled size and morphology. This study investigates how the morphology and porosity of the spray-dried powder of nano-alumina and polyvinylpyrrolidone (PVP-30) granules are affected by both the feed rate and the binder concentration. Droplet size and velocity distributions, measured with a HiWatch system, showed that higher feed rates produce larger droplets with faster velocities, therefore affecting the final morphology of the dried product. The morphology of the dried granules was analyzed using inline SOPAT imaging. While mercury intrusion porosimetry quantified the nano-pore volume and nano-pore size of the granules, offline scanning electron microscopy (SEM) was also used to characterize the morphology of the dried product. The findings show that, while raising the binder concentration produces a more compact morphology with a lower nano-pore volume, higher feed rates produce larger granules with a larger nano-pore volume. This study offers fundamental insights that can support the future development of control strategies for optimizing the production of spray-dried porous alumina–polymer nanocomposites by means of knowledge about the relationship between these process parameters and product qualities.

1. Introduction

Polymer nanocomposites possess a wide range of industrial uses, e.g., in biomedicine, pharmaceuticals, electronics, and ceramics [1,2,3]. In these materials, a polymer matrix is filled with nanoparticles [4,5,6] that enhance the mechanical, magnetic, electrical, or optical properties [6,7,8,9,10,11]. A key challenge in fabricating such composites is preventing the agglomeration of nanoparticles since van der Waals forces and other attractive interactions are relatively strong at the nanoscale [7,10]. Over the years, various synthesis routes have been developed to achieve a homogeneous dispersion of nanoparticles within polymers. These include the following: (1) synthesizing nanoparticles and polymers separately and then mixing them (e.g., in a melt or solution), (2) the in situ generation of nanoparticles within a polymer matrix, and (3) polymerizing monomers around dispersed nanoparticles [7,9,12]. Each method offers advantages; however, many fail to achieve a uniform dispersion of nanoparticles when incorporating high concentrations of nanoparticle fillers [9,10].
Spray-drying is a process through which a liquid containing dispersed solids is atomized into droplets from a nozzle, leading to solidification through a concentration increase in the presence of circulating drying gas [13]. The atomization process of the liquid into droplets is one of the relevant factors that affect the properties of the dried product [14]. Spray-drying a polymer solution containing pre-dispersed nanoparticles has emerged as an effective method for creating polymer nanocomposites. In the process developed by Banert and Peuker [4], a solution of polymer and nanoparticles is spray-dried to produce a composite material with a uniform nanoparticle distribution. This method takes advantage of a low-viscosity solvent to disperse nanoparticles, with polymer molecules adsorbing on nanoparticle surfaces to provide steric stabilization against aggregation [10,15]. The rapid evaporation of the solvent in the spray-dryer “freezes” the dispersed state, preventing nanoparticle agglomeration during solidification [9]. Previous studies have successfully applied this solution spray-drying approach to create polymer composites highly loaded with magnetite and other nanomaterials [16,17]. In addition to these heavily loaded nanocomposites, spray-drying has also been reported to generate nanobiocomposites with living cells inside [18], mesoporous graphene-based nanocomposite material for lithium-ion battery anodes [19]. Especially in this field of battery research, spray-drying can effectively produce porous microspheres of the polyanionic phosphate compound LiFePO4, a promising cathode material. Moreover, the assembly of nano-colloids via solvent evaporation through spray-drying has been acknowledged as a rapid and single-step method for generating interesting structures made up of interconnected nanoparticles. Recently, granules and polymeric nanocomposites with spherical and distorted donut-like morphologies [20,21,22,23], as well as porous structures [24], have been produced via spray-drying.
Alumina (Al2O3)-filled polymer composites have gained significant attention in recent years due to their exceptional properties and applications. Such alumina–polymer nanocomposites combine the high strength, thermal stability, and wear resistance of alumina with the flexibility and processability of polymers [25,26,27]. For several emerging applications, such as catalysis, battery electrodes, and drug delivery, these alumina nanocomposite materials, exhibiting controlled porosity, are particularly beneficial [28,29,30], as the presence of pores significantly enhances the accessible surface area and functional performance. The pore sizes, especially below 200 nm, which are categorized as micro (<2 nm), meso (>2 nm, and <50 nm), and macro pores (>50 nm), are of particular interest. Highly ordered macroporous alumina have been reported as an efficient, high-performance platform for enzyme immobilization [31], and mesoporous hematite/alumina nanocomposites have been reported to be useful for biomedical applications like MRI imaging and drug delivery [32]. These porous nanocomposites also facilitate more efficient drug loading and controlled releasing [30], better ionic transport and electrolyte penetration in batteries [29], and an increased accessible active surface area, allowing for uniform dispersion of catalytic sites and improving reactant diffusion efficiency [28]. In particular, understanding the formation and distribution of meso- and macropores is essential for tailoring material performance for specific functional applications. Therefore, this study will focus on the pore size of the alumina nanocomposites roughly within this size range.
The spray-drying method, in general, provides a promising route for synthesizing porous nanocomposites since it allows control over the dried product properties such as size, morphology, and internal structure [33,34,35,36]. However, systematic studies on how spray-drying process parameters affect the morphological and structural characteristics of dried products are required to guide process optimization. A deeper understanding of these relationships is thus essential for reliably producing alumina–polymer nanocomposites with desired characteristics tailored to the requirements of the specific applications mentioned above.
In this experimental study, a suspension of nano-alumina and polyvinylpyrrolidone (PVP-30) in distilled water was spray-dried to produce alumina–polymer nanocomposite. The composite product material is a granule formed from the primary alumina nanoparticles with PVP-30 acting as bridges. The focus of the experimental investigation was an examination of the effect of two critical process parameters, (a) the feed rate (the mass flow rate of the suspension into the dryer) and (b) the binder concentration (the mass fraction of PVP-30 in the suspension), on the resultant size, shape, and porosity of the dried granules. All other process parameters were held constant to isolate the effects of these two concerned parameters.
An inline imaging probe (SOPAT imaging system) was employed to capture the granule morphology, and it had already been used to study particle morphologies and agglomeration [37,38]. To obtain detailed insights into the granule morphology, offline characterization techniques were carried out with the granules. High-resolution scanning electron microscopy (SEM) characterization was conducted on the spray-dried product to visualize the rich structures of the granules, followed by mercury-intrusion porosimetry [39] to quantify the internal pore volume of the dried granules. By correlating the morphological observations from the inline SOPAT data with the offline porosity data, a deeper understanding of the relationship between the feed rate and the binder concentration, the granule size/shape, and the pore volume/size was gained.
This systematic characterization and modeling of the spray-drying process provide valuable insights into the process–structure relationship, forming a critical foundation for the growing trend toward the model-based control of spray-drying [40,41]. A deep understanding of the relationships between process parameters and product characteristics is essential for developing both predictive models [42] and effective control strategies [43,44]. In particular, parametric stochastic modeling approaches have been deployed to derive interpretable relationships that allow for the predictive simulation of products [45] at unseen scenarios, as well as for the optimization of products by optimizing process parameters [46]. Such an approach can dynamically predict and adjust process conditions in real time, enabling the consistent production of tailored particle properties for specific application requirements. This study, therefore, contributes to the understanding of the spray-drying process, depending on the process parameters, and the understanding of the process–structure relationship establishes a preliminary pathway towards the automated and optimized control of such processes.

2. Material and Methods

In the following, the feed material used in the spray-drying experiments, the experimental setup, and the methodology are presented. The section is organized as follows: first, the particle system of the feed is introduced (Section 2.1, and then, the spray-drying setup is described (Section 2.2, while an overview of the experiments conducted in this investigation (Section 2.3). This is followed by a description of the offline HiWatch setup to analyze the spray (Section 2.4) and the inline SOPAT imaging system (Section 2.5. Lastly, the description of the size and shape descriptors (Section 2.6) and the parametric modeling (Section 2.7) utilized in this study are included.

2.1. Feed Material Particle System

The primary solid component used in the spray-drying experiments was spherical alumina powder (ASFP-20, Denka Co. Ltd., Tokyo, Japan). These alumina nanoparticles have a well-defined spherical morphology and a solid, smooth structure, as confirmed via SEM imaging of the raw, unprocessed powder (Figure 1a). However, the small particle size of the nano-alumina and the overlapping particles in SEM image made it difficult to reliably extract primary particle sizes. Therefore, to characterize the size of the alumina nanoparticles, a dynamic light scattering (DLS) measurement using a Sympatec Nanophox analyzer (Sympatec Gmbh, Clausthal-Zellerfeld, Germany) was performed. The DLS measurements identified the particle size distribution in suspension. The empirical cumulative size distribution and probability density distribution acquired via the DLS measurements are shown in Figure 1b. It is important to note that Figure 1 represents a number-weighted distribution, meaning that each detected particle in the suspension contributes equally to the overall distribution. In other words, the resulting cumulative or density distribution reflects the relative abundance of particles of a given diameter, rather than emphasizing the mass or volume, which potentially obscures critical information about the smaller particle fraction that significantly influences processing behaviors and final product properties. Moreover, in the rest of the paper, number-weighted distributions have been utilized to describe the particle shape and size, enabling a clearer and more direct comparison between the alumina nanoparticles and the resulting dried granules and facilitating a precise evaluation of the process–structure relationships. The alumina nanoparticles have a median diameter ( d 50 , 0 ) of approximately 0.37   μ m and a modal diameter of 0.36   μ m . Comparatively, from the SEM image in Figure 1a, it can be observed that the size of the primary particles is within the same order.
In order to perform spray-drying experiments, a liquid feed was prepared as an aqueous suspension of the alumina nanoparticles with dissolved PVP-30 as a binder. In a typical batch, 33.3   g of ASFP-20 alumina powder and 2.67   g of PVP-30 were mixed into 300 m L of distilled water. This corresponds to a solid content of 10 wt% alumina and 0.8 wt% PVP-30 in the suspension. PVP-30 acts as a polymeric binder that, after drying, helps hold the alumina nanoparticles together in the composite. To investigate the influence of binder concentration even further, liquid feeds were prepared with PVP-30 mass fractions of 0.4 wt%, 1.6 wt%, and 3.2 wt%, while the alumina content was kept fixed at 10 wt%. Each feed was freshly prepared shortly before every experimental case listed in Section 2.3 and was continuously stirred during the experiments, at room temperature, using a magnetic stirrer to ensure consistency and avoid any effects of aging or sedimentation. The Fe2+ and Na+ impurities present in the ASFP-20 powder make the suspension basic with pH in the range of 9 to 9.5. PVP-30, being non-ionic, has a negligible effect on the pH. Zeta potential measurements with 10 wt% alumina and 0.8 wt% PVP-30 showed that, at pH 9, the mean zeta potential value over 5 measurement runs at that pH is 26.1   m V , indicating a reasonably stable suspension. Further stability tests of these suspensions constitute an entirely different study in itself, planned for future investigations. Additionally, polymer adsorption studies by Ishiduki and Esumi [47,48] confirmed that the adsorption of PVP on alumina particles is very low over a range of pH values from 5.2 to 10.2, for at least 24 h , in 10 mM NaCl solution. No flocculation was observed over the range of pH studied with only PVP added. Since our suspensions contain the same polymer (PVP) at a slightly lower molecular weight (PVP-K30, ≈40 kDa), comparable solids (10 wt%), and far lower ionic strength (distilled water, ≤0.05 mM), the electrostatic-plus-steric barrier was large enough; therefore, the feed remained well dispersed for the ≈1 h time of each run.

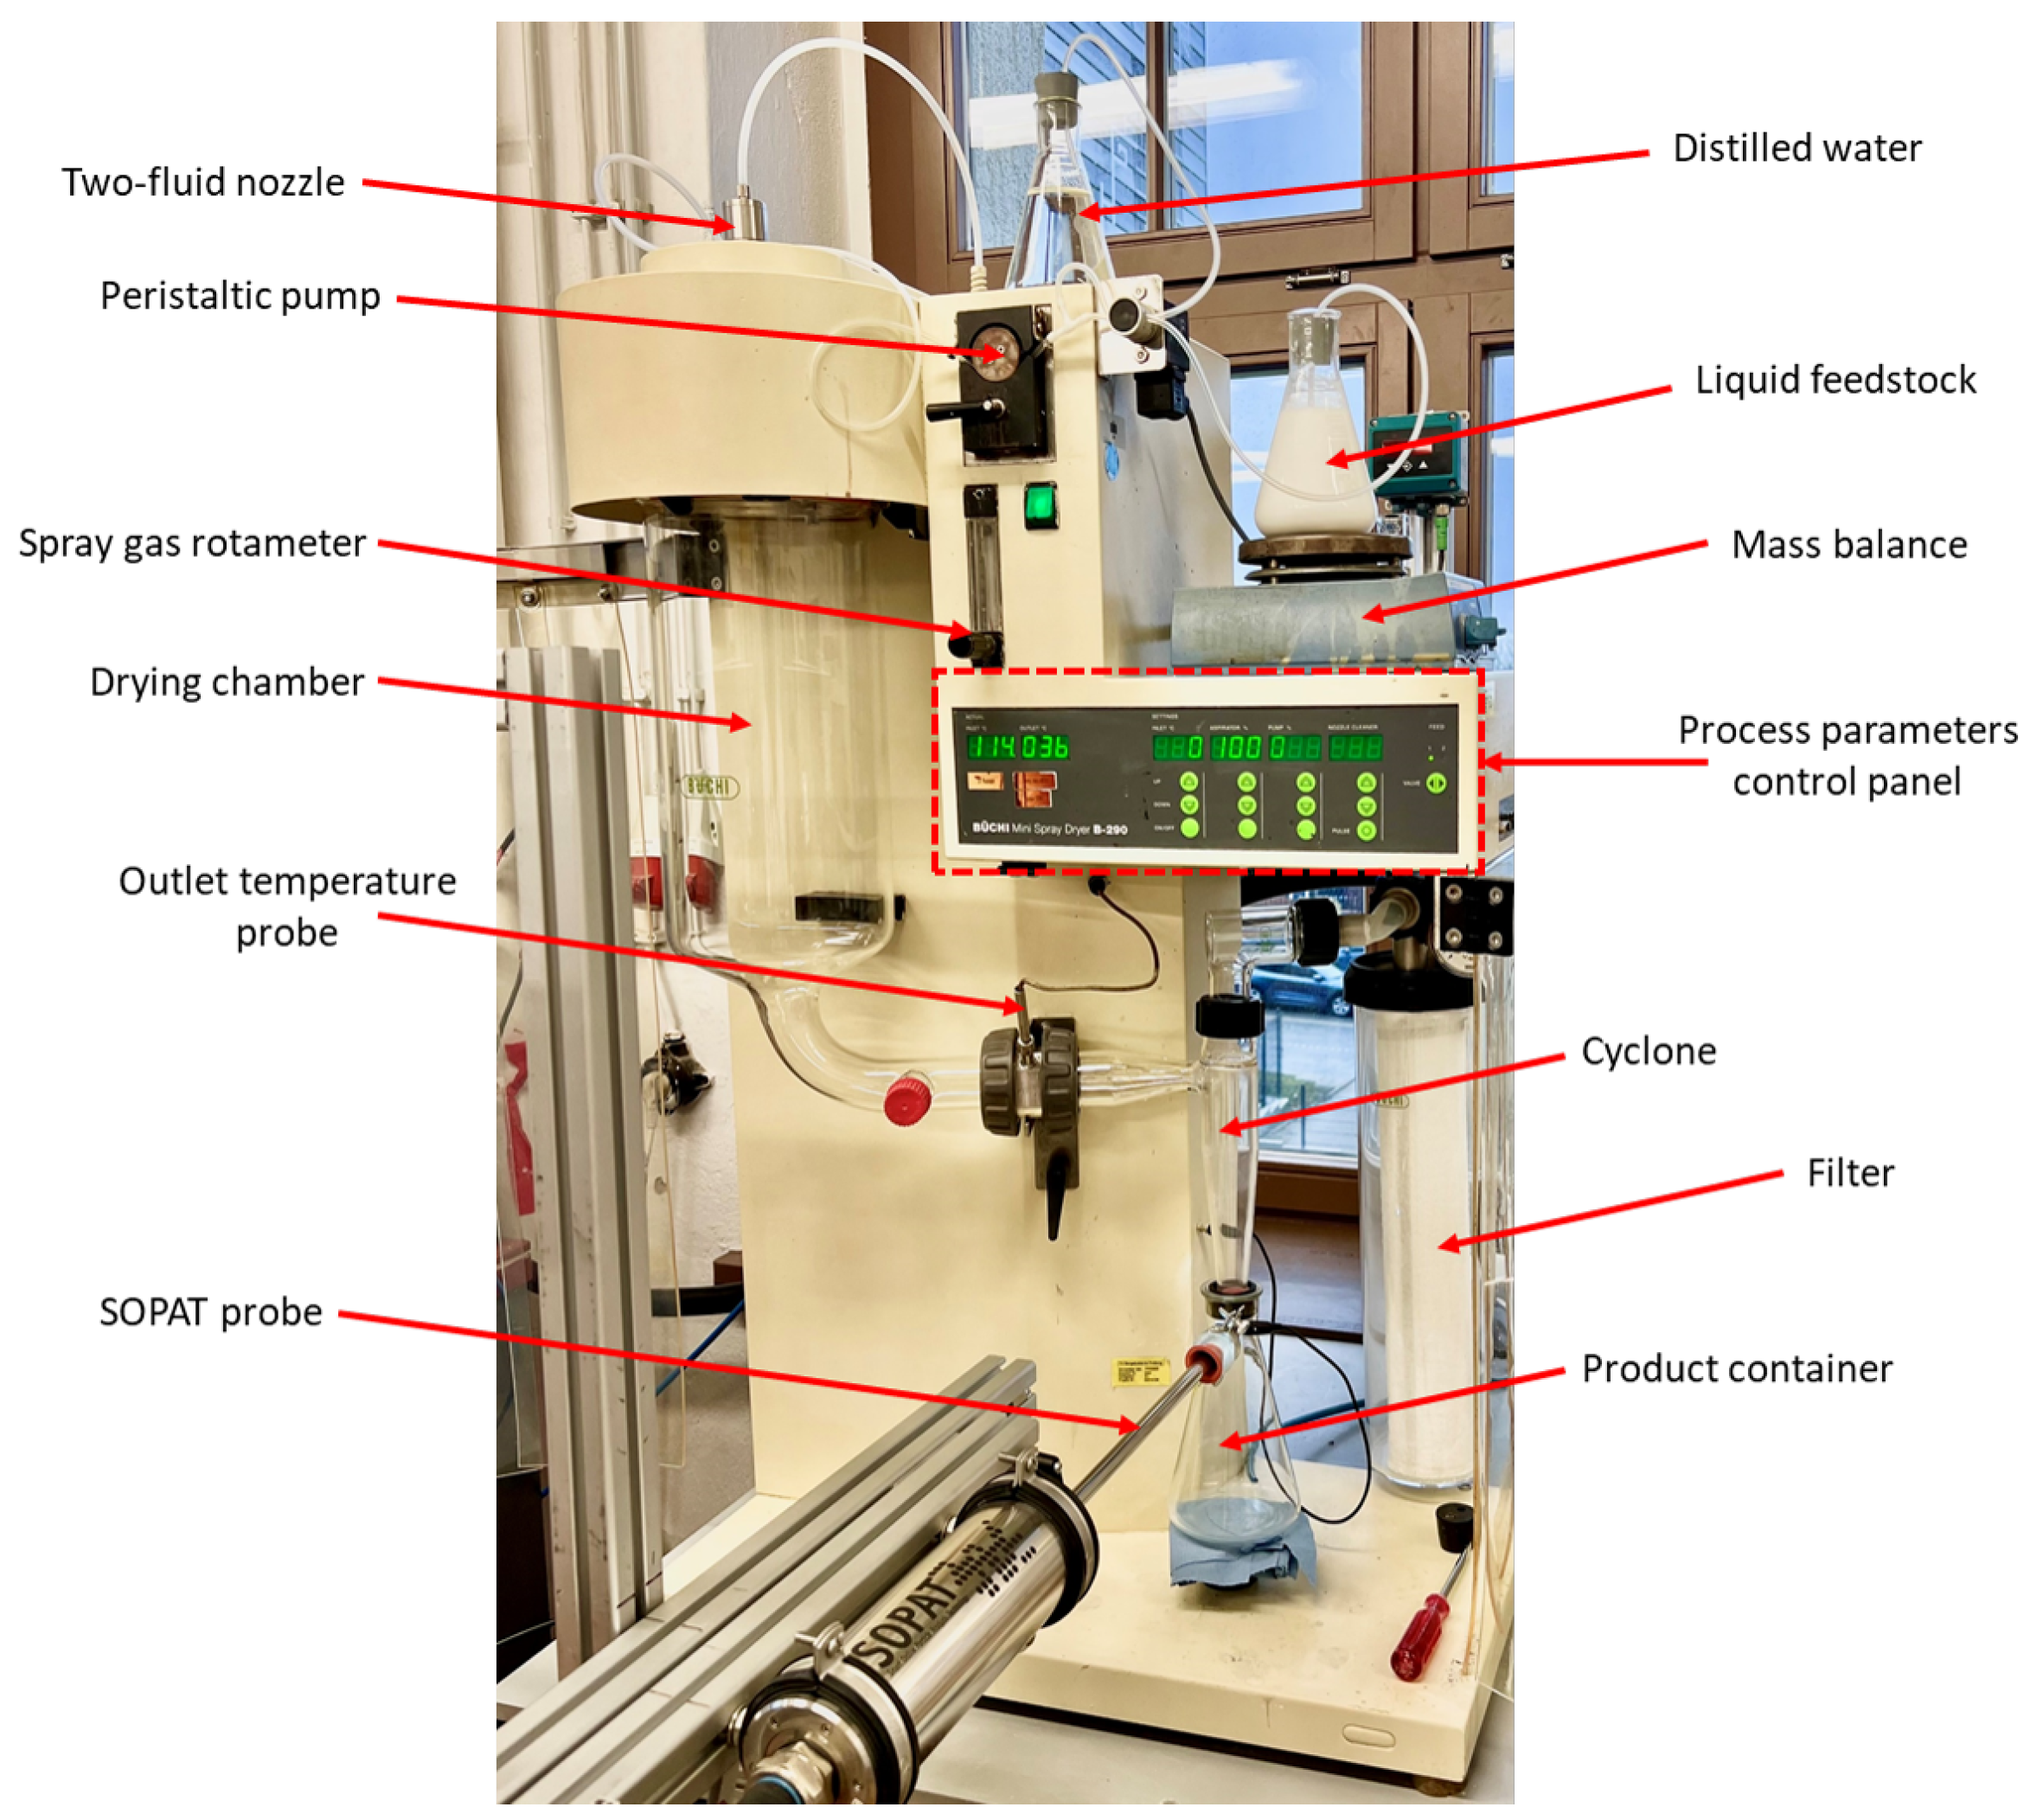
2.2. Spray-Drying Experimental Setup

The BÜCHI B-290 Mini Spray-Dryer, a laboratory-scale instrument, was employed to conduct the spray-drying experiments. This particular instrument features a standard two-fluid nozzle, characterized by a diameter of 0.7   m m and a nozzle cap diameter of 1.4   m m , which facilitates the efficient atomization of the liquid feed into fine droplets.
The atomization process utilizes compressed air, functioning as the spray gas, with adjustable flow rates ranging from 200 L h−1 to 800 L h−1 and operating pressures between 5 bar and 8 bar. This inherent flexibility in the system allows for control over the formation of droplets and their corresponding size distribution.
The drying gas, typically air, is heated to a maximum inlet temperature of 220 °C, which is accurately measured with a PT-100 thermocouple with a control accuracy of ± 3 °C, ensuring consistent thermal conditions for effective drying. The aspirator component is responsible for generating the drying gas flow, with a maximum airflow capacity of 35 m3 h−1, providing sufficient residence time, ranging from 1 to 1.5   s , for the droplets to undergo complete drying within the chamber.
The liquid feed is introduced into the nozzle by means of a peristaltic pump, which offers adjustable flow rates of up to 30 mL min−1. The spray-dryer incorporates an integrated cyclone separator positioned at the outlet of the drying chamber. The transparent glass assembly of the instrument provides visual access to the spray-drying process, facilitating real-time monitoring and adjustments during operation. A labeled view of the entire experimental setup, including the attached SOPAT imaging probe, is illustrated in Figure 2.

2.3. Conducted Spray-Drying Experiments

Using the materials and setup described above, a series of spray-drying experiments was performed to systematically study the effect of feed rate and binder concentration. Four experiments were conducted with varying feed rates (referred to as “F series”) while the binder concentration was kept constant at 0.8 wt% (PVP-30) and all other operating parameters were fixed (as listed in Table 1). These experimental cases were labeled as F1B2, F2B2, F3B2, and F4B2, corresponding to feed flow rates of 11, 14, 17, and 20 mL min−1, respectively. In each experimental case, the atomization pressure (5 bar), spray gas flow (742 L h−1), inlet temperature (220 °C), and drying gas flow (35 m3 h−1) were held constant. By comparing the experimental cases of the F series, the isolated impact of an increasing feed rate on the product properties can be observed.
Next, to examine the influence of binder concentration, three additional experiments were carried out at the lowest feed rate (11 mL min−1) while the PVP-30 concentration was varied (referred to as “B series”). These cases were labeled as F1B1, F1B3, and F1B4, which used 0.4 wt%, 1.6 wt%, and 3.2 wt% PVP-30, respectively. All other process parameters in F1B1, F1B3, and F1B4 were identical to the process parameters of the F series experimental cases (see Table 1), such that the effect of the binder fraction on the product properties could be isolated.
Each experimental case was performed with a fresh batch of liquid feed and run until enough product was collected for analysis (several grams of dried powder). The inline SOPAT imaging was conducted during each spray run to capture images of the granules under steady-state operating conditions (after drying), and samples of the powder were later taken for porosity measurements.

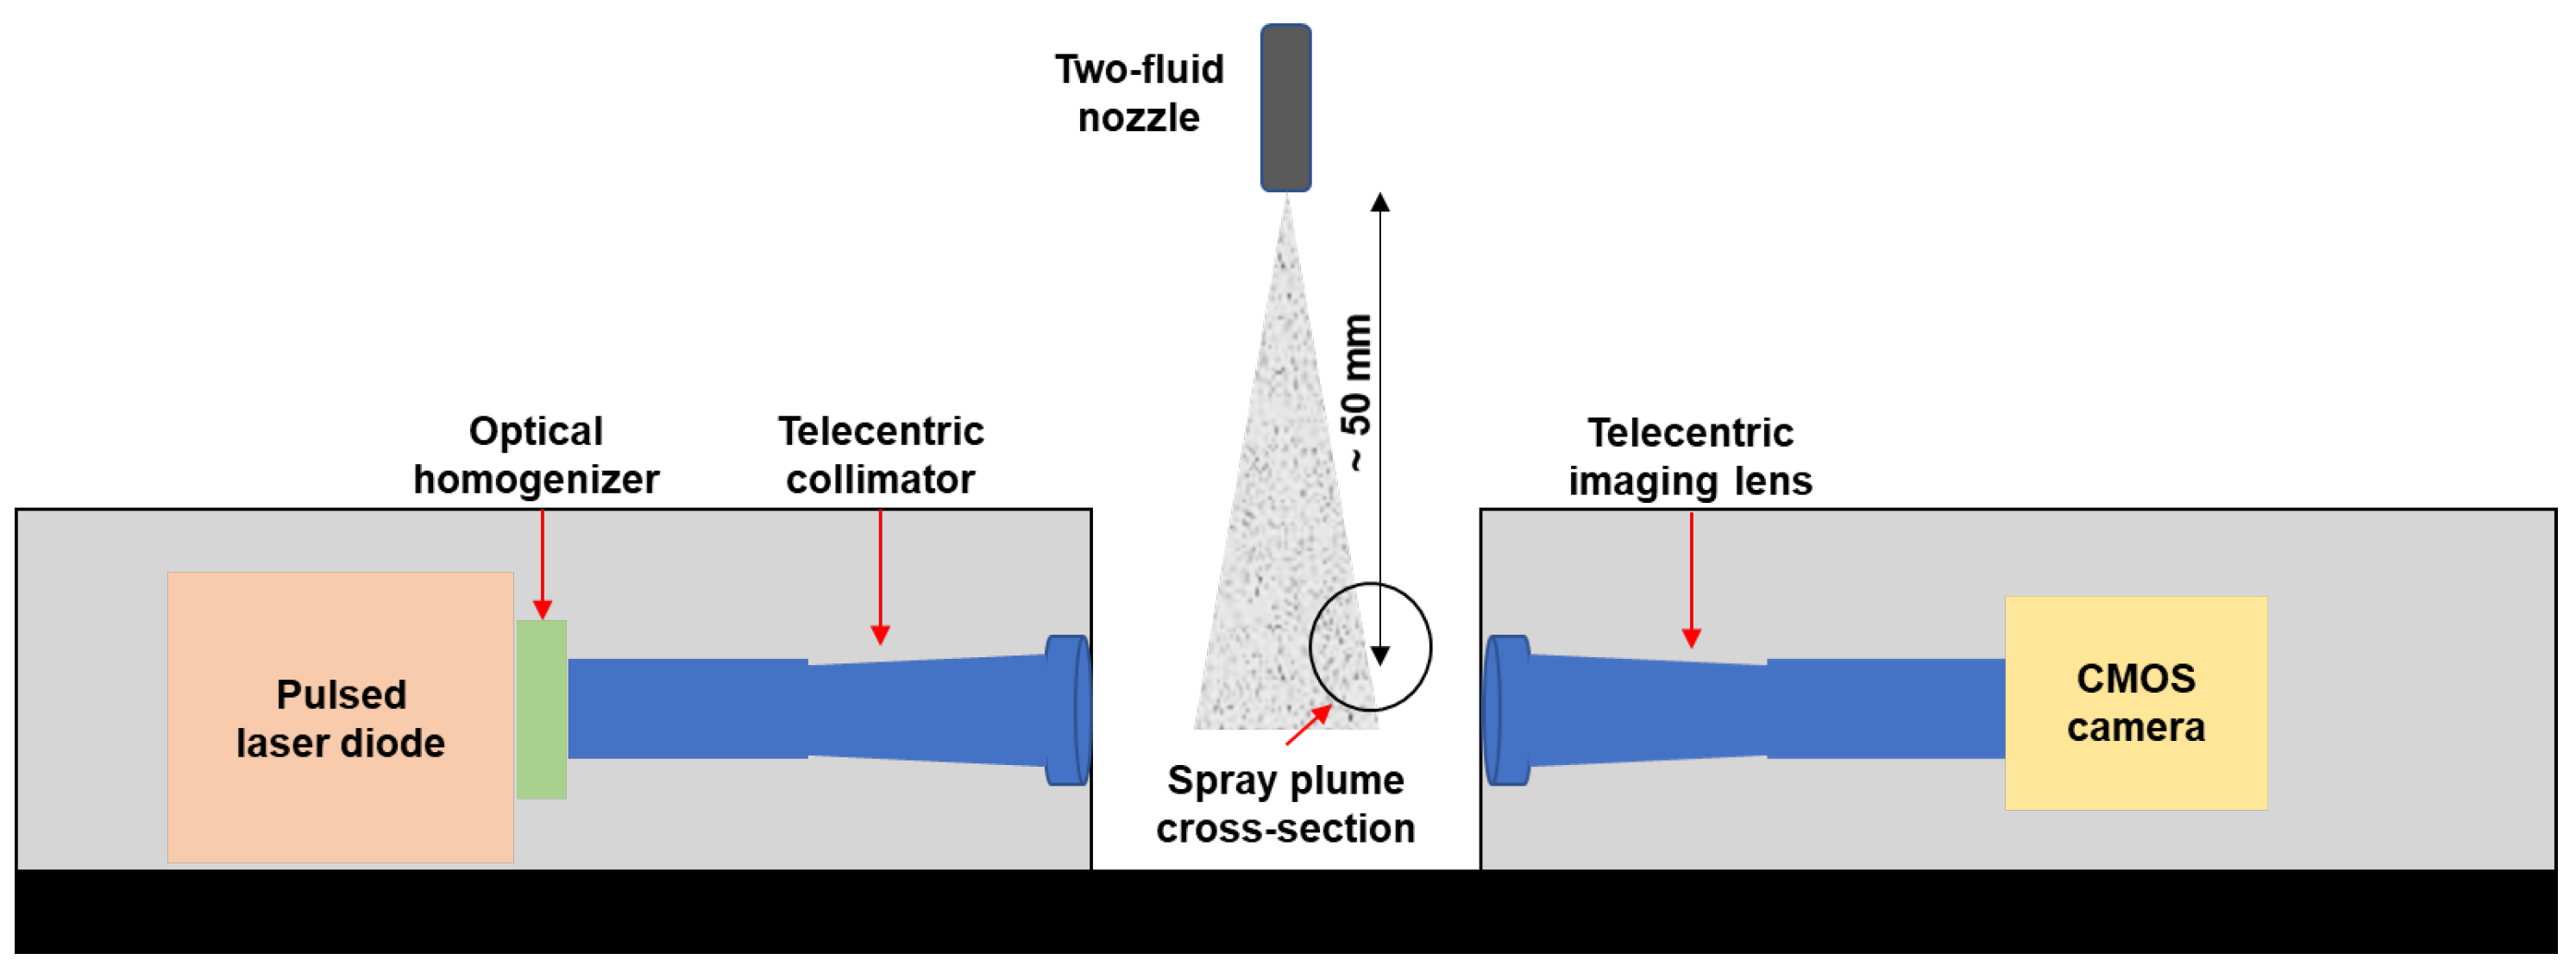
2.4. Offline Droplet Imaging Setup

To link spray-drying conditions to product formation, it is essential to first understand how the liquid feed breaks up into droplets under varying feed rates and binder concentrations. An optical spray characterization system, HiWatch HR2, (Oseir Ltd., Tampere, Finland) was employed and operated independently of the B-290 dryer, on a separate setup, to replicate atomization conditions and collect detailed droplet size and velocity distributions.
The HiWatch HR2 uses backlight illumination and a high-speed camera with particle-tracking velocimetry (PTV). A multi-pulse laser, fired during a single camera exposure, produces multiple faint “shadow” images of each moving droplet. Each droplet thus appears as a series of three closely spaced silhouettes—termed a shadowing triplet—corresponding to successive laser pulses. By detecting these triplets, the system simultaneously determines droplet velocity (from spacing) and size (from silhouette diameter) [49], using a method known as sizing PTV (S-PTV).
A schematic of the HiWatch optical setup is shown in Figure 3. The system can size droplets as small as 5 μ m in diameter. During measurements, the laser emitted three pulses spaced 25 n s apart, forming the shadow triplets used for velocity calculation. Pulse frequency and camera exposure were tuned to capture droplets at the expected velocity range. Each measurement lasted 120 s to 240 s , depending on when a sufficient number of droplet images was acquired. All measurements were performed 50 m m below the nozzle.
Raw HiWatch images were processed using manufacturer-provided software to obtain quantitative data. Pre-processing eliminated background noise—e.g., static reflections—followed by triplet detection, depending on consistent spacing and morphology. Using morphological operations and autocorrelation analysis, ambiguous or overlapping signals were filtered out, therefore guaranteeing that only valid droplet data remained. The outcome was a collection of droplet velocities and diameters for every test condition.
Gaussian kernel density estimation (KDE), a non-parametric technique for estimating probability density functions (PDFs), was used to describe the droplet size and velocity distributions [50]. These PDFs were then integrated to produce cumulative distribution functions (CDFs). The resulting distributions (see Section 3.1) directed the interpretation of granule formation in Section 3.2.
There are, nevertheless, reasonable measuring limits. High feed rates or binder concentrations cause the spray to become too dense for consistent HiWatch measurements. High number density and spray turbulence produce overlapping droplet pictures that impair S-PTV’s capacity to identify single droplets. Increasing the distance between the measurement zone and nozzle, therefore concentrating on the spray edge where droplet density is lower, is one way to reduce this. The spray cone cross-section expands with distance from the nozzle; therefore, the HiWatch’s maximum horizontal field of view of 8 m m limits how far below the nozzle measurements can be taken. These limitations show the intricate interplay of feed rate and liquid characteristics in two-fluid nozzle atomization. Measurements are made more challenging in dense sprays through droplet interactions, coalescence, and trajectory disturbances.

2.5. Inline Granule Imaging Setup

An inline imaging probe “SOPAT PL” (SOPAT GmbH, Berlin, Germany) was utilized to monitor the dried granules produced during spray-drying. This system comprises an immersible shaft with a diameter of 12 m m . The shaft was was inserted directly into the collection vessel located beneath the cyclone (Figure 2) in order to acquire images of the granules after the drying process. The camera tip is fitted with a sapphire lens to ensure mechanical and chemical resistance to the abrasive alumina nanoparticles. A rhodium reflector, positioned at a controllable distance of 1000 μ m from the lens, is used in conjunction with the integrated strobe light to provide uniform and controlled illumination. Optimal image quality was obtained with the reflector placed in close proximity to the lens; however, for certain material systems, a larger reflector–lens distance is necessary to reduce occlusion from granules and to accommodate larger particles. In this study, a reflector–lens distance of approximately 1 m m was employed.
The probe is equipped with a microscopic optical system that offers a diagonal field of view of 800 μ m , enabling the resolution of granules in the approximate size range of 2 μ m to 300 μ m . Accordingly, the SOPAT camera primarily captures dried agglomerated granules, as the individual primary alumina nanoparticles fall below the resolution limit.
The imaging parameters are summarized in Table 2. The camera recorded 8-bit monochrome images with a resolution of 2464 × 2056 pixels. A calibrated spatial conversion factor of 0.2464   μ m /pixel was applied to convert pixel dimensions into real physical measurements. To ensure statistical significance in the granule size distribution at each time point, 100 images were acquired per measurement condition at a fixed frame rate of 20 Hz . This frame rate was selected based on the estimated velocity of the granules to minimize the likelihood of capturing the same granule in consecutive frames, which could otherwise lead to biased statistical evaluations. The optical focus was adjusted to approximately 100 μ m in front of the probe lens to optimize image clarity for granules passing through the focal plane. The image series collected from each experimental run was subsequently processed to extract granule size and shape descriptor distributions, as described in Section 2.6.

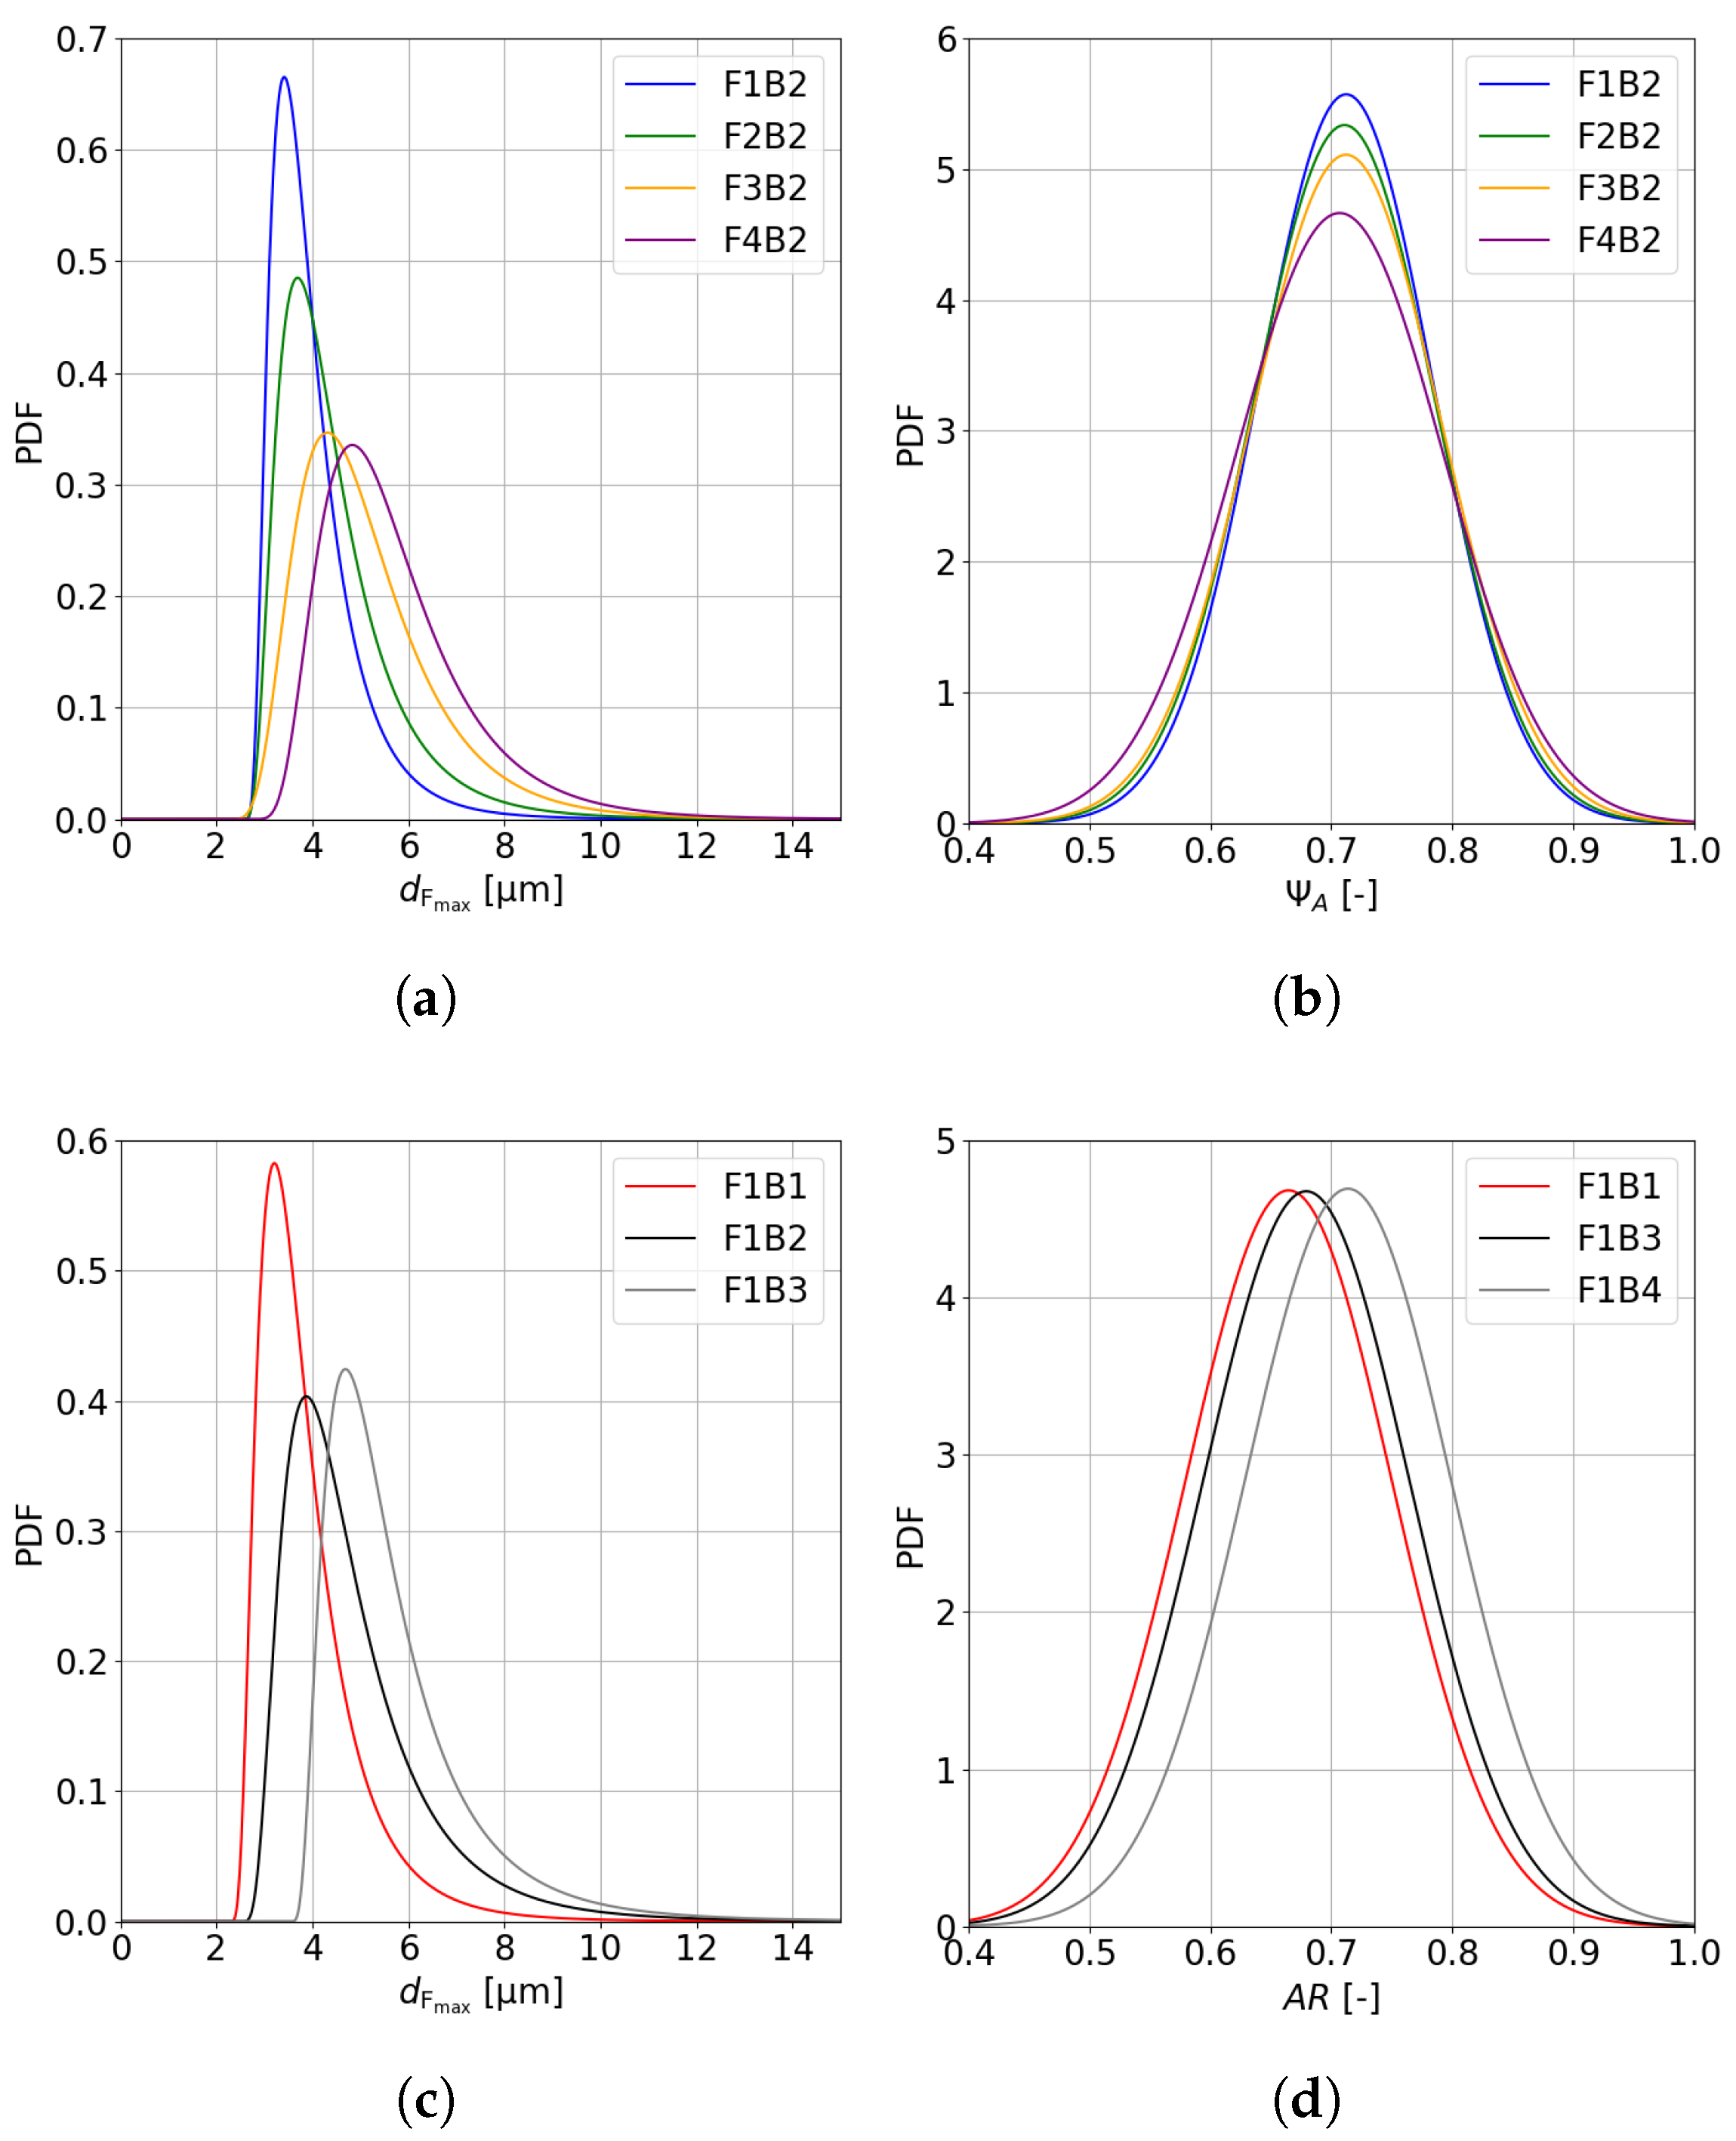
2.6. Size and Shape Descriptors of Granules

To quantitatively characterize the size and shape of the dried granules, two key size and shape descriptors derived from two-dimensional (2D) image analysis of SOPAT images were considered:
  • Maximum Feret diameter ( d F max )—the longest distance between two parallel lines tangential to the 2D silhouette of the granule as observed in the imaging plane. It provides an estimate of the granule’s largest dimension in the image plane. Formally, it is defined as
    d F max = max θ [ 0 , π ) d F ( θ ) ,
    where d F ( θ ) > 0 represents the distance between two distinct parallel lines at an angle θ to the x-axis that are tangents of the granule’s 2D silhouette.
  • Aspect ratio ( Ψ A )—the aspect ratio is defined as the ratio of the minimum Feret diameter to the maximum Feret diameter ( d F max ) of the granule, where the minimum Feret diameter d F m i n is given via Equation (1), by substituting max θ [ 0 , π ) with min θ [ 0 , π ) . Then, the aspect ratio, Ψ A , is given by
    Ψ A = d F m i n d F m a x .
    Note that the aspect ratio is a dimensionless number between 0 and 1 that indicates the compactness or elongation. An aspect ratio of 1 indicates a compact shape (equal length and width), whereas values significantly less than 1 indicate an elongated 2D silhouette. The real minimum Feret diameter was used instead of the Feret diameter perpendicular to d F max to ensure robustness and orientation-independent calculations of the granule shape.
A schematic representation of the minimum and maximum Feret diameters is shown in Figure 4 for an irregularly shaped solid. These two descriptors ( d F max and Ψ A ) together provide a simple but effective characterization of the granule’s morphology. In subsequent analysis, they will be used to compare the effects of different process parameters (feed rate and binder concentration) on the size distribution and shape uniformity of the granules.

2.7. Parametric Modeling and Prediction of Descriptor Distributions

Parametric modeling is employed to allow for the straightforward and easy comparison of granule descriptor distributions measured for different experimental cases. For that, let A 1 , , A n R , n > 1 be the (finite) data sets of granule descriptors measured in processes with parameters z 1 , , z n R . By considering a parametric family of probability densities, { f θ , θ Θ } , and fitting densities f θ 1 , , f θ n : R [ 0 , ) to these data sets, a low-dimensional representation of the data sets in terms of the model parameters, θ 1 , , θ n Θ R m , for some integer, m 1 , was achieved. This low-parametric representation offers several advantages over non-parametric techniques, such as KDEs, which are simple to implement and do not require any assumption on the data. However, parametric modeling provides some key advantageous, such as interpretability, dimensionality reduction, and computational efficiency. These benefits are especially important in applications like inline process monitoring. By determining a functional relationship between the process parameters, z 1 , , z n R , and the model parameters, θ 1 , , θ n Θ , by means of regression, model parameters and, thus, descriptor distributions can be predicted for not-yet-conducted experiments.
For a given family of parametric probability densities, { f θ , θ Θ } , the optimal parameters, θ 1 * , , θ n * , associated with the process parameters z 1 , , z n can be determined by means of maximum likelihood estimation [51]. Therefore, the likelihood function L : Θ n R was considered, which is given by
L ( θ 1 , , θ n ) = i = 1 n x A i f θ i ( x ) ,
for any θ 1 , , θ n Θ . Then, the optimal parameter values, θ 1 * , , θ n * Θ , can be determined by maximizing the likelihood function considered in Equation (3), L , i.e.,
( θ 1 * , , θ n * ) = argmax ( θ 1 , , θ n ) Θ n L ( θ 1 , , θ n ) .
When considering more than one parametric family of probability densities, the family leading to the best fit can be identified by choosing the family that yields the largest likelihood value, L ( θ 1 * , , θ n * ) , i.e., the family for which the value of max ( θ 1 , , θ n ) Θ n L ( θ 1 , , θ n ) is highest.
To predict the probability density of the descriptor under consideration for a process with process parameter z for which no data were acquired yet, a parametric regression function, g : R Θ , was utilized; it maps the process parameter z R to a model parameter, θ = g ( z ) Θ , of the desired probability density, f g ( z ) . In the present paper, a linear regression function, g, is considered and given by
g ( z ) = a · z + b ,
for each z R , where a , b R m are parameters that have to be fitted to data. More precisely, optimal parameter values, a * , b * R m , are determined by means of a mean-squared error-based regression between z 1 , , z n and θ 1 * , , θ n * , i.e.,
( a * , b * ) = argmin a , b R m 1 n i = 1 n ( g ( z i ) θ i * ) 2 .

3. Results

In the following, the experimental results obtained for the process parameters outlined in Section 2.3 are presented. The findings are organized as follows: First, the droplet characteristics are examined (Section 3.1), and then the distributions of size and shape descriptors for dried granules are analyzed (Section 3.2), including the statistical modeling of the distributions. This is followed by a discussion of qualitative observations from SEM imaging (Section 3.3) and, finally, a quantitative analysis of nanopore volume (Section 3.4).

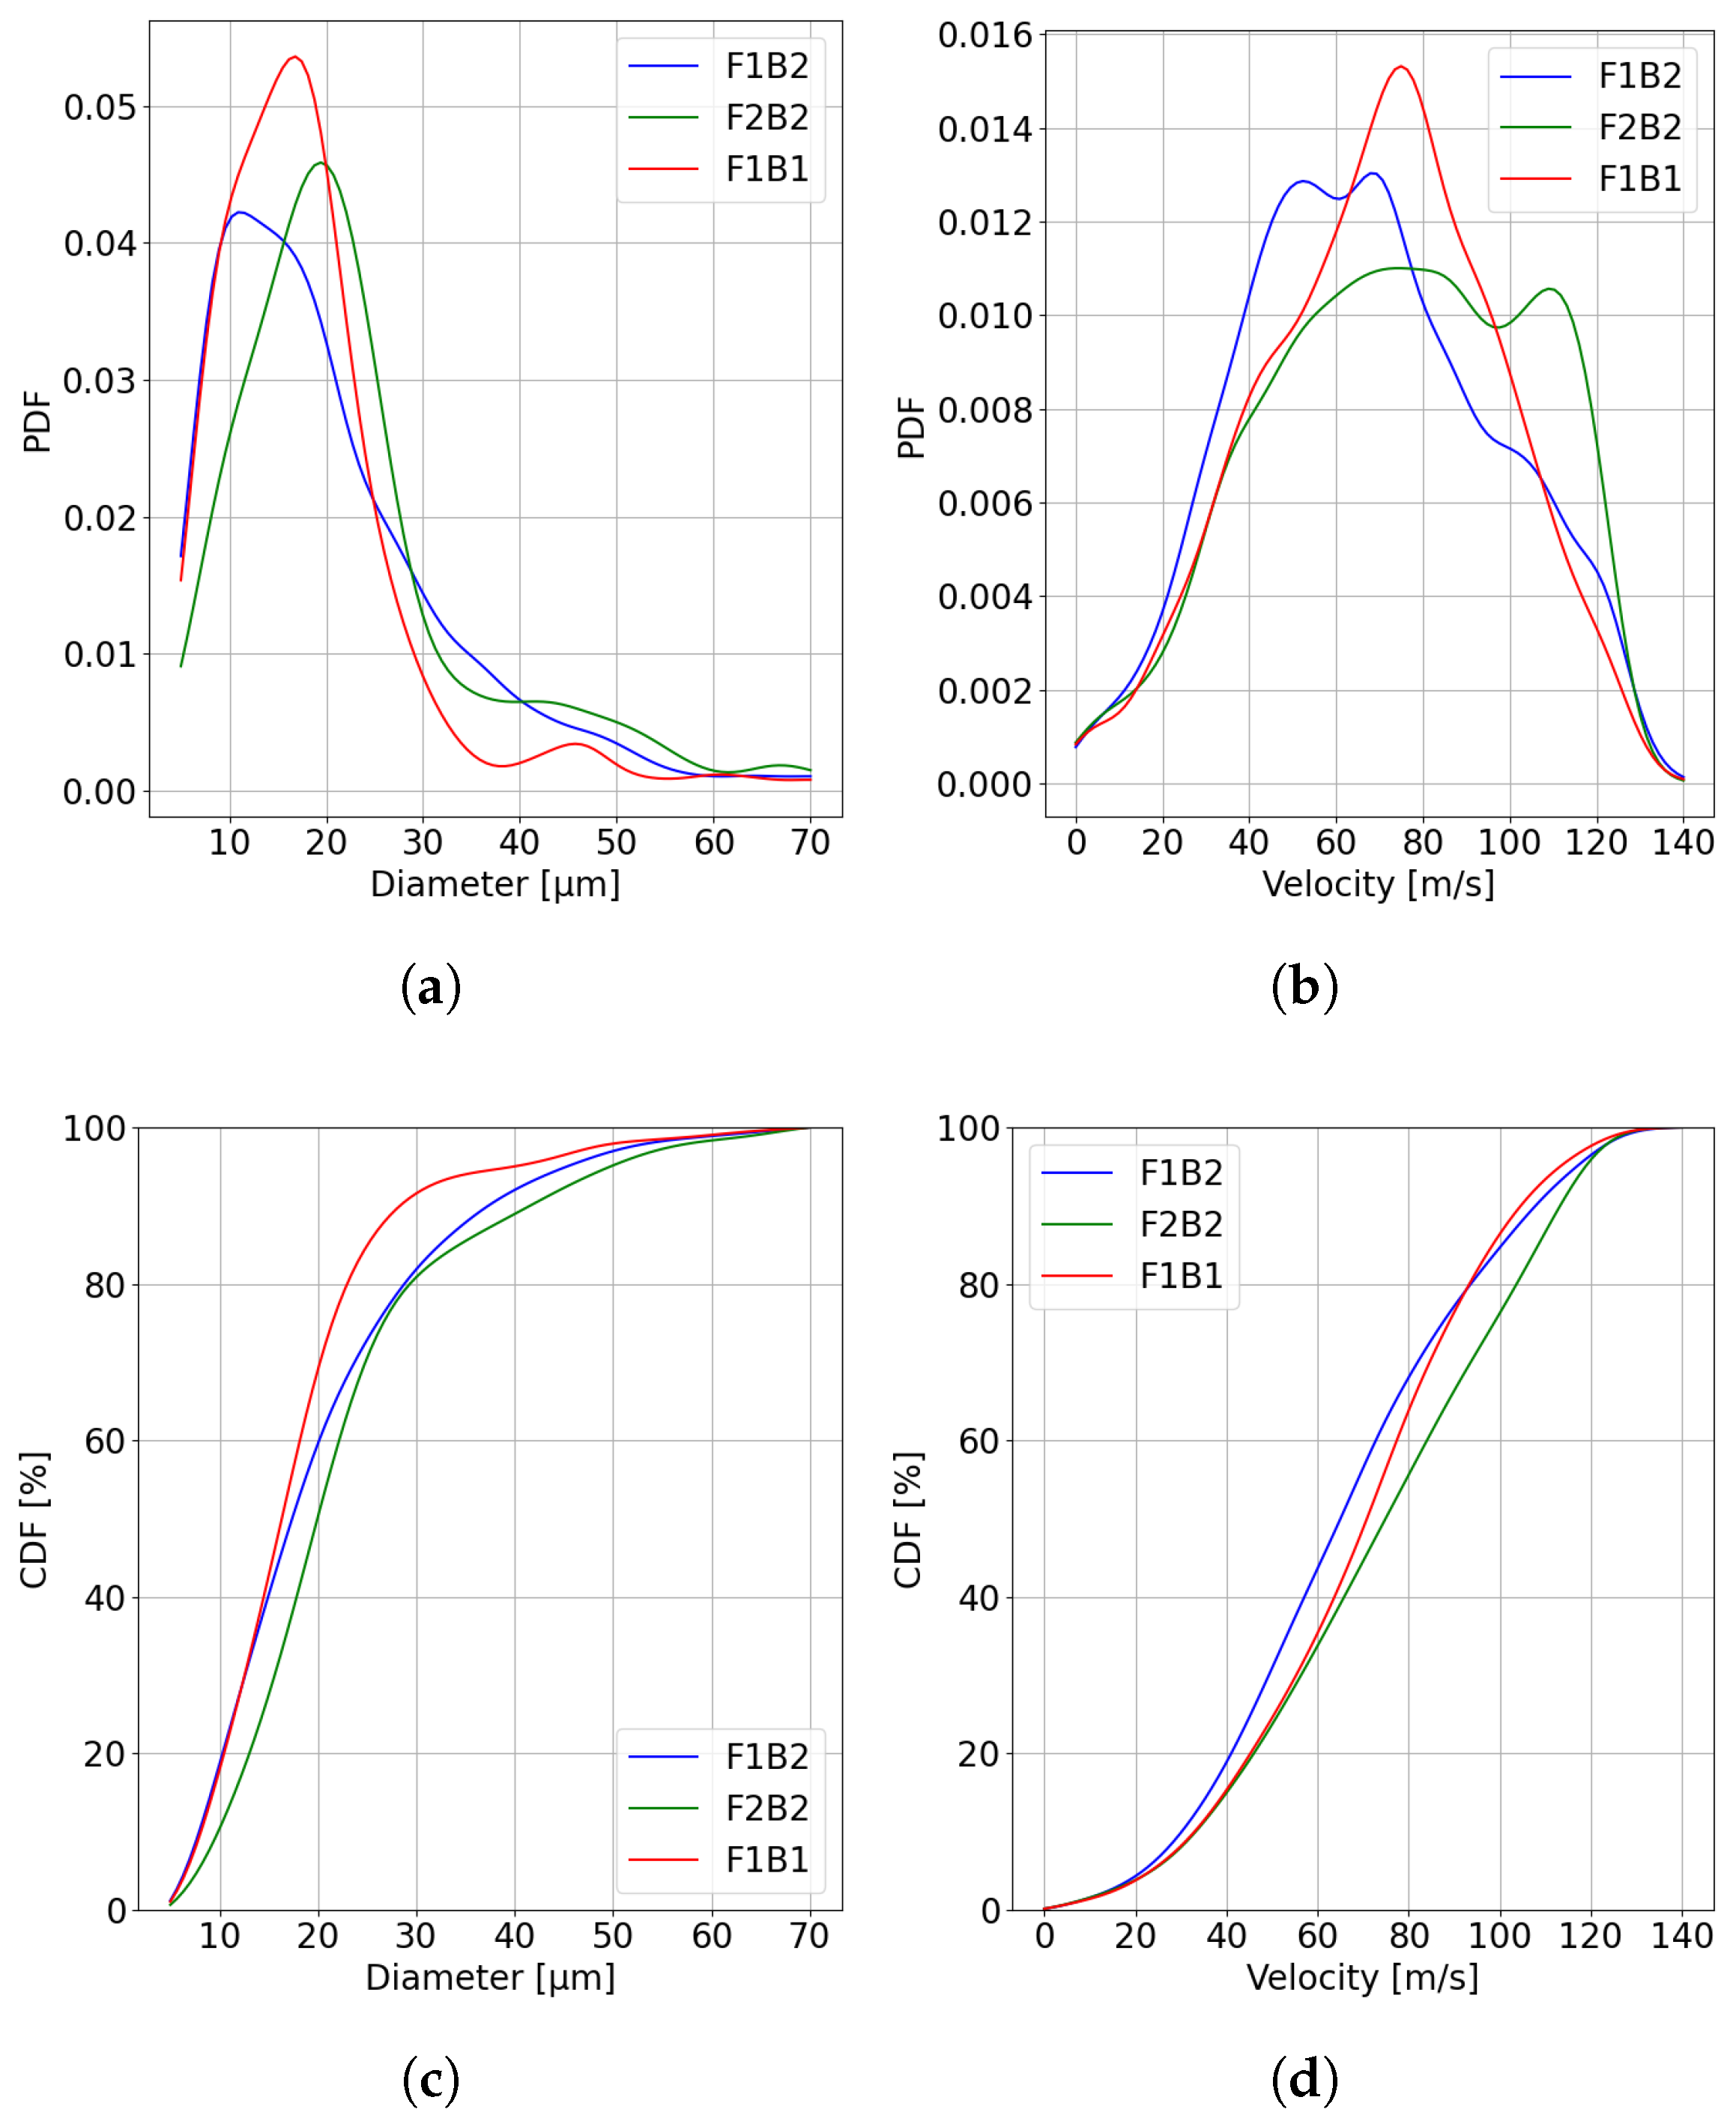
3.1. Droplet Size and Velocity Distributions

To understand the influence of feed rate and binder concentration on the atomization process, the size and velocity distributions of the droplets produced via the two-fluid nozzle under different values of the concerned process parameters were analyzed. Using the HiWatch S-PTV system, introduced in Section 2.4, droplet data for selected representative experimental cases were obtained: a low feed rate with a low binder (F1B1), a low feed rate with a high binder (F1B2), and a high feed rate with a high binder (F2B2). It was not possible to obtain analyzable data for the other experimental cases with an even higher feed rate or binder concentrations due to the signal overlapping constraint, discussed in Section 2.4. The resulting PDFs and CDFs are plotted in Figure 5 for the size and velocity, respectively.
Droplet size. All three tested cases exhibit unimodal droplet size distribution (Figure 5a). However, there are shifts in the distribution, depending on feed rate and binder concentration. At a constant low feed rate (F1 series), the case with a lower binder concentration (F1B1) produced droplets that are, on average, smaller than those with a higher binder concentration (F1B2). The peak of the probability density of the droplet size for F1B1 (in red) is located at a larger diameter than that of F1B2 (in blue), but F1B1 exhibits a steeper drop-off at larger diameters. Additionally, while F1B2 (0.8 wt% binder) has a more pronounced tail for larger droplets (>25 μ m ), F1B1 (0.4 wt% binder) shows a distribution that is more concentrated around its peak. This trend is confirmed by the cumulative size distribution functions (Figure 5c). The CDF for F1B1 lies to the left of F1B2, indicating that percentiles for the droplet size are smaller for F1B1. For example, the median droplet diameter (50th percentile) is smaller in F1B1 than in F1B2. Thus, reducing the binder concentration (at a low feed rate) tends to yield generally smaller droplets.
Increasing the feed rate while keeping the binder the same has the opposite effect. When comparing F2B2 (in green) (high feed rate, 0.8 wt% binder) to F1B2 (in blue) (low feed rate, 0.8 wt% binder), it can be observed that the droplet size distribution for F2B2 is shifted towards larger diameters. The probability density for F2B2 indicates a large variance with a noticeable tail towards large droplets, and its cumulative distribution function is located to the right of F1B2, indicating a larger median droplet size for the F2B2 case. In the measurements, the median droplet diameter increased under higher feed rates (F2B2) in comparison to lower feed rates (F1B2).
Droplet velocity. The droplet velocity data (Figure 5b,d) show trends associated with both the feed rate and the binder concentration. At a low feed rate (F1), the lower binder case (F1B1) produced notably higher droplet velocities than the higher binder case (F1B2). The probability density of droplet velocity for the F1B1 case is shifted towards larger values compared to F1B2, and the corresponding cumulative distribution function shows that higher velocities are reached for the F1B1 case (its function is to the right of F1B2). This suggests that, for low binder concentrations (and thus for lower viscosities of the liquid and possibly for lower surface tensions), the droplets emerge from the nozzle with a greater speed. When the feed rate is increased (F2B2 vs. F1B2, both at 0.8 wt% binder), an increase in droplet velocity is also seen. The F2B2 condition yields higher velocities on average than F1B2, as evidenced by the probability density of droplet velocity being shifted rightward for the F2B2 case. Moreover, the cumulative distribution functions lies to the right for higher velocities, i.e., in comparison to the F1B2 case. The nearly monotonous trend observed in the cumulative distribution functions of droplet velocities suggests that F2B2 droplets are the fastest, followed by F1B1 and then F1B2. This hierarchy indicates that both a higher feed rate and a lower binder concentration can contribute to higher droplet exit velocities.
These trends observed from the droplet analysis provide valuable insights. They confirm that the feed rate and the binder concentration influence the initial droplet size/velocity, which, in turn, is expected to impact the product, namely the resulting dried granules. The following section examines the actual size and shape descriptor distribution of the dried granules to verify these relationships.

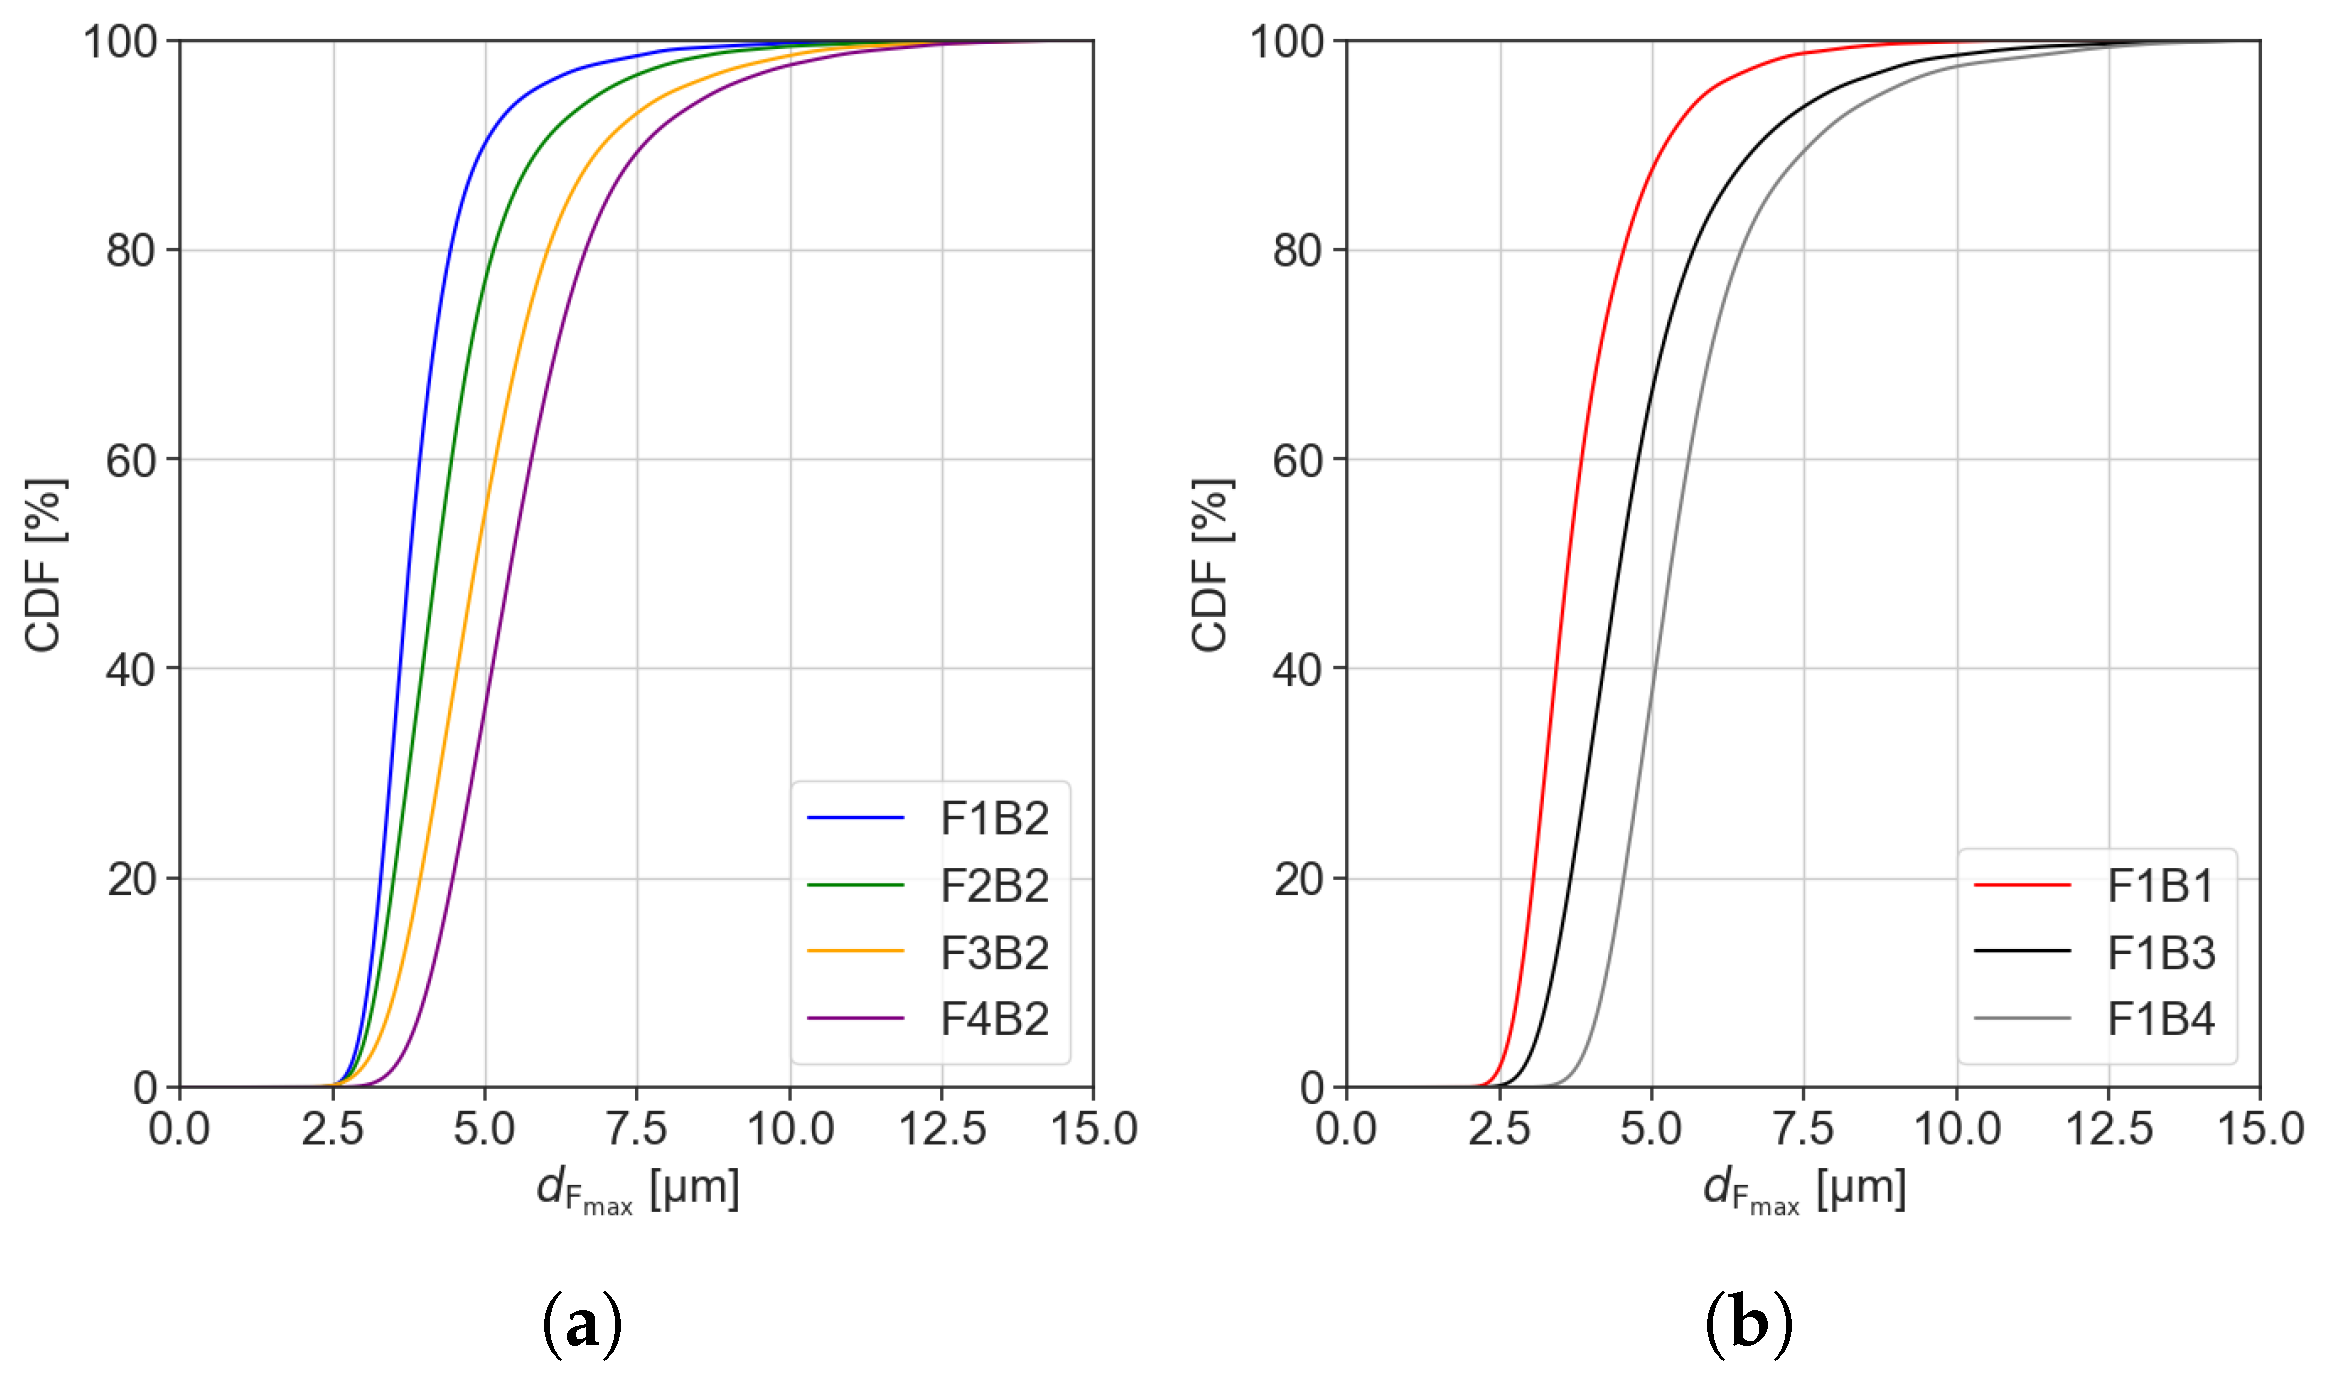
3.2. Granule Size and Shape Distributions

Once the drying process was completed, the resulting granules were examined in terms of size and shape using the descriptors (stated in Section 2.6) derived from inline SOPAT images. Figure 6a shows the number-weighted CDFs of granule size (as represented by d F max ) for the four different feed rates in the F series (all at 0.8 wt% binder concentration). The CDFs were calculated in the same way as the CDFs for the droplet size and velocity, i.e., by integrating the PDFs obtained by applying Gaussian KDE. Figure 6b presents the number-weighted CDFs of the maximum Feret diameter distribution functions for the different experimental cases of the B series.
The characteristic percentile values ( d 10 , 0 , d 50 , 0 and d 90 , 0 ) extracted from these CDFs for both the F series (varying feed rate) and the B series (varying binder concentration) are summarized in Table 3. For the F series, increasing the feed rate leads to a systematic increase in granule size across all three characteristic percentiles. Specifically, the median granule size ( d 50 , 0 ) increases from 3.76   μ m (F1B2) to 5.42   μ m (F4B2), with similar trends observed at the 10th and 90th percentiles. This indicates that higher feed rates consistently shift the granule size distribution toward larger sizes.
Similarly, for the B series, increasing the binder concentration at a constant feed rate also increases the granule size substantially. The median size ( d 50 , 0 ) increased from 3.65   μ m (F1B1) to 5.35   μ m (F1B4). Again, this growth trend is consistently observed at the lower (10th) and upper (90th) percentiles. These results demonstrate that both the feed rate and the binder concentration independently play significant roles in influencing the size distribution of spray-dried granules.
Parametric modeling. The parametric modeling approach from Section 2.7 was applied to model the distributions of the maximum Feret diameter d F max and the aspect ratio Ψ A for both the F series and the B series. Specifically, the optimization procedure stated in Equation (4) was run four times to fit parametric PDFs to the measured maximum Feret diameters across all cases in the F series and the B series. The same procedure was applied to model the distribution of measured aspect ratio Ψ A along the experimental cases of the F series and B series.
As candidates for the parametric families of distributions, the normal, lognormal, beta, gamma, and Student’s t-distributions [52] were considered. The distribution of the maximum Feret diameter d F max was best approximated through lognormal distributions, which are commonly used for particle sizes due to their non-negativity and right-skewness. In contrast, the distribution of the aspect ratio, Ψ A , was best represented by normal distributions. Recall that the probability density, f θ : R [ 0 , ) , of a normal distribution is given by
f θ ( x ) = 1 σ 2 π exp ( x μ ) 2 2 σ 2 ,
for each x R , where θ = ( μ , σ ) R × ( 0 , ) is its two-dimensional parameter vector. Furthermore, the probability density f θ : ( 0 , ) [ 0 , ) of a lognormal distribution is given by
f θ ( x ) = 1 ( x c ) σ 2 π exp ( log ( x c ) μ ) 2 2 σ 2
for x > c , and f θ ( x ) = 0 for x c , where θ = ( μ , c , σ ) R 2 × ( 0 , ) is its three-dimensional parameter vector.
Figure 7 provides a visualization of the fitted normal and lognormal probability densities. The corresponding values of their parameters are shown in Table 4. For the F series, a clear shift in the PDF for d F max toward larger diameters can be seen as the feed rate increases. The variances in the probability distributions of d F max increase with the feed rate, reflecting a less uniform drying of larger droplets and thus a larger range of maximum Feret diameters. In contrast, the fitted probability distributions of Ψ A remain centered around the same mean (≈0.8) for a varying feed rate (F series). A value of 0.8 indicates near-compact shapes for all feed rates, though there is a slight increase in the spread of Ψ A at the highest feed rate. This suggests that, at high feed rates, while most granules are still roughly compact, a few more irregular shapes appear, widening the shape descriptor distribution a bit. When considering variation in binder concentration, an increase in the maximum Feret diameters (see Figure 7c) with an increasing binder concentration (B series) can be observed as well. Interestingly, for the binder variation, the variance in the aspect ratio distribution (see Figure 7d) did not increase–in fact, high binder experimental cases had a similar Ψ A variance as a low binder but a higher mean Ψ A . In other words, a higher binder made all granules a bit more compact uniformly (likely because the polymer content can form smooth coatings), rather than introducing more variability in aspect ratios. This is in contrast to the feed rate effect, where a high feed increased the variability of aspect ratios slightly (perhaps due to some irregular drying outcomes).
Prediction of descriptor distributions. By applying the regression procedure described in Section 2.7 to the F series and B series, the probability densities of descriptors for process parameters can be predicted, for which no measurements have been conducted yet. For both series and both considered granule descriptors d F max and Ψ A , the regression function g (see Equations (5) and (6)) is fitted to capture the relationship between the process parameters z (the feed rate in the F series and the binder concentration in the B series) and the model parameters θ of the corresponding probability densities of the conducted experiments. The resulting fit of the linear regressions can be observed in Figure 8 and Table 5. A high degree of agreement between the fitted regression lines and the model parameters can be observed.
With the fitted regression functions, the distribution of d F max and Ψ A for intermediate feed rates or binder concentrations can be predicted, and they are not experimentally measured. More precisely, the regression function fitted to the data set belonging to the F series can be utilized to predict the model parameters of the distribution of d F max and Ψ A for processes with an arbitrary feed rate in z [ 11 , 20 ] and a fixed binder concentration of 0.8 wt%, whereas the regression functions fit to the B series can be utilized to predict the model parameters of the distribution of d F max and Ψ A for arbitrary concentrations z [ 0.8 , 3.2 ] and a fixed feed rate of 11 mL min−1. By inserting the predicted model parameters θ = g ( z ) into Equations (7) and (8), predictions for the probability densities of granule descriptors were acquired, for which possibly no measurements had been conducted yet.
Before showing exemplary resulting predicted probability densities, the linear correlation between the granule descriptors d F max and Ψ A was examined. To quantify this, the empirical Pearson correlation coefficients (EPCC) were considered, and they were given by
EPCC ( x , y ) = i = 1 n ( x i x ¯ ) ( y i y ¯ ) i = 1 n ( x i x ¯ ) 2 i = 1 n ( y i y ¯ ) 2 ,
where x ¯ and y ¯ are the means of the x i and y i values, respectively. In this case, x i and y i represent the maximum Feret diameter and aspect ratio of the i-th granule, respectively, from the SOPAT images. For the experiments F1B2, F2B2, F3B2, F1B1, F1B3, and F1B4, the EPCC had values close to 0 (EPCC < 0.02), indicating little to no linear correlation between the two descriptors. The observed near-zero EPCC values suggest that the size of the granules, as measured using d F max , provides little information about their shape, as measured with Ψ A , and thus, for simplicity, any modeling of their dependency will be neglected.
Figure 9 shows the joint predicted probability densities for the maximum Feret diameter and aspect ratio, which are assumed to be independent random variables, for process parameters where no experimental data have been collected yet. In particular, in Figure 9 (middle column), these probability densities are shown for a feed rate of 12.5 mL min−1 and a binder concentration of 0.8 wt% (top row), as well as a feed rate of 11 mL min−1 and a binder concentration of 2.4 wt% (bottom row). Furthermore, Figure 9 shows the fitted densities for the experiments F1B2, F2B2, F1B3, and F1B4, along with their respective measured granule descriptors. Note that the assumption of independence of maximum Feret diameter and aspect ratio coincides visually well with the shown scatter points. Recall that the process parameters of these processes are shown in Table 1. The figure shows a high agreement of the fitted parametric probability densities with the displayed measured granule descriptors. Furthermore, in Figure 9, in both rows, a clear and desired shift in the location and variance of the distributions can be observed from left to right.
In summary, it is observed that the feed rate (mass flow rate of the suspension in the nozzle) strongly controls the maximum Feret diameter distribution of granules (with higher feed rates yielding higher expected values and variances), while the binder concentration (concentration of PVP-30) influences both the size and shape of the granules. In the following section, the inner structure of the granules using SEM will be observed.

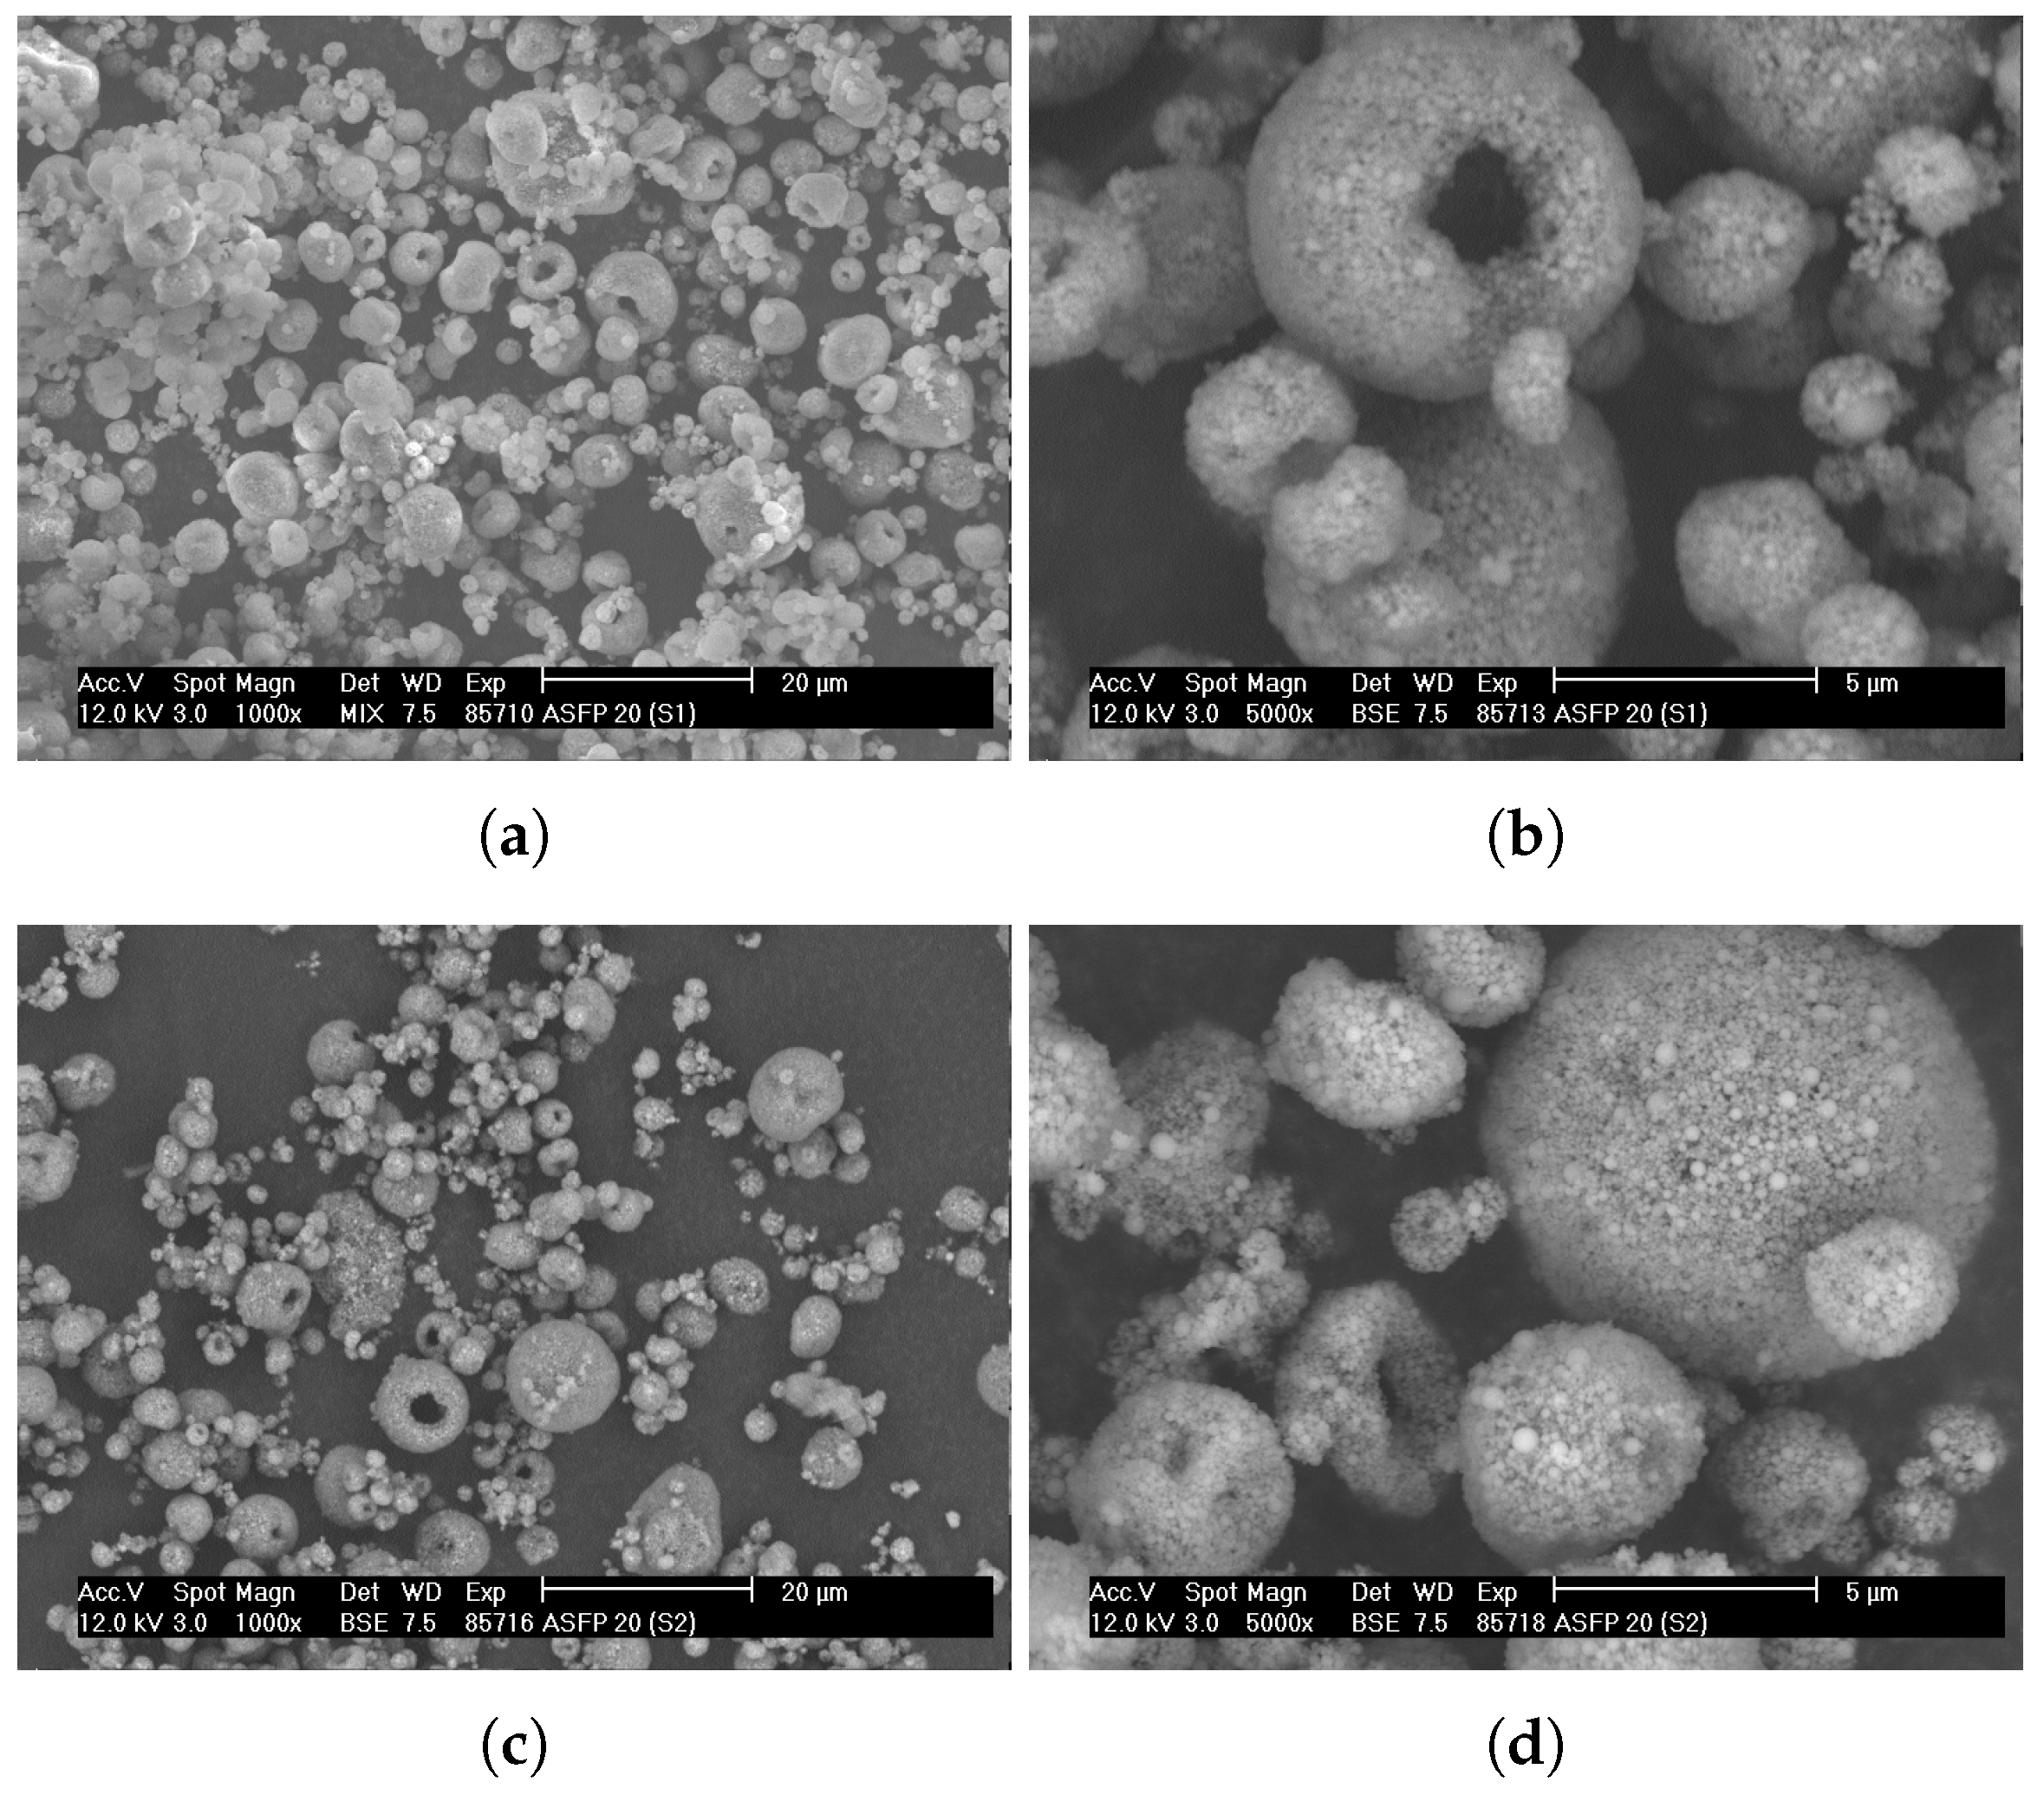
3.3. SEM Imaging of Dried Granules

To complement the inline optical measurements, the dried granules were examined using offline high-resolution SEM, which provides direct visual evidence of granule morphology and can reveal internal structural features (like hollow cores or pores) from broken granules. Figure 10 shows SEM images of granules produced in two experimental cases: F1B2 (low feed rate, 0.8 wt% binder) and F2B2 (high feed rate, 0.8 wt% binder), each imaged at two different magnifications.
The SEM images confirm that the spray-drying process produced composite granules consisting of alumina nanoparticles dispersed in a PVP-30 matrix. The granules exhibit a variety of morphologies, predominantly spherical or near-spherical shapes, along with notable instances of doughnut-shaped granules and granules containing visible hollow cavities or surface depressions. In the lower-magnification views, F1B2 and F2B2 both show mostly individual spherical granules of a few microns in size.
At higher magnification, differences become apparent. Many granules have a donut-like morphology (ring-shaped or with a central pit). A fractured granule also reveals internal cracks and pores, indicating a porous interior structure. These features likely result from the interplay between rapid solvent evaporation at the granule surface, which forms a solid shell, and slower internal solvent migration. This mismatch generates internal stresses, particle rearrangements, and pore formation during the final drying stages, as discussed further in Section 4.4 below. Some granules, by contrast, exhibit relatively smooth surfaces and appear more solid. These observations collectively demonstrate the morphological variations ranging from uniformly dense to hollow and cracked porous structures, motivating a quantitative analysis of granule pore volume and pore size using mercury intrusion porosimetry, as discussed in the following section.

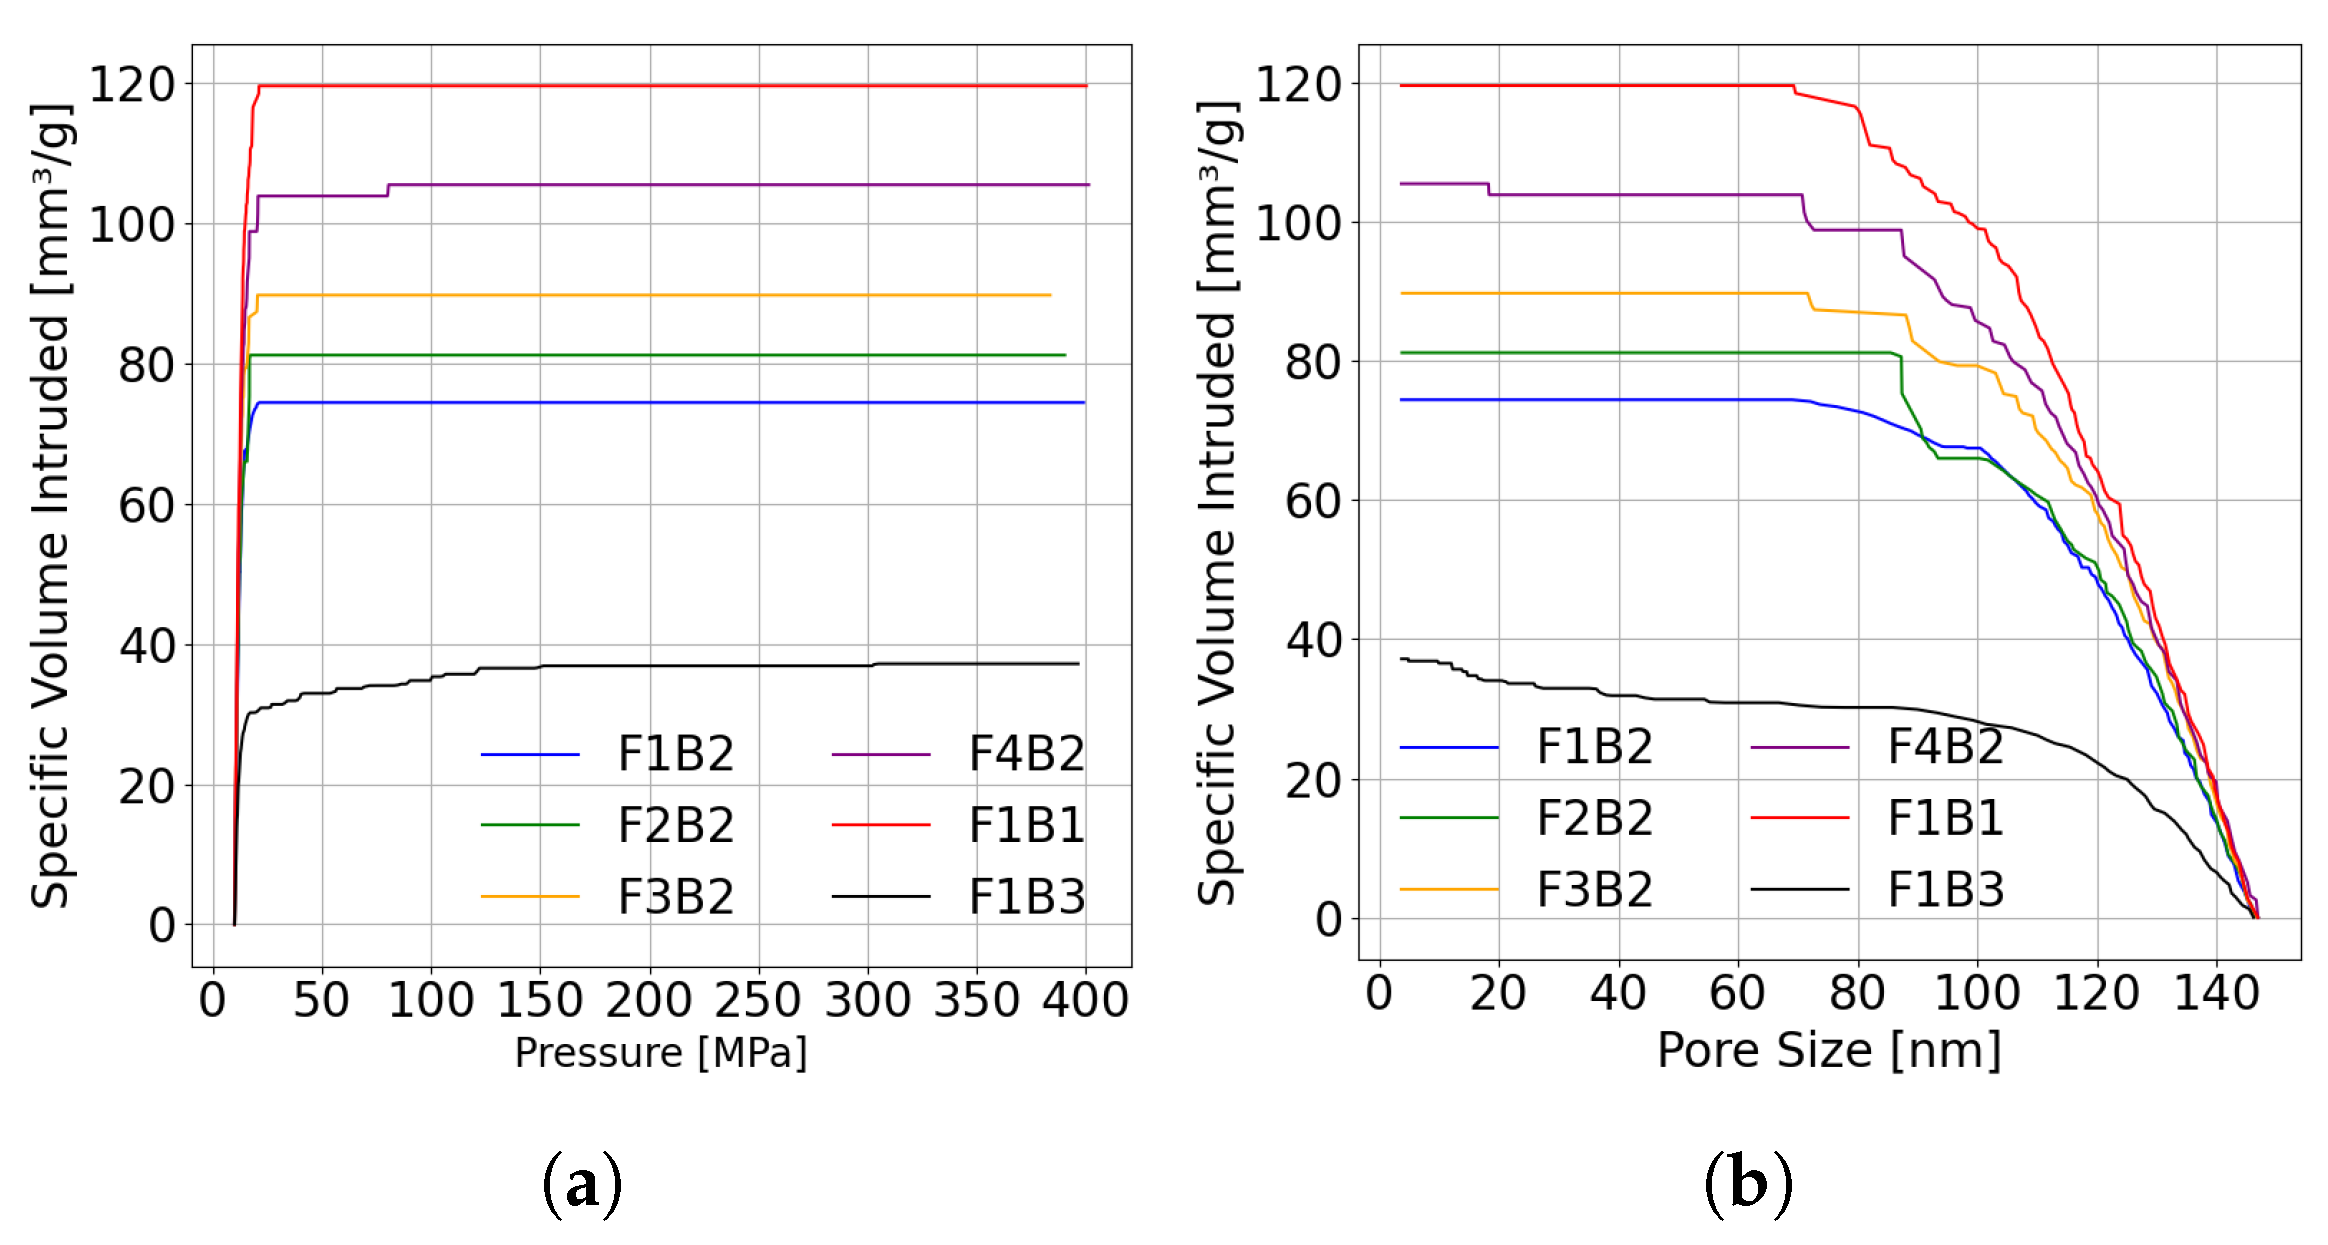
3.4. Granule Porosity Analysis

The volume of pore space was measured using the PASCAL 440 (Thermo Fisher Scientific GmbH) mercury porosimeter for selected experimental cases to investigate how the feed rate and the binder concentration affect pore structures. Measurements focused on samples produced at different feed rates under a constant binder concentration (F1B2–F4B2) and on samples with varying binder concentrations (F1B1, F1B2, and F1B3). For each measurement, a sample with a certain mass of the dried granules ( m s a m p l e ) was taken, and mercury was pressed into the sample. The sample was first subjected to an intrusion cycle from atmospheric pressure (101,325 Pa ≈ 0.1   M Pa ) up to 100 M Pa . As the pressure increases, more mercury is forced into the pore space of the sample. The instrument sums up how much mercury has been intruded ( V i n t r u d e d ) at each pressure step, giving a total intruded volume for each pressure. After reaching 100 M Pa , the pressure was released to 10 M Pa . A second intrusion cycle then increased the pressure from 10 M Pa to 400 M Pa .
The mesopores and macropores (in the range of 10–150 n m ) within the granules are of particular interest. By assuming that the pores behave like cylindrical capillaries, pore sizes corresponding to given pressures can be computed by means of the Young-Laplace equation [53], which is given by
r P = 2 γ cos θ P ,
where r p is the pore radius corresponding to the applied pressure P, γ (=480 n N   m −1) is the surface tension of mercury, and θ (=140°) is the wetting angle.
To focus on the mesopores and macropores within the granules, only the specific volume intruded during the second intrusion cycle is analyzed. This is achieved by subtracting for each experiment the specific volume already intruded after the first intrusion–extrusion cycle (see Figure 11a). It can be observed that, for higher feed rates, the specific volume intruded is higher, meaning that the total specific volume of the mesopores and macropores is higher. Moreover, reducing the binder concentration leads to a higher total specific volume of mesopores and macropores.
In Figure 11b, the data from Figure 11a are replotted with pore size on the x-axis, calculated using Equation (10), to explicitly show the specific mercury intrusion volumes as a function of the pore size. The steep initial rise in the intruded mercury volume observed at low pressures (corresponding to larger pore sizes) occurs because the larger pores are filled rapidly at relatively low pressures. As mercury intrusion progresses, fewer and smaller pores remain accessible, requiring significantly higher pressures to intrude mercury into these smaller pore structures and thus explaining the subsequent plateau at higher pressures. Recall that increasing the feed rate and decreasing the binder concentration yields granules with higher specific mercury-intruded pore volumes. In Figure 11b, it can be observed that these differences are primarily attributed to pores in the size range from 80 nm to 140 nm. In contrast, no significant differences are observed for pores with sizes less than 80 nm.

4. Discussion

4.1. Influence of Process Parameters on Droplet Characteristics

The spray-drying experiments demonstrated the critical influence of feed rate and binder concentration on the initial droplet characteristics, notably size and velocity distributions. Reduced binder concentration at a constant low feed rate resulted in smaller and faster droplets, a phenomenon consistent with fundamental fluid mechanics. Lower viscosity liquids facilitate an easier breakup into finer droplets due to decreased resistance during atomization, subsequently accelerating more readily in the airflow. Conversely, higher feed rates at constant binder concentration yielded larger droplets with increased velocities, reflecting enhanced momentum flux from the nozzle. Such conditions require more energy for atomization and, therefore, produce larger initial droplets. Understanding these initial droplet dynamics is crucial, as they directly influence subsequent drying mechanisms and ultimately determine the final properties of the granules.

4.2. Impact of Droplet Characteristics on Granule Morphology

The initial droplet characteristics influenced the resultant granule size and morphology. Higher feed rates consistently led to larger maximum Feret diameters in dried granules, a direct consequence of larger initial droplets entraining more solid material. Binder concentration, however, influenced granule morphology differently. At low binder concentrations, granules exhibited moderate size increases, primarily due to granule stabilization, rather than extensive bridging. Conversely, higher binder concentrations increased granule sizes through an enhanced polymer bridging of alumina nanoparticles into larger, coherent structures during the drying stage.

4.3. Parametric Modeling and Process Optimization

Parametric modeling was utilized to quantitatively describe granule descriptor distributions using regression functions, linking process parameters to probability distribution parameters. These functions not only enable predictions of granule characteristics under untested intermediate conditions but also provide a systematic approach to process optimization. Specifically, given a desired distribution of maximum Feret diameters and aspect ratios, it is possible to identify optimal spray-drying parameters by minimizing the discrepancy between predicted and target distributions.
Given the primary objective of this study—to present initial insights into the relationships between process parameters, granule morphology, and size—the modeling analysis was intentionally limited to qualitative visual assessments. A formal statistical validation of these predictive models was not conducted, as this would involve complex interpretations of parameter sensitivity and advanced statistical metrics. A rigorous validation of these predictive models using formal statistical approaches will be an essential future step, employing appropriate metrics for enhanced model accuracy and interpretability.
Although a negligible linear correlation between the maximum Feret diameters and aspect ratios justified the use of independent marginal distributions, the regression approach is sufficiently general to accommodate more complex multivariate descriptor vectors. Future investigations may beneficially integrate additional descriptors such as internal porosity or surface roughness. Advanced multivariate statistical tools, such as copulas [54], could manage the interdependencies among these descriptors effectively, enabling a more comprehensive understanding and control over granule quality.
The presented regression framework also allows for simultaneous exploration of multiple process parameters and their interactive effects. However, expanding the parameter space dimensionality necessitates significantly larger datasets to robustly calibrate multivariate regression functions. Consequently, future studies would prioritize extensive experimental datasets complemented by sophisticated statistical modeling to explore these higher-dimensional parameter interactions thoroughly.

4.4. Microstructural Insights and Implications

SEM provided detailed insights into granule morphology under varying spray-drying conditions, complementing droplet size and velocity analyses. Granules frequently exhibited donut-like structures and internal voids or cracks, indicative of rapid surface solidification and uneven internal solvent evaporation. Conversely, the granules that demonstrated relatively uniform, dense, and smooth spherical structures were due to more uniform drying.
Donut-like structures resulted from rapid drying; quick outer shell formation impeded uniform solvent escape, generating internal voids [55]. The presence of internal cracks further suggests that drying-induced stresses from solvent evaporation and polymer shrinkage contribute to porosity. Lower feed rates facilitated more uniform drying and reduced such stresses, yielding smoother, solid granules.
These morphological trends were corroborated through mercury intrusion porosimetry. Granules formed at higher feed rates exhibited greater pore volumes, attributed to the formation of larger droplets with rapid shell solidification and retained core liquid, leading to internal cavity inflation [56]. Additionally, lower binder concentrations resulted in higher pore volumes due to reduced polymer bridging between alumina nanoparticles. In contrast, higher binder fractions enhanced granule compaction through stronger cohesive forces, restricting pore growth.
Porous structure formation has also been reported across other spray-dried nanocomposite systems, with comparative underlying mechanisms and microstructural outcomes. In silica–polymer systems, porous granules formed via sacrificial latex templates exhibited macroporosity, driven by polymer coalescence during drying, highlighting the influence of binder softening similar to the role of PVP-30 in granule compaction [57]. Titania nanoparticle granules displayed spherical morphology with minimal fines and retained redispersibility, but hard agglomerates persisted due to incomplete deagglomeration and limited internal restructuring during drying [58], unlike the more deformable alumina–PVP droplets. In zirconia systems, spray-dried granules consisted of dense agglomerates of nanocrystals; milling reduced intragranular porosity and improved sinterability [59], contrasting the pore-forming tendencies observed at high feed rates in alumina. Polymer-based systems with spray-dried cellulose nanocrystals developed wrinkled, doughnut-shaped particles due to rapid shell formation and internal stresses [60], showing similar morphological features and drying-induced porosity, as observed in our spray-dried granules.
Overall, the binder concentration and feed rate were identified as key parameters for tuning granule porosity, with implications for applications such as catalysis or controlled drug release, for which higher porosity may enhance performance.

5. Conclusions and Outlook

This work has presented a detailed investigation into the impact of spray-drying process parameters, namely binder concentration and feed rate, on the total pore volume and morphology of alumina–polymer nanocomposite granules, with the use of both inline and offline characterization techniques. Key observations indicated that an increased feed rate caused larger, more porous granules, possibly through larger droplet formation and less homogeneous drying, which produce cracked or hollow structures. On the contrary, increased binder (PVP-30) content yielded granules larger in size but less porous, with slightly higher aspect ratios, since the polymer matrix facilitates the cohesive compaction of the alumina nanoparticle.
With parametric statistical modeling, predictive relationships among process parameters and descriptors for the granules (maximum Feret diameter and aspect ratio) were determined, and a quantitative framework for design was created for formulations. This modeling is sufficient to allow for untested process condition extrapolation, making way for adaptive and prediction-based process control.
Notably, the pore volume variations observed have significant implications for prospective applications. More porous granules may facilitate increased mass transport and fluid accessibility and provide benefits for various applications. For example, increased porosity can facilitate better ion diffusion in electrochemical systems, provide accelerated and more regulated drug release, enhance diffusion through internal pore systems facilitating increased availability to active sites, and enhance the efficiency of filtration due to increased surface area and pore volume. These hypotheses indicate ways in which structural tuning using control of the process can create application-specific benefits, though direct functional testing continues to be a topic for future research.
The work will be further extended in a number of crucial directions. A custom-designed spray-drying system comprising the inline mixing of solid and polymer and sophisticated monitoring using temperature, pressure, and velocity sensors will be engineered to provide better stability for the feed and allow real-time control of the feed properties. A wider diversity of binders, ranging from varying molecular weights and different functional groups, will be investigated to characterize the impact on the morphology of dried products. In addition, process–structure relationships for other parameters like drying temperature, atomization pressure, and solid concentration will be investigated similarly. Moreover, due to its spatial resolution, it was not possible to visualize the internal pore structure of the granules using micro-computed tomography (CT). Therefore, it is planned to investigate the internal pore structure in detail using nano-CT in the upcoming works, along with surface area measurements using the BET (Brunauer–Emmett–Teller) technique to complement the mercury porosimetry results. Lastly, the modeling framework will be expanded using structural descriptors and multivariate tools like copulas and autoencoders to enable robust, adaptive, closed-loop control-enhancing product consistency and quality.

Author Contributions

Conceptualization, R.M.; methodology, R.M.; software, R.M.; validation, R.M.; formal analysis, R.M. and L.F.; investigation, R.M. and Y.S.; data curation, R.M.; writing—original draft preparation, R.M. and L.F.; writing—review and editing, R.M., L.F., O.F., Y.S., S.A., V.S. and U.A.P.; visualization, R.M. and L.F.; supervision, O.F., S.A., V.S. and U.A.P.; project administration, S.A., V.S. and U.A.P.; funding acquisition, S.A., V.S. and U.A.P. All authors have read and agreed to the published version of the manuscript.

Funding

The authors gratefully acknowledge funding by the German Research Foundation (DFG) within SPP 2364 under grants 504580586 and 504954383.

Data Availability Statement

The calculated size ( d F max ) and shape ( Ψ A ) distribution data from SOPAT images can be accessed at https://doi.org/10.25532/OPARA-807 (accessed on 28 April 2025).

Acknowledgments

The authors would like to thank Gert Schmidt from the Institute of Ceramics, Refractories and Composite Materials, TU Bergakademie Freiberg, for conducting the SEM characterization, Annett Kästner for conducting the mercury intrusion porosimetry measurements, Abhishek Prashant Singh, Shalini Rawat, and Siddhi Kulkarni for assisting in the spray-drying experiments, and Lisa Ditscherlein for fruitful scientific discussions.

Conflicts of Interest

The authors declare no conflicts of interest.

References

  1. Zhou, X.D.; Zhang, S.C.; Huebner, W.; Ownby, P.D.; Gu, H. Effect of the solvent on the particle morphology of spray dried PMMA. J. Mater. Sci. 2001, 36, 3759–3768. [Google Scholar] [CrossRef]
  2. Schwarzer, H.C.; Peukert, W. Experimental Investigation into the Influence of Mixing on Nanoparticle Precipitation. Chem. Eng. Technol. 2002, 25, 657. [Google Scholar] [CrossRef]
  3. Iskandar, F.; Gradon, L.; Okuyama, K. Control of the morphology of nanostructured particles prepared by the spray drying of a nanoparticle sol. J. Colloid Interface Sci. 2003, 265, 296–303. [Google Scholar] [CrossRef]
  4. Banert, T.; Peuker, U.A. Production of highly filled Fe3O4/PMMA nanocomposites by the spraying process. Chem. Ing. Tech. 2005, 77, 224–227. [Google Scholar] [CrossRef]
  5. Ciprari, D.; Jacob, K.; Tannenbaum, R. Characterization of Polymer Nanocomposite Interphase and Its Impact on Mechanical Properties. Macromolecules 2006, 39, 6565–6573. [Google Scholar] [CrossRef]
  6. Dallas, P.; Georgakilas, V.; Niarchos, D.; Komninou, P.; Kehagias, T.; Petridis, D. Synthesis, characterization and thermal properties of polymer/magnetite nanocomposites. Nanotechnology 2006, 17, 2046–2053. [Google Scholar] [CrossRef]
  7. Castrillo, P.; Olmos, D.; Amador, D.; González-Benito, J. Real dispersion of isolated fumed silica nanoparticles in highly filled PMMA prepared by high energy ball milling. J. Colloid Interface Sci. 2007, 308, 318–324. [Google Scholar] [CrossRef]
  8. Srivastava, S.; Haridas, M.; Basu, J.K. Optical properties of polymer nanocomposites. Bull. Mater. Sci. 2008, 31, 213–217. [Google Scholar] [CrossRef]
  9. Gyergyek, S.; Huskić, M.; Makovec, D.; Drofenik, M. Superparamagnetic nanocomposites of iron oxide in a polymethyl methacrylate matrix synthesized by in situ polymerization. Colloids Surfaces A Physicochem. Eng. Asp. 2008, 317, 49–55. [Google Scholar] [CrossRef]
  10. Rudolph, M.; Peuker, U.A. Coagulation and stabilization of sterically functionalized magnetite nanoparticles in an organic solvent with different technical polymers. J. Colloid Interface Sci. 2011, 357, 292–299. [Google Scholar] [CrossRef]
  11. Rudolph, M.; Turan, C.; Kirchberg, S.; Ziegmann, G.; Peuker, U. Nanoparticles in Organic Solvents with Polymers—Stability and Consequences upon Material Synthesis through Spray Drying and Melt Moulding. In NanoFormulation; Tiddy, G., Tan, R., Eds.; The Royal Society of Chemistry: London, UK, 2012; pp. 177–187. [Google Scholar] [CrossRef]
  12. Darwish, M.S.A.; Peuker, U.; Kunz, U.; Turek, T. Bi-layered polymer–magnetite core/shell particles: Synthesis and characterization. J. Mater. Sci. 2011, 46, 2123–2134. [Google Scholar] [CrossRef]
  13. Santos, D.; Maurício, A.C.; Sencadas, V.; Santos, J.D.; Fernandes, M.H.; Gomes, P.S. Spray Drying: An Overview. In Biomaterials—Physics and Chemistry—New Edition; InTech: Rijeka, Croatia, 2018. [Google Scholar] [CrossRef]
  14. de Souza Lima, R.; Ré, M.I.; Arlabosse, P. Drying droplet as a template for solid formation: A review. Powder Technol. 2020, 359, 161–171. [Google Scholar] [CrossRef]
  15. Rudolph, M.; Peuker, U.A. Phase transfer of agglomerated nanoparticles: Deagglomeration by adsorbing grafted molecules and colloidal stability in polymer solutions. J. Nanoparticle Res. 2012, 14, 990. [Google Scholar] [CrossRef]
  16. Perecin, C.; Cerize, N.; Chitta, V.; Gratens, X.; Léo, P.; de Oliveira, A.; Yoshioka, S. Magnetite Nanoparticles Encapsulated with PCL and Poloxamer by Nano Spray Drying Technique. Nanosci. Nanotechnol. 2016, 6, 68–73. [Google Scholar] [CrossRef]
  17. Rothberg, H.; Pietsch-Braune, S.; Spahr, L.; Kanina, Y.; Heinrich, S. Production of magnetite-polyvinyl butyral composites using a Nano Spray Dryer. Powder Technol. 2021, 394, 394–402. [Google Scholar] [CrossRef]
  18. Johnson, P.E.; Muttil, P.; MacKenzie, D.; Carnes, E.C.; Pelowitz, J.; Mara, N.A.; Mook, W.M.; Jett, S.D.; Dunphy, D.R.; Timmins, G.S.; et al. Spray-Dried Multiscale Nano-biocomposites Containing Living Cells. ACS Nano 2015, 9, 6961–6977. [Google Scholar] [CrossRef]
  19. Lefrançois Perreault, L.; Colò, F.; Meligrana, G.; Kim, K.; Fiorilli, S.; Bella, F.; Nair, J.R.; Vitale-Brovarone, C.; Florek, J.; Kleitz, F.; et al. Spray-Dried Mesoporous Mixed Cu-Ni Oxide@Graphene Nanocomposite Microspheres for High Power and Durable Li-Ion Battery Anodes. Adv. Energy Mater. 2018, 8, 1802438. [Google Scholar] [CrossRef]
  20. Sen, D.; Spalla, O.; Belloni, L.; Charpentier, T.; Thill, A. Temperature Effects on the Composition and Microstructure of Spray-Dried Nanocomposite Powders. Langmuir 2006, 22, 3798–3806. [Google Scholar] [CrossRef] [PubMed]
  21. Sen, D.; Melo, J.S.; Bahadur, J.; Mazumder, S.; Bhattacharya, S.; Ghosh, G.; Dutta, D.; D’Souza, S.F. Buckling-driven morphological transformation of droplets of a mixed colloidal suspension during evaporation-induced self-assembly by spray drying. Eur. Phys. J. E 2010, 31, 393–402. [Google Scholar] [CrossRef]
  22. Sen, D.; Bahadur, J.; Mazumder, S.; Bhattacharya, S. Formation of hollow spherical and doughnut microcapsules by evaporation induced self-assembly of nanoparticles: Effects of particle size and polydispersity. Soft Matter 2012, 8, 10036. [Google Scholar] [CrossRef]
  23. Sen, D.; Bahadur, J.; Mazumder, S.; Verma, G.; Hassan, P.A.; Bhattacharya, S.; Vijai, K.; Doshi, P. Nanocomposite silicasurfactant microcapsules by evaporation induced self assembly: Tuning the morphological buckling by modifying viscosity and surface charge. Soft Matter 2012, 8, 1955–1963. [Google Scholar] [CrossRef]
  24. Sen, D.; Ghosh, A.; Mazumder, S.; Bindal, R.; Tewari, P. Novel polysulfone–spray-dried silica composite membrane for water purification: Preparation, characterization and performance evaluation. Sep. Purif. Technol. 2014, 123, 79–86. [Google Scholar] [CrossRef]
  25. Guo, Z.; Pereira, T.; Choi, O.; Wang, Y.; Hahn, H.T. Surface functionalized alumina nanoparticle filled polymeric nanocomposites with enhanced mechanical properties. J. Mater. Chem. 2006, 16, 2800. [Google Scholar] [CrossRef]
  26. Mallakpour, S.; Khadem, E. Recent development in the synthesis of polymer nanocomposites based on nano-alumina. Prog. Polym. Sci. 2015, 51, 74–93. [Google Scholar] [CrossRef]
  27. Pinto, D.; Bernardo, L.F.A.; Amaro, A.; Lopes, S. Mechanical Properties of Epoxy Nanocomposites Using Alumina as Reinforcement—A Review. J. Nano Res. 2015, 30, 9–38. [Google Scholar] [CrossRef]
  28. Xu, J.; Wang, A.; Wang, X.; Su, D.; Zhang, T. Synthesis, characterization, and catalytic application of highly ordered mesoporous alumina-carbon nanocomposites. Nano Res. 2010, 4, 50–60. [Google Scholar] [CrossRef]
  29. Hakamy, A.; Abd-Elnaiem, A.M. Porous alumina–lithium composites for novel lithium-ion batteries. J. Appl. Electrochem. 2024, 54, 1463–1471. [Google Scholar] [CrossRef]
  30. Pourmadadi, M.; Farokh, A.; Rahmani, E.; Shamsabadipour, A.; Eshaghi, M.M.; Rahdar, A.; Ferreira, L.F.R. Porous alumina as potential nanostructures for drug delivery applications, synthesis and characteristics. J. Drug Deliv. Sci. Technol. 2022, 77, 103877. [Google Scholar] [CrossRef]
  31. Zhou, L.; Luo, X.; Li, J.; Ma, L.; He, Y.; Jiang, Y.; Yin, L.; Gao, L. Meso-molding three-dimensionally ordered macroporous alumina: A new platform to immobilize enzymes with high performance. Biochem. Eng. J. 2019, 146, 60–68. [Google Scholar] [CrossRef]
  32. Tadic, M.; Panjan, M.; Tadic, B.V.; Kralj, S.; Lazovic, J. Magnetic properties of mesoporous hematite/alumina nanocomposite and evaluation for biomedical applications. Ceram. Int. 2022, 48, 10004–10014. [Google Scholar] [CrossRef]
  33. Huntington, D.H. The Influence of the Spray Drying Process on Product Properties. Dry. Technol. 2004, 22, 1261–1287. [Google Scholar] [CrossRef]
  34. Nandiyanto, A.B.D.; Okuyama, K. Progress in developing spray-drying methods for the production of controlled morphology particles: From the nanometer to submicrometer size ranges. Adv. Powder Technol. 2011, 22, 1–19. [Google Scholar] [CrossRef]
  35. Homayoonfal, M.; Malekjani, N.; Baeghbali, V.; Ansarifar, E.; Hedayati, S.; Jafari, S.M. Optimization of spray drying process parameters for the food bioactive ingredients. Crit. Rev. Food Sci. Nutr. 2022, 64, 5631–5671. [Google Scholar] [CrossRef] [PubMed]
  36. Höhne, S.; Gaukel, V. Impact of the drying rate on product properties of spray dried emulsions to enable a targeted product design. Dry. Technol. 2024, 42, 2080–2086. [Google Scholar] [CrossRef]
  37. Nicklas, J.; Peuker, U. Agglomeration of fine hydrophobic particles: 1D and 2D characterization by dynamic image analysis of in-line probe data. Powder Technol. 2023, 426, 118685. [Google Scholar] [CrossRef]
  38. Eiermann, N.; Furat, O.; Nicklas, J.; Peuker, U.A.; Schmidt, V. Quantitative characterization of hydrophobic agglomeration at different mixing intensities using a copula-based probabilistic modeling approach. Powder Technol. 2025, 460, 120907. [Google Scholar] [CrossRef]
  39. Allen, T. Mercury porosimetry. In Particle Size Measurement; Springer: Berlin/Heidelberg, Germany, 1990; pp. 653–681. [Google Scholar] [CrossRef]
  40. Dobry, D.E.; Settell, D.M.; Baumann, J.M.; Ray, R.J.; Graham, L.J.; Beyerinck, R.A. A Model-Based Methodology for Spray-Drying Process Development. J. Pharm. Innov. 2009, 4, 133–142. [Google Scholar] [CrossRef]
  41. Petersen, L.N.; Poulsen, N.K.; Niemann, H.H.; Utzen, C.; Jørgensen, J.B. Comparison of three control strategies for optimization of spray dryer operation. J. Process Control 2017, 57, 1–14. [Google Scholar] [CrossRef]
  42. Schmitt, J.M.; Baumann, J.M.; Morgen, M.M. Predicting Spray Dried Dispersion Particle Size Via Machine Learning Regression Methods. Pharm. Res. 2022, 39, 3223–3239. [Google Scholar] [CrossRef]
  43. Petersen, L.N.; Poulsen, N.K.; Niemann, H.H.; Utzen, C.; Jørgensen, J.B. Comparison of Linear and Nonlinear Model Predictive Control for Optimization of Spray Dryer Operation. IFAC-PapersOnLine 2015, 48, 218–223. [Google Scholar] [CrossRef]
  44. Muñoz López, C.A.; Peeters, K.; Van Impe, J. Data-Driven Modeling of the Spray Drying Process. Process Monitoring and Prediction of the Particle Size in Pharmaceutical Production. ACS Omega 2024, 9, 25678–25693. [Google Scholar] [CrossRef] [PubMed]
  45. Neumann, M.; Gräfensteiner, P.; Santos de Oliveira, C.; Martins de Souza e Silva, J.; Koppka, S.; Enke, D.; Huber, P.; Schmidt, V. Morphology of nanoporous glass: Stochastic 3D modeling, stereology and the influence of pore width. Phys. Rev. Mater. 2024, 8, 045605. [Google Scholar] [CrossRef]
  46. Furat, O.; Masuhr, M.; Kruis, F.E.; Schmidt, V. Stochastic modeling of classifying aerodynamic lenses for separation of airborne particles by material and size. Adv. Powder Technol. 2020, 31, 2215–2226. [Google Scholar] [CrossRef]
  47. Ishiduki, K.; Esumi, K. Adsorption Characteristics of Poly(acrylic acid) and Poly(vinyl pyrrolidone) on Alumina from Their Mixtures in Aqueous Solution. J. Colloid Interface Sci. 1997, 185, 274–277. [Google Scholar] [CrossRef]
  48. Ishiduki, K.; Esumi, K. The Effect of pH on Adsorption of Poly(acrylic acid) and Poly(vinylpyrrolidone) on Alumina from Their Binary Mixtures. Langmuir 1997, 13, 1587–1591. [Google Scholar] [CrossRef]
  49. Koivuluoto, H.; Matikainen, V.; Larjo, J.; Vuoristo, P. Novel Online Diagnostic Analysis for In-Flight Particle Properties in Cold Spraying. J. Therm. Spray Technol. 2018, 27, 423–432. [Google Scholar] [CrossRef]
  50. Silverman, B. Density Estimation for Statistics and Data Analysis; Routledge: London, UK, 2018. [Google Scholar] [CrossRef]
  51. Shao, J. Mathematical Statistics; Springer: Berlin/Heidelberg, Germany, 2008. [Google Scholar] [CrossRef]
  52. Johnson, N.L.; Kotz, S.; Balakrishnan, N. Continuous Univariate Distributions; John Wiley & Sons: Hoboken, NJ, USA, 1995; Volume 2. [Google Scholar]
  53. Smirnov, S.; Vlassiouk, I.; Takmakov, P.; Rios, F. Water Confinement in Hydrophobic Nanopores. Pressure-Induced Wetting and Drying. ACS Nano 2010, 4, 5069–5075. [Google Scholar] [CrossRef]
  54. Nelsen, R.B. An Introduction to Copulas; Springer: Berlin/Heidelberg, Germany, 2006. [Google Scholar] [CrossRef]
  55. Biswas, P.; Sen, D.; Mazumder, S.; Doshi, P. Controlling sphere to doughnut transformation during quick drying of colloidal micrometric droplets. AIP Conf. Proc. 2017, 1832, 140009. [Google Scholar] [CrossRef]
  56. Siemons, I.; Politiek, R.; Boom, R.; van der Sman, R.; Schutyser, M. Dextrose equivalence of maltodextrins determines particle morphology development during single sessile droplet drying. Food Res. Int. 2020, 131, 108988. [Google Scholar] [CrossRef]
  57. Fan, X.; Li, S.; Wu, Y.; Niu, L. Large-scale preparation of macro-porous silica microspheres via sol–gel composite particles and a spray drying process. RSC Adv. 2017, 7, 56081–56086. [Google Scholar] [CrossRef]
  58. Faure, B.; Sæderup Lindeløv, J.; Wahlberg, M.; Adkins, N.; Jackson, P.; Bergström, L. Spray drying of TiO2 nanoparticles into redispersible granules. Powder Technol. 2010, 203, 384–388. [Google Scholar] [CrossRef]
  59. Prabhakaran, K.; Beigh, M.; Lakra, J.; Gokhale, N.; Sharma, S. Characteristics of 8molby spray drying process. J. Mater. Process. Technol. 2007, 189, 178–181. [Google Scholar] [CrossRef]
  60. Wang, X.; Wang, P.; Liu, S.; Crouse, J.; Gardner, D.J.; Via, B.; Gallagher, T.; Elder, T.; Peng, Y. Material properties of spray-dried cellulose nanocrystal reinforced homopolymer polypropylene composites. Polym. Compos. 2023, 46, 1177–1191. [Google Scholar] [CrossRef]
Figure 1. (a) SEM micrograph of ASFP-20 alumina nanoparticles; (b) number-weighted cumulative distribution function (blue) and probability density function (red) of particle size obtained from DLS measurements.
Processes 13 01643 g001
Figure 2. Photograph of the spray-drying setup with the integrated SOPAT inline imaging probe.
Processes 13 01643 g002
Figure 3. Schematic illustration of the HiWatch droplet imaging system setup.
Processes 13 01643 g003
Figure 4. Schematic representation of the minimum and maximum Feret diameters for an irregularly shaped solid.
Processes 13 01643 g004
Figure 5. PDFs and CDFs for droplet size (a,c) and velocity (b,d) from HiWatch measurements.
Processes 13 01643 g005
Figure 6. CDFs of d F max for F series (a) and B series (b) of experimental cases.
Processes 13 01643 g006
Figure 7. PDFs of the fitted lognormal and normal distributions for the granule size d F max (a) and the aspect ratio Ψ A (b) for the F series and corresponding PDFs of the fitted lognormal and normal distributions for the B series (c,d).
Processes 13 01643 g007
Figure 8. Regression of model parameters of the lognormal distribution for d F max (a,c) and the normal distribution for Ψ A (b,d), where (a,b) correspond to F series (varying feed rate), and (c,d) to B series (varying binder concentration).
Processes 13 01643 g008
Figure 9. Bivariate descriptor distribution. The fitted and predicted bivariate distributions and corresponding data points are shown in gray, red, and blue, respectively. The rows show the F- and B-series, respectively. The middle column corresponds to a flow rate and binder concentration of 12.5 mL min−1 and 0.8 wt% (top row) and 11 mL min−1 and 2.4 wt% (bottom row).
Processes 13 01643 g009
Figure 10. SEM images of spray-dried granules at two different feed rates: (a,b) low feed rate (F1B2), and (c,d) high feed rate (F2B2).
Processes 13 01643 g010
Figure 11. (a) Specific volume of mercury intruded during the second intrusion cycle (10–400 MPa); (b) specific volume of mercury intruded during the second intrusion cycle as a function of pore sizes (10–150 nm), according to Equation (10).
Processes 13 01643 g011
Table 1. Summary of spray-drying experimental conditions (fixed parameters and variable settings). The experimental cases denote the feed rate (F1 = 11, F2 = 14, F3 = 17, F4 = 20 mL min−1) and binder concentrations (B1 = 0.4 wt%, B2 = 0.8 wt%, B3 = 1.6 wt%, B4 = 3.2 wt%).
Process Parameters F SeriesB Series
F1B2 F2B2 F3B2 F4B2 F1B1 F1B3 F1B4
Atomization pressure [bar]5555555
Spray gas flow rate [L h−1]742742742742742742742
Inlet temperature [°C]220220220220220220220
Drying gas flow rate [m3 h−1]35353535353535
Feed flow rate [mL min−1]11141720111111
PVP-30 concentration [wt%]0.80.80.80.80.41.63.2
Table 2. Imaging specifications. Image capture specifications for the SOPAT inline granule imaging probe.
Image formatMonochromatic 8-bit
Image dimensions [pixels × pixels]2464 × 2056
Frame rate [ Hz ] 20
Conversion factor [ μ m / pixel ] 0.2464
Focus position [ μ m ] 99.8629
Strobe intensity [%]100
Exposure time [ μ s ] 6400
Reflector distance [ μ m ] 1000
Table 3. Characteristic percentile values ( d 10 , 0 , d 50 , 0 , and d 90 , 0 ) and coefficient of variation (CV) of d F max for F series and B series.
F SeriesB Series
F1B2F2B2F3B2F4B2F1B1F1B3F1B4
d 10 , 0 [ μ m ] 3.113.263.574.072.873.364.26
d 50 , 0 [ μ m ] 3.774.234.855.423.654.495.35
d 90 , 0 [ μ m ] 5.166.066.977.695.346.847.82
CV [-]0.250.290.310.280.270.320.30
Table 4. Model parameter values of the fitted distributions for d F max and Ψ A , plotted in Figure 7 using Equations (8) and (7), respectively.
d F max Ψ A
μ σ μ σ c
F1B20.190.592.560.710.07
F2B20.520.582.490.710.08
F3B21.030.462.030.710.08
F4B21.040.472.570.710.09
F1B10.320.602.250.670.09
F1B30.690.592.480.680.09
F1B40.580.653.520.710.09
Table 5. Regression parameter values of fitted functions plotted in Figure 8.
d F max Ψ A
μ σ μ σ c
F seriesa0.10−0.02−0.010.000.00
b−0.890.772.640.720.05
B seriesa0.090.020.470.020.00
b0.380.581.940.660.09
Disclaimer/Publisher’s Note: The statements, opinions and data contained in all publications are solely those of the individual author(s) and contributor(s) and not of MDPI and/or the editor(s). MDPI and/or the editor(s) disclaim responsibility for any injury to people or property resulting from any ideas, methods, instructions or products referred to in the content.

