Article

A Study on the Crack Propagation Behavior of Cement Sheath Interfaces Considering Bond Strength

1
Oil Extraction Technology Research Institute of Xinjiang Oilfield Company, Karamay 834099, China
2
College of Petroleum Engineering, China University of Petroleum-Beijing, Beijing 102249, China
3
School of Petroleum, China University of Petroleum-Beijing at Karamay, Karamay 834000, China
*
Author to whom correspondence should be addressed.
Processes 2025, 13(6), 1631; https://doi.org/10.3390/pr13061631
Submission received: 10 April 2025 / Revised: 17 May 2025 / Accepted: 20 May 2025 / Published: 22 May 2025
(This article belongs to the Section Materials Processes)

Abstract

:
Existing studies have not considered the impact of interface bond strength on the ease of crack propagation at the cement sheath interface. Through Brazilian splitting and direct shear tests, the normal and shear bond strengths at interfaces I and II of a cement sheath were quantified. Based on this, a crack propagation model for the cement sheath interface was established using cohesive zone elements. The propagation characteristics of cracks along the axial and circumferential directions at interfaces I and II of a cement sheath during hydraulic fracturing were analyzed, along with their influencing factors. The results show that, due to the difference in interface bond strength, the crack propagation rate and length at interface I in the axial direction are greater than those at interface II, while the interface II crack is more likely to propagate in the circumferential direction. The elastic modulus of the cement sheath is a key factor affecting the integrity of the cement seal. Both excessively low and high elastic moduli can lead to different forms of failure in the cement sheath. It is recommended to control the elastic modulus of the cement sheath between 7 and 8 GPa. As the internal casing pressure increases, the axial propagation length of cement sheath interface cracks also increases. During fracturing, reducing pump pressure can reduce the axial crack propagation length in the cement sheath, alleviating or preventing the risk of fluid migration between stages and clusters. The findings of this study provide theoretical references and engineering support for the control of cement sheath seal integrity.

1. Introduction

Shale oil reservoirs are characterized by low porosity and low permeability [1], and typically, hydraulic fracturing operations are required to achieve high production rates [2]. However, during the hydraulic fracturing process, some shale oil wells experience issues such as cement sheath seal failure, annular pressure buildup, and fluid migration [3,4]. Taking the Weirong area in China as an example, sustained casing pressure (SCP) was observed in four out of six hydraulically fractured shale gas wells (66.7%) following fracturing operations. In the early stage of shale gas development in the Fuling block, the incidence of SCP induced by large-scale hydraulic fracturing reached levels as high as 70%. These cases indicate that, under high-intensity fracturing, the risk of cement sheath failure is significantly increased, which poses a serious threat to the safe and efficient production of shale gas wells, which severely affects the safe and efficient production of shale oil wells.
Multistage fracturing operations in horizontal wells are characterized by frequent cycles, high construction pressures, and large discharge volumes. Under high-pressure loads, cement sheaths are prone to mechanical failure. Numerous scholars, both domestically and internationally, have conducted extensive research on cement sheath failure from the perspectives of theoretical models [5,6,7,8,9,10], numerical simulations [11,12], and laboratory experiments [13,14,15]. These studies indicate that the coupled effects of temperature, pressure, and the non-uniform characteristics of in situ stresses are the primary factors controlling cement sheath failure during multistage fracturing. Additionally, eccentricity of the casing in horizontal wells can cause uneven cement sheath thickness, affecting the stress distribution within the cement sheath and increasing the risk of cement sheath damage.
In addition to the potential structural failure of the cement sheath body, multistage fracturing operations may also lead to the failure of the cement sheath interface seal’s integrity, through phenomena such as the formation of micro-annuli at the interface or the generation of cracks in the bond surface. In their study of micro-annuli in cement sheaths, Chu [16], Liu [17], and others analyzed the mechanism and influencing factors of micro-annuli formation at the interface under the loading and unloading of internal casing pressure based on the Mohr–Coulomb criterion. The formation of micro-annuli at the interface depends on the relationship between bond strength and tensile stress at the interface, with interface I being more prone to the formation of micro-annuli compared to interface II. Zeng [18] and others, by introducing a cement sheath sealing simulation and evaluation device, pointed out that the cement sheath undergoes plastic deformation under high-internal-pressure loading, and residual strain is generated after unloading. During cyclic loading and unloading, plastic deformation and residual strain gradually accumulate, while tensile stress at the interface continues to increase. When the tensile stress exceeds the bond strength, micro-annuli are formed at the interface. Xi et al. [19,20] developed a numerical model incorporating cyclic loading and unloading, and obtained similar conclusions. They further characterized the distribution of micro-annuli along the entire horizontal section, revealing that the sizes of the micro-annuli gradually increase from the toe to the heel. Zhao et al. [21], through numerical simulation analysis, pointed out that micro-annuli are more likely to form at interface I of the cement sheath than at interface II.
Guo [22], Plank [23], Xu [24], Matki [25], Liu [26], and others designed different types of experimental devices to simulate the curing process of cement sheaths in high-temperature and high-pressure environments, and obtained the interface bond strength through shear testing. Gu et al. [27] developed a simulation-based evaluation device for assessing the sealing capacity of interface II in cementing, and tested its performance under gas and water invasion conditions. Guo et al. [28] identified micro-annuli in cementing as one of the key factors contributing to sealing failure. They argued that the presence of filter cakes at interface II and the volumetric shrinkage of the cement matrix can lead to the formation of micro-annuli. Opedal et al. [29] used CT scanning reconstruction to obtain the through-crack damage path of the cement–stone formation interface after impact shear. Lecampion [30], Feng [31], Williams [32], Kim [33], Li Yong [34], and others established mathematical models for cement sheath interface crack propagation and analyzed the crack propagation laws of cement sheath interfaces under fracturing conditions in shale oil wells. Their studies showed that increasing the elastic modulus and bond strength of the cement sheath helped to shorten the length of interface crack propagation. However, an excessively high elastic modulus can also increase the brittleness of the cement sheath, potentially leading to other types of failure. In addition, an excessively high bonding strength may alter the crack propagation path or induce new crack patterns. Lian [35], Wang [36], and others, based on cohesive zone elements, analyzed the potential for fluid migration along the cement sheath bond surface during the fracturing process.
Existing studies have primarily focused on the overall structural failure of the cement sheath, the development of interfacial micro-annuli under cyclic loading, or debonding behavior at a single interface. However, they generally fail to distinguish between the bonding performance of the casing–cement sheath interface and the cement sheath–formation interface, and there is a lack of research on how variations in interfacial bonding strength influence crack propagation paths and patterns. Therefore, it is necessary to establish a crack propagation model that captures the effects of interfacial strength heterogeneity in order to address these current research gaps. In this study, cement slurry–casing and cement slurry–shale bond samples were cured and tested to measure the normal and shear bond strengths at the cement sheath interface. Based on this, a finite element model for cement sheath interface crack propagation was established using cohesive zone elements. The axial and circumferential crack propagation characteristics of cement sheath interfaces I and II during hydraulic fracturing were analyzed, along with the effects of the cement sheath’s mechanical properties, fracturing parameters, and formation properties on interface crack propagation. The aim of this study is to provide a reference for cementing and fracturing operations in shale oil wells.

2. Cement Sheath Interface Bond Strength Testing

During the cementing process, after casing is run, cement slurry is injected, and as the slurry sets, a cement sheath forms, bonding the casing and formation together. This results in the creation of two bond interfaces: the cement sheath–casing interface (interface I) and the cement sheath–formation interface (interface II). When simulating cement sheath interface crack propagation in well cementing, the bond strength at the interfaces must be considered. Therefore, cement slurry bond strength tests were conducted to obtain the bond strength parameters, providing a basis for the establishment of subsequent numerical models.

2.1. Experimental Methods and Procedures

2.1.1. Sample Preparation

During sample preparation, the bonding characteristics of both the casing–cement sheath and cement sheath–formation interfaces were comprehensively considered. To meet the dimensional requirements of the Brazilian splitting test and direct shear test apparatus, two types of curing molds for cemented specimens were designed and fabricated, as shown in Figure 1. These molds produce cylindrical specimens with diameters of 25 mm and heights of 50 mm for normal bonding strength tests, and specimens with diameters of 50 mm and heights of 50 mm for shear bonding strength tests. The chosen dimensions ensure compatibility with standard testing equipment, while also satisfying the requirements for loading stability and data comparability.
During sample curing, shale and metal materials were first machined into semi-cylindrical shapes with dimensions of 25 mm in diameter × 50 mm in height and 50 mm in diameter × 50 mm in height, respectively. The prepared semi-cylindrical shale and metal components were then placed into curing molds of corresponding sizes, followed by the pouring of the prepared cement slurry and the sealing of the molds. In this study, all samples—including both shale and metal substrates—were processed using wire electrical discharge machining (wire EDM), which ensured their smooth surfaces and high geometric consistency. This method allowed for precise control over sample dimensions while producing flat bonding surfaces, thereby avoiding surface roughness variations that may have arisen from manual grinding or polishing. Such control is critical for ensuring the repeatability and comparability of test results. To simulate the temperature and pressure conditions of cement slurry hydration and hardening in deep formations, all samples were cured in a water bath for 3 days at 120 °C and 20.7 MPa. After curing, the cement sheath–casing and cement sheath–shale bonded specimens were demolded for subsequent testing.
Considering the dimensional requirements of the normal bond strength testing apparatus, the cured bonding samples were subjected to surface smoothing and wire cutting treatments. The 25 mm × 50 mm samples were cut into dimensions of 25 mm in diameter by 15 mm in height. Figure 2 shows the cured and processed cement slurry bonding samples. The samples labeled with the “N” series were for normal bond strength testing, with dimensions of 25 mm × 15 mm, and those labeled with the “S” series were for shear bond strength testing, with dimensions of 50 mm × 50 mm.

2.1.2. Experimental Apparatus and Procedure

(1)
Normal Bond Strength
Normal bond strength refers to the tensile strength of the bonding interface. For cylindrical samples, the direct measurement of tensile strength is difficult. In rock or concrete testing, the Brazilian splitting test is commonly used to indirectly measure the tensile strength of a sample. The Brazilian splitting test setup consisted of a testing machine, clamps, load sensors, and a data acquisition system, as shown in Figure 3a. The test principle is based on elastoplastic mechanics, where a circular cross-section subjected to diametral compression generates maximum tensile stress at its center, perpendicular to the applied load. When the tensile stress exceeds the tensile strength of the sample, failure occurs. During the test, the sample was clamped onto the testing machine, and pressure was applied along the bonded interface. As the applied load increased, interfacial debonding or cracking was observed at the bonded surface. The corresponding load at the onset of this failure was recorded as the failure load.
(2)
Shear Bond Strength
Shear bond strength refers to the shear strength of the bonding surface. Shear bond strength was measured using a direct shear test, with the direct shear test setup shown in Figure 3b. The direct shear apparatus consisted of a shear box, loading device, force gauge, and dial gauge, with a maximum load capacity of 50 kN. During the test, a load was applied in the shear direction of the specimen using a loading device. Failure was considered to occur when significant displacement or slippage was observed at the bonded interface, indicating an irreversible damage state. The peak shear load at this point was recorded.

2.1.3. Data Processing

Based on the pre-measured diameter D and thickness h of the cement slurry–casing and cement slurry–shale bond samples, as well as the recorded loads P n max and P t max at the point of sample failure, the interface bond strength of the bonding samples was calculated. The formulas for calculating the normal bond strength ( σ n ) and shear bond strength ( σ t ) at the interface are given by Equations (1) and (2), respectively. It should be noted that the theoretical formulations used in the Brazilian splitting and direct shear tests are based on idealized assumptions, which neglect factors such as loading contact area and edge effects that influence stress distribution. Therefore, the obtained strength values represent nominal bonding strength rather than precise absolute tensile or shear strength. This method was suitable for the relative comparison of normal and shear bonding performance between different interface types rather than for determining their exact mechanical strength. In this study, all bonded specimens were prepared with consistent dimensions, loading rates, and interface treatment procedures to ensure the relative comparability of the measured bonding strength values.
σ n = 2 P n max π D h
σ t = P t max D h

2.2. Experimental Results

Figure 4 and Table 1 and Table 2 present the failure modes and test results of the interfacial bonding strength measurements for the cement sheath. As shown in Figure 4, during the normal bonding strength tests, interfacial failure occurred in both the cement–casing and cement–shale samples, with corresponding average displacements of 0.78 mm and 1.41 mm, respectively. In the shear bonding strength tests, interfacial slippage and debonding were observed, indicating shear-induced failure. The average interfacial shear displacements for the cement–casing and cement–shale specimens were 1.09 mm and 1.22 mm, respectively.
According to the test results, the average normal bond strength of the cement stone–casing samples was 0.413 MPa, while the average shear bond strength was 0.464 MPa. For the cement stone–shale samples, the average normal bond strength was 0.577 MPa and the average shear bond strength was 0.287 MPa. These results indicated that the normal bond strength of the cement stone–shale samples was 0.164 MPa higher than that of the cement stone–casing samples. This may be attributed to the inherent permeability of shale, which allows hydration products to partially infiltrate the surface structure of the shale during curing, thereby forming a degree of mechanical interlocking. The shear bonding strength of the cement stone–casing samples was 0.177 MPa higher than that of the cement stone–shale samples. This difference was primarily due to the water-weakening behavior of shale; upon contact with cement slurry, a mechanically weak layer tends to form at the shale interface, resulting in reduced shear bonding strength. This finding is consistent with the results reported by Wang et al. [37].

3. Cement Sheath Interface Crack Propagation Mechanism

3.1. Interface Crack Damage Evolution

Based on the traction–separation constitutive law, the formation and propagation of interface cracks are represented as the damage evolution of two initially intact bonded interfaces, where the interface thickness is zero. The entire process can be divided into three parts, as shown in Figure 5: initial loading, interface initiation, and interface damage evolution.
It is assumed that the initial loading process of the fracturing fluid injection into the cement sheath interface follows linear elastic behavior, controlled by the stiffness of the cohesive zone elements, where interface stiffness is related to stress and strain. Before damage initiates, the interface stiffness remains constant. When the traction force applied to the interface reaches the initiation damage condition, damage begins. Based on the research by Feng et al. [31], the maximum nominal stress criterion provides a more accurate prediction of crack initiation and propagation at interfaces. Therefore, this study adopts the maximum nominal stress criterion to evaluate interfacial damage in the cement sheath. According to this criterion, interfacial damage is assumed to initiate when either the normal or shear stress at the interface reaches the corresponding critical normal or shear strength, expressed as follows:
M a x T n T n 0 , T s T s 0 , T t T t 0 = 1
T n = T n , T n 0 0 , T n < 0
In the equation, 〈 〉 represents the Macaulay bracket, indicating that no damage occurs at the interface under a pure compression deformation or stress state. T n is the normal interface stress on the cement sheath, Pa ; T n 0 is the maximum nominal stress corresponding to failure in the normal direction, Pa ; T s is the interface stress on the cement sheath in the first shear direction, Pa ; T s 0 is the maximum nominal stress corresponding to failure in the first shear direction, Pa ; T t is the interface stress on the cement sheath in the second shear direction, Pa ; and T t 0 is the maximum nominal stress corresponding to failure in the second shear direction, Pa .
Once damage initiates within the interface elements, the interfacial stiffness begins to degrade, marking the onset of damage evolution. This process describes the rate at which the material’s stiffness deteriorates after satisfying the initiation criterion. Stiffness degradation is commonly used to characterize the damage evolution of interface elements [38], as expressed in Equations (5) and (6). This damage model features a simple structure and low computational cost, making it suitable for application in large-scale numerical simulations.
E = 1 D E 0
D = δ m f δ m max δ m 0 δ m max δ m f δ m 0
In the equation, E 0 and E represent the initial stiffness of the element and the stiffness after damage has occurred, respectively; D is the damage factor; δ m max is the maximum displacement reached by the element during the loading process, m; δ m 0 is the displacement at the point of initial damage, m; and δ m f is the displacement at the point of complete failure of the element, m.

3.2. Fluid Flow in Cement Sheath Interface Cracks

By placing cohesive elements at the cement sheath interface, specifically at the cement sheath–casing interface and the cement sheath–formation interface, the crack initiation and propagation process at the cementing interface during fracturing can be simulated. Once fracturing fluid enters cement sheath interfaces I and II, the fluid pressure will promote crack initiation and further crack propagation. In the simulation process, it is assumed that the fluid within the crack surface of the elements is continuous and incompressible, and the fluid will flow along the direction of crack extension (tangential direction) and perpendicular to the direction of the cement sheath and formation (normal direction), as shown in Figure 6.
To simplify the model and focus on the analysis of interfacial crack propagation in the cement sheath, the fluid within the interface elements is assumed to be an incompressible Newtonian fluid, with a constant injection rate maintained at all times. This simplified assumption is suitable for preliminary analysis and can effectively capture the fundamental behavior of fluid flow within cracks. According to Newtonian fluid pressure transmission, the tangential flow within the crack can be defined as follows [39]:
Q = k Δ p k = d 3 12 μ
In the equation, Q represents the fluid flow rate along the crack propagation direction, m 3 / s ; k is the fluid flow coefficient, Pa / m ; Δ p is the pressure gradient along the crack propagation direction, Pa / m ; d is the crack opening width, m ; and μ is the fluid viscosity, Pa / s .
The fluid seepage loss in the normal direction across the crack surface can be characterized by setting the filtration coefficient of the interface elements [40], which can be expressed as follows:
q t = c t p i p t q b = c b p i p b
In this equation, q t and q b represent the fluid flow rates on the upper and lower surfaces of the interface crack, respectively, m 3 / s ; c t and c b represent the filtration coefficients on the upper and lower surfaces of the interface crack, respectively, m 3 / Pa × s ; p t and p b represent the pore pressures on the upper and lower surfaces of the interface element, respectively, Pa ; and p i represents the pore pressure at the mid-plane of the interface element, Pa .

4. Cement Sheath Interface Crack Propagation Numerical Model

4.1. Geometric Model and Meshing

To investigate the cement sheath interface crack propagation during the fracturing process, a numerical model for cement sheath interface crack propagation was established based on the cement sheath interface bond strength test results and the cohesive zone element model, as shown in Figure 7. The model dimensions were 20 m in length, 2 m in width, and 2 m in height, including five parts: the casing, cement sheath, formation, and the first and second bonding interfaces. Cohesive zone elements were inserted at the casing–cement sheath interface and the cement sheath–formation interface to simulate the bonding interfaces. In terms of mesh generation, C3D8R three-dimensional stress elements were used for the casing, C3D8P fully integrated flow–stress coupling elements were used for the cement sheath and formation, and zero-thickness COH3D8P cohesive zone elements were used for the cement sheath bonding interface. The injection points and initial damage elements were set at the first and second bonding interfaces. The cohesive zone element parameters were set based on the cement sheath interface bond strength test results in order to simulate the interface crack propagation.

4.2. Boundary Conditions and Parameter Setting

In terms of boundary condition settings, displacement constraints in the X direction were applied to the front and rear sides of the model, displacement constraints in the Y direction were applied to the top and bottom sides, and displacement constraints in the Z direction were applied to the left and right sides. According to Saint-Venant’s principle, when the model boundaries are sufficiently distant from the region of interest, the influence of boundary conditions on the local stress and displacement distribution can be neglected. Therefore, in this study, the model boundaries were set to be more than three times larger than the wellbore structure, which was sufficient to minimize the effects of boundary stiffening. As a result, the simulation outcomes can reliably represent the local mechanical behavior around the wellbore. This model used a hydrostatic pressure calculation mode and applied effective stress to the formation in all directions using the software’s built-in in situ stress analysis step. The stress values in the X, Y, and Z directions were set to 12 MPa, 10 MPa, and 8 MPa, respectively. The formation porosity was set to 0.2, the saturation to 1, and the casing internal pressure to 70 MPa. The geometric and mechanical parameters of the model assembly are shown in Table 3, with a calculation time of 100 s. Considering that the primary focus of the model was the crack propagation behavior under different interfacial bonding strengths, and that the shale matrix has a low permeability with limited fluid loss over short durations, the fluid loss of the fracturing fluid through the rock matrix was neglected in this study.

4.3. Model Applicability Statement

To improve simulation efficiency and focus on the mechanism of interfacial crack propagation, the finite element model developed for cement sheath interfacial crack propagation was established with the following assumptions and applicability considerations:
(1)
Interfacial Roughness: The interface was modeled using zero-thickness cohesive elements, which do not explicitly represent surface roughness. However, as described in Section 2, the normal and shear bonding strengths of the cement stone–casing and cement stone–shale interfaces were determined through Brazilian splitting and direct shear tests, respectively. The obtained values were used to define the parameters of the cohesive elements, thereby partially capturing the influence of different interfacial geometries on mechanical response.
(2)
Thermal Effects and Fluid Flow Characteristics: The model primarily focused on the mechanical evolution of interfacial cracks in the cement sheath during hydraulic fracturing. Thermal stresses caused by temperature differences between the fracturing fluid and the wellbore, as well as the influence of cement sheath permeability on pore pressure transmission, were not considered at this stage.
(3)
Parameter Selection Range: In the parameter sensitivity analysis, key parameters such as the elastic modulus and Poisson’s ratio of the cement sheath, as well as internal casing pressure, were investigated. The crack toughness and interface thickness were held constant.
Although the model included certain idealized assumptions, the use of experimentally derived inputs and appropriately scaled geometric dimensions allowed it to capture the primary behavior of interfacial crack propagation. The simulation results thus offer valuable engineering insights.

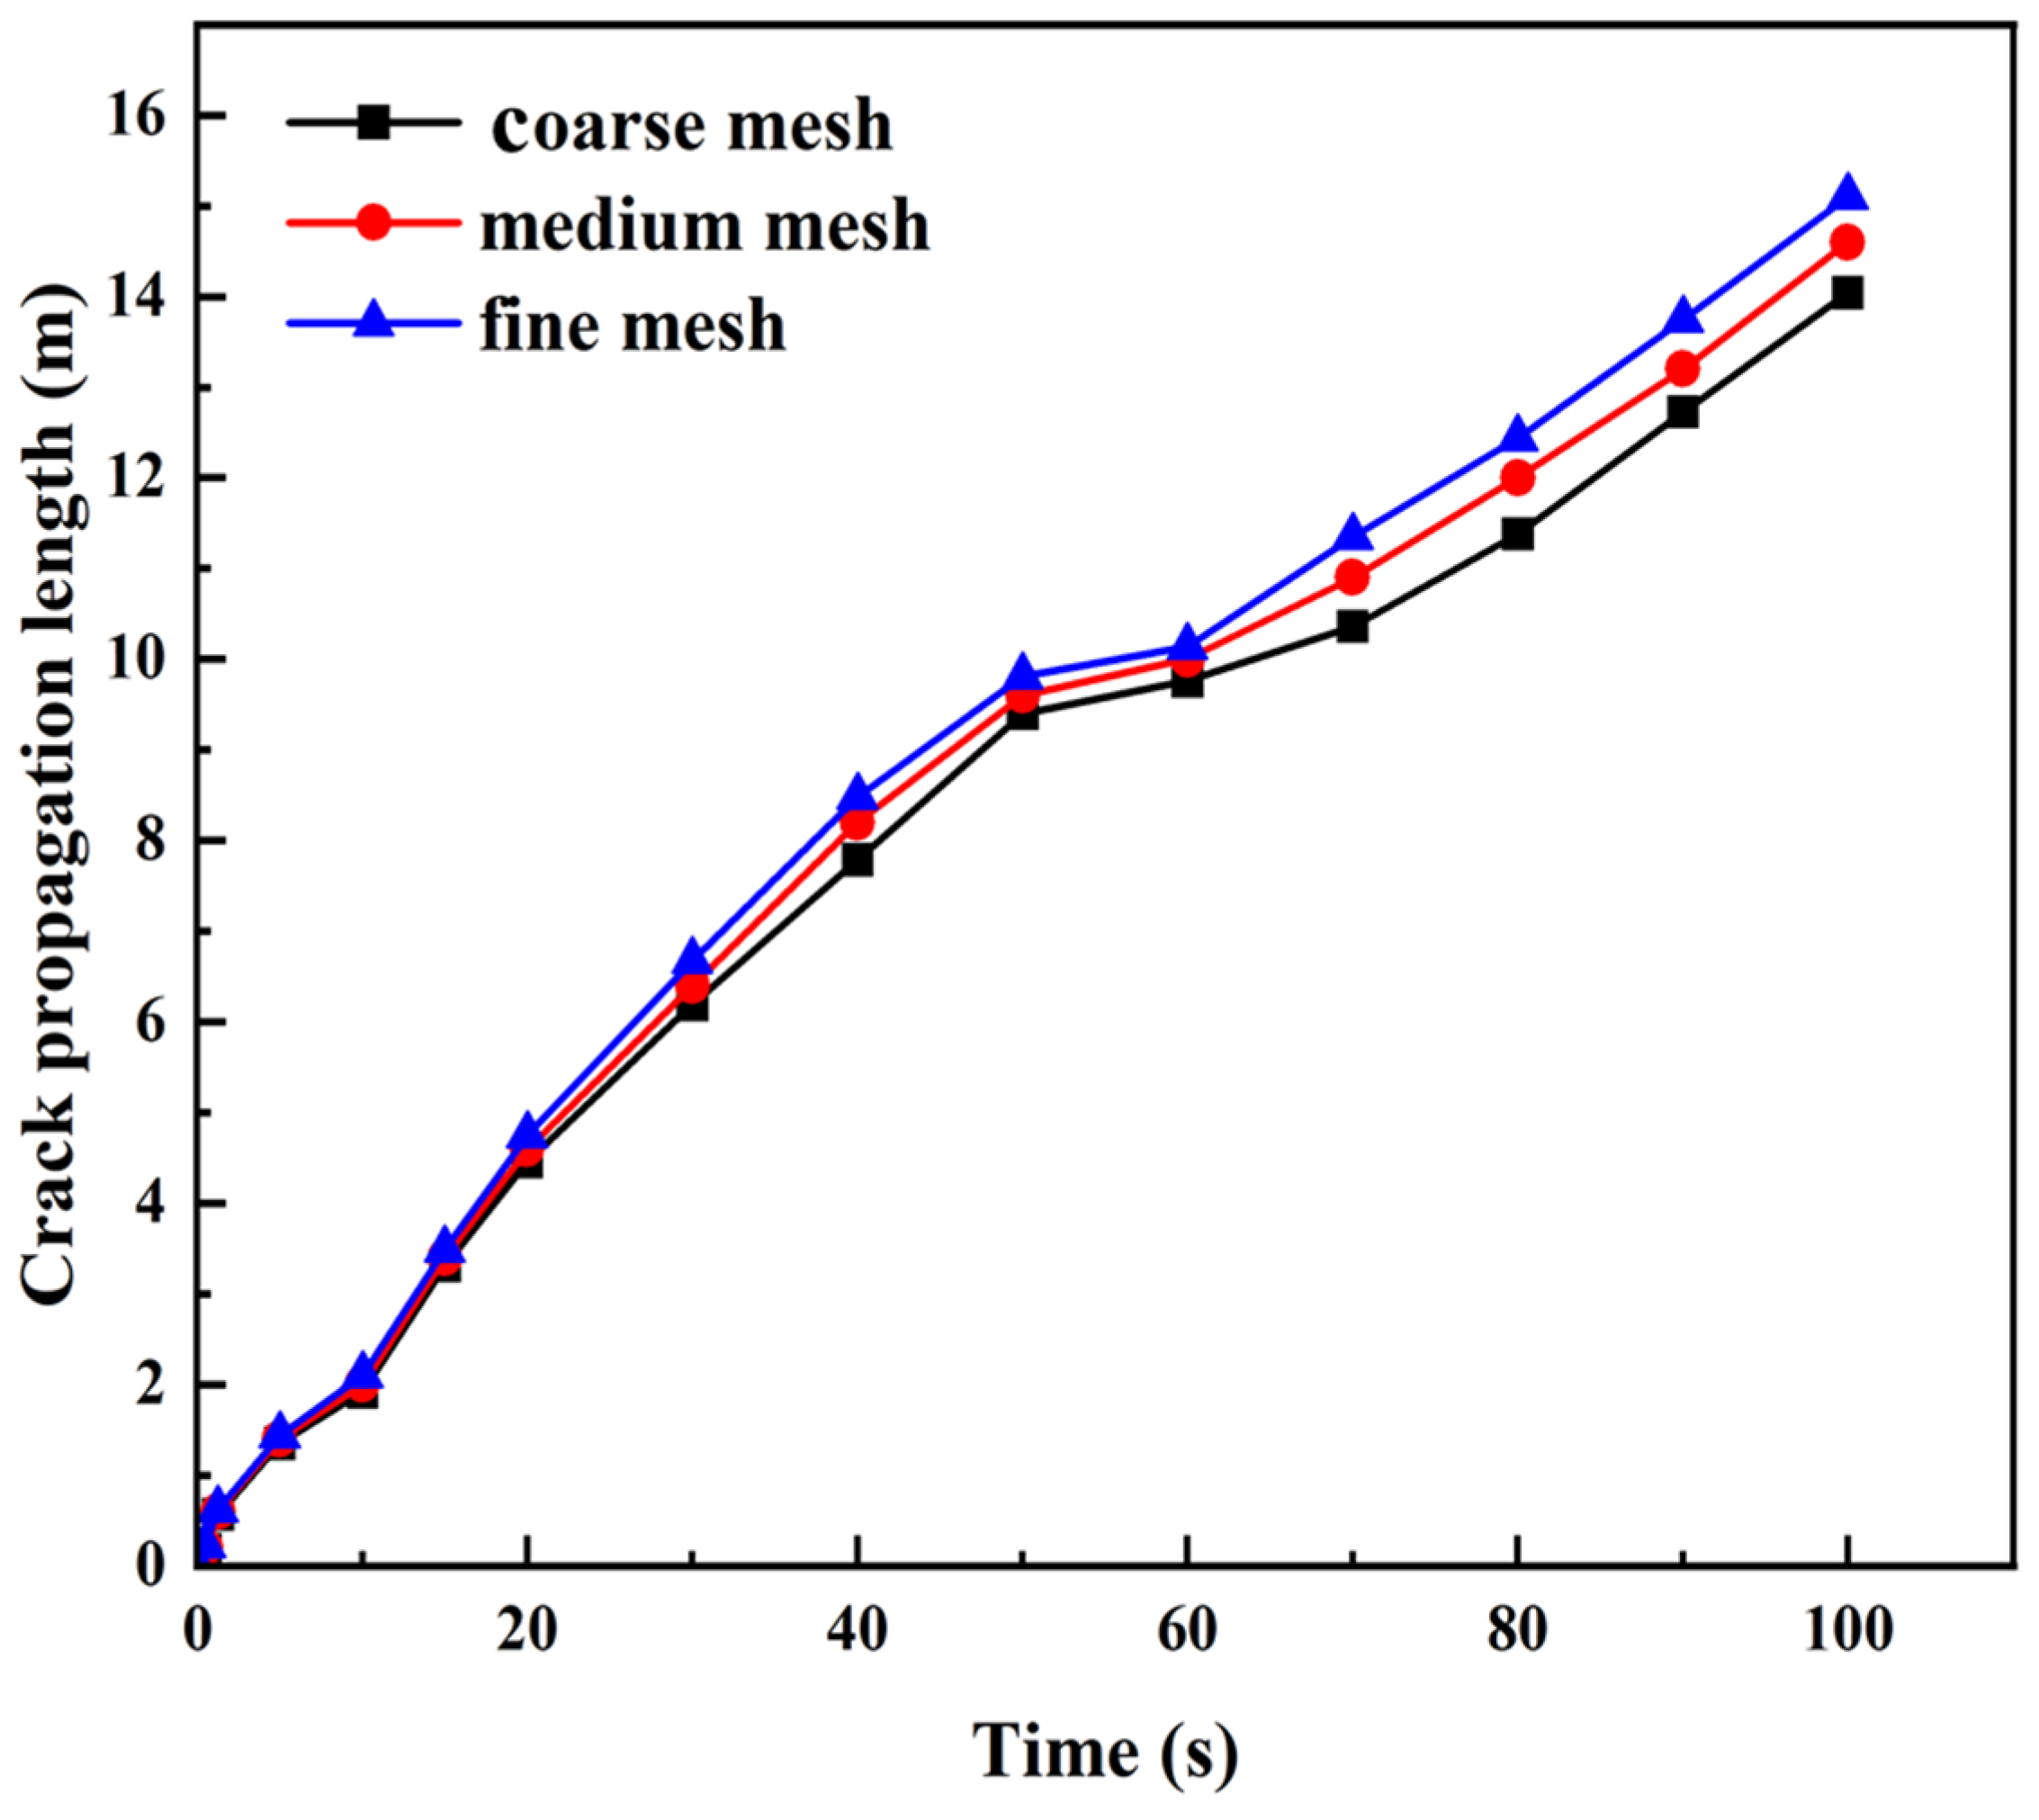
4.4. Mesh Sensitivity Analysis

To ensure the accuracy and reliability of the numerical simulation results, a mesh sensitivity analysis was conducted in this study, with a particular emphasis on the influence of mesh size on crack propagation length. Given that crack propagation is highly sensitive to mesh resolution—especially in cohesive zone models—accurate mesh discretization is a critical factor in ensuring simulation precision. Accordingly, multiple mesh refinements were performed to evaluate the impact of different mesh sizes on the simulation results.
In the mesh sensitivity analysis, an initial coarse mesh with an element size of 8 mm was selected, and the mesh was progressively refined in the crack propagation region. The objective of mesh refinement was to ensure consistency in crack path predictions across different mesh sizes, particularly in stress concentration zones where cracks initiate and propagate. Three levels of mesh discretization were adopted: coarse (8 mm), medium (6 mm), and fine (4 mm) element sizes. The effect of mesh refinement on the predicted crack length was evaluated by comparing simulation results under different mesh conditions, as illustrated in Figure 8.
The comparison between the coarse and fine meshes showed that the variation in crack length under different mesh sizes was less than 5%. Specifically, when the mesh size was refined from 8 mm to 6 mm, the crack length increased by approximately 3.99%. Further refinement to 4 mm resulted in an additional increase of 3.42%. These variations indicate that the influence of mesh size on crack propagation length is minimal, with changes remaining within 5%.
To ensure the accuracy and stability of the simulation, a mesh size of 4 mm was ultimately adopted for the main analyses. This mesh sensitivity study confirms the robustness of the model and ensures the reliability of the crack propagation simulations.

5. Results and Discussion

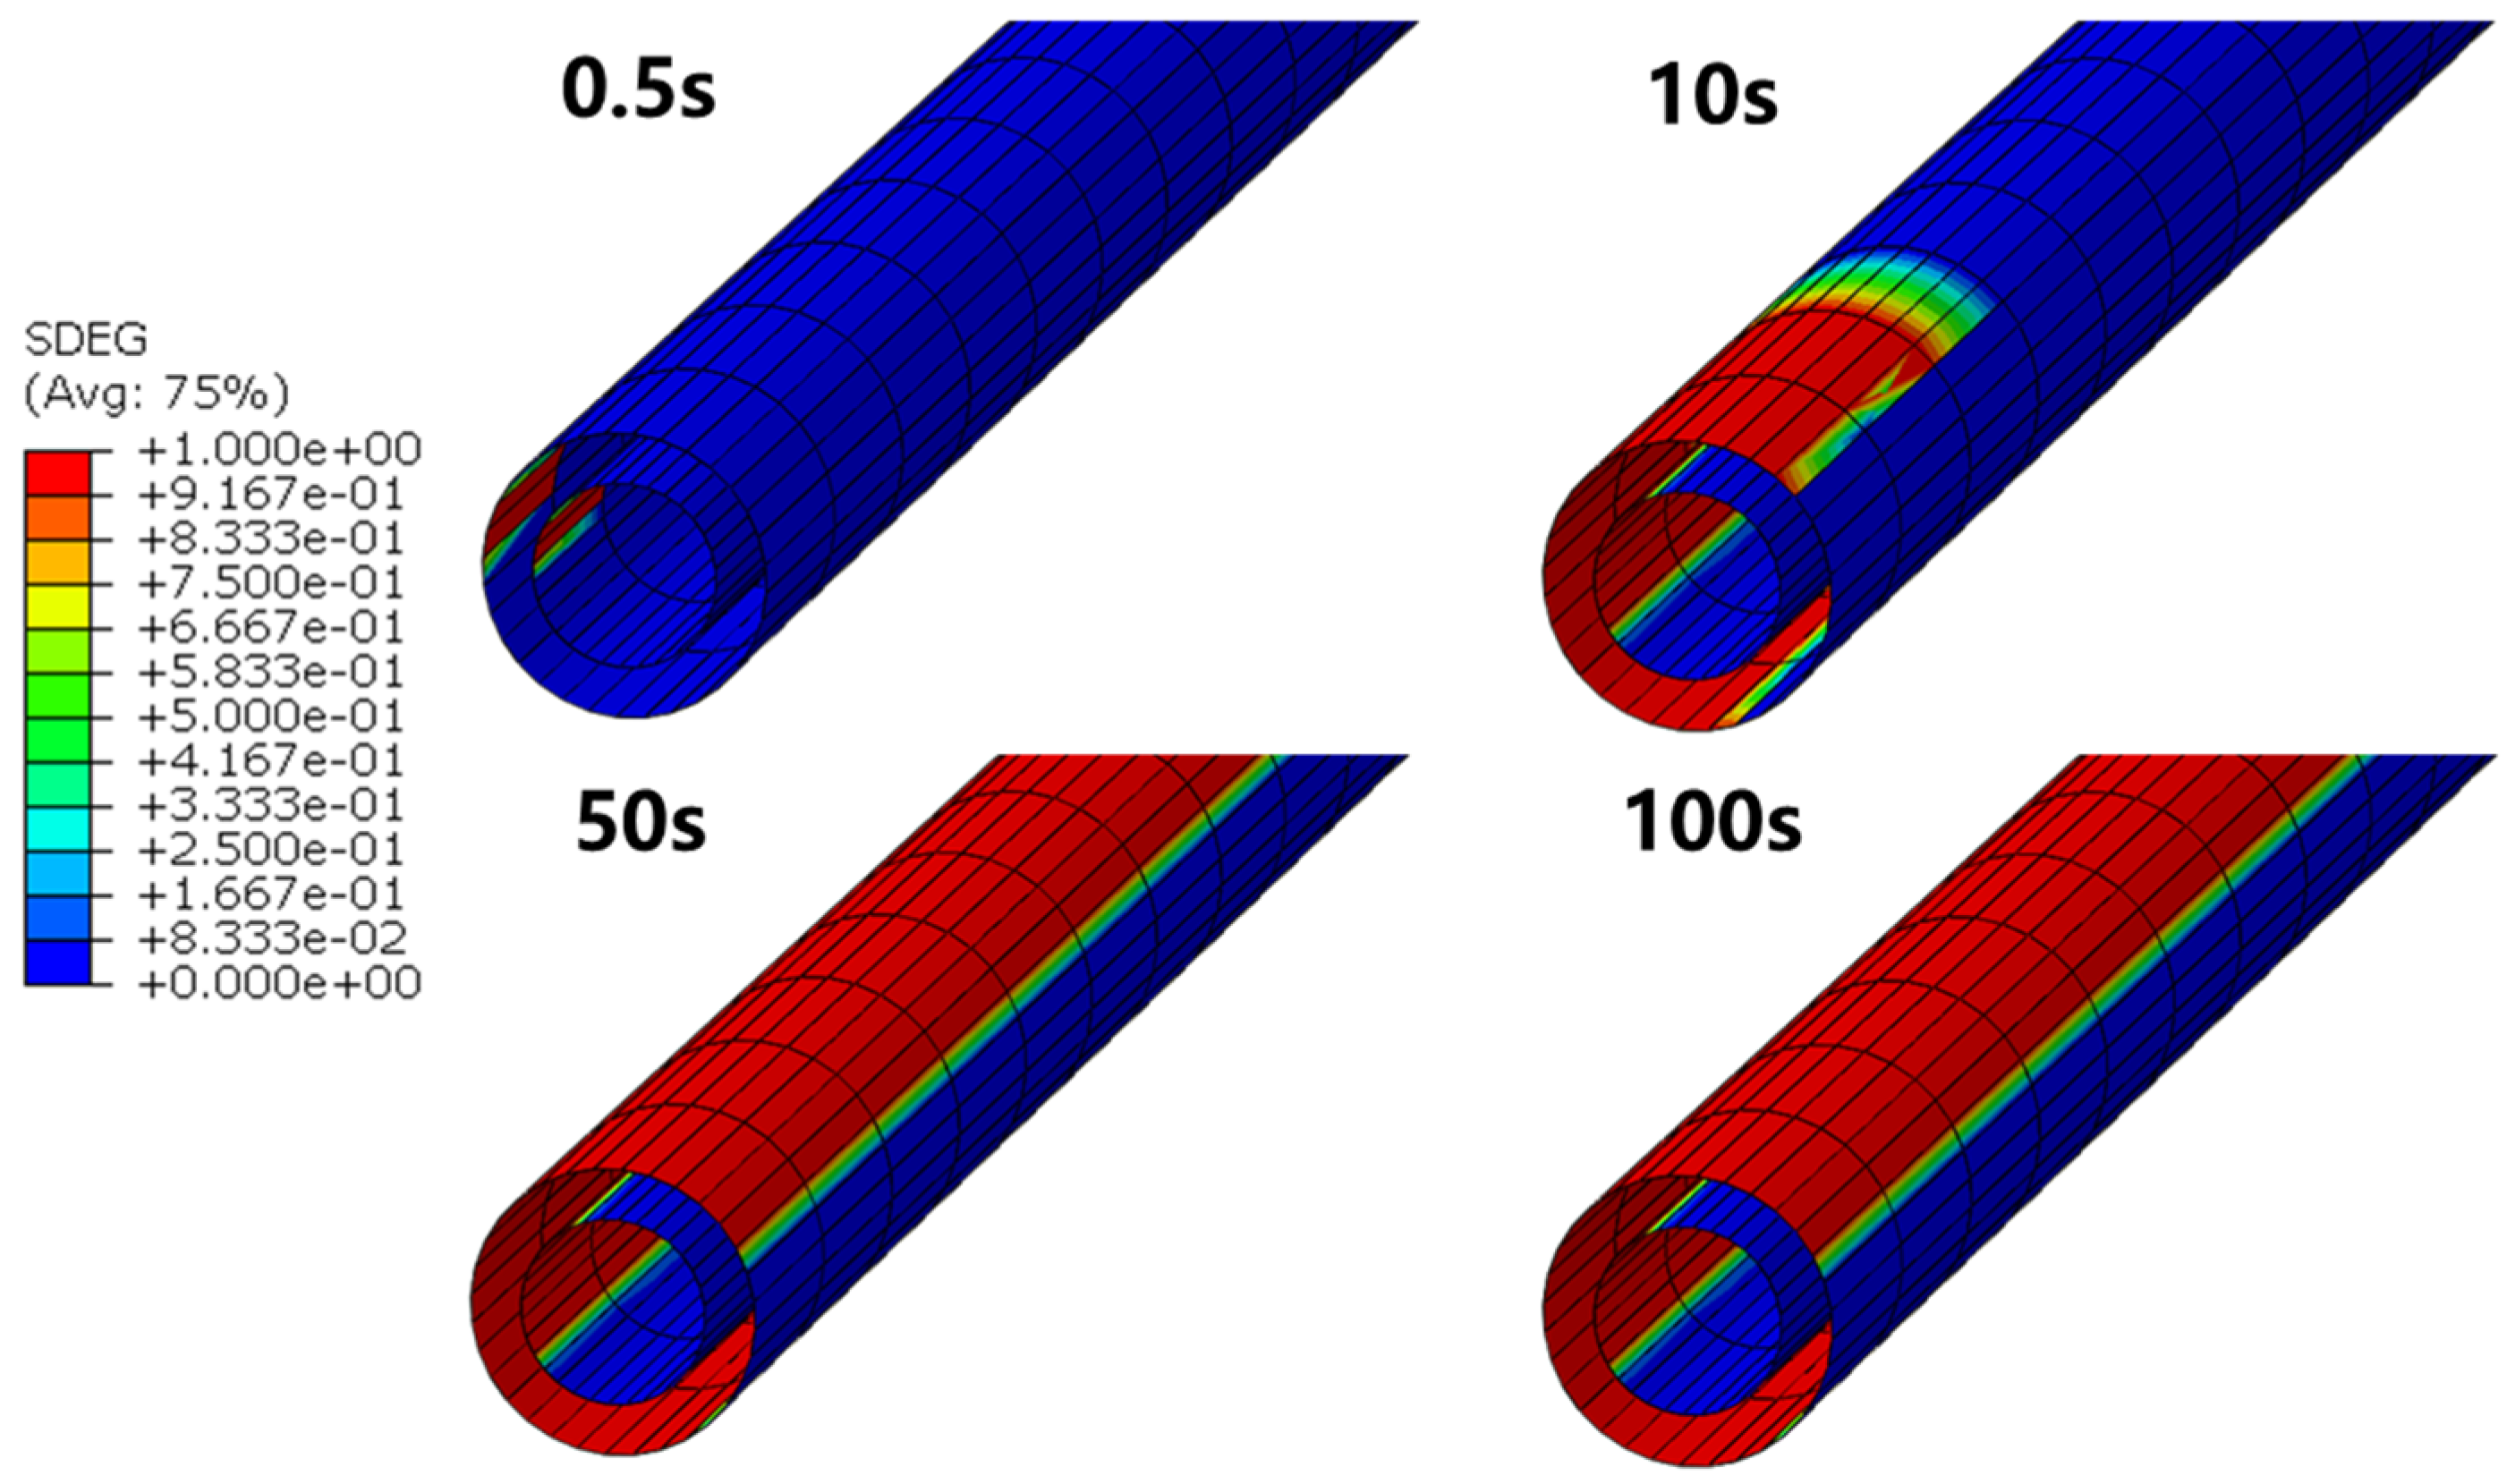
5.1. Cement Sheath Interface Crack Propagation Characteristics

This study of cement sheath interface crack propagation evolution during hydraulic fracturing primarily focuses on analyzing the expansion characteristics of interface cracks along the axial and circumferential directions of the cement sheath. Figure 9 and Figure 10 display the expansion characteristics of the cement sheath interface cracks along the axial and circumferential directions at different time intervals. During the fracturing process, as the high-pressure fracturing fluid enters the cement sheath interface, the injection point pressure increases, causing damage to the cohesive zone elements, which then begin to propagate along both the axial and circumferential directions of the cement sheath. When the SDEG value is between 0 and 1, this indicates that the element has experienced damage but is not fully damaged. When the SDEG value reaches 1, this indicates complete damage to the element.
In the initial stage of fluid injection, the initial damage first occurs along the circumferential direction of the cement sheath. As the injection time increases from 0.5 s to 10 s, cracks at interface I rapidly propagate in the axial direction, with the crack length being significantly greater than that at interface II. The crack at interface II expands rapidly in the circumferential direction, with a much larger propagation angle than at interface I. Between 10 s and 50 s, the crack continues to propagate quickly in the axial direction, while the circumferential expansion angle at interface I remains relatively stable. Interface II expands at a higher rate. From 50 s to 100 s, the axial propagation rates of the interface cracks significantly decrease, and the circumferential crack propagation essentially ceases.

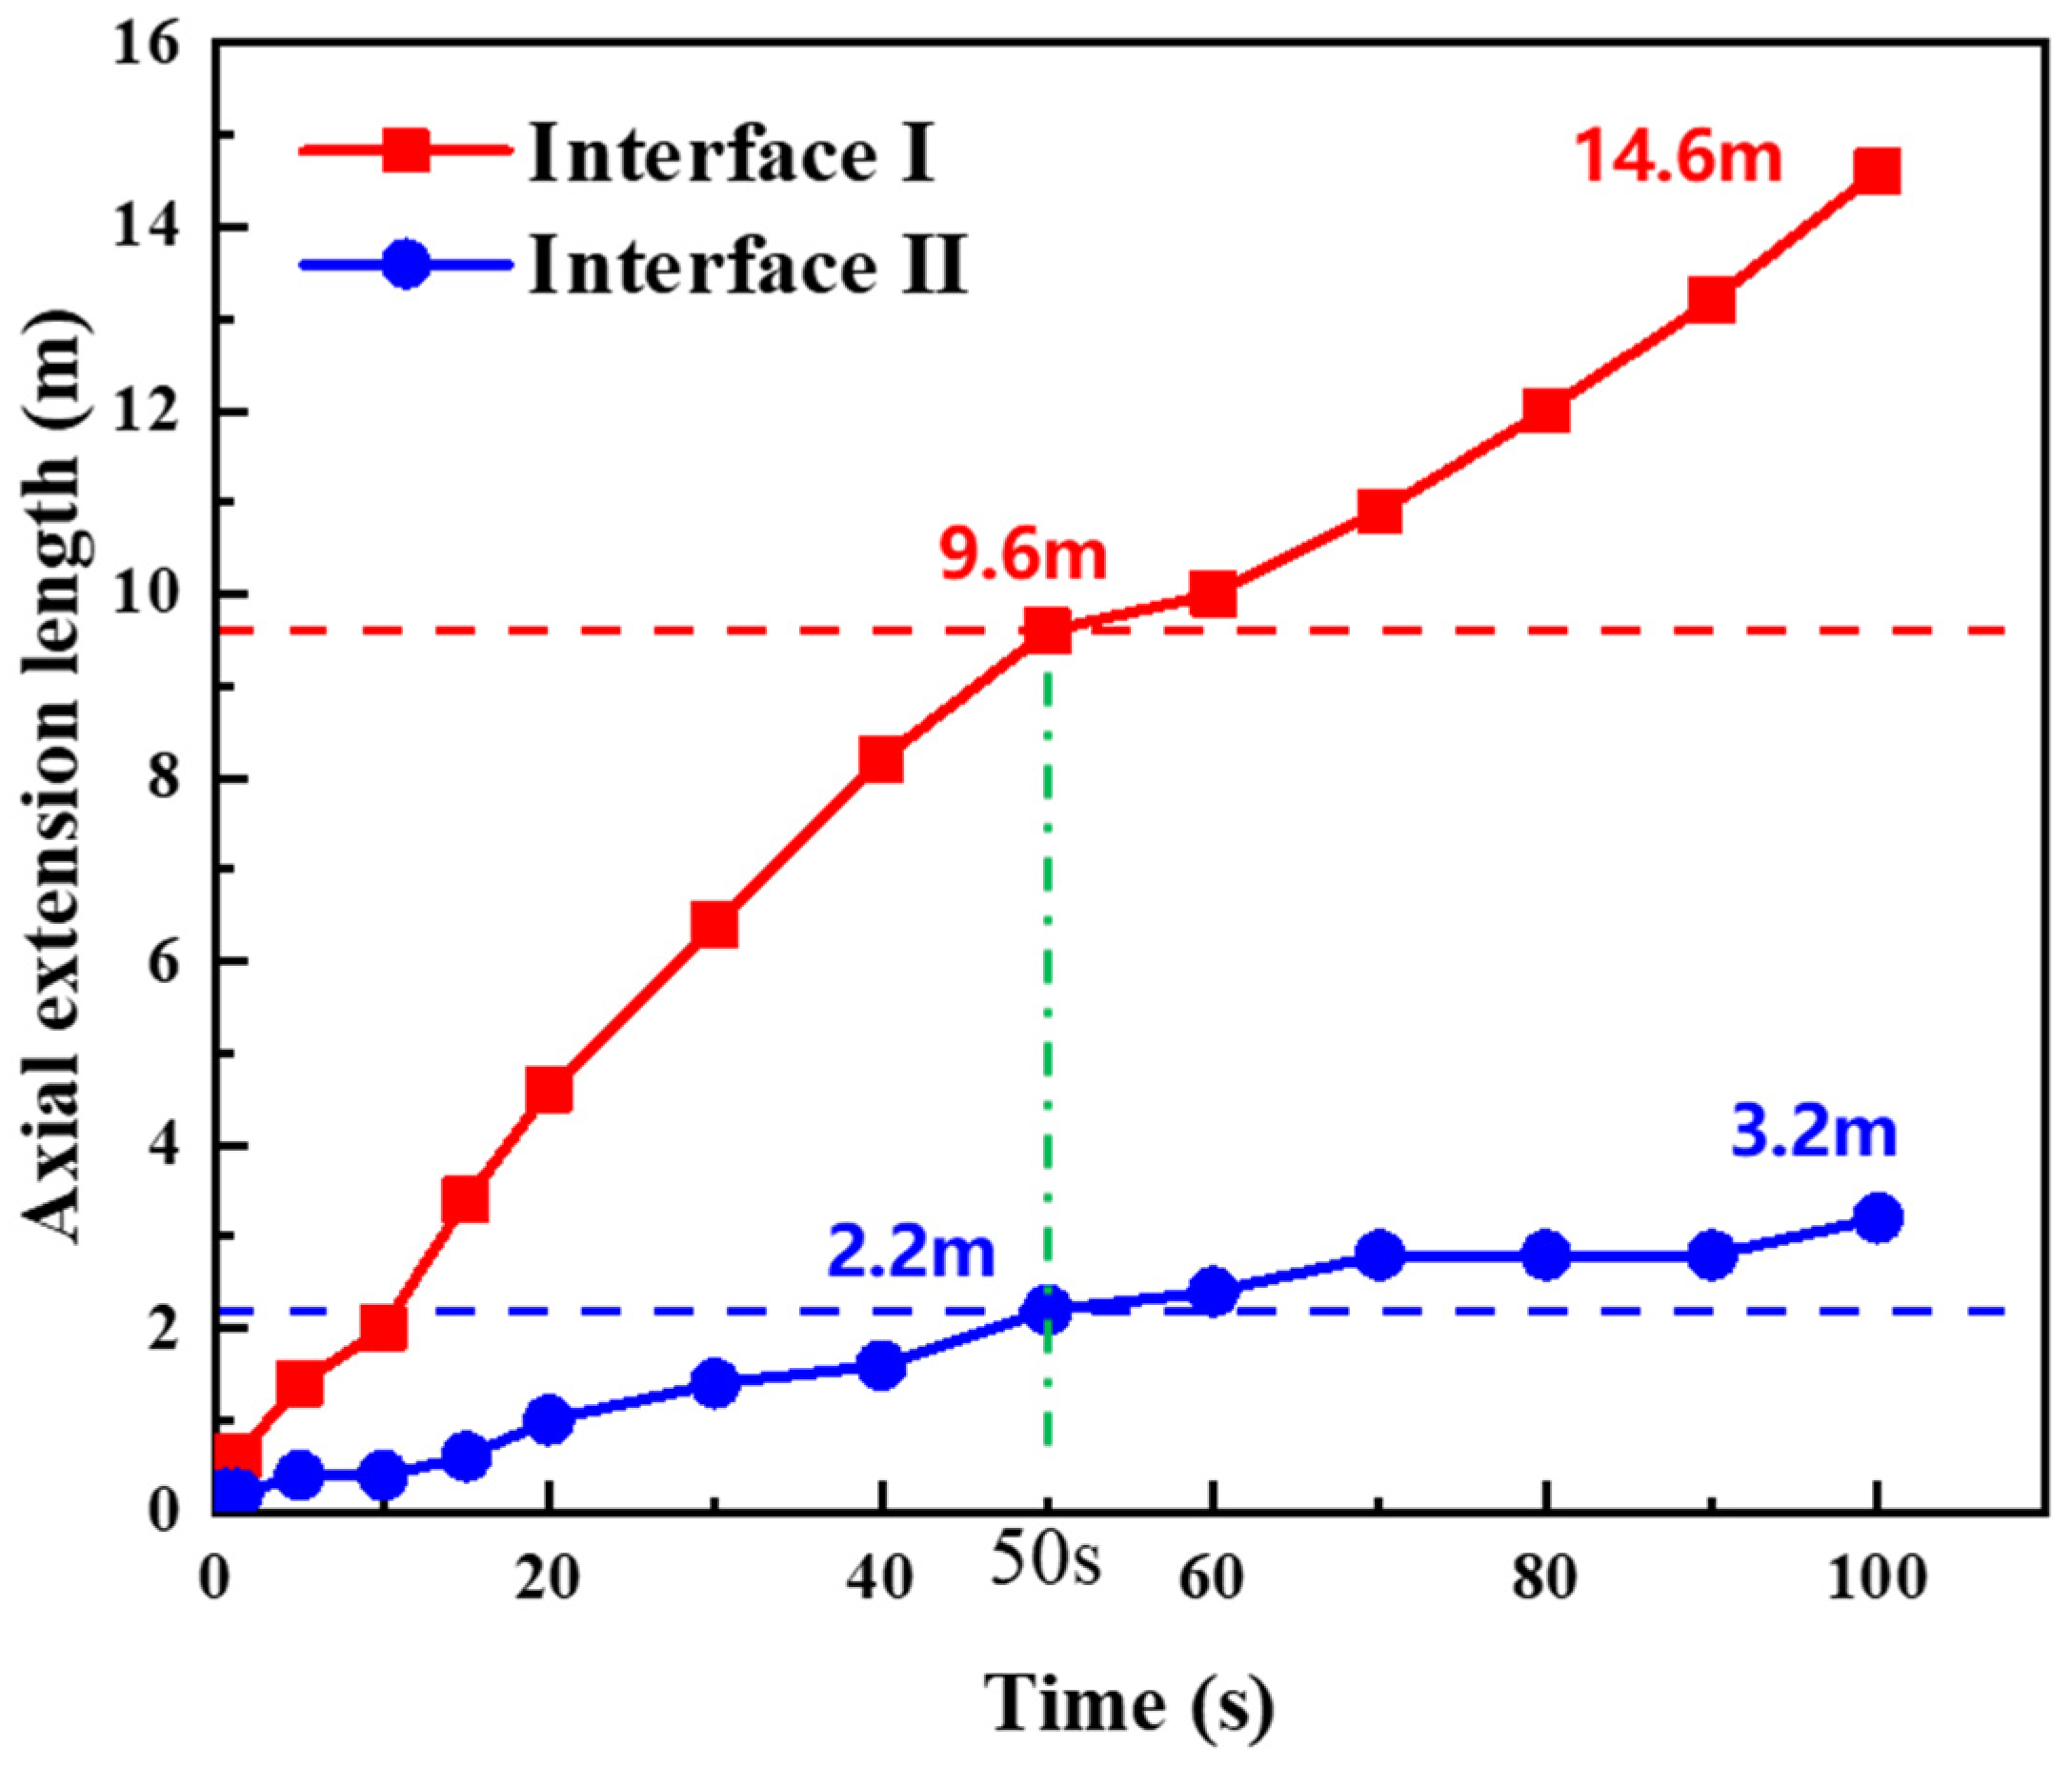
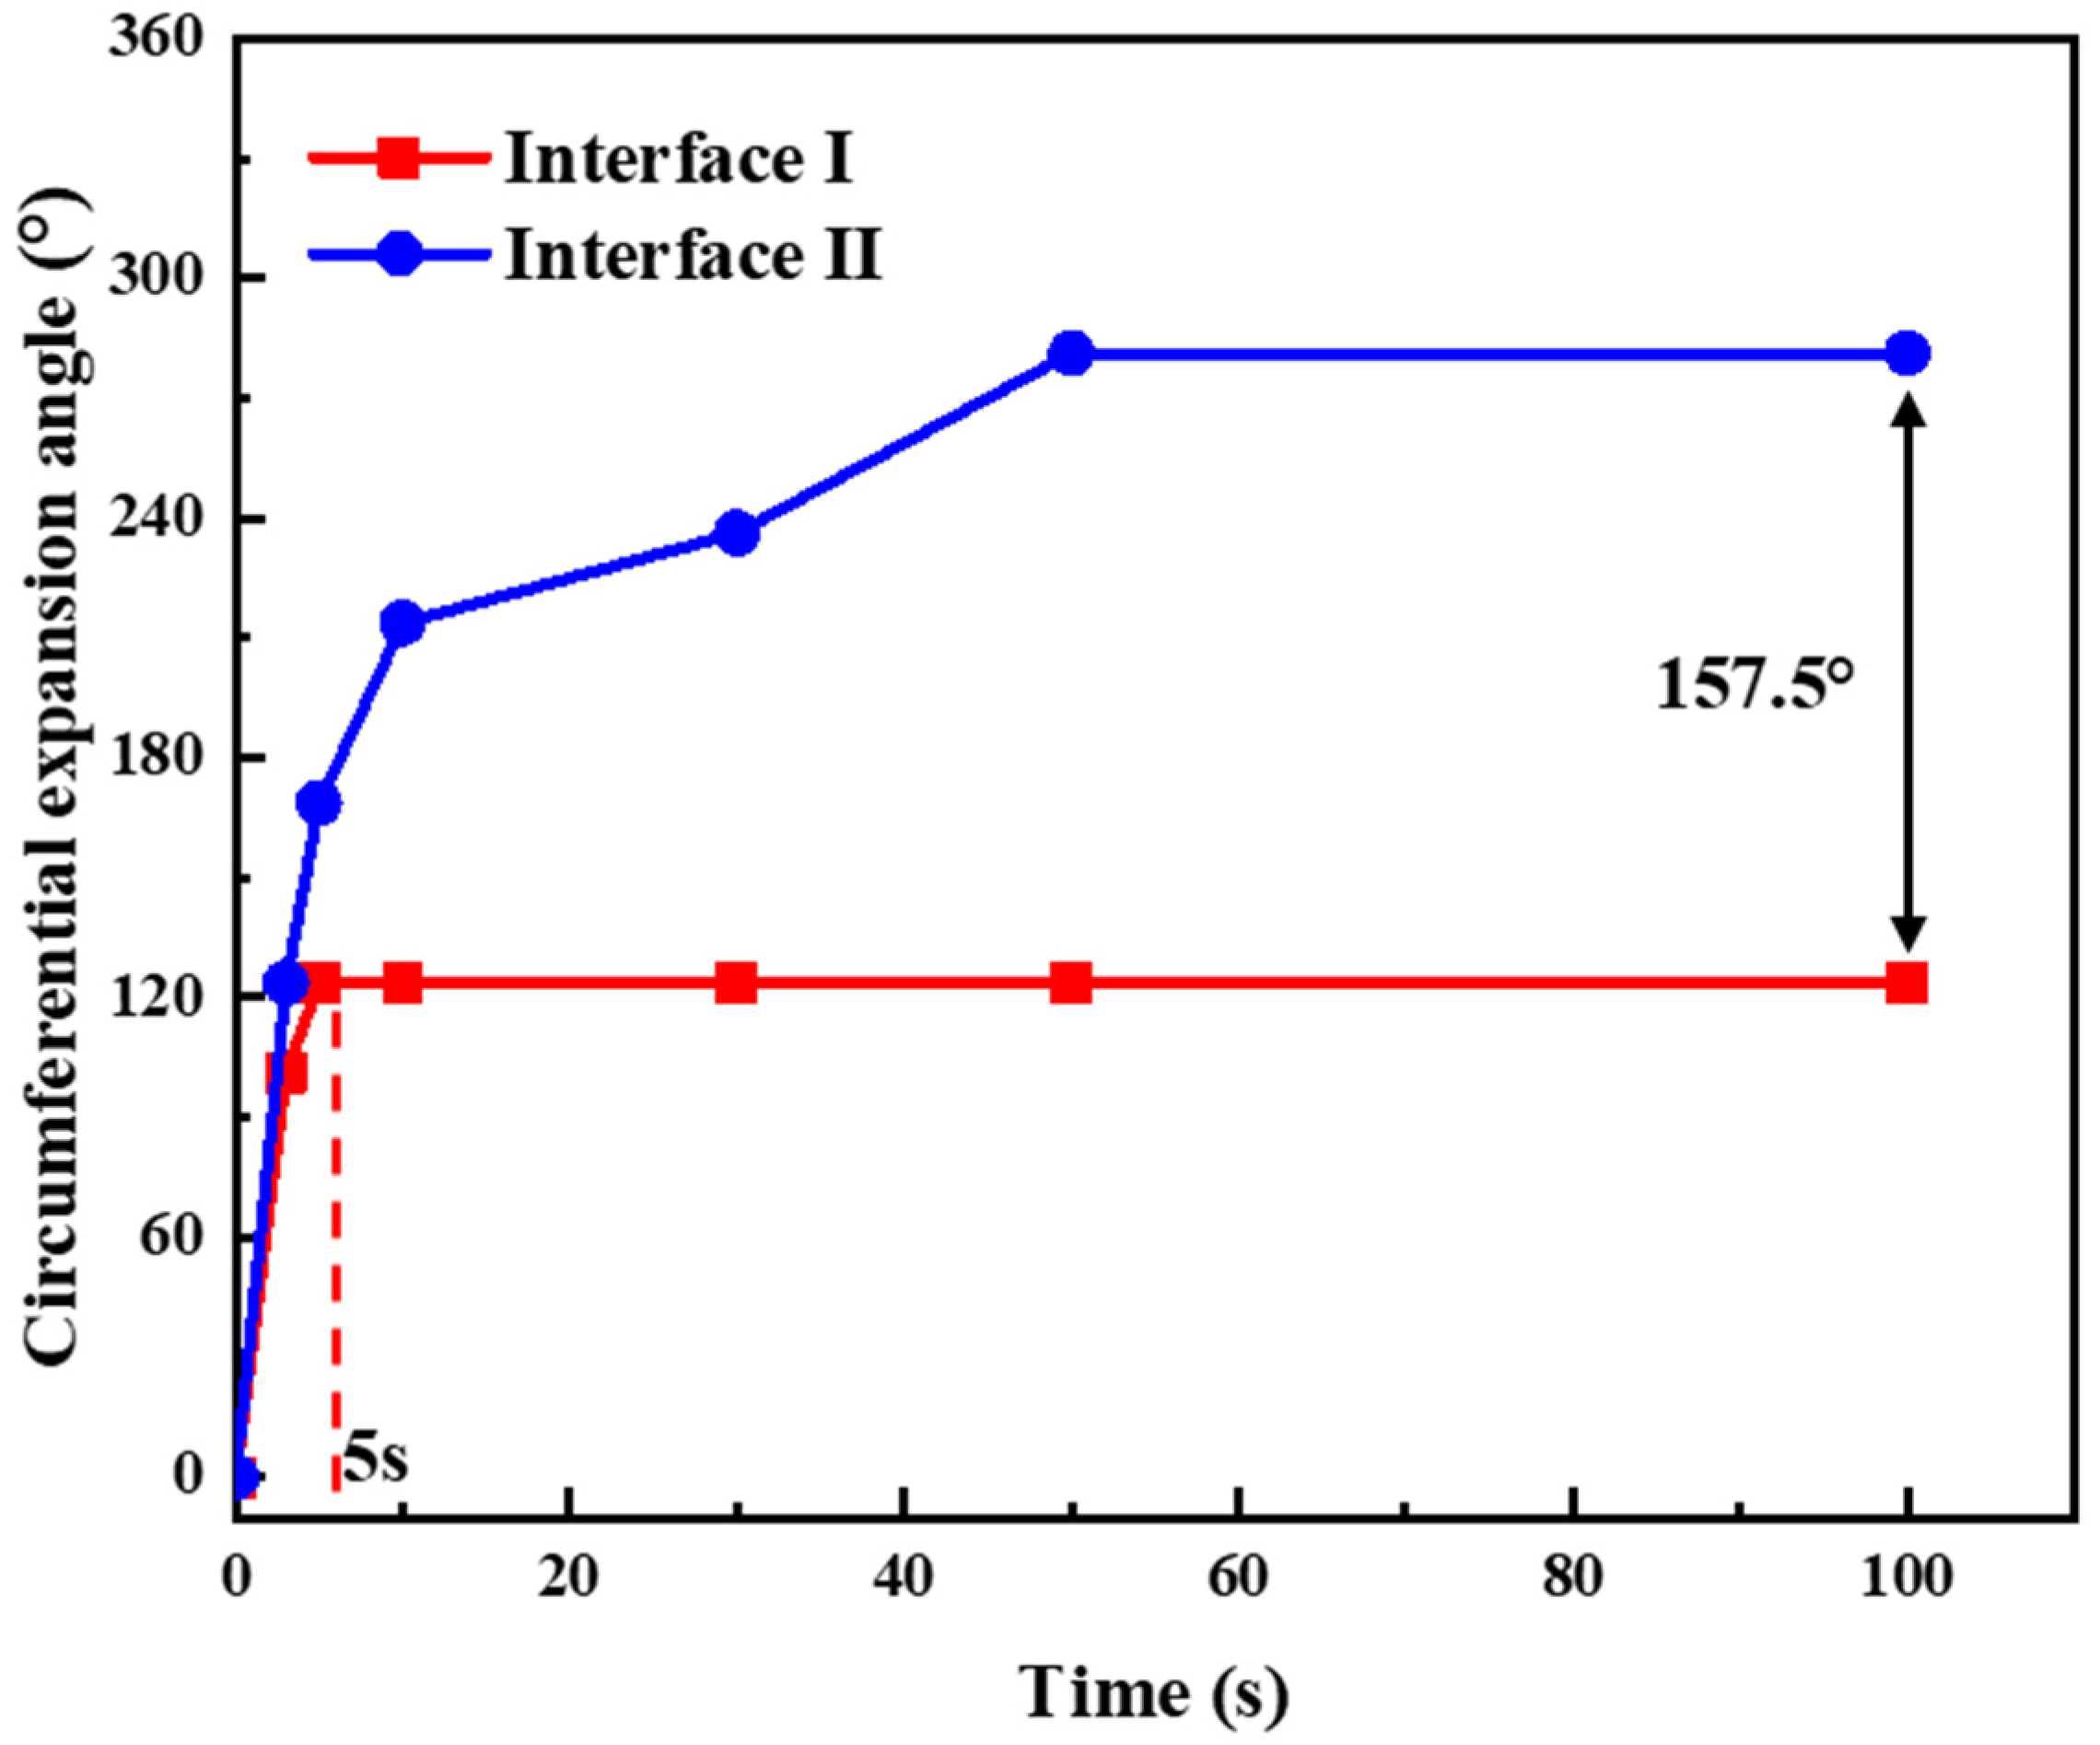
5.2. Cement Sheath Interface Crack Propagation Law

To analyze the crack propagation law of the cement sheath interface during the fracturing process, the axial crack propagation length and circumferential propagation angle at cement sheath interfaces I and II during fluid injection were extracted and compared, as shown in Figure 11 and Figure 12.
From Figure 11, it can be observed that, in the axial direction, the crack propagation rate and final propagation length at interface I are significantly greater than those at interface II. Between 0 s and 50 s, the crack propagation rate is relatively fast, with interface I reaching an expansion length of 9.6 m while interface II reaches 2.2 m. After 50 s, the crack propagation rate decreases, and at the end of the simulation (100 s), the axial crack propagation lengths at interfaces I and II reach 14.6 m and 3.2 m, respectively.
According to Figure 12, during the initial stage of fracturing fluid injection, the cement sheath interface cracks expanded rapidly in the circumferential direction, with interface II exhibiting a higher expansion rate. Within the first 0–5 s, the circumferential expansion angles at interfaces I and II reached 123.75° and 168.75°, respectively. Subsequently, the expansion of interface I in the circumferential direction halted, while interface II continued to expand at a higher rate. At 10 s, the expansion angle reached 213.75°. After 10 s, the circumferential expansion rate of interface II decreased, and between 10 and 50 s, the expansion angle increased from 213.75° to 281.25°, with an increase of 67.5°. After 50 s, the interface II crack stopped expanding circumferentially. At the end of the calculation, the circumferential expansion angle of interface II was 157.5° greater than that of interface I.
Based on the numerical simulation results of crack propagation along interfaces I and II during hydraulic fracturing, combined with experimental observations and bonding strength test results, the following conclusions can be drawn: Interface I, formed between the cement and metal materials, primarily exhibits physical bonding. When the normal or shear stress exceeds the interfacial strength, micro-cracks initiate at the interface, leading to interfacial debonding. During subsequent crack propagation, local shear slippage occurs along the interface, ultimately resulting in the complete failure of the interfacial bonding structure. In contrast, interface II, formed between cement and shale, may exhibit mechanical interlocking due to the inherent porosity and adsorptive properties of shale, which allow for the partial infiltration of cement hydration products into the shale surface. During crack propagation, this interface may experience pore-scale shear failure, followed by complex evolutionary processes such as interfacial rupture, delamination, and slippage along weak shale planes as stress concentrations develop. These micro-scale mechanisms help to explain the observed macroscopic behavior: axial crack propagation is more pronounced along interface I, while circumferential failure is more likely to occur along interface II. Similar findings have been reported by Feng [31] and Li Chengsong [41], who also demonstrated that interfaces with higher bonding strengths exhibited greater resistances to crack propagation.

5.3. Sensitivity Analysis

5.3.1. Mechanical Properties of Cement Sheath

(1)
Elastic Modulus
The elastic modulus of the cement sheath is one of the key factors influencing its sealing integrity. Therefore, the study of the impact of a cement sheath’s elastic modulus on interface crack propagation is crucial. Figure 13 illustrates the effect of the elastic modulus on interfacial crack propagation in cement sheaths. From the figure, it is evident that, in the axial direction, as the elastic modulus of the cement sheath increases, the propagation length of the cracks at both interfaces I and II generally decreases. This is consistent with the findings of Li et al. [29], and it can be observed that the crack propagation length at interface I is more significantly influenced by the cement sheath’s elastic modulus. When the elastic modulus exceeds 8 GPa, the declining trend in the crack propagation length at interface I becomes less pronounced. As the elastic modulus increases from 6 GPa to 9 GPa, the crack length at interface I decreases from 18.2 m to 14.6 m, a reduction of 3.6 m, while the crack length at interface II decreases by 0.6 m. The elastic modulus of the cement sheath has a relatively minor effect on the circumferential propagation angle of the interface cracks. As the elastic modulus increases from 6 GPa to 9 GPa, there are some fluctuations in the propagation angles of the cracks at both interfaces, with the maximum deviation being 11.25°.
Therefore, increasing the elastic modulus of the cement sheath helps to mitigate the axial expansion of the interface cracks. However, during multistage fracturing, under the influence of high casing pressure, an increase in the elastic modulus of the cement sheath can lead to an increase in radial stress and circumferential tensile stress. This may cause the tensile failure of the cement sheath or the formation of micro-annuli at interface I, resulting in the loss of the cement sheath’s sealing integrity [42]. Consequently, in field applications, elastic particles or fibers are often added to the cement slurry system to reduce the elastic modulus of the cement sheath and ensure its sealing integrity.
Considering that the addition of toughening materials to the cement slurry system can lead to the formation of initial defects in the cement stone, according to research by Guo et al. [43], when materials such as fibers and elastic particles are added to the cement slurry, initial damage forms inside the cement stone, resulting in a decrease in its elastic modulus, as shown in Table 4. Figure 14 presents the compressive stress–strain curves of cement stone under different cement slurry system conditions. It can be observed that when the elastic modulus of the cement stone is lower, its strength threshold to undergoing plastic deformation also decreases. During multiple cycles of loading, this can lead to the plastic deformation of the cement sheath, causing the formation of micro-annuli at interface I, which means that the sheath cannot meet the requirements of multistage fracturing operations in horizontal wells. Based on the above analysis, the design of the cement slurry should be optimized and adjusted according to the field construction requirements to meet the mechanical parameters of the cement sheath. The elastic modulus of the cement slurry system should be controlled around 7–8 GPa, while toughening materials can be selectively added to reduce the risk of micro-annuli formation at interface I of the cement sheath under cyclic loading.
(2)
Poisson’s Ratio
The Poisson ratios of the cement sheaths were set to 0.15, 0.16, 0.17, 0.18, and 0.19 in order to analyze the effect of Poisson’s ratio variation on crack propagation at the cement sheath interface, as shown in Figure 15. As seen in the figure, in the axial direction, the crack propagation at both interfaces I and II decreases as Poisson’s ratio increases. When Poisson’s ratio increases from 0.15 to 0.19, the axial extension length at interface I decreases from 15.8 m to 14.2 m, a reduction of 1.6 m, while the axial extension length at interface II decreases from 3.6 m to 3.2 m, a reduction of 0.4 m. In the circumferential direction of the cement sheath, the variation in Poisson’s ratio has a minimal effect on the circumferential propagation angle at both interfaces. Only when the Poisson’s ratio is 0.19 does the propagation angle at interface II experience a slight decrease. Therefore, Poisson’s ratio in cement sheaths mainly affects the axial extension length of the interface cracks, with the greatest impact on interface I.

5.3.2. Casing Pressure

Figure 16 illustrates the crack propagation patterns at interfaces I and II of the cement sheath under different casing internal pressure conditions and fluid injection times. As shown in Figure 15a, with the increase in casing internal pressure, the axial extension lengths of the cracks at both interfaces show a continuous increase. This is because the increased casing internal pressure leads to higher flow rates and volumes of the fracturing fluid infiltrating the cement sheath interface, which in turn causes the crack propagation lengths to increase. Since the normal bonding strength at interface I is relatively low, the axial crack propagation length at interface I is more significantly affected by the casing internal pressure. When the casing internal pressures are 70 MPa, 73 MPa, and 76 MPa, the axial crack extension lengths at interface I are 14.6 m, 15.6 m, and 18.2 m, respectively, showing a continuous increase, while the crack extension lengths at interface II are 3.2 m, 3.6 m, and 4.0 m, with a smaller increase.
In the circumferential direction, as the casing internal pressure increases, the difficulty of circumferential crack propagation at the cement sheath interface increases. Figure 15b shows that during the first 0–10 s of fluid injection, cracks at both interfaces rapidly propagate circumferentially. After that, the propagation angle at interface I remains unchanged with increasing injection time, while the circumferential propagation rate at interface II decreases and stabilizes after 50 s. When the tangential bonding strength at the cement sheath interface is high, such as at interface I, the casing internal pressure has no impact on the circumferential propagation angle, and the maximum extension angle is 123.75°. When the tangential bonding strength is low, such as at interface II, the circumferential extension angle gradually decreases with the increase in casing internal pressure. When the casing internal pressure increases from 70 MPa to 76 MPa, the maximum extension angle at interface II decreases from 281.25° to 236.25°, a reduction of 45°.
Considering the influence of casing internal pressure on interfacial crack propagation in both the axial and circumferential directions, it is recommended that, during field operations, the pumping pressure be appropriately reduced to lower the internal casing pressure. This reduction can decrease the invasion rate of fracturing fluid along the interface, thereby limiting the axial propagation length of interfacial cracks in the cement sheath. Such a measure can help mitigate the risk of inter-cluster or inter-wellbore segment fluid migration in horizontal wells.

5.3.3. Formation Elastic Modulus

To further improve the single-well production of shale oil wells, the length of the horizontal section is continuously being increased. Considering the complex heterogeneous combination characteristics of the horizontal section reservoir, the geomechanical properties at different locations along the horizontal section vary. Therefore, it is essential to analyze the effect of the formation elastic modulus on crack propagation at the cement sheath interface, as shown in Figure 17.
In the axial direction, with a formation elastic modulus of 32 GPa as the boundary, the crack propagation lengths at interfaces I and II of the cement sheath initially increase and then decrease as the formation elastic modulus increases, with maximum variations of 1.4 m and 0.4 m, respectively. In the circumferential direction, the formation elastic modulus has a minimal effect on the circumferential propagation angle of the interface cracks. Only when the formation elastic modulus is 32 GPa does the crack propagation angle at interface II decrease, by a total of 11.25°. Therefore, the formation elastic modulus is not the primary influencing factor for crack propagation at the cement sheath interface.

6. Future Work

This study investigates the fundamental mechanisms of interfacial crack propagation in cement sheaths, with a focus on the effects of bonding strength heterogeneity. However, certain simplifications were made, and future research can further expand and improve on our model in the following aspects:
The current model does not account for fluid loss due to fracturing fluid infiltration along the interface or into the matrix. Future work should incorporate the Carter leak-off model or modified flow equations, integrating the coupled mechanisms of pore pressure, stress fields, and crack propagation. This will allow for a more accurate representation of how fluid pressure distribution within the crack influences its propagation path. To better understand the influence of interfacial bonding on crack behavior, advanced characterization techniques such as Scanning Electron Microscopy (SEM), Energy-Dispersive X-ray Spectroscopy (EDS), and CT imaging should be employed to observe the infiltration, bonding, or mechanical interlocking of cement hydration products at the interface. This will address current limitations that come from relying primarily on mechanical responses for inference. In terms of cement slurry formulation, future research should systematically introduce various cement systems and additives (e.g., expansion agents, elastic particles, fibers) to evaluate how changes in material properties affect interfacial strength, crack morphology, and fluid migration risk. These efforts aim to provide practical guidance for cement slurry optimization in field applications.

7. Conclusions

(1)
The normal and tangential bonding strengths at interfaces I and II of the cement sheath were quantified. Due to the differences in the properties of shale and casing materials, as well as their bonding degree with the cement slurry, the normal bonding strength at interface II was higher, while the tangential bonding strength was lower.
(2)
The interface bonding strength significantly affects crack propagation at the cement sheath interface. The crack propagation rate and length at interface I are both greater than at interface II in the axial direction. However, cracks at interface II are more likely to propagate circumferentially, with the propagation angle increasing rapidly in a short time.
(3)
Increasing the elastic modulus of the cement sheath helps to mitigate the axial crack propagation length at the interface. However, the impact of the elastic modulus on crack propagation, micro-annular gaps at the interface, and the tensile failure of the cement sheath should be considered comprehensively. It is recommended to control the elastic modulus of the cement sheath in the range of 7 to 8 GPa.
(4)
During hydraulic fracturing, appropriately reducing the construction pump pressure to lower the casing internal pressure can reduce the axial crack propagation length in the cement sheath and mitigate the risk of crossflow between stages and clusters.

Author Contributions

Writing—original draft, J.W. and X.W.; formal analysis, S.X. and Y.L.; data curation, Y.W. and Z.S.; funding acquisition, W.L.; methodology, X.Z.; validation, D.Y. All authors have read and agreed to the published version of the manuscript.

Funding

This paper was supported by the major science and technology project of PetroChina “Research on Technology for Increasing Reserves and Production and Exploration Development of Continental Shale Oil” (Project 5: “Key Technologies for Accelerating Drilling and Improving Quality in Continental Shale Oil” 2023ZZ15YJ05) and the National Natural Science Foundation of China’s Youth Science Fund project “Study on Quantitative Calculation Model of Fault Slip Induced by Multistage Fracturing and Casing Deformation Control Method in Shale Gas Well” (No. 52204018).

Data Availability Statement

The original contributions presented in this study are included in the article. Further inquiries can be directed to the corresponding author.

Conflicts of Interest

Authors Jiwei Wu, Xuegang Wang, Shiyuan Xie, Yanxian Wu, Yilin Li, Zhenhui Shu and Dandan Yuan were employed by the company Oil Extraction Technology Research Institute of Xinjiang Oilfield Company. The remaining authors declare that the research was conducted in the absence of any commercial or financial relationships that could be construed as a potential conflict of interest. The company had no role in the design of the study; in the collection, analyses, or interpretation of data; in the writing of the manuscript, or in the decision to publish the results.

References

  1. Liu, Z.; Zhang, Y.; Liao, W.; Yang, B.; Yang, L.; Zhou, D. The Diffusion Law of Salt Ions in Shale Reservoirs and Its Application in Hydraulic Fracture Network Diagnostics. Xinjiang Oil Gas 2025, 21, 41–49. [Google Scholar]
  2. Chen, X.; Zhang, Y.; Luo, W.; Cai, Z.; Yu, W. Prediction Method and Prevention Measures for Casing Deformation of Horizontal Well in Volume Fracturing. Xinjiang Oil Gas 2025, 21, 61–68. [Google Scholar]
  3. Tian, Z.; Shi, L.; Qiao, L. Research of and countermeasure for wellbore integrity of shale gas horizontal well. Nat. Gas Ind. 2015, 35, 70–76. [Google Scholar]
  4. Zeng, D.; Yu, Z.; He, Q.; Liu, Q.; Shi, T. Research on safety assessment technology of sustained casing pressure in shale gas. J. Southwest Pet. Univ. (Sci. Technol. Ed.) 2019, 41, 146–154. [Google Scholar]
  5. Li, J.; Chen, M.; Liu, G.; Zhang, H. Elastic-plastic analysis of casing-concrete sheath-rock combination. Acta Pet. Sin. 2005, 26, 99–103. [Google Scholar]
  6. Chen, Z.; Cai, Y. Study on casing load in a casing-stratum system by elastoplastic theory. Pet. Explor. Dev. 2009, 36, 242–246. [Google Scholar]
  7. Li, Y.; Liu, S.; Wang, Z.; Yuan, J.; Qi, F. Analysis of Cement Sheath Coupling Effects of Temperature and Pressure in Non-Uniform in-situ Stress Field. In Proceedings of the SPE International Oil and Gas Conference and Exhibition in China SPE 2010, Beijing, China, 8–10 June 2010; p. 131878. [Google Scholar]
  8. Xu, H.; Zhi, Z.; Shi, T.; Xiong, J. Stress analysis of the cement sheath under both pressure and temperature. Pet. Drill. Tech. 2014, 42, 45–48. [Google Scholar]
  9. Nabipour, A.; Joodi, B.; Sarmadivaleh, M. Finite Element Simulation of Downhole Stresses in Deep Gas Wells Cements. In Proceedings of the SPE Deep Gas Conference and Exhibition SPE 2010, Manama, Bahrain, 24–26 January 2010; p. 132156. [Google Scholar]
  10. De Andrade, J.; Sangesland, S. Cement sheath failure mechanisms: Numerical estimates to design for long-term well integrity. J. Pet. Sci. Eng. 2016, 147, 682–698. [Google Scholar] [CrossRef]
  11. Arjomand, E.; Salimzadeh, S.; Mow, W.S.; Movassagh, A.; Kear, J. Geomechanical modelling of ground surface deformation induced by CO2 injection at In Salah, Algeria: Three wells, three responses. Int. J. Greenh. Gas Control 2024, 132, 104034. [Google Scholar] [CrossRef]
  12. Patel, H.; Salehi, S. Development of an advanced finite element model and parametric study to evaluate cement sheath barrier. J. Energy Resour. Technol. 2019, 141, 092902. [Google Scholar] [CrossRef]
  13. Boukhelifa, L.; Moroni, N.; James, S.G.; Le Roy–Delage, S.; Thiercelin, M.J.; Lemaire, G. Evaluation of Cement Systems for Oil and Gas Well Zonal Isolation in a Full-Scale Annular Geometry. In Proceedings of the SPE/IADC Drilling Conference and Exhibition SPE 2004, Kuala Lumpur, Malaysia, 13–15 September 2004; p. 87195. [Google Scholar]
  14. Li, J.; Li, Z.; Tang, S.; Sun, J.; Wu, H.; Su, D.; Chen, W. Mechanism for the promotional effect of a novel solidifiable spacer fluid system on the cementation quality of cement sheath/formation interface. Energy Sci. Eng. 2020, 8, 4212–4221. [Google Scholar] [CrossRef]
  15. Zhao, L.; Yang, H.; Wei, Y.; Bu, Y.; Jing, S.; Zhou, P. Integrity and Failure Analysis of Cement Sheath Subjected to Coalbed Methane Fracturing. Fluid Dyn. Mater. Process. 2023, 19, 329–344. [Google Scholar] [CrossRef]
  16. Chu, W.; Shen, J.; Yang, Y.; Li, Y.; Gao, D. Calculation of micro-annulus size in casing-cement sheath-formation system under conditions internal casing pressure change. Pet. Explor. Dev. 2015, 42, 379–385. [Google Scholar] [CrossRef]
  17. Liu, S.; Li, D.; Yuan, J.; Qi, F.; Shen, J.; Guo, M. Cement sheath integrity of shale gas well: A case study from the Sichuan Basin. Nat. Gas Ind. 2017, 5, 76–82. [Google Scholar] [CrossRef]
  18. Zeng, Y.; Liu, R.; Li, X.; Zhou, S.; Tao, Q.; Lu, P. Cement sheath sealing integrity evaluation under cyclic loading using large-scale sealing evaluation equipment for complex subsurface settings. J. Pet. Sci. Eng. 2019, 176, 811–820. [Google Scholar] [CrossRef]
  19. Xi, Y.; Jin, J.; Fan, L.; Guo, X.; Shen, J.; Li, J. Research on the establishment of gas channeling barrier for preventing SCP caused by cyclic loading-unloading in shale gas horizontal wells. J. Pet. Sci. Eng. 2022, 208, 109640. [Google Scholar] [CrossRef]
  20. Xi, Y.; Yao, Y.; Guo, X.; Li, J.; Tian, Y.; Liu, G. Failure evaluation mechanism of cement sheath sealing integrity under casing eccentricity during multistage fracturing. Pet. Sci. 2024, 21, 3428–3445. [Google Scholar] [CrossRef]
  21. Zhao, X.; Guan, Z.; Shi, Y.; Li, T.; Liao, H.; Jiang, J.; Sun, B. An assessment method for occurrence of micro-annular fractures on cementing interfaces of oil and gas well casing. J. China Univ. Pet. 2017, 41, 94–101. [Google Scholar]
  22. Guo, X.; Bu, Y.; Li, J.; Shen, Z.; Li, G.; Guo, A. The effect of mud cake on the bond strength of the second interface under varied temperatures. Drill. Fluid Complet. Fluid 2010, 27, 55–57+92. [Google Scholar]
  23. Plank, J.; Tiemeyer, C.; Buelichen, D.; Echt, T. A Study of Cement/Mudcake/Formation Interfaces and Their Impact on the Sealing Quality of Oilwell Cement. In Proceedings of the IADC/SPE Asia Pacific Drilling Technology Conference and Exhibition, SPE 2014, Bangkok, Thailand, 25–27 August 2014; p. 170452. [Google Scholar]
  24. Xu, B.; Lu, X.; Xie, Y. A new bonding strength measurement method for oil well cement sheath under high temperatures and high pressures. Nat. Gas Ind. 2016, 36, 65–69. [Google Scholar]
  25. Maagi, M.T.; Pin, G.; Jun, G. Influence of nano-TiO2 on the wellbore shear bond strength at cement-formation interface. Upstream Oil Gas Technol. 2020, 5, 100016. [Google Scholar] [CrossRef]
  26. Liu, H.; Bu, Y.; Liang, Y.; Guo, S.; Wang, Y. Device and method for evaluating the cementation property of cement-formation interface under disturbance. Res. Explor. Lab. 2020, 39, 78–83. [Google Scholar]
  27. Gu, J.; Yang, H.; Qin, W.; Zhang, Y.; Gao, Y. Evaluation method for isolation ability of cement-formation interface. Acta Pet. Sin. 2008, 29, 451–454. [Google Scholar]
  28. Guo, X.; Shen, Z.; Bu, Y.; Li, J. Research development of Cement Microannular and its solving methods. Drill. Prod. Technol. 2009, 32, 1–3+124. [Google Scholar]
  29. Opedal, N.; Todorovic, J.; Torsæter, M.; Vrålstad, T.; Mushtaq, W. Experimental study on the cement-formation bonding. In Proceedings of the SPE International Conference and Exhibition on Formation Damage Control SPE 2014, Lafayette, LA, USA, 26–28 February 2014; p. D021S010R006. [Google Scholar]
  30. Lecampion, B.; Bunger, A.; Kear, J.; Quesada, D. Interface debonding driven by fluid injection in a cased and cemented wellbore: Modeling and experiments. Int. J. Greenh. Gas Control 2013, 18, 208–223. [Google Scholar] [CrossRef]
  31. Feng, Y.; Li, X.; Gray, K.E. Development of a 3D numerical model for quantifying fluid-driven interface debonding of an injector well. Int. J. Greenh. Gas Control 2017, 62, 76–90. [Google Scholar] [CrossRef]
  32. Williams, H.; Khatri, D.; Keese, R.; Le Roy-Delage, S.; Roye, J.; Leach, D.; Rodriguez, J. Flexible, Expanding Cement System (FECS) Successfully Provides Zonal Isolation Across Marcellus Shale Gas Trends. In Proceedings of the SPE Canada Unconventional Resources Conference SPE 2011, Calgary, AB, Canada, 15–17 November 2011; p. 149440. [Google Scholar]
  33. Kim, J.; Moridis, G.J.; Martinez, E.R. Investigation of possible wellbore cement failures during hydraulic fracturing operations. J. Pet. Sci. Eng. 2016, 139, 254–263. [Google Scholar] [CrossRef]
  34. Li, Y.; Chen, Y.; Jin, J.; Jiang, L.; Ding, F.; Yuan, X. Cement ring interface crack propagation under volume fracturing in shale gas well. Acta Pet. Sin. 2017, 38, 105–111. [Google Scholar]
  35. Lian, W.; Li, J.; Liu, G.; Tao, Q. Numerical simulation of cement-to-formation interface debonding during hydraulic fracturing of shale gas wells. J. Adhes. Sci. Technol. 2020, 34, 917–935. [Google Scholar] [CrossRef]
  36. Wang, W.; Taleghani, A.D. Three-dimensional analysis of cement sheath integrity around Wellbores. J. Pet. Sci. Eng. 2014, 121, 38–51. [Google Scholar] [CrossRef]
  37. Wang, D.; Li, J.; Zhang, W.; Lian, W. Performance Evaluation of the Cement Sheath in Jimsar Shale Oil Wells. Xinjiang Oil Gas 2023, 19, 49–55. [Google Scholar]
  38. Turon, A.; Camanho, P.P.; Costa, J.; Dávila, C.G. A damage model for the simulation of delamination in advanced composites under variable-mode loading. Mech. Mater. 2006, 38, 1072–1089. [Google Scholar] [CrossRef]
  39. Hagoort, J.; Weatherill, B.D.; Settari, A. Modeling the propagation of waterflood-induced hydraulic fractures. Soc. Pet. Eng. J. 1980, 20, 293–303. [Google Scholar] [CrossRef]
  40. Wang, W.; Taleghani, A.D. Impact of hydraulic fracturing on cement sheath integrity; A modelling approach. J. Nat. Gas Sci. Eng. 2017, 44, 265–277. [Google Scholar] [CrossRef]
  41. Li, C.; Li, S.; Fan, M.; Chen, X.; Jin, D.; Gao, F.; Wang, Q. Rule of Propagation of Fractures through the Bonding Interfaces of Cement Sheath in Horizontal WellFracturing. Drill. Fluid Complet. Fluid 2022, 39, 761–766+775. [Google Scholar]
  42. Yan, X.I.; Jun, L.I.; Liu, G.; Qian, T.; Wei, L. A new numerical investigation of cement sheath integrity during multistage hydraulic fracturing shale gas wells. J. Nat. Gas Sci. Eng. 2018, 49, 331–341. [Google Scholar] [CrossRef]
  43. Guo, X.; Song, Y.; Bu, Y.; Guo, S.; Liu, H.; Wang, C. Simulation of seal integrity of cement sheath under variable internal casing pressure based on damage mechanics. Acta Pet. Sin. 2020, 41, 1425–1433. [Google Scholar]
Figure 1. Sample-curing mold.
Processes 13 01631 g001
Figure 2. Cement sheath cementation samples.
Processes 13 01631 g002
Figure 3. Cementation strength test apparatus.
Processes 13 01631 g003
Figure 4. Cement sheath interface cementation strength test results.
Processes 13 01631 g004
Figure 5. Traction–separation intrinsic law model.
Processes 13 01631 g005
Figure 6. A schematic of fluid flow in the damage zone of the cohesive element.
Processes 13 01631 g006
Figure 7. Modeling of cement sheath interface crack propagation.
Processes 13 01631 g007
Figure 8. Mesh sensitivity analysis.
Processes 13 01631 g008
Figure 9. Characteristics of axial propagation of cement sheath interface cracks at different times.
Processes 13 01631 g009
Figure 10. Characteristics of circumferential propagation of cement sheath interface cracks at different times.
Processes 13 01631 g010
Figure 11. The changing law of axial propagation length for cement sheath interface cracks at different times.
Processes 13 01631 g011
Figure 12. The changing law of circumferential propagation angle for cement sheath interface cracks at different times.
Processes 13 01631 g012
Figure 13. Crack propagation law of cement sheath interfaces under different elastic modulus conditions.
Processes 13 01631 g013
Figure 14. Stress–strain curves of cement stones with different cement slurry systems [43].
Processes 13 01631 g014
Figure 15. Crack propagation law of cement sheath interfaces under different Poisson’s ratio conditions.
Processes 13 01631 g015
Figure 16. Crack propagation law of cement sheath interfaces under different casing pressure conditions.
Processes 13 01631 g016
Figure 17. Propagation law of interface cracks under different formation elastic modulus conditions.
Processes 13 01631 g017
Table 1. Cement sheath–casing interface cementation strength test results.
Normal Cementation StrengthTangential Cementation Strength
NumberDestructive Load
(KN)
Destructive DisplacementTensile Strength
(MPa)
Average Value
(MPa)
Standard DeviationNumberDestructive Load
(KN)
Destructive DisplacementTensile Strength
(MPa)
Average Value
(MPa)
Standard Deviation
N-10.2110.770.360.4130.041S-11.8551.030.4680.4640.0026
N-20.2480.810.42S-21.8150.920.463
N-30.2660.750.46S-31.8171.310.462
Table 2. Cement sheath–shale interface cementation strength test results.
Normal Cementation StrengthTangential Cementation Strength
NumberDestructive Load
(KN)
Destructive DisplacementTensile Strength
(MPa)
Average Value
(MPa)
Standard DeviationNumberDestructive Load
(KN)
Destructive DisplacementTensile Strength
(MPa)
Average Value
(MPa)
Standard Deviation
N-110.3161.780.550.5770.025S-111.2151.180.3060.1870.0246
N-120.3451.410.57S-121.0031.270.252
N-130.3581.050.61S-131.1991.210.30
Table 3. Geometric and mechanical parameters of model.
NameOuter Diameter (mm)Inside Diameter (mm)Elastic Modulus (GPa)Poisson’s RatioInternal Friction Angle (°)Cohesive Force (MPa)
Casing139.7118.622100.3--
Cement sheath215.9139.780.1715.121
Formation--350.253059
Table 4. Variation in elasticity modulus for different cement slurry systems [43].
Density (g/cm3)Toughened MaterialsElasticity Modulus (GPa)
1.88None9.96
1.84Fibers and elastic particles7.02
1.81Elastic particles5.96
Disclaimer/Publisher’s Note: The statements, opinions and data contained in all publications are solely those of the individual author(s) and contributor(s) and not of MDPI and/or the editor(s). MDPI and/or the editor(s) disclaim responsibility for any injury to people or property resulting from any ideas, methods, instructions or products referred to in the content.

