1. Introduction
The increase in greenhouse gas (GHG) emissions is a global concern due to the impacts of climate change, which intensify extreme weather events and pose significant threats to human development [
1]. The burning of fossil fuels for energy production is one of the main sources of GHG emissions, releasing large amounts of carbon dioxide (CO
2), methane (CH
4), and nitrous oxide (N
2O) [
2]. Among these gases, CO
2 stands out as the largest contributor, accounting for nearly 80% of total GHG emissions in the European Union in 2021, followed by methane, which represented over 21% [
2]. In this context, the transition from a fossil fuel-based economy to one centered on biofuels becomes essential. Increasing the use and economic viability of biofuels, such as ethanol, is a crucial strategy to achieve this goal.
In this global scenario, Brazil stands out as one of the world leaders in ethanol production due to its long-standing tradition and the energy efficiency of ethanol produced from sugarcane [
3]. The country has a well-established infrastructure for the production, distribution, and commercialization of this biofuel [
4]. Domestic policies, such as reduced taxation compared to gasoline and the highest ethanol blending rate in gasoline worldwide [
5], have driven technological development and sector expansion.
While the production of ethanol from sugar cane has long been established in Brazil, the utilization of maize as a feedstock represents a comparatively recent development, initiated in 2012 [
4]. Since its inception, maize ethanol production has experienced rapid expansion, establishing itself as an important complement to the traditional sugarcane-based ethanol industry [
6]. However, significant technical differences between the fermentation processes of these two feedstocks pose challenges to the competitiveness of maize ethanol.
Although maize is traditionally used as food, its use as an energy source in ethanol production is justified by economic, logistical, and political factors. Globally, the rise in biofuel production has been driven by public policies adopted in industrialized countries between the 1990s and 2000s, aiming to reduce fossil fuel dependency, mitigate greenhouse gas emissions, and promote energy security [
7]. In Brazil, maize ethanol production began in 2012 in the state of Mato Grosso, motivated by low regional grain prices and the opportunity to utilize idle capital in sugarcane distilleries during the intercrop season [
4]. and Furthermore, about half of the maize produced in Brazil’s central-west region is exported, often over long distances, which increases logistical costs. Local ethanol production allows for regional grain utilization and reduces these costs [
8]. Notably, most of the maize used for ethanol in Brazil is cultivated during the off-season (second cropping season), after soybean harvest, in a rotational system. This means that maize for energy purposes is often grown in areas that do not directly compete with food production, such as marginal lands or alternating crop systems. These factors indicate that maize usage as an energy source in Brazil is primarily driven by economic feasibility and the strategic use of local resources, rather than food displacement.
Maize ethanol production also generates high-value co-products, such as dried distiller grains (DDGs), which are rich in protein and widely used in animal feed [
9]. This reintegration of biomass into the food chain contributes to the food–energy balance and supports the sustainable use of agricultural resources.
The main difference lies in the infeasibility of cell recycling in the maize process due to the high concentration of insoluble solids present in the hydrolysate [
10]. This condition requires the acquisition of a new inoculum for each fermentation cycle, diverting part of the sugars toward biomass propagation instead of ethanol production. Consequently, non-recycling processes exhibit lower initial cell concentrations and longer fermentation times [
4,
10].
In the case of sugarcane, the fermentation process is typically faster, with a duration ranging from 6 to 12 h in Brazilian distilleries that operate with cell recycling and high initial yeast concentrations (approximately 8–12% v/v). In contrast, maize fermentation processes, which often do not employ recycling, generally require 48–72 h, mainly due to lower initial cell concentrations (typically less than 1% v/v) and the necessity for cell propagation during fermentation.
Regarding sugar concentration, sugarcane juice contains total reducing sugars (glucose and fructose) ranging from 170 to 220 g·L−1, while maize mash, after starch hydrolysis, may reach glucose-equivalent concentrations of approximately 300 g·L−1. This discrepancy directly impacts the osmotic stress tolerance required of the yeast and the overall process productivity.
With respect to ethanol concentration, sugarcane-based processes typically reach final concentrations of 10–12% (v/v), whereas maize-based processes, especially under very high gravity (VHG) conditions, may attain ethanol levels ranging from 14 to 18% (v/v).
Additionally, the constant need to purchase active dry yeast for propagation significantly increases operational costs in non-recycling processes. Typically, the fermentation yield in such systems is lower than that in recycling-based processes, due to reduced efficiency in sugar-to-ethanol conversion during the biomass growth phase [
10].
Volumetric productivity is a critical factor in fermentation processes, directly influencing the economic feasibility of the process. Studies indicate that increasing the inoculum size enhances volumetric productivity [
11,
12,
13,
14,
15], enabling faster [
16], more robust, and more cost-effective processes [
10]. However, there is a threshold at which further increasing the inoculum can lead to cellular stress, ultimately limiting ethanol productivity gains [
12,
17,
18]. Strategies that increase the initial cell concentration without disproportionately raising costs can improve the competitiveness of maize ethanol production.
Additional benefits of increasing inoculum amount have been reported in the literature, such as more complete substrate utilization, which can lead to a higher product concentration in the output stream, greater ease in product separation [
8], and a reduction in ethanol’s inhibitory effects [
19]. However, disadvantages have also been noted, including difficulties in agitation due to the increased viscosity of the fermentation broth compared to lower-density media, as well as potential diffusion limitations that, at higher levels, can reduce productivity [
10].
From an environmental perspective, enhancing the inoculum amount in fermentation processes can bolster industrial sustainability by lowering energy consumption and reducing wastewater production. In principle, more efficient fermentation leads to a higher product (ethanol) concentration, which reduces the volume of wastewater generated. This wastewater primarily originates from stillage, as well as residual process water from the bioreactor [
20].
Ethanol production from maize starch can generate up to 20 L of stillage per liter of ethanol produced [
21]. Although strategies such as zero-discharge fermentation—where stillage is recycled into the production of distillers’ dried grains with solubles (DDGS)—can mitigate wastewater generation, excessive stillage recirculation may significantly increase the fermentation time [
22]. This effect may compromise process efficiency, making inoculum expansion a relevant strategy to mitigate this impact while maintaining ethanol productivity.
Recently, several innovations have been applied to enhance productivity in the bioethanol industry, especially in maize-based plants, such as those found in the Brazil and United States. The pursuit of greater efficiency has been not only the subject of intensive research [
23] but also a driving force for industrial investment in technologies ranging from raw material improvement to the optimization of fermentation and ethanol recovery processes. These advancements include the adoption of more effective pretreatments [
24], the use of specialized enzymes, the development of more robust microbial strains, and operational management strategies such as inoculum adjustment, energy balance optimization, and integration of biorefinery systems [
25]. These efforts aim to maximize process yield, minimize losses, and reduce operational costs, thereby promoting the sustainable development of the bioenergy sector. In this context, economically assessing the impact of different strategies to enhance fermentation productivity—such as increasing the initial cell concentration—becomes a valuable tool to support decision making in industrial maize ethanol plants.
Considering these aspects, this study explores strategies to increase the initial cell concentration in maize-based ethanol fermentation, with the objective of enhancing both productivity and economic viability. We evaluated two strategies: (i) increasing the initial cell mass by adding dry yeast or (ii) extending the inoculum propagation time. Our hypothesis is that extending the inoculum propagation time will be more economically advantageous than direct dry yeast supplementation, as it may reduce costs associated with input procurement and enhance cell adaptation to the fermentation medium, ultimately leading to greater efficiency and productivity.
This study aims to simulate, through laboratory-scale experiments, a maize ethanol fermentation plant and perform a comparative economic assessment of these strategies. The assessment considers the impact of inoculum size on productivity and key operational costs, including dry yeast procurement, ethanol production losses during propagation, and energy consumption. The findings provide practical insights into the economic implications of each approach and support decision making in industrial plants, contributing to process optimization and the sustainable development of the biofuels sector in ethanol production.
2. Materials and Methods
The experiments were designed to evaluate the isolated effect of the initial cell concentration (X0) on fermentation performance parameters. All other variables were kept constant. A design of experiments (DoE) approach was not applied, as the objective was not to optimize multiple factors simultaneously, but rather to determine the direct influence of X0 on ethanol yield and specific substrate consumption.
2.1. Fermentation in Flasks
The effect of different X
0 values was evaluated through 10 fermentation experiments, conducted in triplicate, using 250 mL Erlenmeyer flasks. Each flask was supplemented with 90 mL of a fermentation medium obtained from a raw maize hydrolysate provided by an industrial ethanol production facility (São Paulo, Brazil). This hydrolysate was enzymatically treated in the laboratory with glucoamylase (Sigma-Aldrich, São Paulo, Brazil) in sufficient quantity to ensure the complete conversion of oligosaccharides and polysaccharides into glucose. The sugar concentrations in both the raw and saccharified hydrolysates, as well as the final glucose equivalent concentration (approximately 240 g·L⁻
1), were determined by high-performance liquid chromatography (HPLC), as described in
Section 2.2. The same batch of hydrolysate was used in all experiments to ensure consistency in trial conditions. In addition to the medium, 10 mL of a cell suspension from a commercially available strain specifically designed for maize fermentation, Ethanol Red
® (Lesaffre Advanced Fermentations, Marcq-en-Barœul, France) was added. The exact sugar concentrations of the raw and saccharified hydrolysates are presented in
Table 1The experiments were conducted under constant agitation and temperature control at 34 °C, using X0 of 0.04, 0.06, 0.10, 0.12, 0.20, 0.40, 0.80, 1.20, 1.60, and 1.90 g·L−1. This range was defined based on values typically used in the Brazilian maize ethanol industry (approximately 0.1 g·L−1). Experiments with X0 below 0.8 g·L−1 were incubated for 36 h, whereas those with higher concentrations were incubated for 28 h. This differentiation in incubation time was based on the fact that higher initial cell concentrations promote shorter fermentation durations. The adjustment was applied to prevent complete sugar depletion at the end of fermentation, thus enabling the accurate calculation of specific substrate consumption. No aeration was applied to the fermentation flasks during the experiments. At the end of the incubation period, samples were collected, filtered through 0.22 μm membrane filters (MilliporeSigma, Burlington, MA, USA), and analyzed for residual glucose equivalent and ethanol concentrations.
2.2. Analytical Procedures
The dry cell mass concentration in the inoculum was determined by the gravimetric method, following centrifugation, washing, and drying at 60 °C [
26]. The concentrations of equivalent glucose and ethanol were determined by liquid chromatography using a system composed of a Waters 1525 binary pump (Waters 1525) and a 2414 refractive index detector (Waters 2414) (Waters Corporation, Milford, MA, USA). The column used for component separation was a Bio-Rad AMINEX HPX-87H (Bio-Rad Laboratories, Hercules, CA, USA), maintained at a constant temperature of 40 °C. The eluent used during the chromatographic process was a 0.05 N sulfuric acid solution (Sigma-Aldrich, St. Louis, MO, USA), applied at a flow rate of 0.6 mL·min
−1.
2.3. Determination of Specific Substrate Consumption (qS)
The mass of equivalent glucose added to the flask via the fermentation medium and the residual mass present in the fermented medium were used to calculate the equivalent glucose mass consumed in each experiment. This value was then used to determine the specific substrate consumption (q
S), as shown in Equation (1).
where G
in is the glucose mass added by the wort, G
re is the residual glucose mass, t is the incubation time, and M
X0 is the initial cell mass.
2.4. Estimation of Cell Mass Produced During the Propagation Stage
In maize fermentation processes without cell recycling, the acquisition of selected dry yeast is a common practice for the propagation stage. This stage involves the use of propagators for aerobic growth with metabolic overflow [
27], where part of the pyruvate is directed toward ethanol production and another part enters the respiratory cycle (cell multiplication). This growth occurs without strict control of the hexose concentration in the propagation medium, characterizing the Crabtree effect [
28].
The primary objective of this stage is to transform a small initial cell mass into a sufficient biomass for fermentation to achieve a desired ethanol titer. The cell mass obtained through this growth method can be estimated using Equation (2), as described by Vieira et al. (2013) [
29], to model the purely oxidative aerobic growth of yeast cells.
where M
X is the final cell mass, µ′ is the specific growth rate, and t
P is the propagation time.
This approach has also proven to be suitable for describing the propagation processes of industrial yeast cells under aerobic conditions with metabolic overflow. It has been validated in industrial-scale cell propagation processes for use in second-generation ethanol fermentation in Brazilian distilleries.
2.5. Economic Assessment
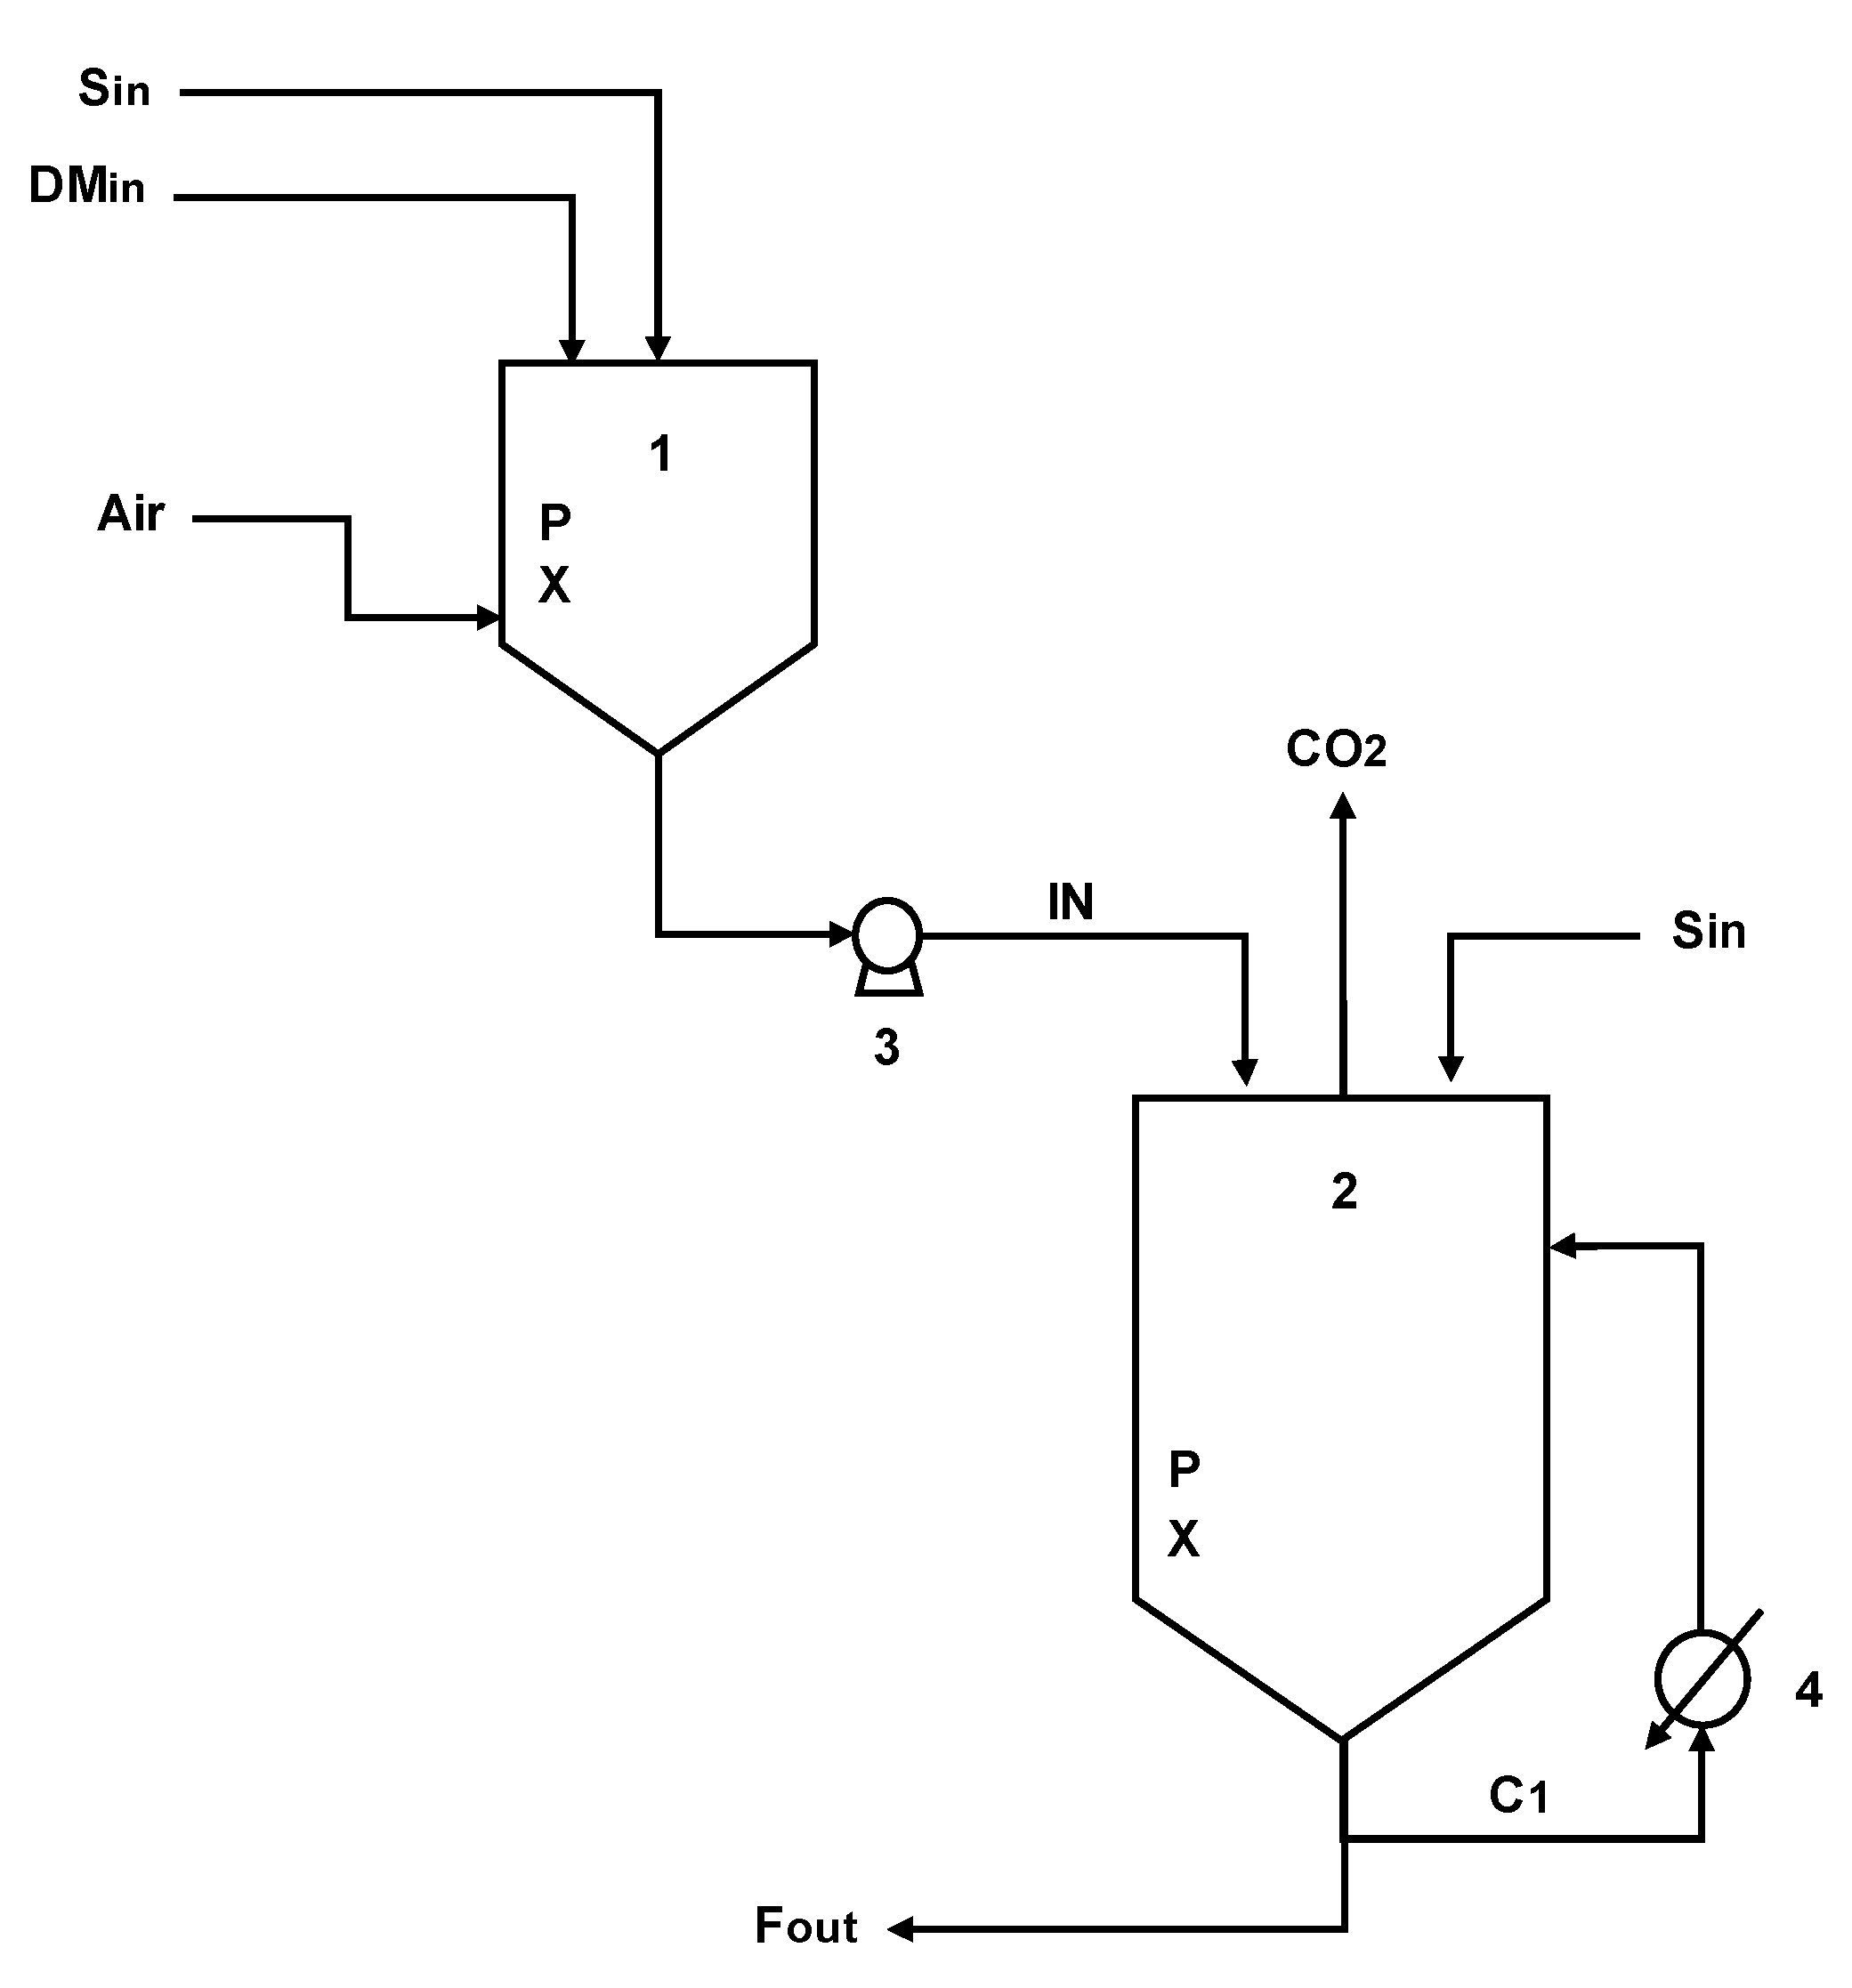
The economic assessment was conducted considering an operational system consisting of a propagator, where cell growth occurs under aerobic conditions with metabolic overflow, and a bioreactor for industrial-scale ethanol production, as illustrated in
Figure 1.
The assessment compared the revenue generated from productivity gains with the additional costs associated with increasing the inoculum: (i) the purchase of commercial dry yeast (Strategy 1) and (ii) the cost of ethanol not produced due to the lower yield observed during propagation (Strategy 2). For Strategy 2, the assessment also included energy consumption and equipment investment costs, when applicable, to provide a comprehensive comparison.
The costs of acquiring dry yeast were estimated based on the market price of commercial dry yeast in Brazil in 2024 (USD 42.00/kg). The costs associated with obtaining cell mass during propagation were calculated by considering the volume of ethanol that was not produced at this stage. This impact was determined by the difference between the ethanol yield of aerobic growth with metabolic overflow (YP/S (P)) and the ethanol yield obtained under anaerobic conditions (YP/S (B)), using the average ethanol selling price in the Brazilian market for the same year (USD 0.45/L), obtained from CEPEA (Center for Advanced Studies on Applied Economics, Piracicaba, Brazil).
To evaluate the economic impact of increasing the inoculum concentration by extending the propagation time, additional operational and capital costs were considered. It was assumed that the plant did not have a propagation unit installed, thus requiring the implementation of a new system consisting of a stainless steel tank (AISI 316) with torispherical top and bottom heads and a height-to-diameter ratio of 4 (operating as a bubble column), an air diffuser, a recirculation pump, and a sanitary heat exchanger, with estimated costs of USD 212,389.38, USD 17,699.12, and USD 84,070.18, respectively. The estimated costs were based on average market prices in Brazil in 2024, obtained through consultation with suppliers, although specific company names could not be disclosed.
Each propagation unit operates in a 24 h cycle, with approximately 15 h dedicated to cell growth under aerobic conditions with metabolic overflow, and around 9 h allocated to preparation activities such as water addition, inoculum transfer, and cleaning. In contrast, the fermenters operate in 72 h cycles, including 60 h of alcoholic fermentation and 12 h for harvesting and clean-in-place (CIP) operations. As a result, a single propagation unit can supply up to three fermenters in continuous operation, justifying the division of the total installation cost by three in the present analysis. Thus, the investment required to support one fermenter was estimated at USD 104,158.77.
This value was amortized over 15 years using the straight-line depreciation method, resulting in an annual capital cost of USD 6984.38. Considering that each fermenter operates in 72 h batches and the industrial plant runs for an average of 345 days per year, an estimated 115 fermentation batches are performed annually. Therefore, the capital amortization cost per batch was USD 60.71.
Additionally, the 5 h extension in propagation time, under continuous aeration conditions (0.3 vvm—volume of air per volume of liquid per minute—at 2 bar), resulted in an estimated additional electricity consumption of 600 kWh per batch, required to operate the air compressor. Considering an average electricity rate for Brazilian high-voltage industrial consumers under the time-of-use tariff regime (USD 0.124/kWh, data obtained from ANEEL, Brasília, Brazil), the additional energy cost was estimated at USD 111.50 per batch. The values defined herein were used to support the comparative cost analysis between the evaluated strategies, as discussed in
Section 3.
An alternative scenario was also considered in which the ethanol production facility already has a propagation unit installed and available for extended operation. In this case, the investment in equipment would not be required, and the only additional cost associated with Strategy 2 would be related to energy consumption. Under these conditions, the additional cost per batch would be limited to USD 111.50, corresponding to the energy demand from the 5 h extension in propagation time. This scenario enables a more favorable economic balance for Strategy 2 and allows for a direct comparison with Strategy 1 based solely on operational costs, especially for facilities already operating with integrated propagation systems.
Revenue was calculated based on the volumetric productivity of ethanol, considering its market selling price (USD 0.45/L, CEPEA, Piracicaba, Brazil).
2.6. Mass Balance
The volumetric ethanol productivity (P
P, g·L
−1·h
−1) was determined by dividing the ethanol concentration in the bioreactor (P, g·L
−1) by the fermentation time (t
F, h), as shown in Equation (3):
This analysis was carried out through fed-batch fermentation simulations, utilizing a bubble-type bioreactor propagator with a working volume of 100 m3 and an aeration rate of 0.3 vvm (volume of air per volume of liquid per minute), corresponding to 30 Nm3·min⁻1 (normal cubic meters per minute, i.e., volume at 0 °C and 1 atm), to support aerobic growth with metabolic overflow. The system also included a 2500 m3 bioreactor equipped with a side-mounted mechanical agitation system and an external wide-channel plate heat exchanger. The fermentation time used in the simulations was 60 h.
All simulations and calculations were performed using Microsoft Excel for Microsoft 365, with custom routines developed in VBA (Microsoft Corporation, Redmond, WA, USA).
Due to the high content of insoluble solids present in maize hydrolysate, it is technically challenging to determine cell mass formation directly in industrial fermenters. Therefore, the kinetic parameters used in this simulation were obtained from industrial-scale cell propagation processes that employ molasses as the carbon source under aerobic conditions with metabolic overflow. These propagators are commonly used for inoculum preparation in second-generation ethanol production and operate under conditions comparable to those simulated in this study. Although cell recycling is commonly applied in sugarcane-based ethanol production and propagation is not usually performed, these systems represent a reliable industrial model for estimating parameters in propagation stages.
The following values were adopted based on this reference scenario: a specific growth rate in the propagator (µ) of 0.21 h⁻1, a cell yield in the propagator (YX/S (P)) of 0.10 g·g−1, an ethanol yield in the propagator (YP/S (P)) of 0.41 g·g−1, and an ethanol yield in the bioreactor (YP/S (B)) of 0.46 g·g−1. These values are consistent with the operational data observed in the Brazilian sugarcane ethanol industry.
The primary objective, in both strategies, was to increase the initial cell mass in the bioreactor from 82 to 245 kg.
In Strategy 1, the propagation time was kept constant, while the initial dry yeast mass in the propagator varied between 10, 12, 15, 20, 25, and 30 kg.
In Strategy 2, the initial dry yeast mass in the propagator was fixed at 10 kg, while the propagation time varied between 10, 11, 12, 13, 14, and 15.23 h. A maximum time of 15.23 h was defined in order to achieve an initial cell concentration (X0) of 245 g·L−1 in the bioreactor.
To compare the production cost and revenue increase profiles of both strategies, the reference operational condition was set at an initial cell mass of 82 kg in the bioreactor, corresponding to 10 kg of initial mass in the propagator and 10 h of propagation for both strategies. This condition reflects a scenario commonly adopted in the Brazilian ethanol industry.
The mass produced ethanol was determined using YP/S (P), as well as the ethanol mass potentially obtained under anaerobic conditions, calculated by YP/S (B). The difference between these two conditions was considered to be that the ethanol that was not produced during the propagation phase, and the cost of the excess cell mass was calculated based on this difference.
The X
0 in the bioreactor was determined for each simulated condition, taking into account its final volume of 2500 m
3, resulting in values between 0.03 and 0.10 g·L
−1, corresponding to initial cell masses of 82 to 245 kg. The glucose mass consumed for each simulated condition was determined by the q
S relative to X
0 in the bioreactor, considering a fixed fermentation time of 60 h, according to Equation (4).
where G
C is the mass of glucose consumed.
The parameters used for the simulation of the propagation stage for both strategies are presented in
Table 2.
3. Results and Discussion
3.1. Evaluation of the Fermentation Process Behavior with Different Initial Cell Concentrations
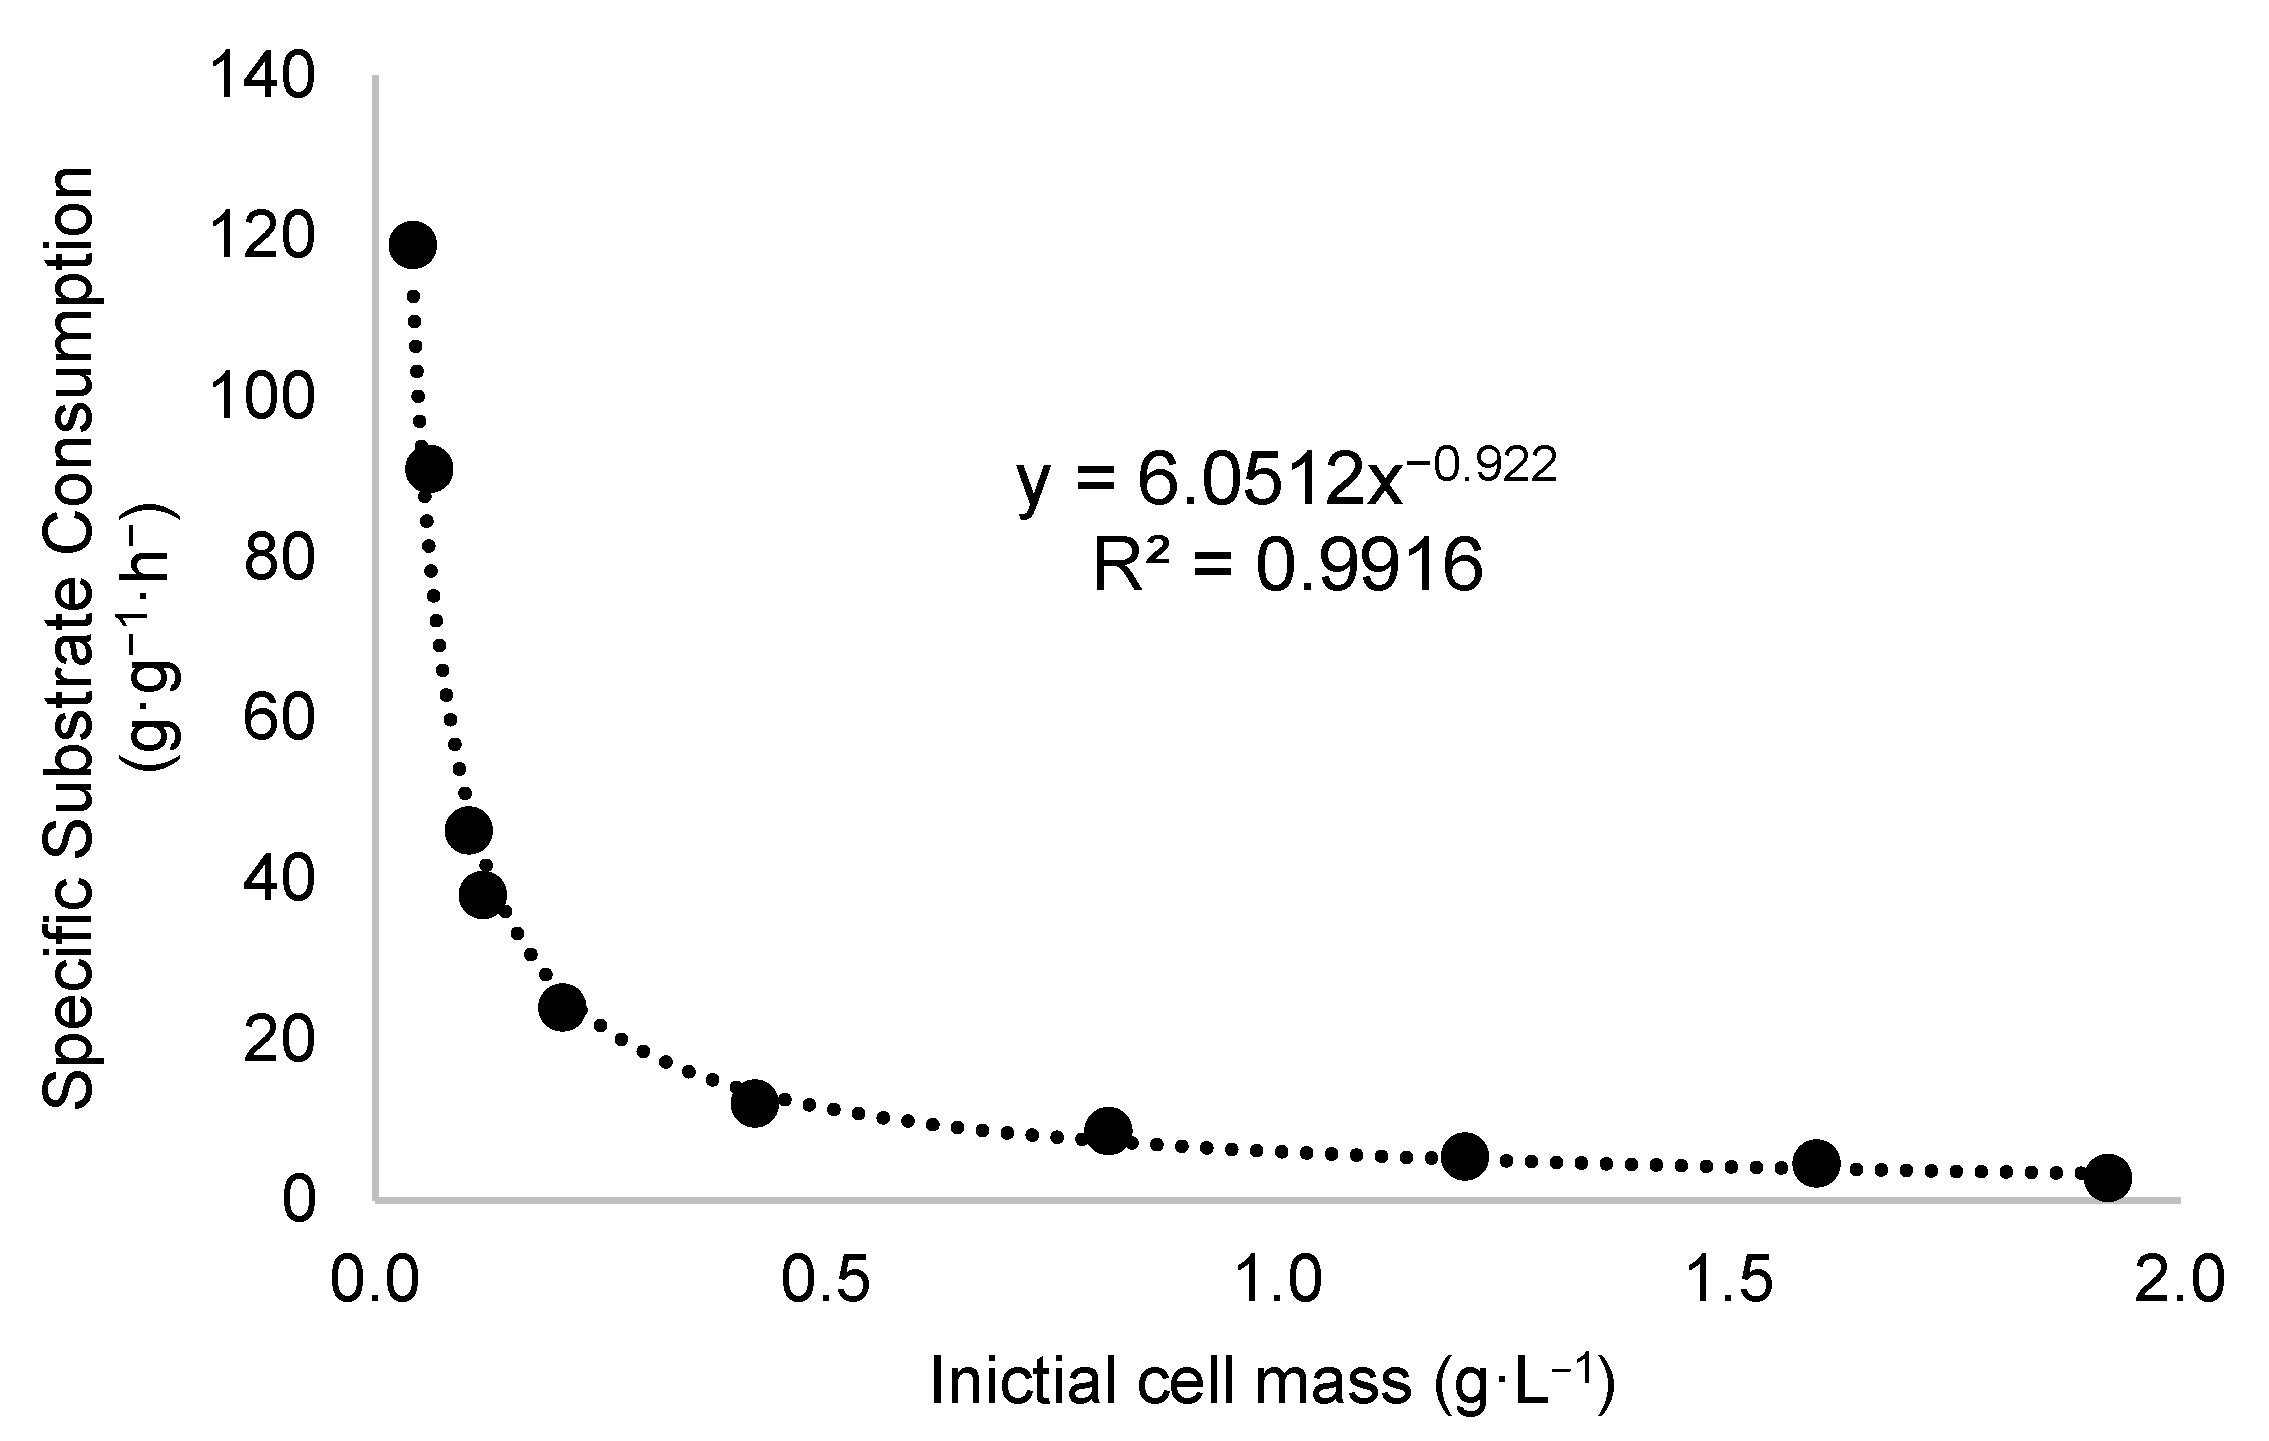
The qₛ values as a function of X
0 obtained from the shaken flask experiments are shown in
Figure 2. The experiments were conducted in independent triplicates, and the results are presented as mean ± standard deviation (SD). The complete dataset of replicate values, including the respective means and standard deviations, is provided in
Appendix A (
Table A1).
Figure 2 depicts that the experimental data fit a hyperbolic model, where the variation in X
0 from 0.042 to 1.92 g·L
−1 results in a change in q
S from 118.89 to 2.74 g·g
−1·h
−1, respectively.
From an initial cell mass of 0.421 g·L−1, the data indicate stabilization in the rate of reduction of qS, suggesting that increasing the initial cell concentration beyond this value has a less pronounced effect. This behavior can be interpreted as approaching an asymptotic value in the adjusted power law model, implying that at higher cell concentrations, additional limiting factors may influence the specific substrate uptake.
The adjusted power law model exhibited a power exponent of −0.922 and a multiplicative coefficient of 6.05. The relationship between q
S and X
0 was fitted using a power equation, as shown in Equation (5):
The adjusted power law model exhibited a regression coefficient (R2) of 0.9916, indicating an excellent fit to the experimental data. This correlation underscores the significant dependence of the specific substrate uptake rate on the initial biomass concentration X0. The high precision of the fit further supports the validity of the model in predicting fermentation behavior across the examined range of X0.
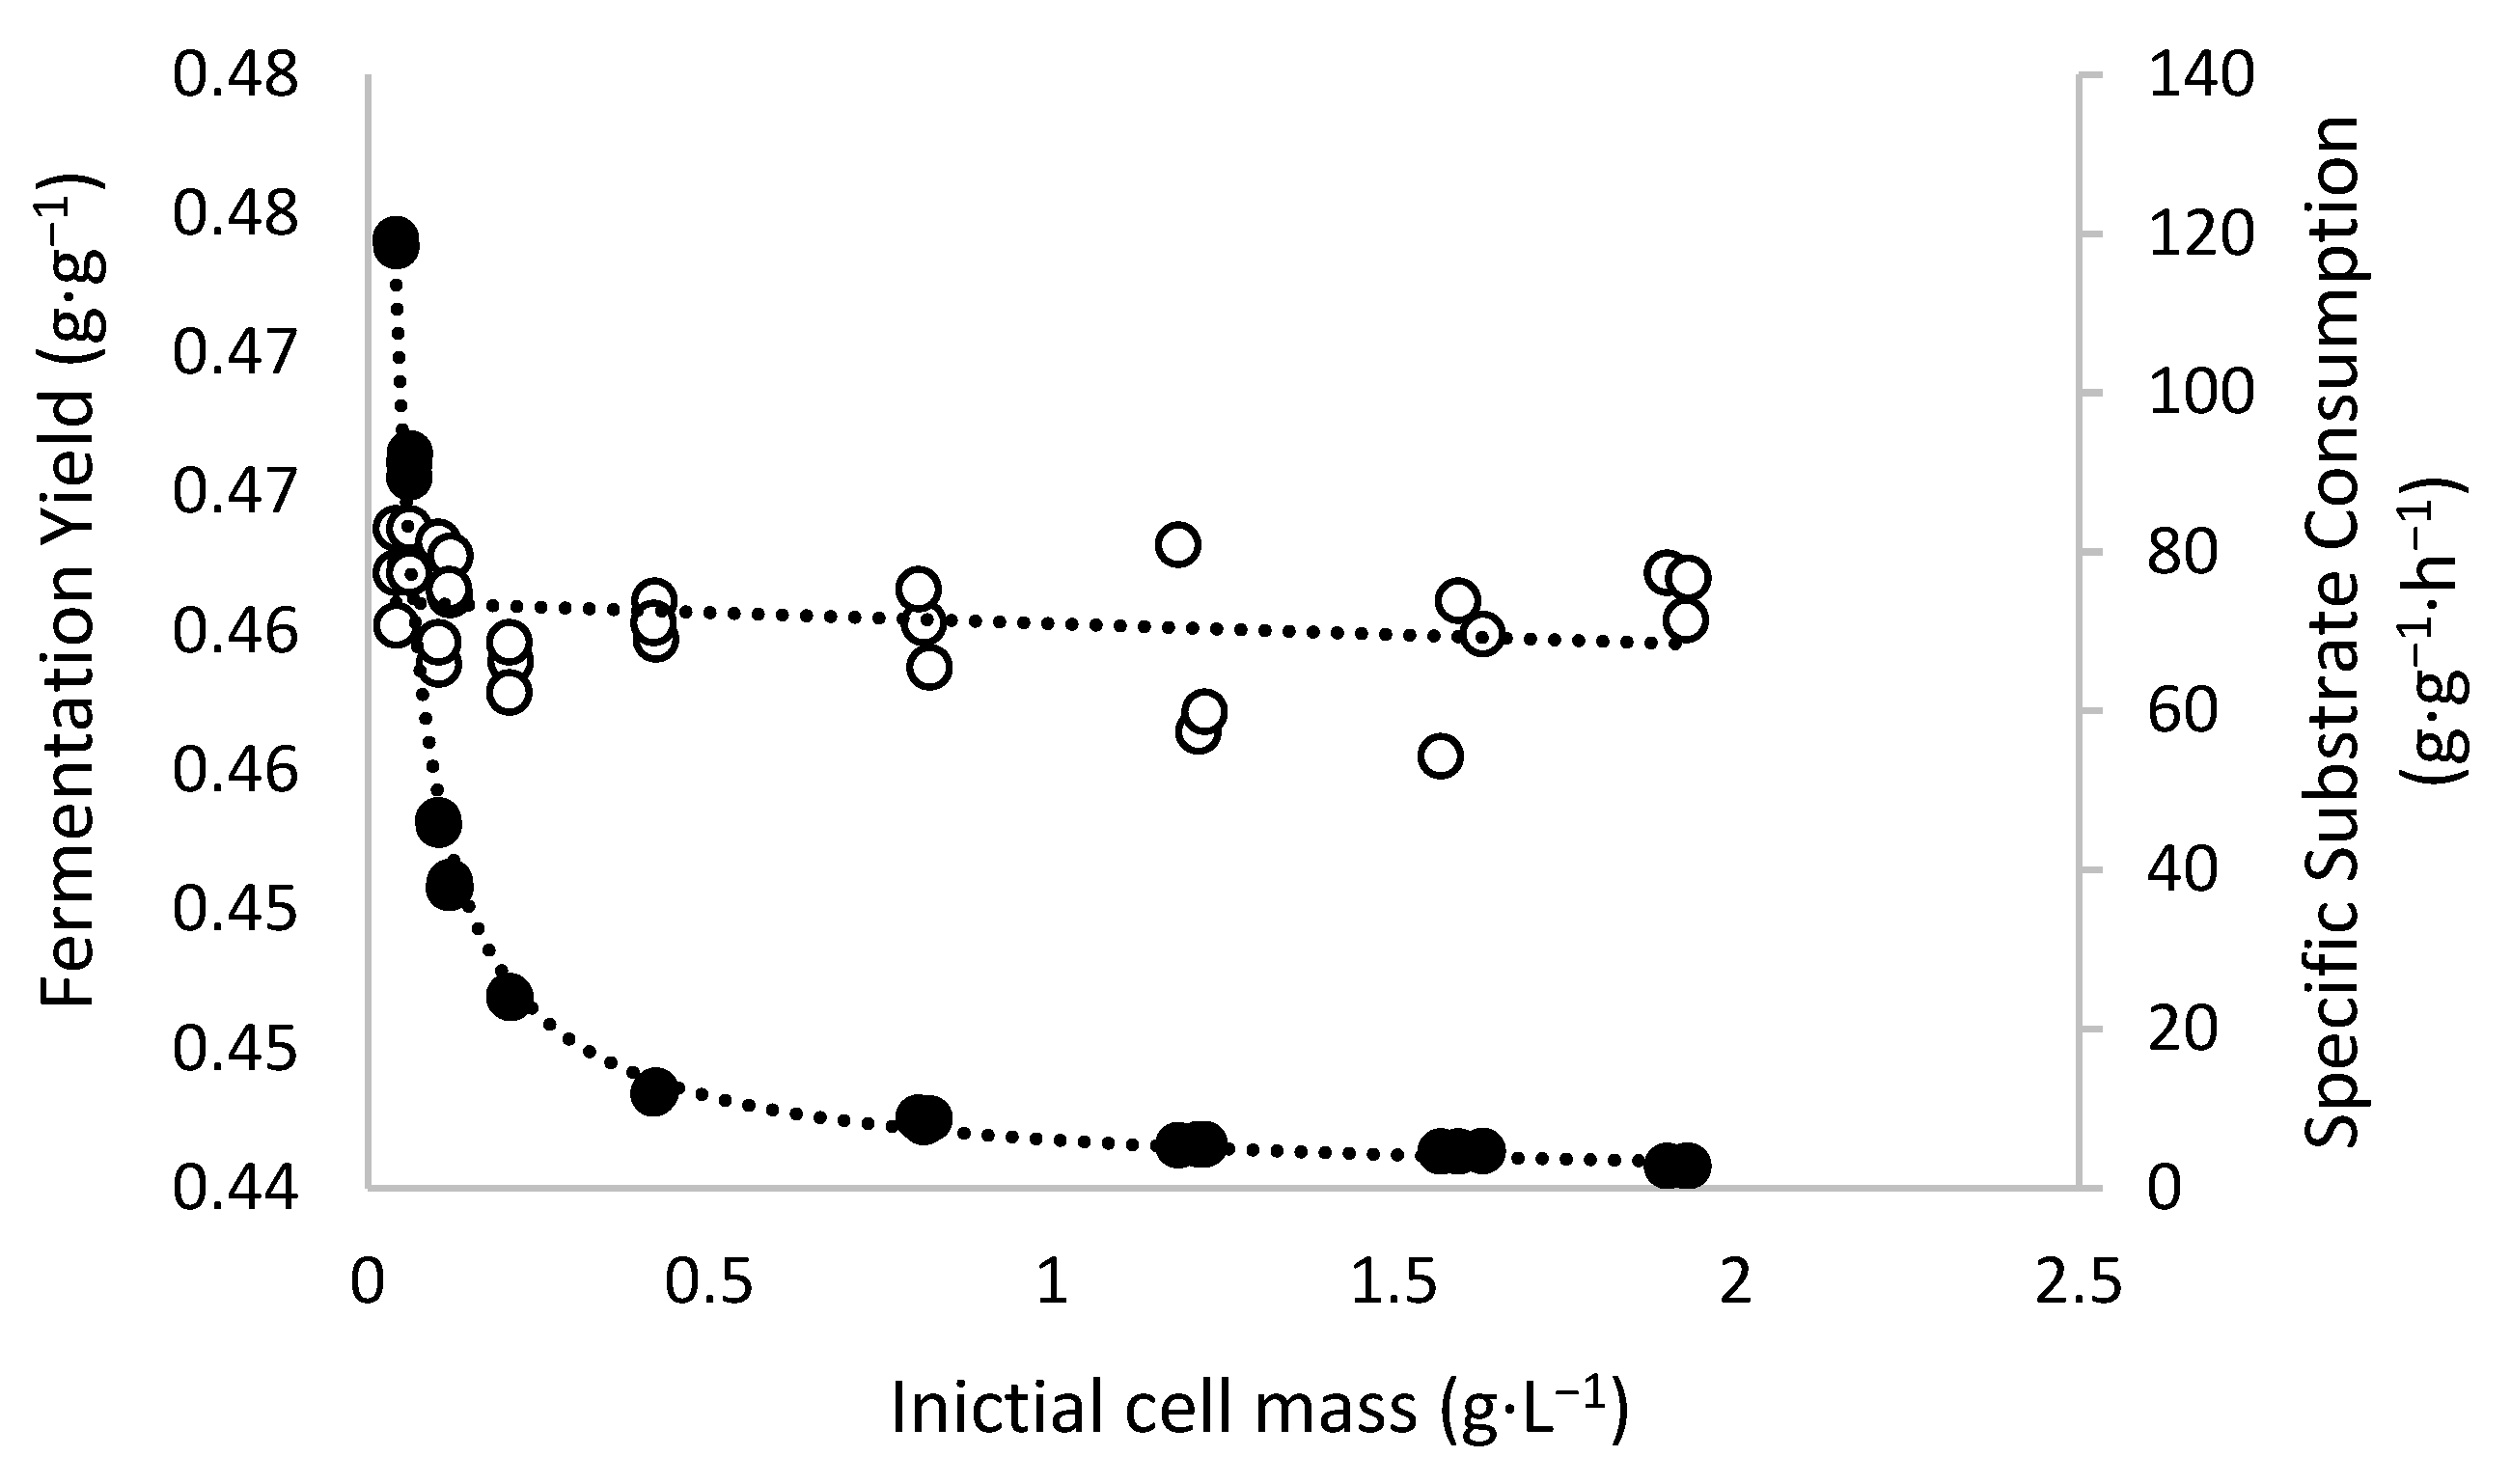
The mass balance data obtained from the fermentation assays in shaken flasks indicate that unlike q
S, the ethanol yield (Y
P/S) was not significantly affected by the initial cell mass, ranging from 0.4555 to 0.4637 g·g
−1, as shown in
Figure 3.
These results align with previous studies, including Mojović et al. (2006) [
30], on ethanol production from cornmeal hydrolysates; Agbogbo et al. (2007) [
31] on the effect of X
0 in xylose fermentation by Pichia stipites; and Matsushika and Sawayama (2010) [
17], on the effect of X
0 on ethanol production using flocculent yeast. However, this conclusion is not unanimous, as some authors, such as Charoensopharat and Wechgama (2019) [
32] and Nuanpeng et al. (2018) [
33], have reported contradictory findings.
The reason why X0 affects qS may be associated with two main factors: mass transfer limitation and metabolic self-regulation.
The mass transfer limitation hypothesis suggests that, at high cell densities, the increased amount of dissolved carbon dioxide (DCO
2) may interfere with substrate diffusion to the cell membrane, reducing the efficiency of active transport. Although DCO
2 was not directly monitored in this study, previous research, such as that by Guadalupe-Daqui et al. (2023) [
34], indicates that this effect can be significant in high-cell-density systems. Additionally, cell accumulation may reduce the effective contact area between the substrate and cells, even in well-agitated bioreactors, further contributing to the decrease in the specific substrate consumption rate.
On the other hand, the metabolic self-regulation hypothesis, possibly mediated by quorum sensing mechanisms or other signaling molecules, could also explain the reduction in specific substrate consumption [
35]. Studies by Monte et al. (2007) [
36] and Poulsen et al. (2007) [
37] have demonstrated that at high cell densities, yeast cells adjust their metabolic flux to balance substrate utilization within the population, which may account for the observed stabilization trend in q
S at higher densities.
However, it is important to highlight that this study did not perform direct measurements of dissolved CO2, dissolved oxygen, or metabolic indicators, which limits the ability to determine which of these mechanisms was predominant. Therefore, the results presented should be interpreted as trends based on inferences from the literature and mathematical modeling. Future studies may experimentally validate these hypotheses through direct measurements, enabling a deeper understanding of the mechanisms involved in the regulation of specific substrate consumption under high-cell-density conditions.
3.2. Results of Economic Assessment
The results obtained for the increase in X
0 using different strategies were analyzed through mass balances, considering the parameters evaluated in each simulation.
Table 3 presents the calculated values for both approaches: (i) increasing the mass of dry yeast added to the propagator (Strategy 1) and (ii) extending the propagation time while maintaining a constant initial mass (Strategy 2). These data allow for a comparison of the impacts of each strategy on biomass production, substrate consumption, and ethanol conversion, providing a basis for the subsequent economic assessment.
The substrate mass consumed during propagation was similar in both strategies. Consequently, the substrate consumption varied between 817 kg and 2450 kg for X0, ranging from 0.03 to 0.10 g·L−1. As expected, qS decreased as the available cell mass in the bioreactor increased. The ethanol volume produced followed a similar trend in both strategies, ranging from 405.21 m3 to 442.74 m3 for X0 in the bioreactor between 0.03 and 0.10 g·L−1, representing a 9.00% increase in ethanol production.
Table 4 presents the calculated data for the economic assessment evaluation of both strategies.
The costs for obtaining the initial inoculum mass increased from USD 443.26 to USD 1329.77 when achieved through the direct purchase of dry yeast (Strategy 1), representing an additional cost of USD 886.51 per processed bioreactor with a capacity of 2500 m3. This increase raised the cost of inoculum acquisition per cubic meter of ethanol produced from USD 1.09 to USD 3.01 (an increase of USD 1.91/m3). On the other hand, extending the propagator cultivation time (Strategy 2) resulted in two possible economic scenarios, depending on whether the industrial plant already had a propagation unit installed. In the base scenario, which includes the amortized capital cost of the propagation equipment, the additional cost per bioreactor reached USD 218.73, resulting in an increase in ethanol production cost from USD 1.09 to USD 1.50 per cubic meter of ethanol (an increase of USD 0.41/m3). In a more favorable scenario, where the facility already has the propagation infrastructure and therefore incurs only the additional energy cost, the increase per bioreactor is reduced to USD 158.02, corresponding to an ethanol cost of USD 1.36/m3 (an increase of USD 0.27/m3).
In both strategies, increasing the initial cell mass in the bioreactor resulted in a productivity-related revenue gain of USD 16,679.00 per bioreactor. However, the associated cost increase differed significantly between them. These results demonstrate that Strategy 2 is considerably more economically advantageous. Even in the scenario that includes capital investment, the cost variation per bioreactor is up to four times lower than in Strategy 1; in the scenario where the propagation unit is already installed, this difference reaches approximately six times lower. These figures highlight the efficiency of Strategy 2 in converting operational adjustments into increased profitability, especially when compared to the direct purchase of dry yeast.
Considering that the standard industrial operating condition establishes an initial cell mass of 245 kg (corresponding to 0.10 gDM·L⁻1—grams of dry biomass per liter) in a bioreactor with a working volume of 2500 m3, obtaining this mass through Strategy 2—using 10 kg of dry yeast and a propagation time of 15 h—results in a total cost of approximately USD 661.98 per bioreactor (with capital cost) or USD 601.27 (without capital cost). In contrast, Strategy 1—purchasing 30 kg of dry yeast with 10 h of propagation—has an estimated final cost of USD 1329.77 per bioreactor. This leads to a cost difference of USD 667.79 to USD 728.50 per bioreactor, depending on the propagation infrastructure scenario, which corresponds to a reduction of USD 1.51 to USD 1.65 per cubic meter of ethanol produced, assuming an average ethanol yield of 442 m3 per bioreactor per batch.
For this condition, the cost of inoculum acquisition relative to the revenue generated per bioreactor corresponds to 0.6681% in Strategy 1, and 0.3326% (with capital cost) or 0.3021% (without capital cost) in Strategy 2—representing a reduction of 0.3355 to 0.3660 percentage points, respectively. Considering that each bioreactor processes large volumes of mash and delivers substantial ethanol output per batch, even small percentage differences translate into significant financial advantages at an industrial scale. Taking an initial cell mass of 82 kg in the bioreactor as a reference, the relative productivity gains and costs associated with obtaining the initial cell mass were calculated for the remaining simulated conditions, considering different inoculum masses up to 245 kg.
Figure 4 presents the variation in productivity gain increments due to increased productivity, as well as the costs of obtaining the inoculum mass for Strategy 1 (a) and Strategy 2 (b).
Figure 4 shows that the increase in costs associated with acquiring dry yeast mass is significantly higher compared to the cost increase from extending the propagation time for biomass production. In Strategy 1, cost variations can reach up to 200.00%, whereas the revenue increase due to productivity gains is approximately 9.00%. In Strategy 2, a 49.30% increase in cost results in a proportional 9.00% increase in revenue, directly linked to productivity improvements. When the propagation infrastructure is already in place, this cost increase is reduced to approximately 35.60%, further enhancing the economic advantage of Strategy 2.
Figure 4 presents the percentage variation in costs and revenue associated with increasing the initial cell mass in the bioreactor. These graphs are useful for illustrating the relative trends between cost and revenue within each strategy. However, it is important to note that this percentage-based representation does not directly reflect the overall economic outcome, as it only shows relative changes from a baseline condition. When analyzed in absolute terms, the results show that the revenue increase—USD 16,679 per bioreactor—is significantly higher than the increase in inoculum acquisition costs, which ranged from USD 443.26 to USD 1329.77 in Strategy 1, and from USD 443.26 to USD 601.27 in Strategy 2 when the propagation unit was already installed, or up to USD 661.98 when the installation of new equipment was required. These findings support the economic advantage of increasing the initial cell mass, especially when adopting Strategy 2, which results in the lowest absolute financial impact.
In this study, the economic assessment was conducted through computational simulations developed in Visual Basic for Applications (VBA), a programming language integrated into Microsoft Excel. This approach enabled the estimation of the economic outcome of the tested strategies within an industrial context. However, it should be noted that the practical implementation of Strategy 2 depends on operational factors, such as the availability of propagators with idle capacity, additional energy consumption, and adequate infrastructure to support longer propagation times.
Additional energy consumption could also be a limiting factor, especially in plants where energy costs represent a significant share of the total operational cost. Depending on the industry’s energy consumption profile and local electricity tariffs, the economic performance of this strategy may vary considerably. Another critical aspect is the need for enhanced operational control to prevent contamination during longer propagation periods, which may require adjustments in sanitation protocols and stricter microbiological monitoring.
The economic assessment presented in this study was conducted by considering average market prices for yeast and ethanol during the 2024/2025 period. However, the economic viability of optimizing the inoculum strategy may be influenced by external factors, such as fluctuations in raw material (maize) and electricity costs, which directly impact fermentation operational costs. Previous studies indicate that the prices of these inputs can experience significant variations due to seasonal factors, subsidy policies, and fluctuations in the global market [
38]. Additionally, ethanol market dynamics may also influence the choice of the optimal strategy. During periods of high demand and elevated ethanol prices, maximizing productivity may be more relevant than reducing input costs, making an increase in initial cell mass an attractive strategy. Conversely, when ethanol prices are low, operational efficiency and cost reduction become even more critical for the financial sustainability of the plant.
Although the sensitivity analysis demonstrated the influence of dry yeast price on the economic assessment, a more comprehensive evaluation could include different price scenarios for the key process inputs. A rise in dry yeast costs would reinforce the advantage of extended inoculum propagation, whereas an increase in electricity costs could negatively impact this strategy. Future analyses could therefore explore broader economic scenarios, considering seasonal and market fluctuations, to develop robust strategies that remain viable under different economic conditions.
This investigation evaluated inoculum propagation optimization using maize hydrolysate as a substrate, a widely used raw material in ethanol production. While this study was conducted using maize as the substrate, the proposed strategy is also applicable to other carbohydrate-rich feedstocks commonly used in industrial fermentation, such as sugarcane juice and molasses. Future studies could investigate its applicability in more complex media, including lignocellulosic hydrolysates. These materials pose additional challenges due to the presence of inhibitors derived from biomass pretreatment and the complexity of fermentable sugar release. Exploring inoculum propagation in this context could contribute to the advancement of second-generation ethanol processes, which still face operational and technological challenges for industrial consolidation.
4. Conclusions
The results of this investigation provide a detailed evaluation of the technical and economic impact of two strategies for increasing the initial cell mass in industrial maize ethanol production processes, aiming to enhance volumetric productivity. First, laboratory experiments demonstrated that specific substrate consumption follows a hyperbolic behavior in relation to the initial cell concentration. This behavior reflects a higher metabolic efficiency at lower concentrations and stabilization at asymptotic values at higher cell densities. This experimental characterization is essential for modeling and simulating industrial scenarios, allowing for trend prediction and process optimization.
From an economic standpoint, Strategy 2 (extending propagation time) proved to be significantly more cost-effective than Strategy 1 (increasing the initial dry yeast mass). In Strategy 1, the cost of inoculum acquisition reached USD 1329.77 per bioreactor, while in Strategy 2 it ranged from USD 601.27 (in facilities with existing propagation infrastructure) to USD 661.98 (when new equipment must be installed), resulting in savings of USD 667.79 (or USD 1.51/m3 of ethanol produced) per bioreactor when new equipment is required, or USD 728.50 (or USD 1.65/m3 of ethanol produced) when the propagation unit is already installed. Furthermore, inoculum costs represented 0.6681% of the revenue in Strategy 1, compared to 0.3326% and 0.3021% in Strategy 2 with and without capital cost, respectively. Both strategies led to a productivity-related revenue increase of USD 16,679.00 per bioreactor, reinforcing the economic relevance of optimizing initial cell mass.
In Strategy 1, the total cost was predominantly influenced by the elevated price of commercial dry yeast. Conversely, Strategy 2 incurs a lower additional cost, primarily due to the diminished impact of ethanol production losses. This suggests that in-house yeast propagation may offer a more economically viable alternative to direct dry yeast supplementation.
The findings of this study demonstrate that choosing a strategy to increase the initial cell concentration in the bioreactor must be preceded by an economic assessment. Although extending the propagation time has proven to be the most advantageous alternative under the analyzed conditions, its implementation depends on operational factors, such as the availability of propagators, energy costs, and potential infrastructure investments. In plants where propagators are already operating at full capacity, the need for structural adjustments may impact the economic performance of this approach, reinforcing the importance of a case-specific assessment before implementation.
This work contributes to the literature by integrating economic assessments with detailed experimental data, addressing knowledge gaps regarding the financial implications of different strategies for increasing inoculum mass. The results emphasize the need for an integrated approach that evaluates not only productivity gains but also associated costs and operational challenges, fostering more efficient and sustainable practices in the industrial maize ethanol sector.


