1. Introduction
With the rapid advancement of China’s urbanization, the efficient utilization of urban underground space has become a critical factor in supporting sustainable urban development. Underground utility tunnels, as an innovative form of municipal infrastructure, are designed to achieve unified installation and intelligent management of various utility lines—including water supply and drainage, electricity, and gas. These tunnels effectively address urban problems such as “road zipper” syndrome and frequent pipeline accidents, playing a vital role in enhancing urban operational efficiency and safety [
1,
2]. In recent years, assembled construction has been widely applied in underground engineering, significantly improving quality and efficiency through prefabrication and rapid on-site installation [
3]. Among these approaches, composite precast assembled structures, which combine precast and cast-in-place methods, optimize construction duration while ensuring structural integrity and have gradually emerged as an important approach for underground utility tunnel construction [
4].
As an enclosed, elongated space, the utility tunnel exhibits significant differences in gas explosion compared to conventional indoor environment. Gas concentration, gas volume, and obstacle configuration are identified as the primary factors influencing explosion loads. Studies indicate that methane mixtures under stoichiometric concentration (9.5%) generate prominent explosion phenomenon in confined spaces [
5,
6]. Obstacles enhance explosion overpressure by facilitating the transition from laminar to turbulent flame [
7,
8]. Additionally, a positive correlation exists between methane volume and overpressure [
9]. For overpressure prediction, researchers have proposed both empirical equations and artificial intelligence models that incorporate multiple factors [
10,
11].
In the study of dynamic response of tunnels under explosive loads, researchers have conducted extensive investigations [
12,
13,
14]. Shearer et al. [
15] conducted a structural spectral analysis using an equivalent single-degree-of-freedom method, revealing the coupling effect between explosive loads and structural vibrations. Wang et al. [
16] quantitatively evaluated the deformation resistance of tunnel joints under varying constraints through a rotation angle analysis. Huang et al. [
17] developed a three-dimensional refined numerical model to systematically analyze the dynamic response and blast resistance of prefabricated framed tunnels under internal explosive loads; their work identified the key parameters influencing structural resilience, including middle partition wall thickness and stirrup spacing.
Current research on composite precast assembled utility tunnels primarily focuses on static and seismic performance. Studies have demonstrated that these structures exhibit favorable integrated mechanical performance; however, bottom joints remain susceptible to flexural-shear failure, whereas shear-dominated failure is primarily observed at wall-plate ends [
18,
19,
20]. Investigations into seismic behavior indicate that these structures possess sufficient ductility, though haunch regions and interfaces constitute critical vulnerabilities [
21]. Recent advancements in numerical modeling, such as the Hybrid Finite-Discrete Element Method (HFDEM), have been applied to fracture analysis in brittle materials, potentially enabling more detailed characterization of structural failure mechanisms [
22,
23].
The existing research on blast resistance in utility tunnels has predominantly concentrated on cast-in-place structures, leaving the composite precast assembled tunnels under explosion unexplored. Static and seismic testing have revealed that the new-to-old concrete interface constitutes structural vulnerability, yet its performance under explosive loads remains poorly characterized. Damage to the interface under blast loads could lead to a significant reduction in the structural stiffness, thereby compromising the blast resistance. Therefore, it is essential to investigate the failure modes and dynamic response of composite precast assembled utility tunnels subjected to blast loads. In this context, the present study employs numerical simulation methods—validated by experiment—to systematically examine the mechanical characteristics of composite precast assembled utility tunnels under gas explosion. The investigation focuses on the effects of key parameters, including the peak pressure, interface strength at the new-to-old concrete, concrete strength, and reinforcement construction, on the blast resistance of the structure. The findings aim to provide a theoretical foundation for the blast-resistant design of such structural systems.
2. Numerical Modelling of Composite Precast Assembled Concrete Utility Tunnels Under Intensive Dynamic Loadings
The reliability of numerical simulation is crucial for ensuring the accuracy and credibility of research findings. The model validation comprises two components: (1) blast resistance tests of reinforced concrete composite slabs as conducted by Tian et al. [
24] and (2) blast resistance tests of underground utility tunnels as conducted by Pan et al. [
25]. The first test was selected for validation for two primary reasons: First, the test specimen is reinforced concrete composite component, which has similarities with the composite precast assembled utility tunnels. Second, the load characteristics employed in the test are comparable to those of gas explosion in terms of temporal variations. The second test was selected for its contextual relevance. The experimental subject is an underground utility tunnel, which shares key characteristics with the composite prefabricated utility tunnel in this study. These include exposure to blast loads, an underground burial environment with surrounding soil, and symmetric and non-reflective boundary configurations. This section presents a comparative analysis between the numerical results and experimental data, focusing specifically on failure modes and displacement responses.
2.1. Overview of Blast Resistance Tests of Composite Slabs
The explosion tests on reinforced composite precast concrete slabs conducted by Tian et al. [
24] were performed under varying scaled distances. Three scaled distances (1.0, 0.8, and 0.6 m/kg
1/3) were achieved by adjusting the standoff distance of the explosive charges (1.95 m, 1.27 m, and 0.95 m). The test setup is illustrated in
Figure 1.
The experimental specimens consisted of a prefabricated layer and a cast-in-place layer, with overall dimensions of 2400 mm × 1000 mm × 100 mm. Each layer had a thickness of 50 mm, and inter-layer bonding was enhanced using truss steel reinforcements. The detailed configuration is shown in
Figure 2. Rebars with a diameter of 10 mm and a yield strength of 448 MPa were used. The concrete used was of grade C30, with a standard cylindrical compressive strength of 29.92 MPa.
In this study, the case corresponding to a scaled distance of 0.6 m/kg
1/3 was selected as the case for validation. Displacement sensors were installed at the mid-span, one-quarter span, and one-eighth span of the specimen, as indicated in
Figure 3.
2.2. Material Model and Relevant Parameters
The explicit dynamic analysis software LS-DYNA R11.0 was employed for numerical simulation in this study. It utilizes an explicit time integration algorithm and offers a wide range of built-in material models, making it well-suited for accurately simulating the nonlinear mechanical behavior and damage evolution of structures subjected to blast loads.
2.2.1. Concrete
Given the complex mechanical behavior of concrete under explosive loads, the K&C concrete damage model (*MAT_CONCRETE_DAMAGE_REL3) was adopted in this study to capture the nonlinear characteristics of the structure. This model characterizes concrete damage evolution through three failure surfaces, enabling the effective simulation of dynamic response under high strain rate conditions.
The failure process of concrete can be divided into three stages: elastic, plastic hardening, and softening. In the K&C model, these stages are represented by the initial yield surface, maximum failure surface, and residual surface, respectively [
26]:
where
p denotes the pressure, and
,
, and
represent initial yield surface, maximum failure surface, and residual surface, respectively. Parameters
are used to define the shapes of these strength surfaces.
The deviatoric stress failure surface, based on the second invariant of the deviatoric stress tensor, is defined as follows:
where the second invariant of the deviatoric stress
;
,
and
represent the principal deviatoric stresses.
The plastic surface exhibiting strain hardening, which develops after the initial yield surface is reached, can be obtained through interpolation between the initial yield surface and the maximum failure surface. The expression is given as follows:
Similarly, the strain-softening failure surface was defined as an interpolation between the maximum failure surface and the residual surface, specifically defined as follows:
Surface interpolation is facilitated through processes of softening and hardening, governed by an internal scaling variable
η (referred to as the yield ratio factor). This variable is controlled by the damage function
λ, which is calculated by the following expression:
where
denotes the effective plastic strain,
and
represent parameters characterizing concrete hardening and softening behaviors, respectively, and
indicates the tensile strength of concrete under quasi-static conditions.
Considering the effects of high strain rate (100~1000 s
−1) on concrete subjected to blast load, a dynamic increase factor (
DIF) is typically incorporated in the model. The
DIF is commonly defined as the ratio of the dynamic strength to the static strength at a given strain rate. The
DIF for the tensile strength is determined by the following equation [
24]:
where,
denotes strain rate,
ftd represents the dynamic tensile strength at a strain rate of
, and
fts is the static tensile strength. The value of
is set to 1 × 10
−6 s
−1,
,
, and the reference compressive strength
fc0 is taken as 10 MPa.
The
DIF for the compressive strength is determined by the following equation:
where
fcd and
fcs represent the dynamic compressive strength and static compressive strength, respectively.
denotes the strain rate of the material under dynamic loads;
is taken as 10
−5 s
−1;
. When the strain rate exceeds 200/s, the
CDIF is typically determined based on a strain rate of 200/s.
The material parameters of concrete used in this study are summarized in
Table 1. Based on the experimental results, certain automatically generated parameters were adjusted to more accurately represent the characteristics of this specific case [
24].
The keyword *MAT_ADD_EROSION is implemented as an element erosion criterion to remove elements undergoing severe deformation, thereby enhancing the stability and efficiency of numerical calculations [
27,
28,
29]. In this study, a critical strain value of 0.13 is adopted to reasonably approximate the damage evolution process of concrete.
2.2.2. Rebars
The *MAT_PLASTIC_KINEMATIC model is employed to simulate the elastoplastic behavior and strain rate effects of reinforcement. It effectively captures the dynamic response of reinforcement by accounting for both isotropic and kinematic hardening characteristics, incorporating the Cowper-Symonds constitutive relationship. The yield function is expressed as follows [
30]:
where
represents the strain rate;
C and
P are characterized as the strain rate parameters;
is the initial strain strength;
β is the hardening parameter;
Ep is denoted as the plastic hardening modulus; and
is the effective plastic strain. The parameters are summarized in
Table 2.
In
Table 2,
ρ0 represents the density;
E denotes the elastic modulus; PR corresponds to Poisson’s ratio; STGY is defined as the yield stress; ETAN characterizes the tangent modulus; and FS represents the failure strain.
2.3. Geometric Model
Prior to establishing the numerical blast-resistant model of the composite precast slab for validation, a three-dimensional model of the composite precast slab was developed, as illustrated in
Figure 4. The model consisted of a prefabricated reinforced concrete composite slab and steel supports. A layered modeling approach was adopted, with C30 concrete used for both the precast layer and the cast-in-place layer, each having a thickness of 50 mm. The reinforcement was embedded within the concrete using the keyword *CONSTRAINED_BEAM_IN_SOLID, which eliminates relative slip between rebars and concrete.
In LS-DYNA, several methods can be utilized to model the interface between new and old concrete. These methods primarily include tie-break contact models, cohesive zone modeling (CZM), and contact algorithms that incorporate damage evolution within the constitutive models of the concrete materials. CZM provides a realistic representation of interface crack initiation and propagation, including mixed-mode failure and material softening [
31]. However, its implementation is complex, requiring identification of material parameters like
GIC and
GIIC. Moreover, the results are highly sensitive to mesh size, potentially leading to increased computational costs [
32].
In this study, the interface connection between the precast layer and the cast-in-place layer is simulated using the keyword *CONTACT_TIEBREAK_SURFACE_TO_SURFACE. By incorporating a stress failure criterion, it can effectively describe the bonding and failure processes of the interface [
33]. The failure criterion is defined by
where
σn and
σs represent the normal stress and shear stress on the contact surface, respectively;
NFLS and
SFLS denote the normal failure stress and shear failure stress, respectively. When formula (11) is satisfied, the constraint between the contact surfaces is released, thereby simulating the interface debonding phenomenon. The interface failure stresses were defined as
NFLS = 0.81 MPa and
SFLS = 1.55 MPa, which had been calibrated against experimental results from tests [
24].
A cylindrical rigid body was employed to simulate the support, with the contact relationship between composite slabs and support primarily defined using keyword *CONTACT_NODES_TO_SURFACE. The static and dynamic friction coefficients of the contact surface were set to 0.3 and 0.2, respectively.
Considering both computational efficiency and accuracy, the keyword *LOAD_BLAST_ENHANCED was employed. It is based on the CONWEP empirical formula, which provides accurate predictions of the pressure while maintaining high computational efficiency [
34]. In comparison, the direct load method, while simple to implement, struggles to accurately simulate the propagation characteristics of blast waves. On the other hand, the fluid-structure coupling method offers the highest accuracy but incurs prohibitively high computational costs.
2.4. Numerical Model Validation
In the experiment, the TNT charge was positioned less than 1 m away from the slab, resulting in predominantly unidirectional bending failure characteristics of the slab. A comparison of concrete damage patterns between experimental and numerical results is presented in
Figure 5. The findings suggest that the numerical simulation effectively captures the development of plastic damage, with crack distribution patterns showing good agreement with experimental observations. However, differences of damage in the support area may be attributed to the selection of support materials. In the experiment, steel was used, whereas a rigid body material was adopted in the numerical model to ensure effective boundary constraints. This discrepancy led to a comparatively higher degree of localized concrete damage in the simulation.
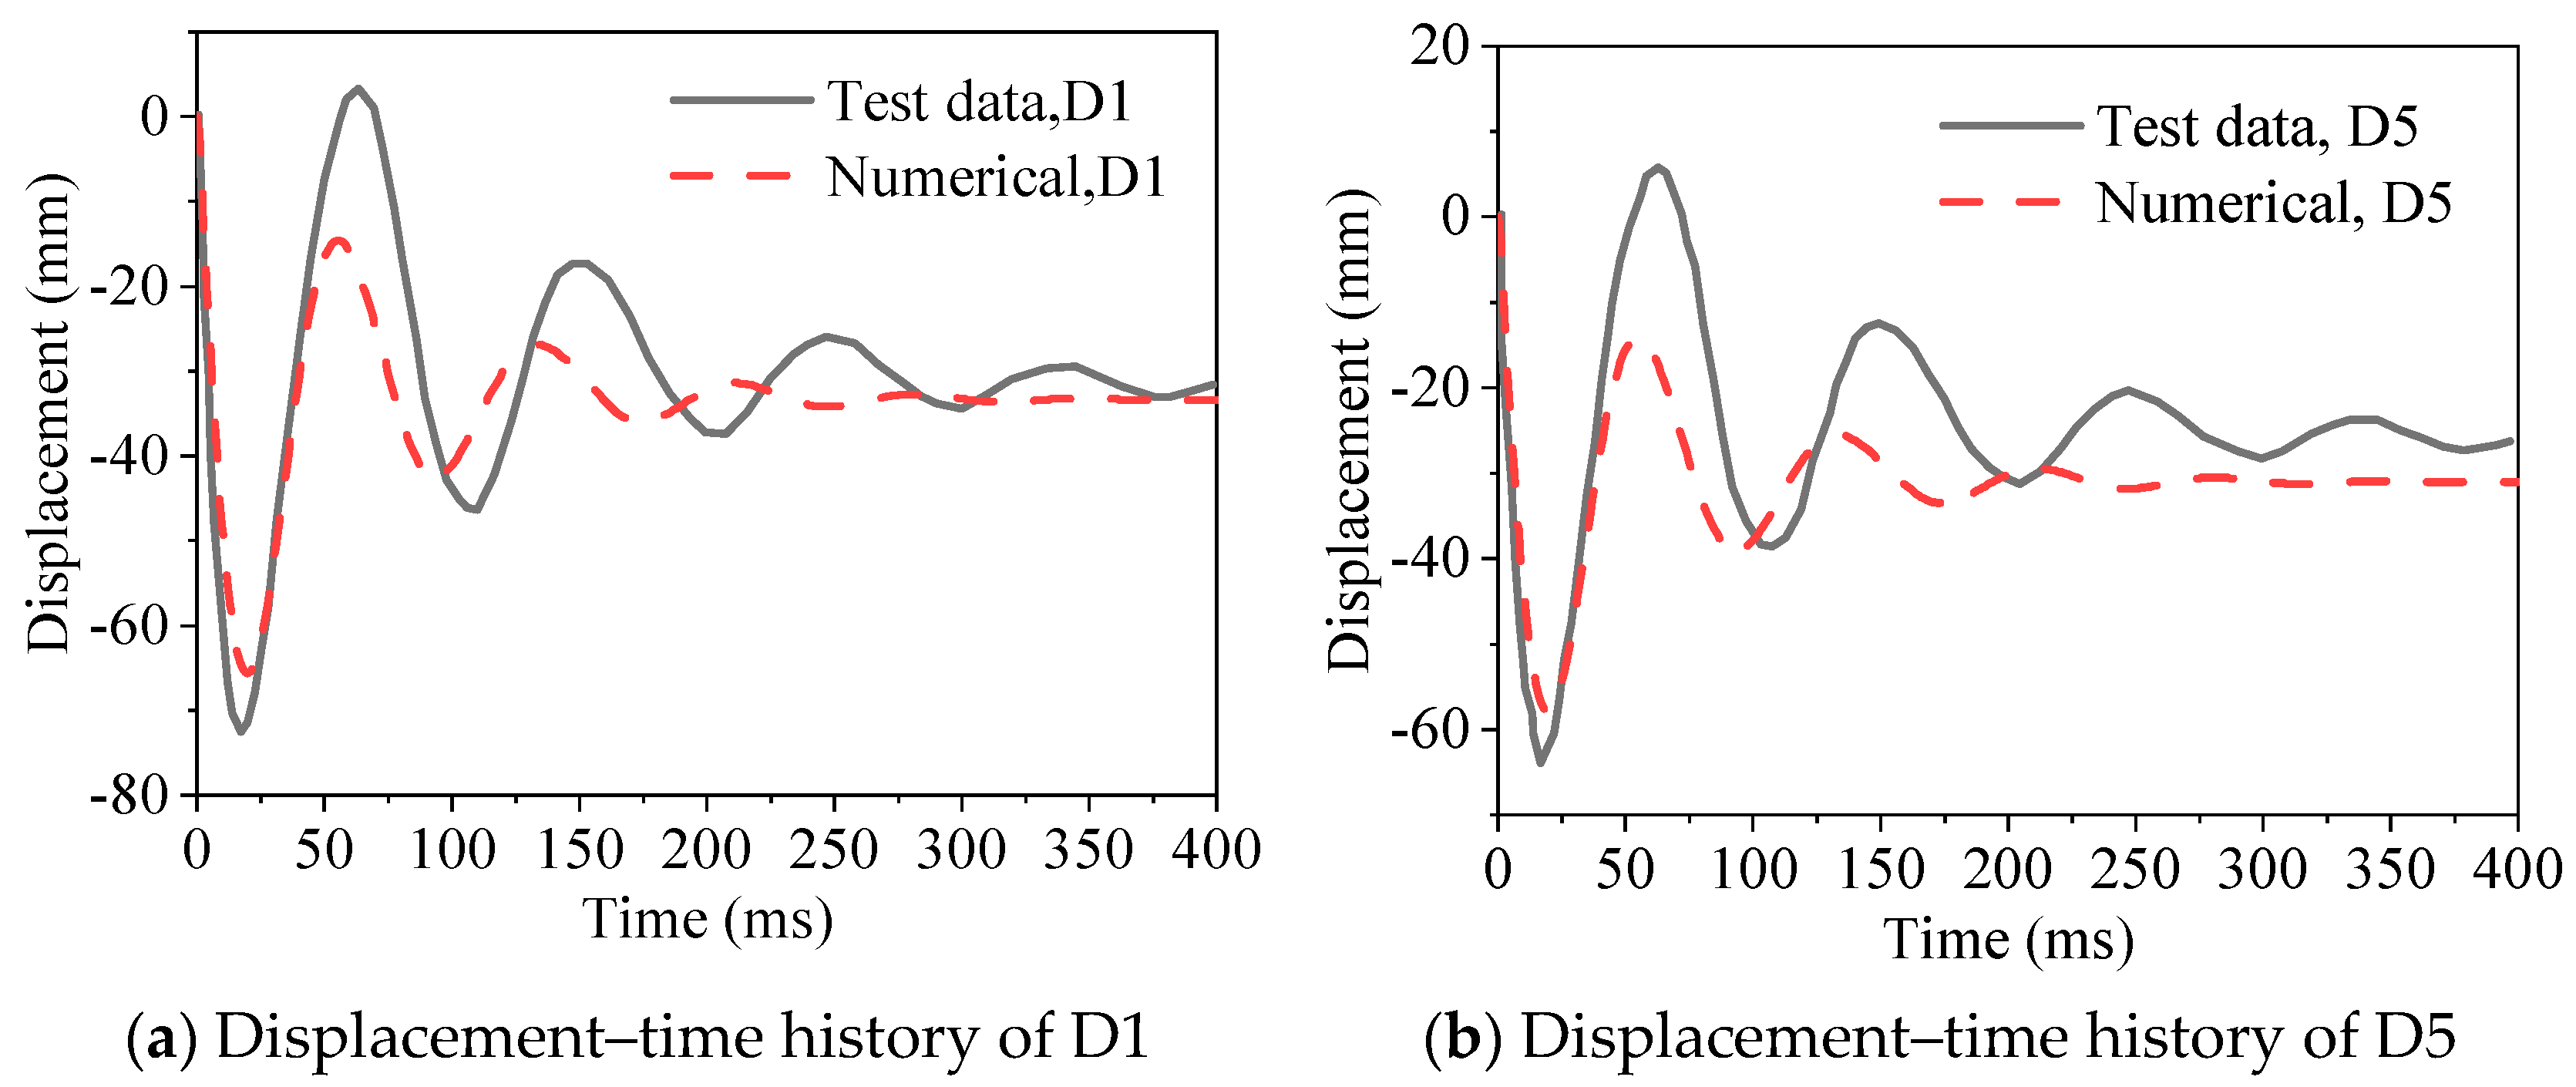
Figure 6 presents the comparison of deflection-time history at points D1 and D5. The experimental and simulated curves exhibit generally consistent trends, with peak displacements occurring at t = 17.3 ms and t = 20.0 ms, respectively, corresponding to a peak error of 9.8%. The agreement between experimental and simulated displacement responses implicitly validates the strain rate sensitivity of both concrete and reinforcement models, as discrepancies would arise if rate effects were misrepresented. The adopted DIFs and Cowper-Symonds parameters align with widely accepted empirical ranges for concrete and steel under blast loading. In addition, the erosion criterion aligns with experimental failure thresholds and prior validated studies, ensuring accurate representation of concrete damage without premature element deletion (
Figure 5).
However, reduced agreement was observed during the subsequent oscillation phase. This discrepancy is attributed to energy dissipation caused by the finite stiffness of the experimental supports during vibration-induced unloading effects. The limited stiffness led to partial energy absorption, resulting in diminished oscillation amplitudes. This numerical model accurately captures the dynamic response characteristics of reinforced concrete composite slabs subjected to explosion loads.
The second validation task focuses on the blast resistance tests conducted on underground utility tunnels. The boundary and loading methods in the numerical model were established following the methodology outlined in reference [
25]. For this validation, the case CS16 in the reference was selected.
Figure 7 compares the experimental and numerical results, revealing an error margin of less than 10%, which demonstrates the high accuracy of the numerical model.
These results fully indicate that the numerical model not only successfully verifies the mechanical response of prefabricated composite components under blast loads but also exhibits strong validation capabilities for the overall blast resistance of underground utility tunnel structures.
3. Performance of Composite Precast Assembled Utility Tunnels Under Internal Gas Explosions
Based on the numerical model validation in Chapter 2, a three-dimensional nonlinear numerical model was developed to investigate the dynamic response characteristics of typical composite precast assembled utility tunnels under internal gas explosion loads. Through numerical simulations, the failure modes and dynamic responses of the tunnel were thoroughly analyzed, with particular focus on the behavior of the interface. These findings are expected to provide a foundation for the blast-resistant design of composite precast assembled utility tunnels.
3.1. Numerical Model of Composite Precast Assembled Utility Tunnel
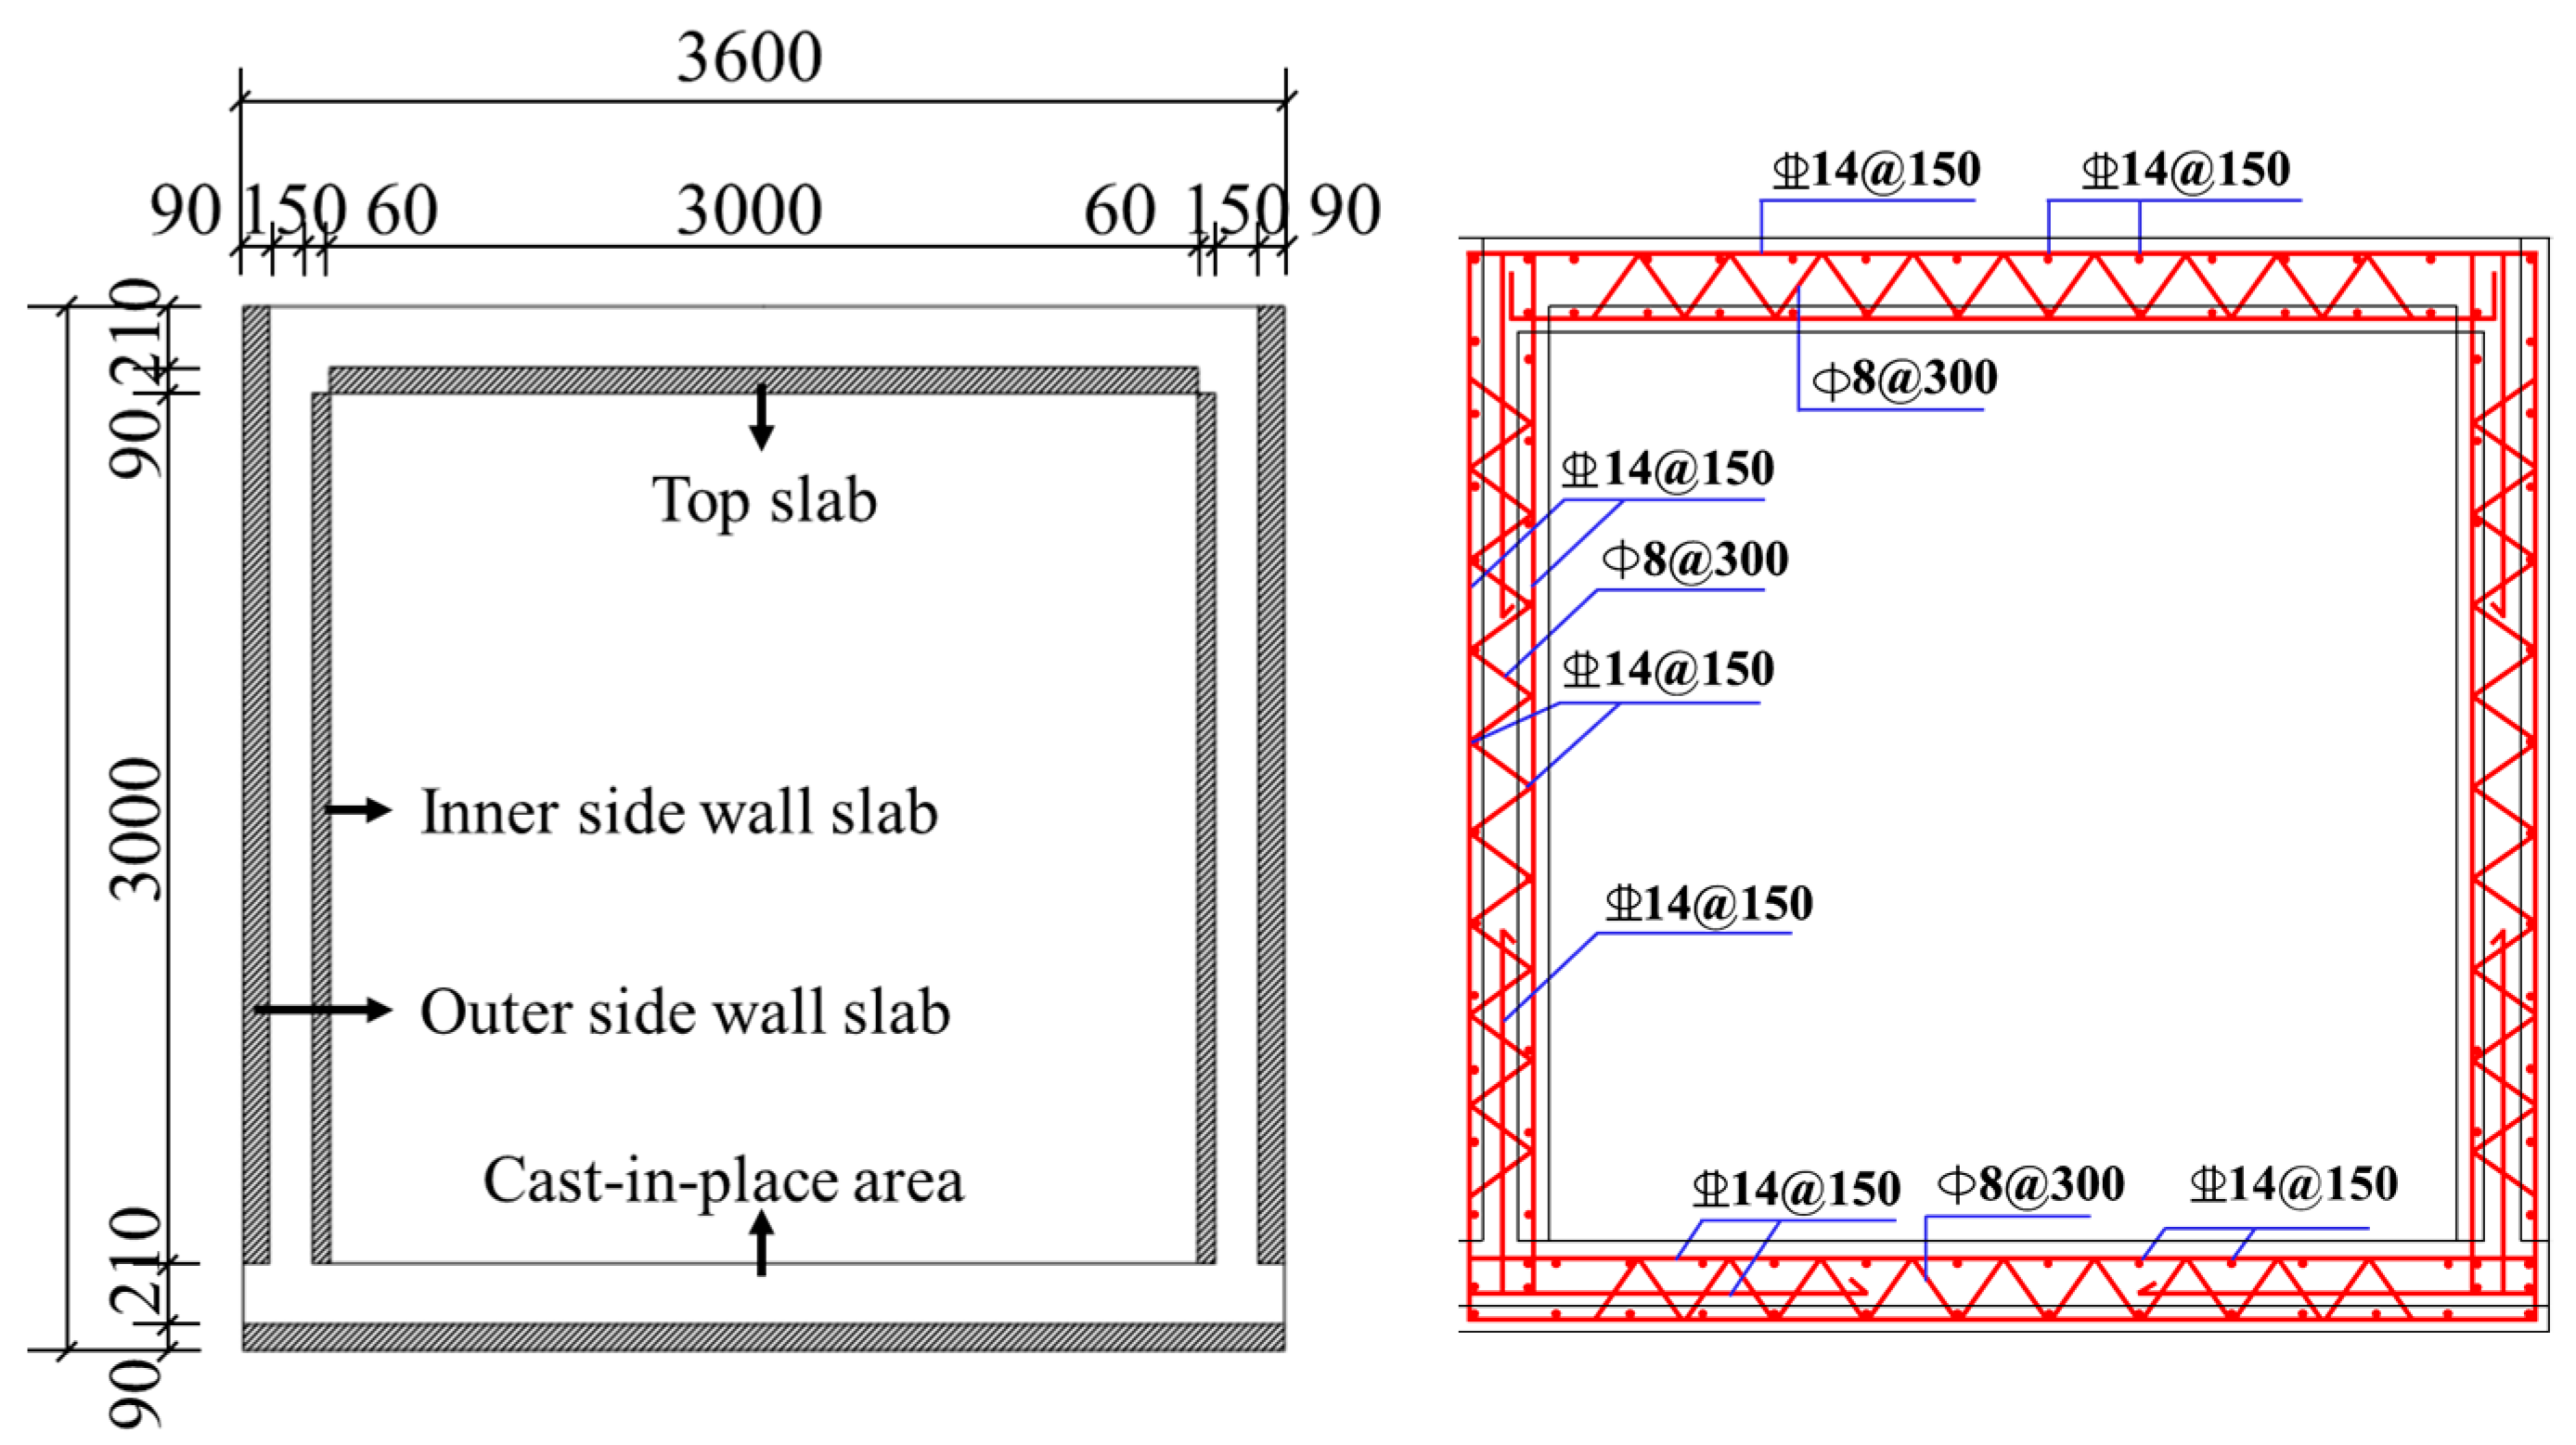
In this study, a single-chamber utility tunnel with an assembled composite slab structure was designed in accordance with the Technical Code for Underground Utility Tunnel Engineering (GB 50838-2015 [
35]). The structural configuration is shown in
Figure 8. The utility tunnel combines precast concrete with cast-in-place concrete, resulting in a total wall thickness of 300 mm. The precast components consist of four main parts: the roof slab and the base slab, each comprising 90 mm thick precast slabs, as well as two sidewalls, which feature an outer thickness of 90 mm and an inner thickness of 60 mm.
For the structural materials, C30 concrete is used in both the precast and cast-in-place sections. The primary load-bearing reinforcement consists of HRB400 rebars with a diameter of 14 mm, while the truss reinforcements are fabricated from HPB300 rebars with a diameter of 8 mm.
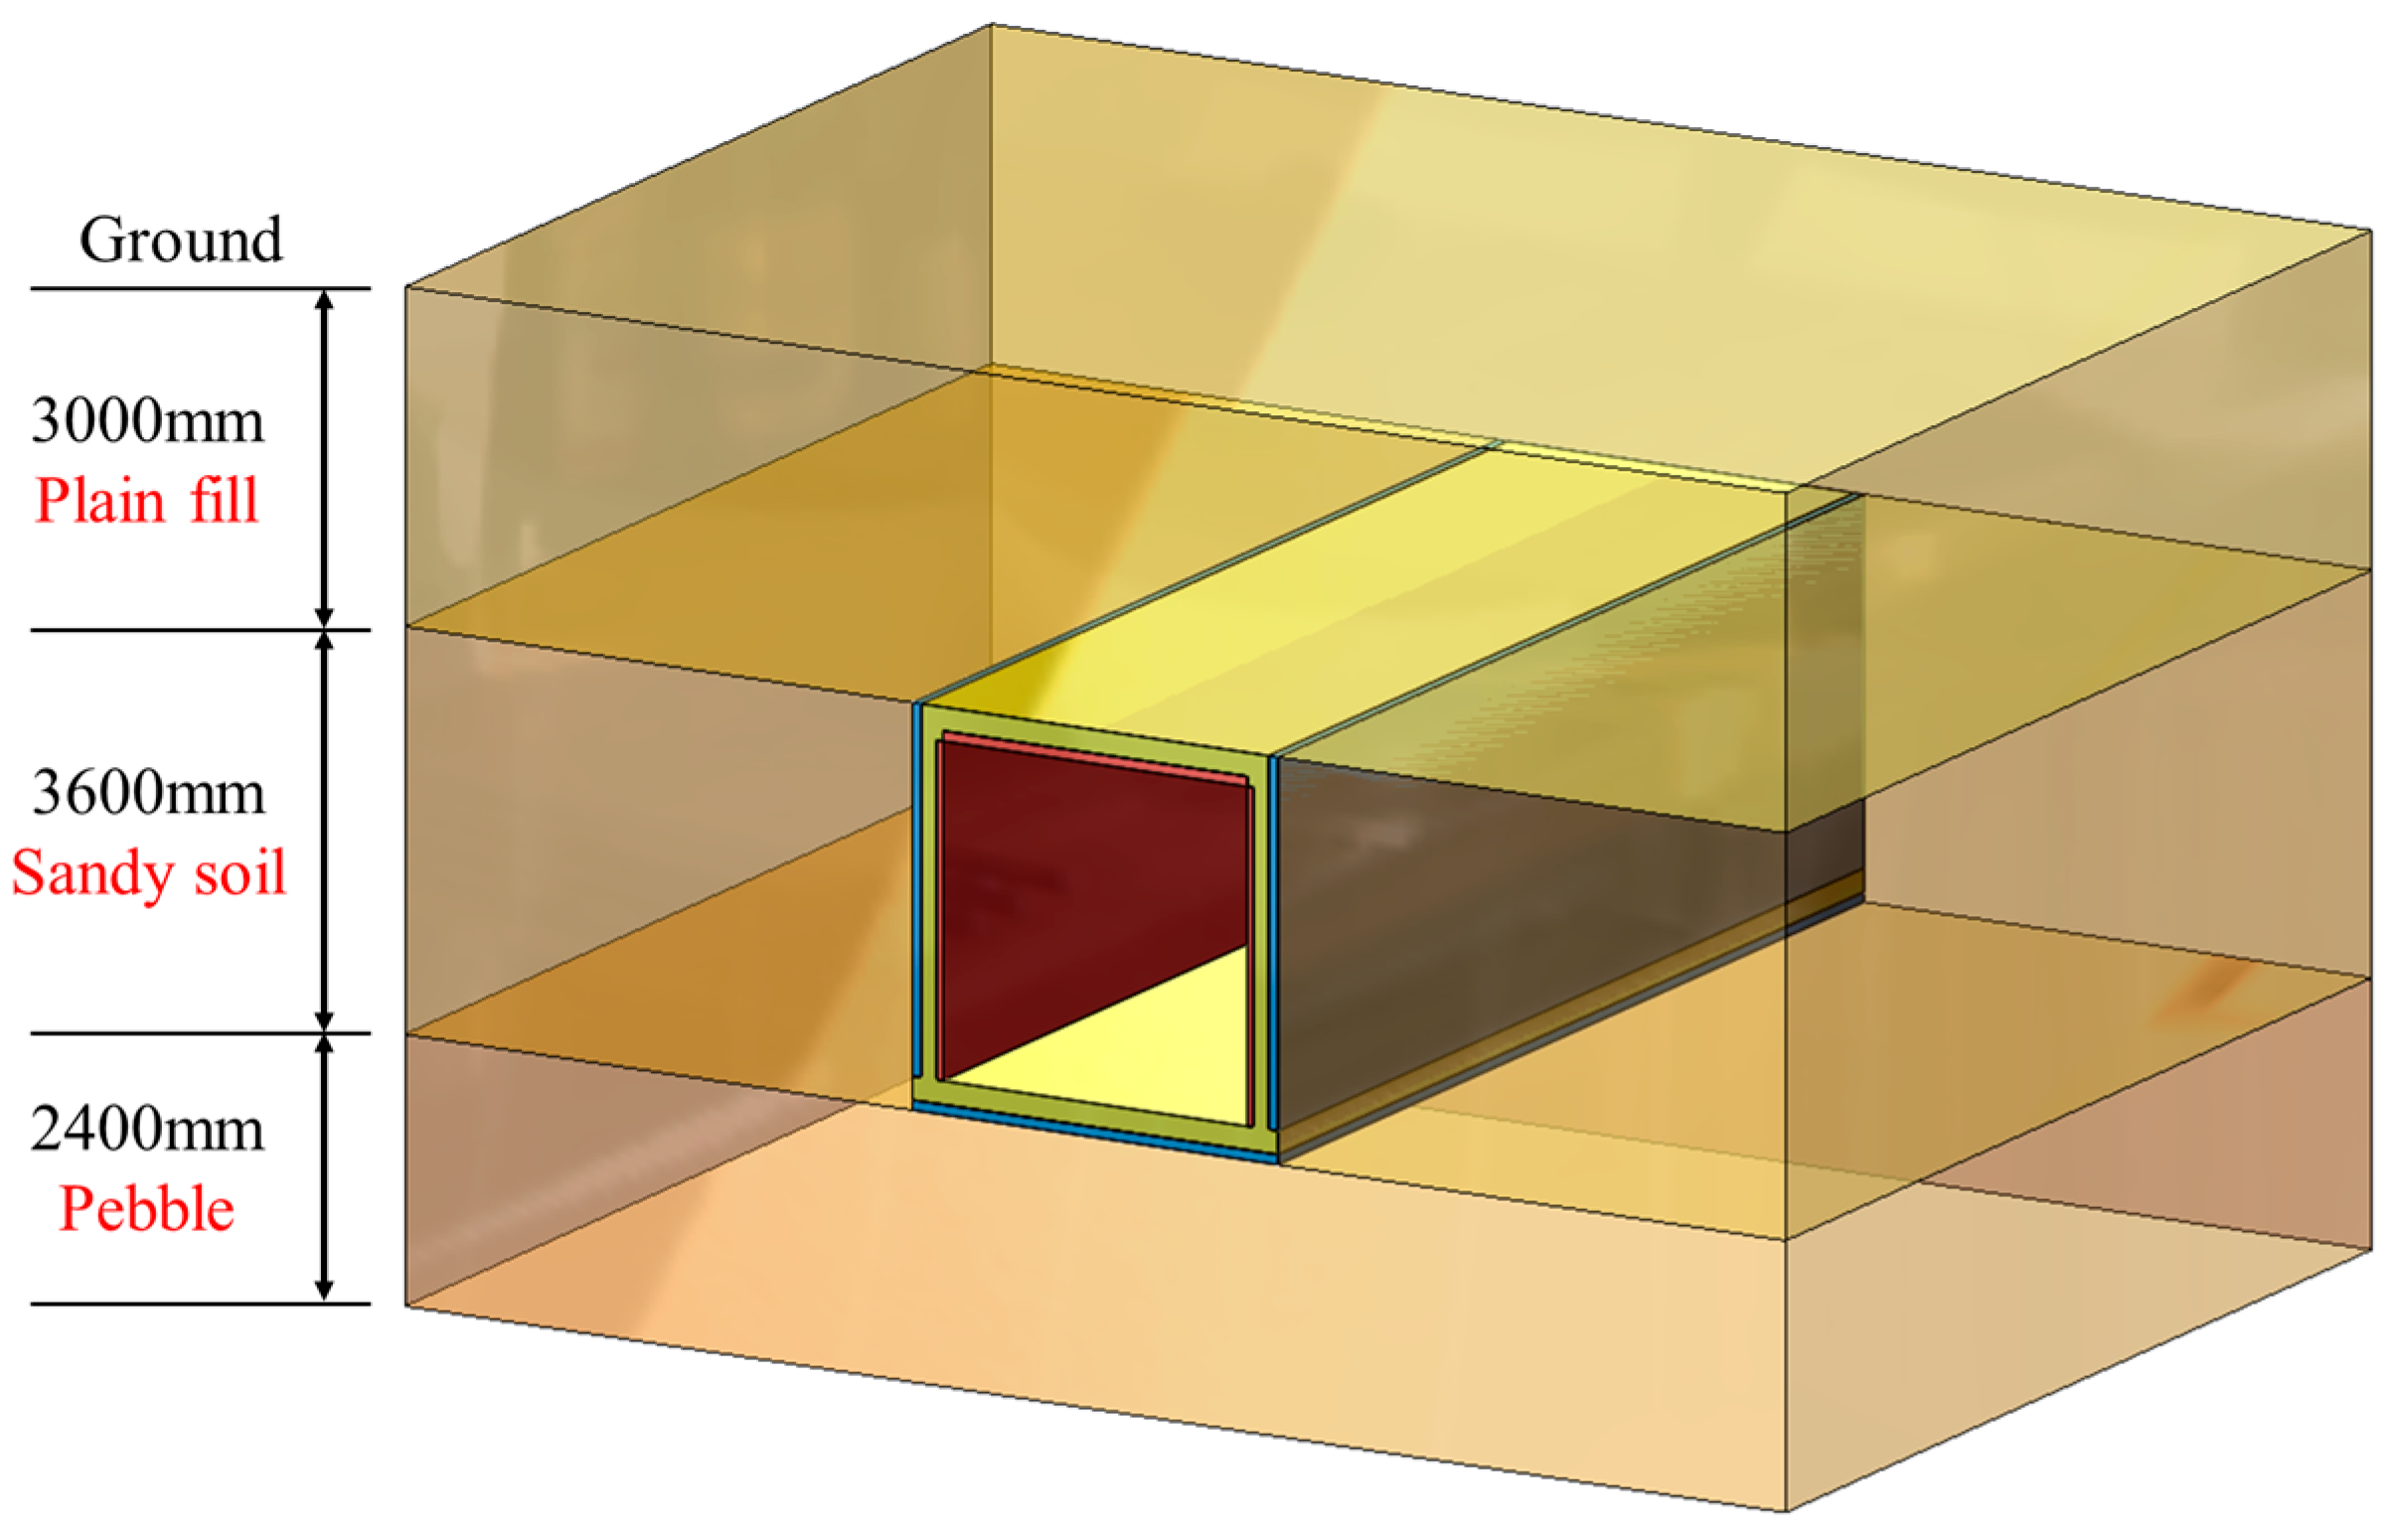
A three-dimensional finite element model, incorporating the concrete structure, steel reinforcement configuration, and surrounding soil was developed, as shown in
Figure 9. Due to the symmetric longitudinal structure of the utility tunnel and the uniform load distribution, a representative 300 mm standard segment was modeled to strike a balance between computational accuracy and efficiency.
SOLID164 hexahedral solid elements were used to model the soil and concrete components, incorporating single-point reduced integration and stiffness hourglass control algorithms to enhance computational precision. To simulate the steel reinforcement, BEAM161 beam elements were employed, which are based on the Hughes-Liu formulation.
To accurately simulate the interactions between structural components under explosion loads, the *CONTACT_ERODING_SURFACE_TO_SURFACE contact was employed at the soil–tunnel interface. This approach effectively models changes and damage to the contact surfaces caused by explosive loads [
36]. Additionally, the *CONTACT_TIEBREAK_SURFACE_TO_SURFACE contact type was utilized at the precast and cast-in-place interface to accurately capture the bond–debond behavior.
The model was simplified using 1/2 symmetry, with symmetric constraints applied to the longitudinal direction plane, which was based on the tunnel’s long, straight geometry and its classification as a plane strain problem [
37]. The model assumes no displacement constraints along the longitudinal direction for any cross-section.
This research focuses on the overall failure modes and dynamic responses of the tunnel under internal gas explosion, so secondary loading effects from reflected waves are excluded; thereby, non-reflective boundary was imposed on the outer surfaces of the soil [
38].
Based on existing experimental studies and simulation validations [
16], the blast load resulting from a gas explosion was approximated as a triangular loading pattern, with both the pressure rise and decay times set to 50 ms and the peak pressure set to 500 kPa. The explosion load and soil pressure were applied using the keyword *LOAD_SEGMENT_SET, while the gravity was applied utilizing the keyword *LOAD_BODY. Load combinations were analyzed in accordance with actual working conditions to reflect real-world operational scenarios.
3.2. Mesh Sensitivity Analysis
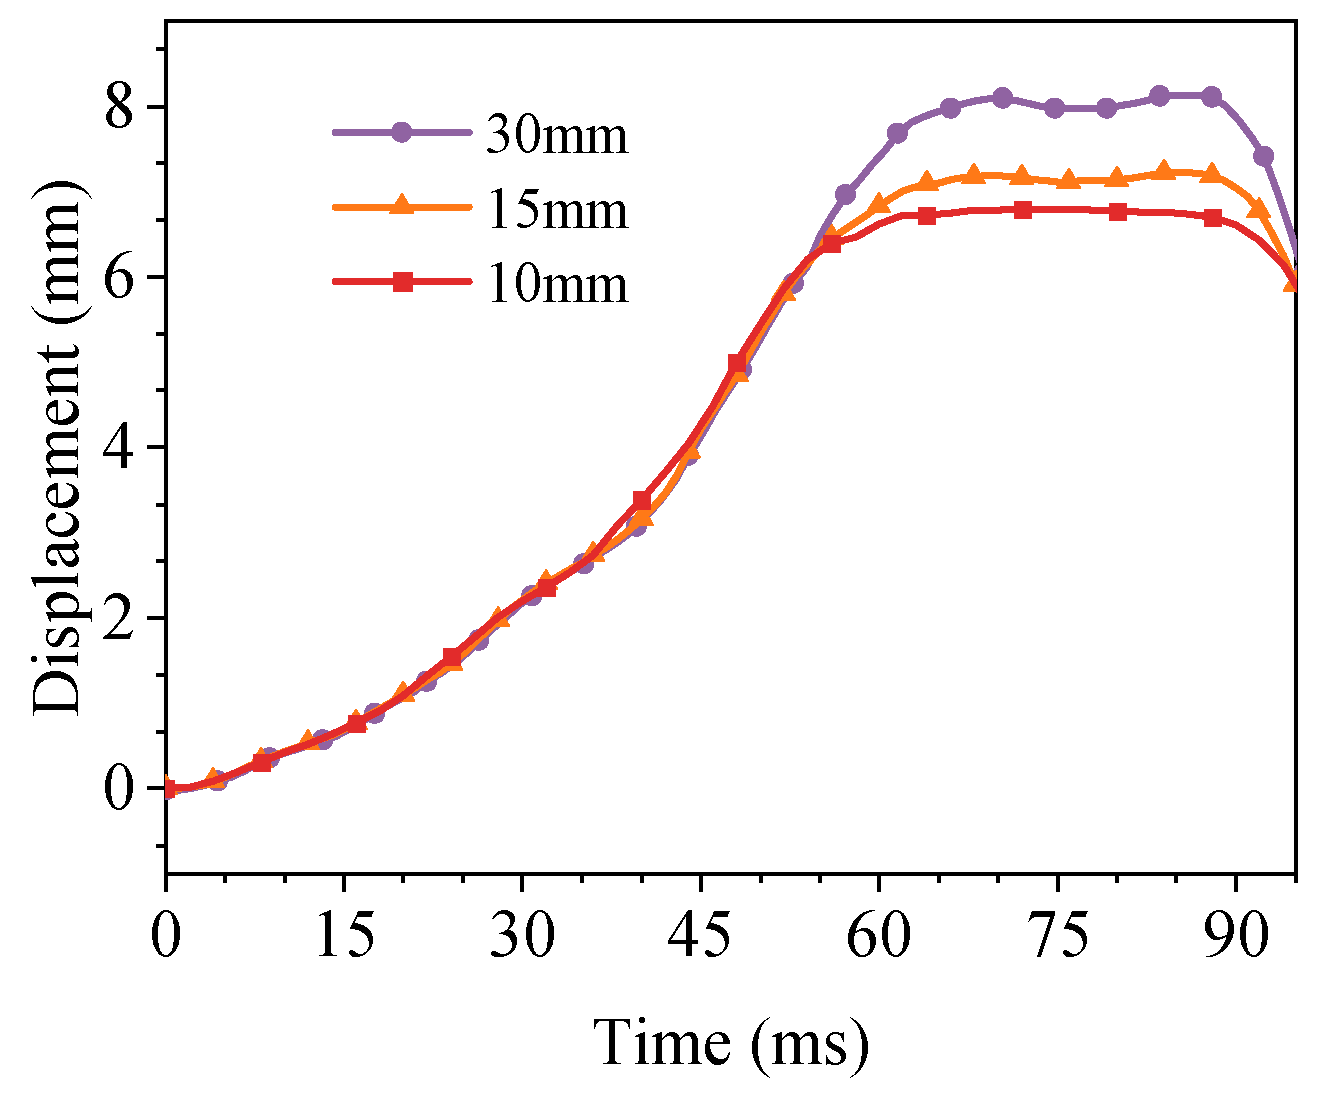
To ensure the reliability of the numerical model, a mesh sensitivity analysis was conducted. Under a peak load of 500 kPa, the effect of mesh sizes (30 mm, 15 mm, 10 mm) on the mid-span displacement of the tunnel roof slab was examined. The results indicate that the displacements corresponding to the three mesh sizes were 8.1 mm, 7.2 mm, and 6.8 mm, respectively (as shown in
Figure 10). Given that the displacement variation became negligible (approximately 5.6%) when the mesh was refined from 15 mm to 10 mm, the results effectively converged. Therefore, considering both computational accuracy and efficiency, a mesh size of 15 mm was adopted for subsequent analyses. The entire model is composed of 8091 beam elements and 352,640 solid elements.
3.3. Dynamic Response of Composite Precast Assembled Utility Tunnel
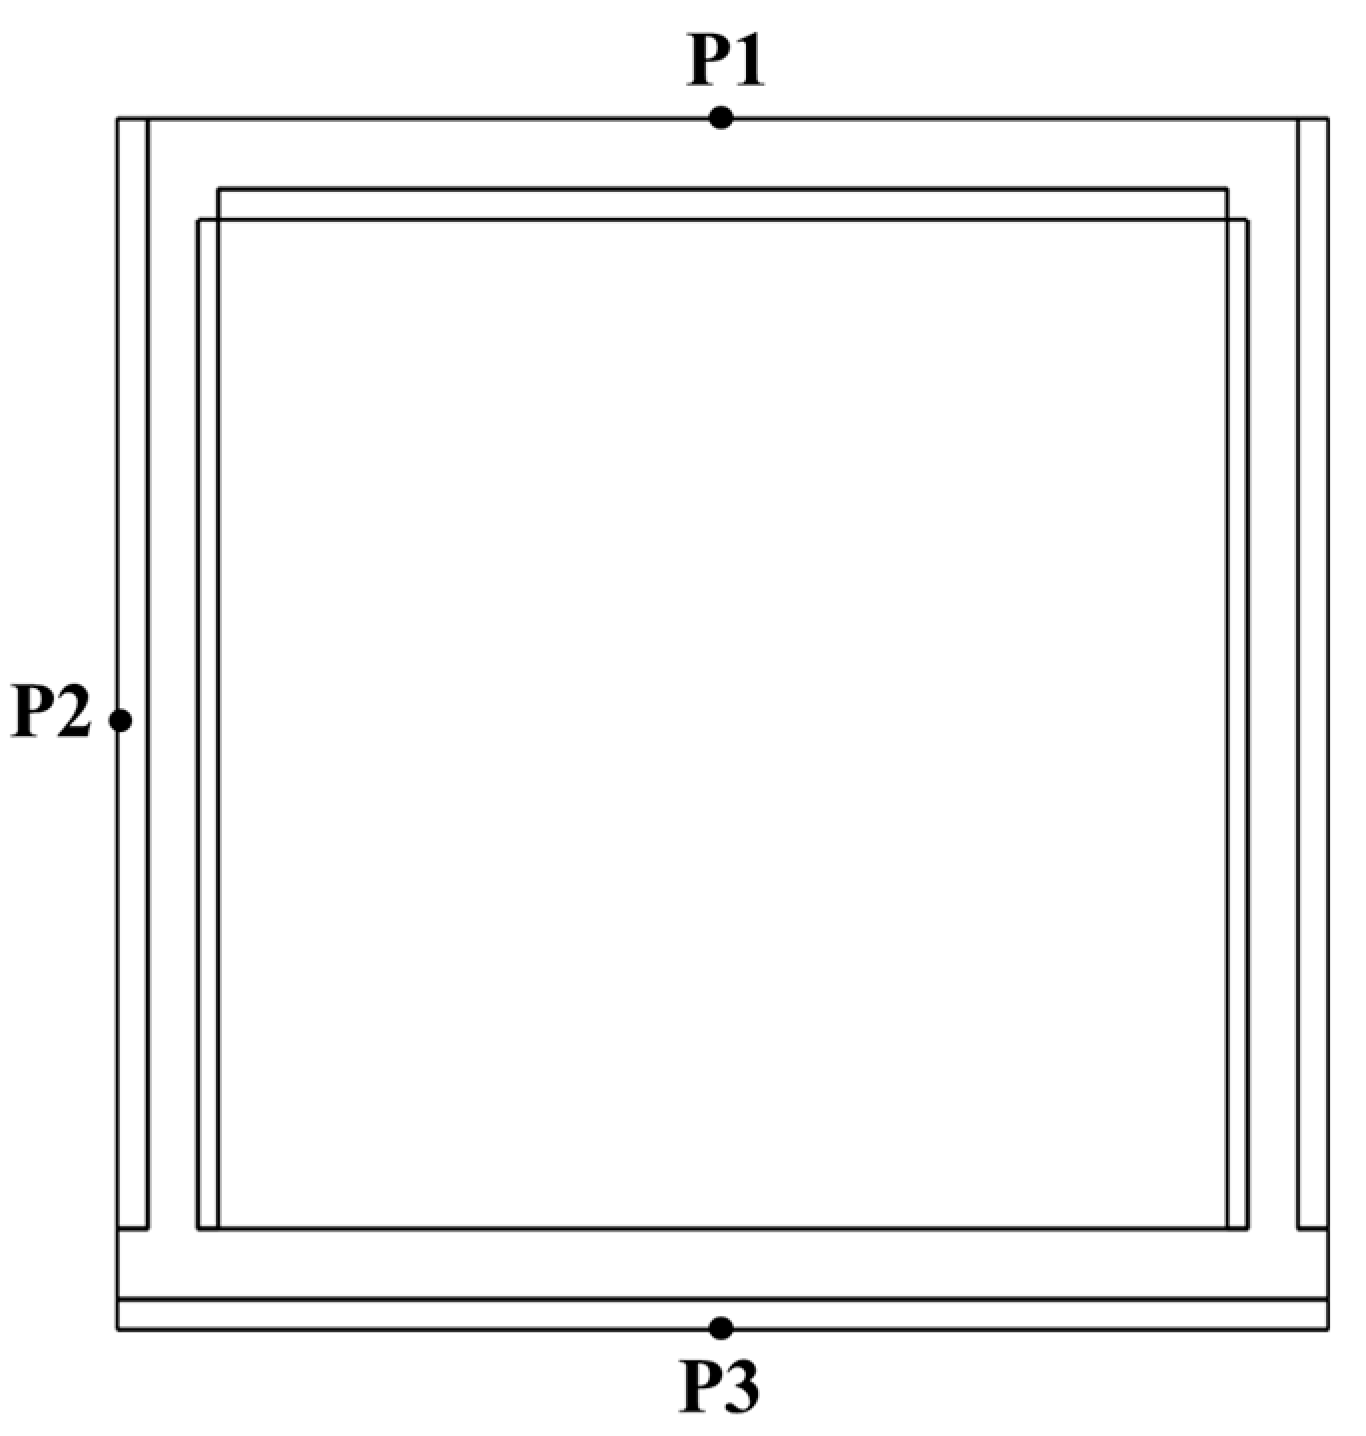
In this section, the dynamic characteristics of the composite precast assembled utility tunnel under blast load are investigated by analyzing displacement, damage evolution, and interface behaviors at critical locations. Three characteristic measurement points were selected: P1 (center of the outer roof slab), P2 (center of the outer sidewall), and P3 (center of the outer base slab), as illustrated in
Figure 11.
The deflection–time history is displayed in
Figure 12. During the initial blast phase (t < 20 ms), all points exhibited similar rates of displacement growth. Subsequently, an accelerated displacement growth rate was observed at P1, while P2 and P3 maintained their original trends. After the blast load reached its peak (t = 50 ms), maximum displacements of 7.2 mm, 3.5 mm, and 4.0 mm were recorded at P1, P2, and P3 at 67 ms, 54 ms, and 54 ms, respectively. Minor oscillations were observed before stabilizing during the rebound phase, with residual displacements of 2.9 mm, 1.1 mm, and 0.7 mm recorded at P1, P2, and P3, respectively.
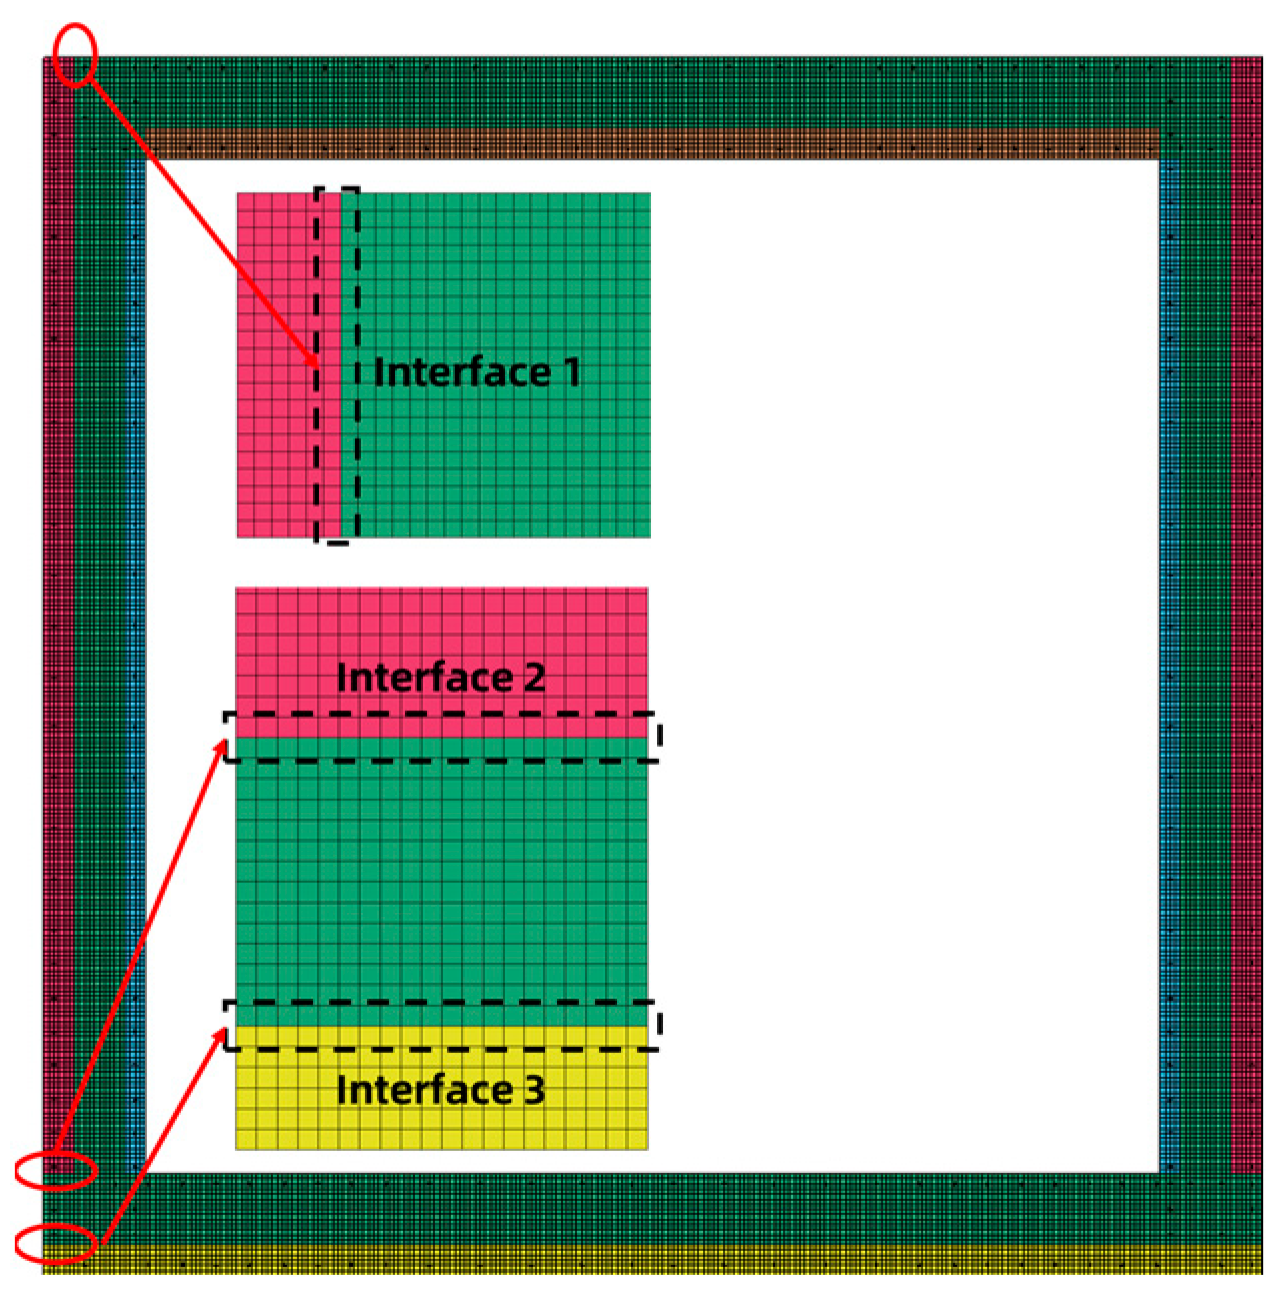
The key distinguishing feature between composite precast assembled utility tunnels and cast-in-place counterparts lies in the structural integrity of the composite interfaces. Damage to these interfaces not only degrades the mechanical performance of the structure but also poses a risk of groundwater infiltration, which may introduce corrosive agents, potentially accelerating the corrosion of steel reinforcement. To evaluate the risks of interface delamination, three critical composite interfaces were selected for monitoring (as shown in
Figure 13). Since the tie-break contact modeling was employed to simulate the interface (illustrated in
Figure 14), the displacement asynchrony at interface nodes was used as an indicator to assess the severity of interface failure.
The evolution of normal relative displacements at three critical interfaces is shown in
Figure 15a. During the initial blast phase (t < 20 ms), minimal normal relative displacements were observed at the interfaces. After 20 ms, accelerated development of relative displacement occurred across all interfaces, with interface 2 exhibiting the most pronounced growth. Beyond 90 ms, further displacement increases were observed at Interfaces 1 and 2 during the rebound phase, suggesting that reciprocal vibrations might exacerbate interface delamination. Residual normal relative displacements were observed across all interfaces, indicating that slight plastic deformation may have occurred.
Distinct characteristics in tangential relative displacements are depicted in
Figure 15b. Shear displacements were initiated at Interfaces 1, 2, and 3 at 13 ms, 16 ms, and 19 ms, respectively, with development rates exceeding those of normal displacements. Oscillatory and reverse motions were observed to occur in Interfaces 1 and 3 before 100 ms, whereas Interface 2 exhibited continuous growth throughout this period. After unloading, the relative displacements gradually attenuate, but residual values are retained.
This analysis demonstrates that composite precast assembled utility tunnels exhibit notable nonlinear dynamic characteristics under blast loading. Interface failures are predominantly observed during both the initial loading phase and the structural rebound stage. These findings provide critical insights into optimizing interface reinforcement strategies, which should be prioritized in structural design to enhance overall performance.
3.4. Damage Evolution of the Composite Precast Assembled Utility Tunnel
In this section, the effective plastic strain is utilized as an evaluation index to investigate the damage evolution of the composite precast assembled utility tunnel subjected to gas explosion load. The effective plastic strain is proposed as a reliable indicator for reflecting crack development in concrete, effectively capturing the progressive failure mechanisms. The corresponding calculation formula is provided as follows:
where
represents the effective plastic strain;
is the true strain;
is the true stress;
E denotes the elastic modulus. In K&C concrete constitutive model, the effective plastic strain was defined as follows [
26]:
where
is the material damage factor;
denotes the critical damage factor indicating the transition from hardening to softening phase. Based on the research findings of Wang et al. [
39], the primary damage zones in concrete can be effectively characterized when
.
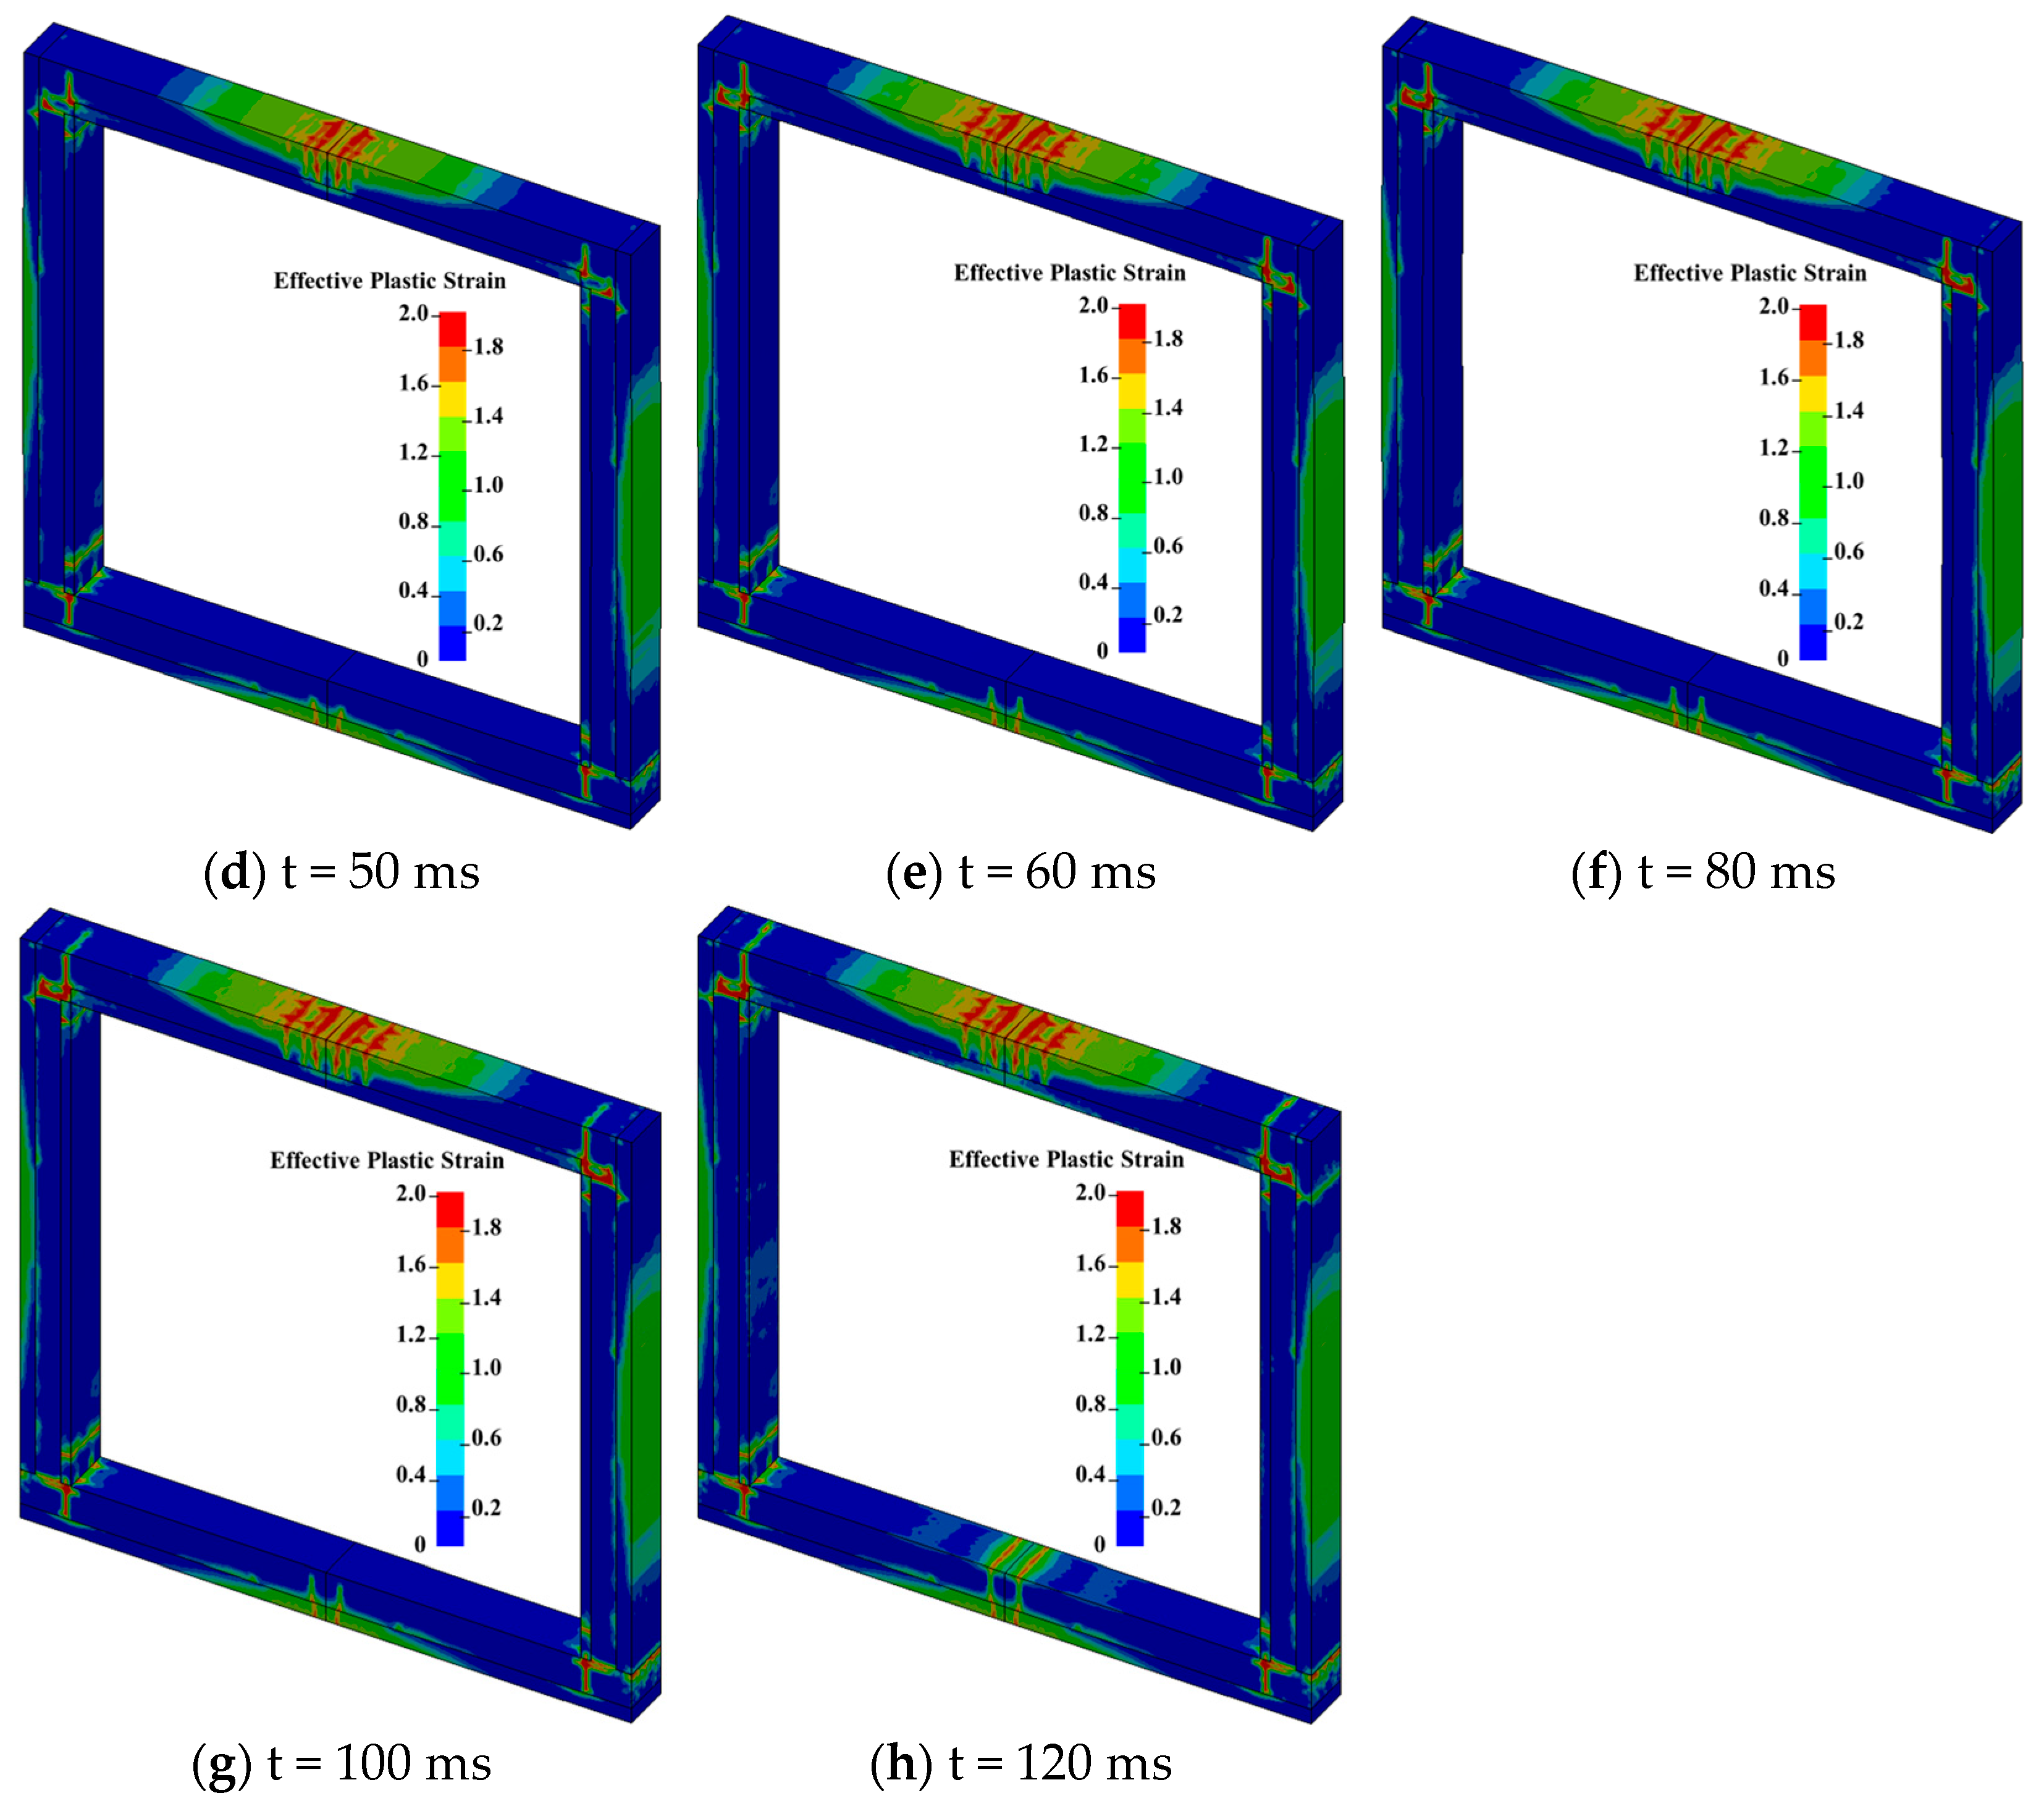
The damage evolution process of the composite precast assembled utility tunnel under blast load at different time stages is presented in
Figure 16. Initial damage was observed at the tunnel joints at 20 ms, characterized by horizontal cracks propagating from the inner sidewall ends toward the outer sidewalls, accompanied by minor vertical cracks. By 30 ms, mutually perpendicular horizontal and vertical cracks emerged at the lower joint, while damage initiation was inferred at the inner sidewall ends of the upper joint, indicating potential strain concentration at the interface between precast walls and cast-in-place regions. At 40 ms, cracks began to appear along the tunnel length direction, approximately 150 mm from the inner sidewall ends, with the damage range continuing to expand at the composite interfaces. By 50 ms, tensile cracks had formed in the mid-span region, and vertically penetrating cracks developed outward from the upper joint. By 120 ms, crack density significantly increased along the tunnel’s longitude direction in mid-span regions, along with further development of penetrating cracks at joint locations.
In conclusion, the damage evolution of composite precast assembled utility tunnels under blast load is characterized by a “joint-initiated cracking-interface damage-mid-span fracture” pattern, which appears to be primarily attributed to stress concentration effects at joints and the stress transfer mechanisms at the interfaces. These findings may offer valuable insights for guiding blast-resistant design strategies for composite precast assembled utility tunnel structures, emphasizing that interfacial integrity should be prioritized in future engineering practices.
4. Parametric Analysis
4.1. Peak Pressure of Blast Load
To investigate the failure characteristics and evolution patterns of composite precast assembled utility tunnels under blast load, numerical simulations were conducted with blast loads incrementally increased within the range of 500–1500 kPa, based on the research by Yan [
40], with a load increment of 200 kPa.
The deflection–time history in
Figure 17 indicates that the dynamic response process of key tunnel components (roof slab, base slab, and sidewalls) can be categorized into three characteristic phases: the shock response phase, stabilized vibration phase, and free vibration phase. During the shock response phase, rapid deformation occurred in components due to instantaneous blast load, with displacements exhibiting significant nonlinear growth until reaching their maximum values. Higher peak pressures are observed to correlate with increased displacement growth rates.
In the stabilized vibration phase, quasi-steady-state vibrational characteristics emerged near maximum displacements. This phenomenon can be attributed to dynamic equilibrium between structural inertial forces and external loads, modulated by material damping effects. Upon transitioning the free vibration phase, the structure exhibits reciprocal oscillations driven by elastic restoring forces. These oscillations gradually attenuate as displacement amplitudes diminish, eventually stabilizing at residual deformation states.
The analysis identified the roof slab as having the largest residual deformation, primarily due to its relatively weaker boundary constraints compared to other components. In contrast, the base slab and sidewalls exhibited smaller residual deformations, attributed to their superior stiffness. Notably, under high-intensity load (≥700 kPa), pronounced nonlinearity was observed in the roof slab’s displacement response. When the yield strength of the rebars in the joint regions was reached, structural stiffness deteriorated abruptly, likely preventing the displacement curves from stabilizing. This behavior indicates the initiation of plastic damage and significant degradation in the structure’s blast resistance.
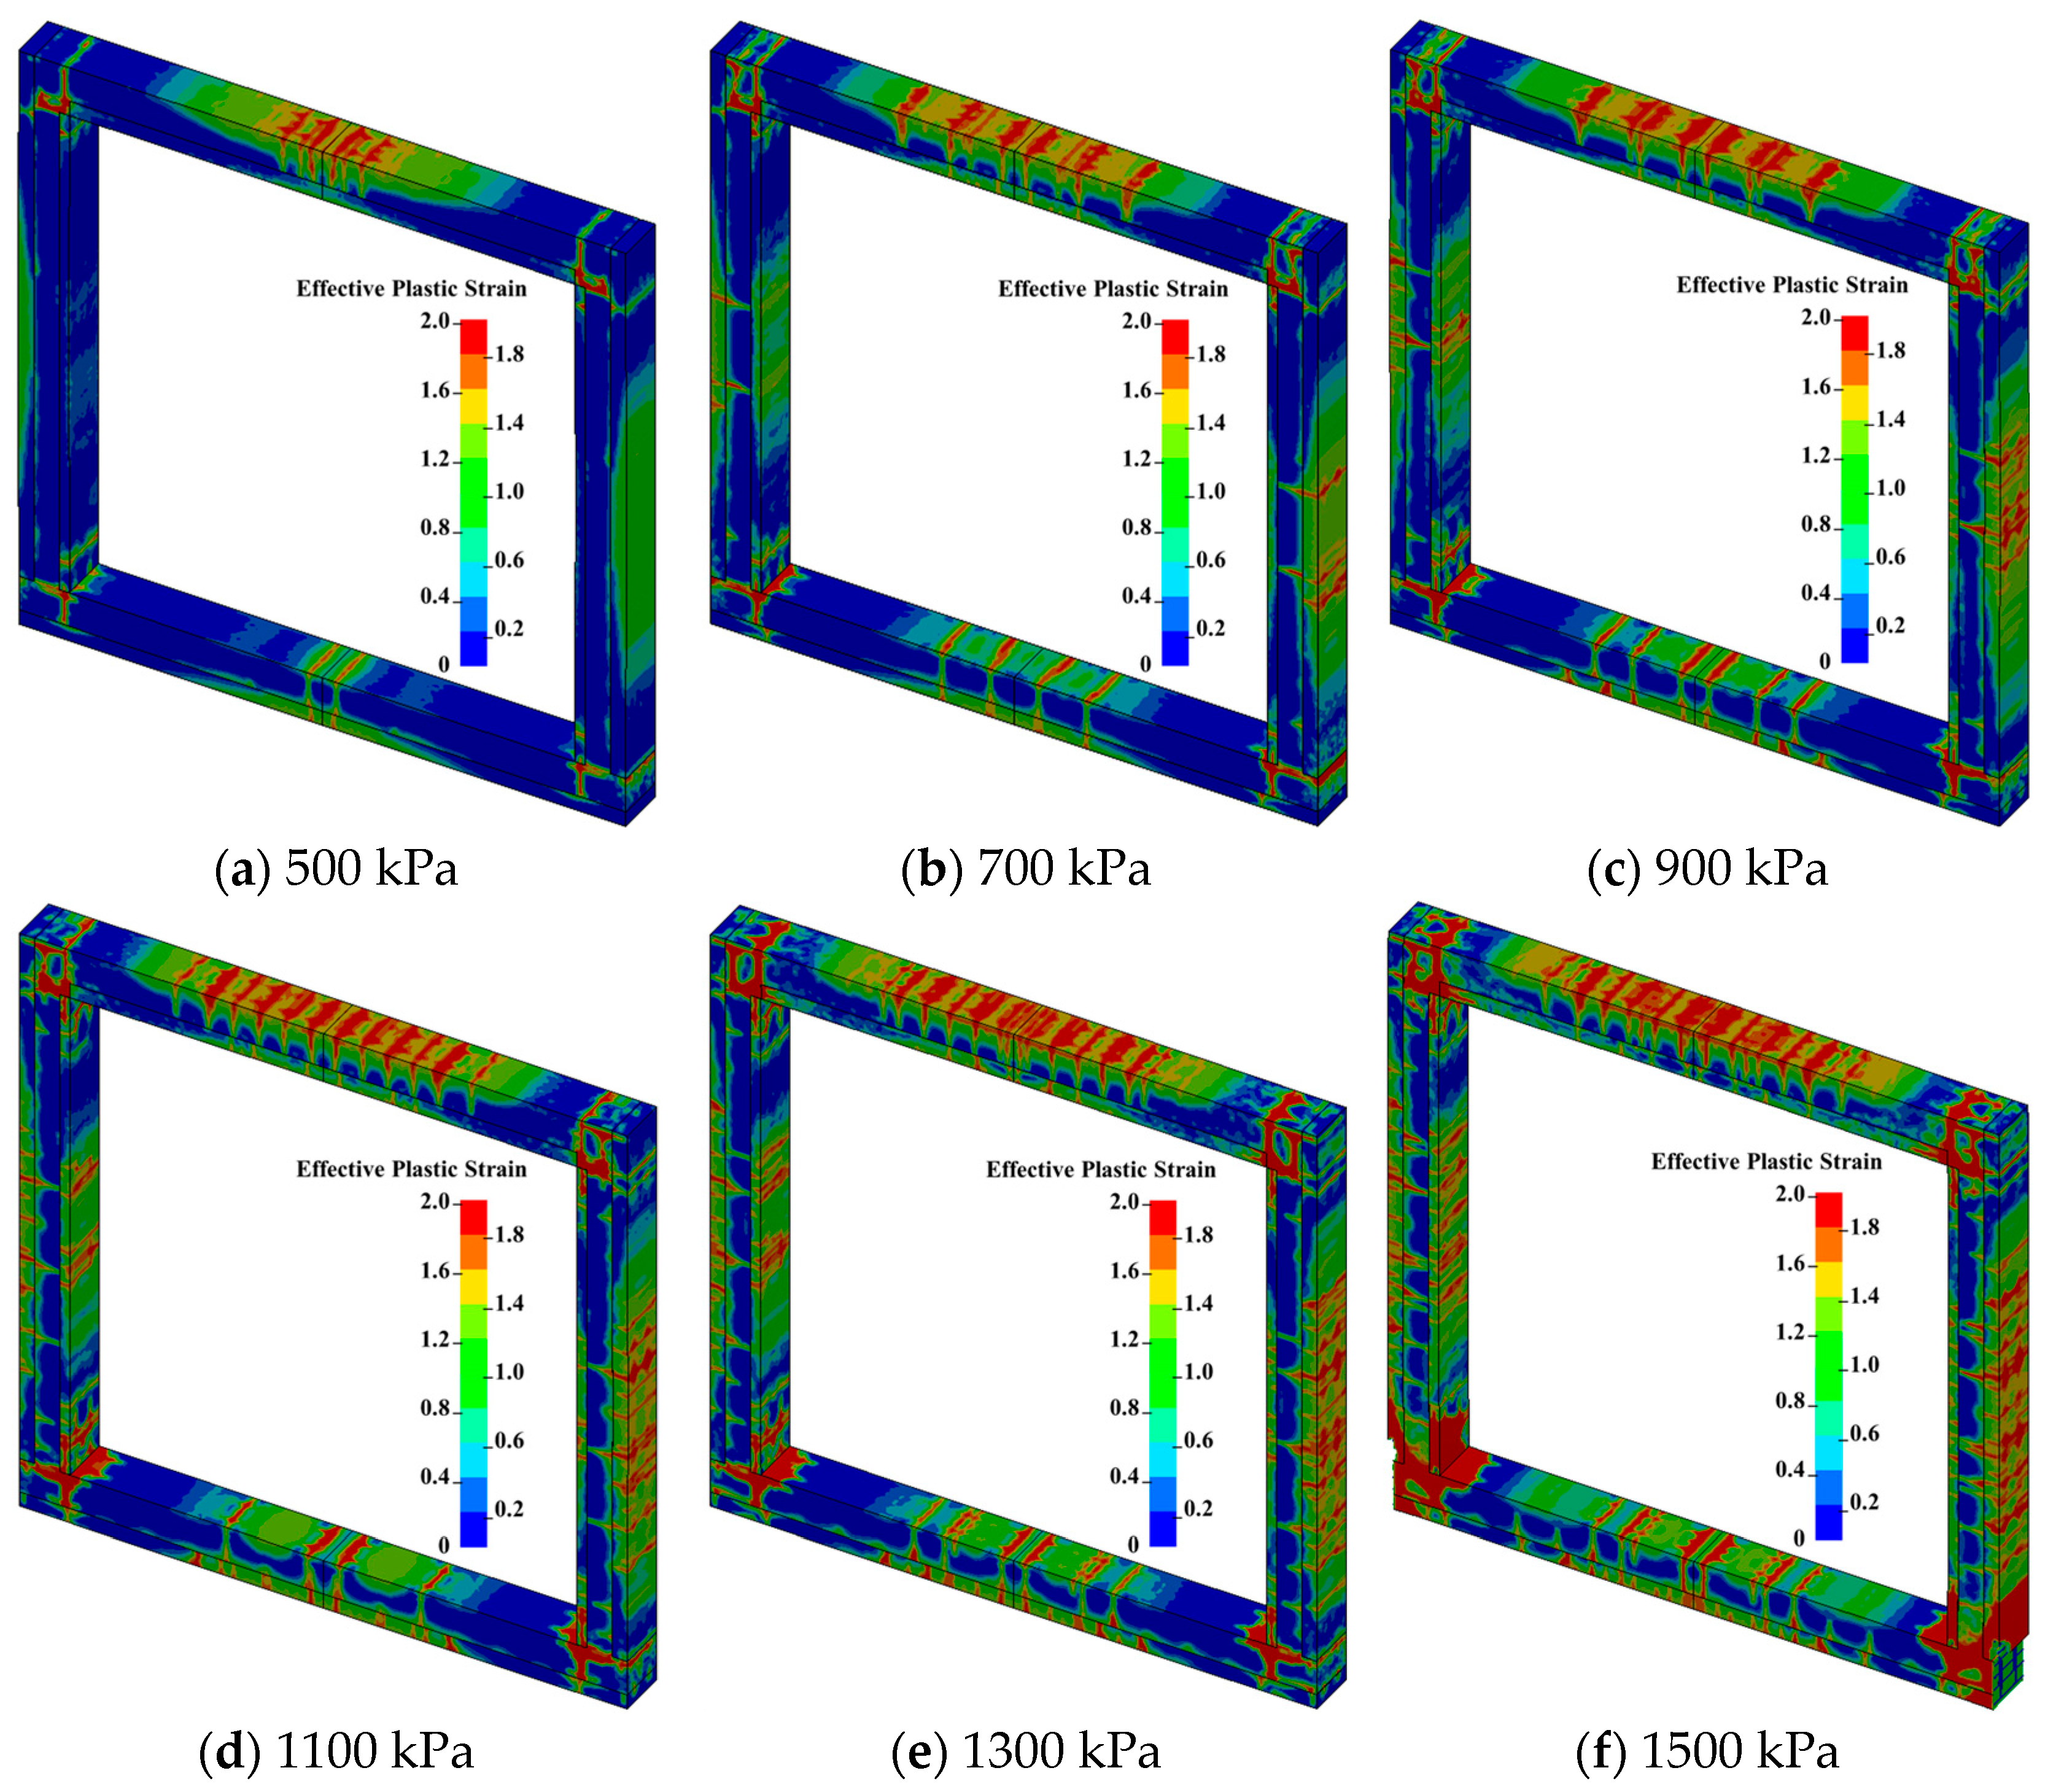
As illustrated in
Figure 18, the results indicate that the tunnel exhibits significant progressive failure characteristics. Under the load of 500 kPa, bending cracks were observed to appear on the exterior of the tunnel roof, extending inward and potentially causing discontinuities at the interface. A similar stress distribution was observed in the sidewall slabs, with stress transmission discontinuities occurring at the interface. Additionally, orthogonal cracks were identified in the joint region, further highlighting the stress concentration and progressive damage in the structure.
As the load increased to 700 kPa, the number and width of tensile and compressive cracks on the roof and sidewall slabs were observed to increased. Several newly formed cracks originated at the interface and propagated inward, with damage becoming more pronounced at both ends of the inner sidewall. Upon reaching a load of 900 kPa, vertical cracks developed in the cast-in-place region connecting the upper joint to the outer sidewall, while pre-existing cracks extended further. At a load of 1500 kPa, through-thickness damage emerged along a 45° direction at the lower joint, accompanied by severe damage at the bottom of the inner sidewall. However, the damage in the connected cast-in-place region remained relatively minor, indicating a significant stress discontinuity.
Two key characteristics are revealed by these failure modes of the composite precast assembled utility tunnel under explosive load. First, the joint connection region is identified as a weak zone. Second, the interface appears to influence the internal force transmission path, resulting in discontinuous failure, which could reduce the overall blast resistance of the structure.
4.2. Composite Interface Strength
A critical feature of composite precast assembled utility tunnels is the presence of the new-to-old concrete interface, the mechanical properties of which can directly influence the structure’s overall blast resistance. The strength of these interfaces primarily consists of three components: chemical bonding, mechanical interlock, and rebar bridging effects [
41,
42]. Specifically, chemical bonding arises from the mutual penetration of cement hydration products at the interfaces, while mechanical interlock depends on the geometric characteristics of the interface, and rebar bridging provides reliable shear resistance.
The interface strength is influenced by several factors: (1) concrete strength, where higher strength is generally associated with improved interface performance; (2) interface roughness, as appropriate levels of roughness can significantly enhance the mechanical interlocking effect; (3) the application of interface adhesive layers, which have been shown to improve the bonding performance of the interface [
43]; and (4) strain rate effects, whereby the interface strength increases under high strain rates [
44,
45].
To systematically investigate the potential impact of interface strength on structural blast resistance, a layered parametric approach was employed to simulate interface behavior. Specifically, three interface strength levels were used to represent plausible scenarios, as follows:
(1) Low-strength interface: It is assumed that the interface is connected exclusively through truss rebars, with the interfacial bond effect neglected.
(2) Medium-strength interface: This assumes the implementation of common interface treatments typically used in practical engineering. A shear-slip constitutive model was adopted to approximate the interface behavior.
(3) High-strength interface: A merge-node method is employed, assuming complete continuity at the interface. This approach is proposed to serve as an upper limit of the idealized connection of the interface.
According to the research conducted by Santos et al. [
46], the tensile strength and shear strength of concrete interfaces have been demonstrated to exhibit the following relationship:
This section systematically examines the blast resistance of composite precast assembled utility tunnels under different interface strengths. The upper strength was selected based on the research on interface strength at high strain rates [
44]. The
NFLS and
SFLS values are specified in
Table 3.
As illustrated in
Figure 19, the dynamic responses of the composite precast assembled utility tunnel under a 1.5 MPa load can be categorized into three distinct stages based on varying interface strengths. Firstly, the loading stage (0–50 ms): During this phase, the displacements of the base slab and side slab were observed to increase linearly with the load. Secondly, the peak response stage (50–100 ms): Stabilization of the side slab displacements was noted, whereas the roof displacement continued to increase, albeit at a reduced rate. Displacement differences among the various interface strengths became increasingly pronounced during this stage. Under the fully bonded condition, the maximum displacement reached 24.5 mm, while the non-bonded interface exhibited a slightly higher maximum displacement of 26.7 mm. All conditions attained their peak displacements at approximately 93 ms. Thirdly, structural displacements decreased rapidly, accompanied by oscillations. Lower interface strength demonstrated greater displacement attenuation, prolonged oscillation durations, and increased residual displacements. These observations suggest that interface strength could influence the overall structural stiffness.
The analysis revealed that the interface strength between new and old concrete does not significantly influence the displacement response of the composite precast assembled utility tunnel. However, interface integrity was found to play a more critical role in determining the overall structural performance of tunnels. To further explore this, three critical interfaces interacting with the surrounding soil (as defined in
Section 3.3) were selected for an investigation of their maximum normal and tangential relative displacements under blast load. As shown in
Table 4 and
Table 5, the results suggest that enhanced interface strength effectively suppresses interface delamination. When interface normal strength reaches 5 MPa, the relative displacement tends to stabilize. Further strength increases beyond this threshold yield diminishing returns in displacement control.
The energy absorption capacity of the tunnel under different interface strengths can be evaluated based on internal energy as a key indicator. The results, summarized in
Table 6, reveal that as the interface strength increases, the internal energy of the tunnel shows a significant upward trend. This finding clearly demonstrates that insufficient interface strength substantially reduces the overall energy absorption capacity, thereby weakening its blast resistance.
4.3. Concrete Strength
To investigate the influence of concrete strength on the blast resistance of composite precast assembled utility tunnels, a parametric analysis was conducted by varying the cast-in-place concrete strength while keeping the prefabricated concrete strength and other parameters constant. In accordance with engineering practices and relevant code requirements, five concrete strengths (C30, C35, C40, C45, and C50) were selected for comparative analysis. To ensure a comprehensive evaluation encompassing different failure modes, three blast loads (0.5 MPa, 0.9 MPa, and 1.5 MPa) were applied.
The results are presented in
Figure 20. Under low load levels (0.5 MPa), the maximum displacement of the roof slab exhibited a decreasing trend as the concrete strength grade increased. Specifically, when the concrete was increased from C30 to C50, the maximum displacement decreased from 18.5 mm to 18.0 mm, corresponding to an approximate reduction rate of 2.7%. These findings suggest that the influence of concrete strength on structural deformation appears to be relatively limited during the elastic stage.
Under medium (0.9 MPa) and high load levels (1.5 MPa), the displacement–time history curves for concrete with varying strengths exhibited a high degree of similarity. For the 1.5 MPa load condition, the maximum displacements of C30 to C50 concrete were measured as 24.8 mm, 24.6 mm, 24.5 mm, 24.3 mm, and 24.2 mm, respectively, and a maximum variation of only 2.4% was observed. These results suggest that, under high blast loads, increasing the concrete strength has limited influence on mitigating blast-induced deformation.
Notably, the limited marginal benefit of high-strength concrete under blast loads can be attributed to two key factors: (1) High-strength concrete primarily enhances structural performance in over-reinforced scenarios (where concrete crushing dominates), which was not observed in this study, and (2) strain rate effects reduce the tensile dynamic increase factor (TDIF) for higher-strength concrete. For instance, while increasing concrete strength from C30 to C40 improves its static tensile strength (2.01 MPa to 2.20 MPa), the tensile dynamic increase factor (TDIF) decreases from 8.05 to 7.04 under blast loading. This results in a net dynamic tensile strength reduction of 7% (16.2 MPa to 15.5 MPa).
Figure 21 demonstrates the effect of varying concrete strengths on the energy absorption capacity of tunnels under three different loads. The results indicate that the energy absorption of C30 and C35 concrete is relatively similar, showing minimal differences. However, when the concrete strength increases to C40, a notable improvement in energy absorption is observed. This enhancement becomes increasingly pronounced as the peak pressure rises, suggesting that higher concrete strength (above C40) contributes more significantly to energy absorption under higher blast load.
High-performance concretes, such as ultra-high-performance concrete (UHPC) reinforced with steel fibers, demonstrate significant potential for enhancing blast resistance due to their superior tensile capacity and improved interface bonding. These properties can effectively mitigate the failure modes observed in this study, such as excessive deformation and delamination, as supported by prior research [
47,
48]. However, the practical adoption of UHPC for blast-resistant applications faces challenges, including high costs as well as limitations in existing design codes. Overcoming these barriers will require advancements in cost-effective manufacturing techniques, the development of standardized guidelines, and further research to validate its performance under extreme loading conditions.
4.4. Reinforcement Configuration
4.4.1. Reinforcement Ratio
The reinforcement configuration was identified as a critical factor influencing the blast resistance of the composite precast assembled utility tunnel. As discussed in previous chapters, the side slabs and joints of the tunnel were recognized as critical stress-bearing components. Preliminary analysis indicated that under a 1.5 MPa blast load, the side slabs and base slabs exhibit minimal displacement, which can be attributed to the apparent soil confinement effects. Accordingly, this section concentrates on examining the impact of reinforcement ratios on the blast resistance of the roof slab. In accordance with code specifications and engineering practices, reinforcement ratios of 0.44%, 0.56%, 0.69%, and 0.84% were selected for parametric analysis. Three load levels (0.5 MPa, 0.9 MPa, and 1.5 MPa) were applied, with the D/H ratio—defined as the ratio of maximum displacement to section height—adopted as the primary evaluation metric.
As shown in
Figure 22, under blast load levels of 0.5 MPa and 0.9 MPa, a significant reduction in the D/H ratio—by 10.5% and 9.3%, respectively—was observed when the reinforcement ratio was increased from 0.44% to 0.56%. However, further increases in the reinforcement ratio resulted in diminishing suppression effects on displacement. This trend can likely be attributed to the structure operating predominantly within its elastic working state. At a higher load level of 1.5 MPa, the D/H ratio exhibited a more consistent linear decreasing trend with increasing reinforcement ratios. Specifically, the D/H ratio decreased by approximately 0.04 for every 0.1% increment in the reinforcement ratio.
4.4.2. Steel Reinforcement Strength
To assess the influence of rebar’s strength on the blast resistance of tunnels, four strength grades (HRB235, HRB335, HRB400, and HRB500) were selected for comparative analysis. The results, as illustrated in
Figure 23, indicate that under the 0.5 MPa load condition, the influence of increased reinforcement strength on structural displacement was negligible. This can be attributed to the fact that the steel stress generally remained below its yield strength at this stage. When the load increased to 0.9 MPa, the D/H ratio decreased by 11% as the reinforcement strength was upgraded from HRB235 to HRB335. However, further increases in reinforcement strength provided only marginal improvements in displacement, indicating limited practical benefits from higher-grade reinforcement under this load condition. At the 1.5 MPa load level, the D/H ratio exhibited a nonlinear decreasing trend with increasing reinforcement strength, highlighting a more complex relationship between reinforcement grade and displacement performance under higher blast loads.
5. Conclusions
This study systematically investigates the blast resistance of composite precast assembled utility tunnels through validated numerical simulations, leading to three principal findings:
- (1)
Progressive failure mechanism
The tunnel exhibits a characteristic three-stage failure sequence: (I) initial joint cracking, induced by stress concentration at geometric discontinuities; (II) interface delamination, resulting from bond-slip between the precast and cast-in-place layers; (III) the formation of midspan penetration cracks, driven by the dominance of bending moments. This failure progression underscores the critical vulnerability of joints and interfaces, emphasizing the need for targeted structural reinforcement in these areas.
- (2)
Parametric analysis
Load intensity: As blast load increases (500–1500 kPa), the failure mode of composite precast assembled utility tunnel is observed to transition from local bending to global plastic damage. When the load exceeds 700 kPa, yielding of the rebars is observed in the joint regions, accompanied by a pronounced reduction in structural stiffness and a significant increase in residual displacement. These findings indicate that joints may serve as critical zones for the degradation of blast resistance.
Interface performance: Enhancing the normal interface strength to 5 MPa results in a 99.8% reduction in Interface 3 displacement (from 4.12 mm to 0.009 mm). Conversely, complete interface decoupling leads to a 9.0% increase in midspan deflection by disrupting the composite action. With interface strength increases, the energy absorption capacity of the tunnel shows a significant upward trend.
Material properties: Variations in concrete strength (C30–C50) result in less than a 2.5% difference in displacement under loads exceeding 0.9 MPa, primarily due to the non-over-reinforced scenarios and the influence of TDIF. However, increasing concrete strength can enhance the energy absorption, particularly under high-level loads. Increasing the reinforcement ratio from 0.44% to 0.56% reduces the D/H ratio by 10.5%. Additionally, the displacement suppression effect of steel reinforcement strength grades (HRB235–HRB500) becomes significant under high load conditions (1.5 MPa), with the D/H ratio exhibiting a linear decreasing trend as the reinforcement strength increases.
- (3)
Design implications
The revealed failure mechanism highlights the importance of enhancing joint reinforcement and implementing interface treatments (e.g., surface roughening to NFLS ≥ 5 MPa by using mechanical grooving with adhesive layers, for example). For roof slabs, a minimum reinforcement ratio of 0.56% is recommended to reduce midspan displacement by 10.5%, while C40 concrete optimizes energy absorption under high loads. Applying a reduction factor of 0.92 to resistance for composite precast assembled tunnels aligns calculations with cast-in-place tunnels.
This research fills the knowledge gap in the blast response of composite precast assembled tunnels, offering two main innovations: (a) the identification of the progressive failure pattern in composite precast assembled tunnels; (b) quantitative characterization of the interface effects on blast resistance. The findings advance the safety design of prefabricated underground infrastructure in explosion-prone environments.
This study simplifies the numerical modeling by using a basic soil–structure interaction model, excluding thermal effects, and omitting post-blast damage mechanisms. Future research should address these limitations for a more comprehensive analysis. Environmental effects, such as moisture ingress and repeated loading, which can significantly impact interface durability and increase delamination risks, are also excluded and require further investigation.
Author Contributions
Conceptualization, B.T.; methodology, B.T.; software, Y.L.; validation, Y.L.; formal analysis, B.T. and Y.L.; investigation: B.T. and Y.L.; resources, B.T.; data curation, Y.L.; writing—original draft preparation, Y.L.; writing—review and editing, B.T. and Y.L.; visualization: Y.L.; supervision, B.T.; project administration, B.T.; funding acquisition, B.T. All authors have read and agreed to the published version of the manuscript.
Funding
This research was funded by the Postgraduate Research & Practice Innovation Program of Jiangsu Province (NO. KYCX23_3331) and the National Natural Science Foundation of China (No. 52478538).
Data Availability Statement
The data are available from the first author on reasonable request.
Acknowledgments
We also would like to thank the anonymous reviewers for their valuable comments and suggestions, which led to a substantially improved manuscript.
Conflicts of Interest
The authors declare no conflicts of interest.
References
- Li, Z.; Wu, J.; Liu, M.; Li, Y.; Ma, Q. Numerical analysis of the characteristics of gas explosion process in natural gas compartment of utility tunnel using FLACS. Sustainability 2019, 12, 153. [Google Scholar] [CrossRef]
- Ge, F.; Xu, X. Research report on the Utility Tunnel Engineering based on BIM technology. J. Phys. Conf. Ser. 2019, 1176, 042028. [Google Scholar] [CrossRef]
- Bai, G. Analysis of prefabricated building system on construction quality and efficiency. J. Civ. Eng. Urban Plan. 2023, 5, 35–43. [Google Scholar]
- Zhang, J.; Zhang, Y.; Peng, C.; Lei, Y.; Zhang, A.; Zuo, Z.; Chen, Z. Experimental and Numerical Investigation into Full-Scale Model of New Type Assembled Integral Utility Tunnel. Buildings 2023, 13, 1428. [Google Scholar] [CrossRef]
- Xu, Y.; Huang, Y.; Ma, G. A review on effects of different factors on gas explosions in underground structures. Undergr. Space 2020, 5, 298–314. [Google Scholar] [CrossRef]
- Wu, J.; Cai, J.; Zhao, Y.; Cao, Y.; Zhou, R.; Pang, L. Experimental study of the propagation characteristics of gas explosions in urban utility tunnels. J. Tsinghua Univ. (Sci. Technol.) 2022, 62, 987–993. [Google Scholar] [CrossRef]
- Mokhtar, K.M.; Kasmani, R.M.; Hassan, C.R.C.; Hamid, M.D.; Emami, S.D.; Nor, M.I.M. Reliability and applicability of empirical equations in predicting the reduced explosion pressure of vented gas explosions. J. Loss Prev. Process Ind. 2020, 63, 104023. [Google Scholar] [CrossRef]
- Li, J. Influence of Slope and Obstacle on Gas Leakage and Explosion of Utility Tunnel; Beijing University of Civil Engineering and Architecture: Beijing, China, 2021. [Google Scholar]
- Zhang, Q.; Ma, Q. Dynamic pressure induced by a methane–air explosion in a coal mine. Process Saf. Environ. Prot. 2015, 93, 233–239. [Google Scholar] [CrossRef]
- Gregoire, Y.; Daubech, J.; Proust, C.; Leprette, E. Vented gas explosion overpressure calculation based on a multi-layered neural network. J. Loss Prev. Process Ind. 2022, 74, 104641. [Google Scholar] [CrossRef]
- Zhang, Z.-j.; Liu, Z.-x.; Zhang, H.; Meng, S.-b.; Shi, J.-h.; Zhao, J.-w.; Wu, C.-q. Spatial distribution and machine learning-based prediction model of natural gas explosion loads in a utility tunnel. Tunn. Undergr. Space Technol. 2023, 140, 105272. [Google Scholar] [CrossRef]
- Jia, J.; Wang, W. Propagation of gas explosions in roadways with different cross-sectional shapes. Energy Sources Part A Recovery Util. Environ. Eff. 2021, 43, 495–505. [Google Scholar]
- Meng, Q.; Wu, C.; Li, J.; Liu, Z.; Wu, P.; Yang, Y.; Wang, Z. Steel/basalt rebar reinforced Ultra-High Performance Concrete components against methane-air explosion loads. Compos. Part B Eng. 2020, 198, 108215. [Google Scholar] [CrossRef]
- Xue, Y.; Chen, G.; Zhang, Q.; Xie, M.; Ma, J. Simulation of the dynamic response of an urban utility tunnel under a natural gas explosion. Tunn. Undergr. Space Technol. 2021, 108, 103713. [Google Scholar] [CrossRef]
- Shearer, M.J.; Tam, V.H.; Corr, B. Analysis of results from large scale hydrocarbon gas explosions. J. Loss Prev. Process Ind. 2000, 13, 167–173. [Google Scholar] [CrossRef]
- Wang, S.; Li, Z.; Fang, Q.; Yan, H.; Chen, L. Performance of utility tunnels under gas explosion loads. Tunn. Undergr. Space Technol. 2021, 109, 103762. [Google Scholar] [CrossRef]
- Huang, Z.; Qin, M.; Ma, S.; Qiu, C.; Zhou, Y. Mechanical response and blast resistance evaluation of prefabricated frame tunnels with steel box joints under internal explosion. Eng. Sci. Technol. Int. J. 2024, 55, 101752. [Google Scholar] [CrossRef]
- Guo, F. Performance Study on Members of Precast Monolithic Concrete Municipal Tunnel; Hunan University: Changsha, China, 2018. [Google Scholar]
- Tian, Z. Experimental Research on Force Performance of Precast Concrete Underground Comprehensive Municipal Tunnel; Harbin Institute of Technology: Harbin, China, 2016. [Google Scholar]
- Yan, L. Static Test and Finite Element Analysis of Full-Scale Model of Utility Tunnel Structure Without Axillary Angle; Hunan University: Changsha, China, 2018. [Google Scholar]
- Li, Z.; Yu, S.; Wei, Q.; He, J. Seismic performance of utility tunnel wall-slab joints with anchorage button-head reinforcement. J. Civ. Environ. Eng. 2021, 43, 157–166. [Google Scholar]
- Zheng, J.; Li, H.; Hogan, J.D. Advanced tensile fracture analysis of alumina ceramics: Integrating hybrid finite-discrete element modeling with experimental insights. Eng. Fract. Mech. 2024, 302, 110075. [Google Scholar] [CrossRef]
- Zheng, J.; Li, H.; Hogan, J.D. Hybrid finite-discrete element modeling of the mode i tensile response of an alumina ceramic. Modelling 2023, 4, 87–101. [Google Scholar] [CrossRef]
- Tian, S.; Yan, Q.; Du, X.; Chen, F.; Zhang, B. Experimental and numerical studies on the dynamic response of precast concrete slabs under blast load. J. Build. Eng. 2023, 70, 106425. [Google Scholar] [CrossRef]
- Pan, Y.; Zong, Z.; Li, J.; Qian, H.; Wu, C. Investigating the dynamic response of a double-box utility tunnel buried in calcareous sand against ground surface explosion. Tunn. Undergr. Space Technol. 2024, 146, 105636. [Google Scholar] [CrossRef]
- Yin, H.; Shirai, K.; Teo, W. Numerical model for predicting the structural response of composite UHPC–concrete members considering the bond strength at the interface. Compos. Struct. 2019, 215, 185–197. [Google Scholar] [CrossRef]
- Zhou, F.; Su, Q.; Cheng, Y.; Wu, H. A novel dynamic constitutive model for UHPC under projectile impact. Eng. Struct. 2023, 280, 115711. [Google Scholar] [CrossRef]
- Liu, Y.; Hao, H.; Hao, Y. Prediction of blast response of RC columns considering dynamic bond-slip between reinforcement and concrete. Eng. Struct. 2023, 283, 115921. [Google Scholar] [CrossRef]
- Xu, S.; Chen, B.; Li, Q.; Zhou, F.; Yin, X.; Jiang, X.; Wu, P. Experimental and numerical investigations on ultra-high toughness cementitious composite slabs subjected to close-in blast loadings. Cem. Concr. Compos. 2022, 126, 104339. [Google Scholar] [CrossRef]
- Wang, W.; Zhang, D.; Lu, F.; Wang, S.-c.; Tang, F. Experimental study and numerical simulation of the damage mode of a square reinforced concrete slab under close-in explosion. Eng. Fail. Anal. 2013, 27, 41–51. [Google Scholar] [CrossRef]
- Li, G.; Tan, K.H.; Fung, T.C.; Yu, Q.J.; May, M. A coupled dynamic cohesive zone model for FRP-concrete mixed-mode separation. Compos. Struct. 2021, 268, 113872. [Google Scholar] [CrossRef]
- Peng, L.; Gong, X.; Wong, K.; Guillaumat, L. Application of cohesive-zone models to delamination behaviour of composite material. World J. Eng. 2012, 9, 109–118. [Google Scholar] [CrossRef]
- Park, G.-K.; Lee, M.; Lee, N.; Park, G.-J.; Kim, S.-W. Dynamic structural responses of high-performance fiber-reinforced cement composites panels subjected to high-velocity projectile impact loadings. Compos. Struct. 2023, 306, 116581. [Google Scholar] [CrossRef]
- Havens, S. Unified Facilities Criteria (UFC); WBDG: Washington, DC, USA, 2016. [Google Scholar]
- GB 50838-2015; Technical Code for Urban Utility Tunnel Engineering. Ministry of Housing and Urabn-Rural Development of the People’s Republic of China: Beijing, China, 2015.
- Mandal, J.; Agarwal, A.; Goel, M. Numerical simulation of soil-tunnel interaction under surface blast loading. In Seismic Design and Performance: Select Proceedings of 7th ICRAGEE 2020; Springer: Berlin/Heidelberg, Germany, 2021. [Google Scholar]
- Lin, G.; Huang, T.; Jin, X. Efficient Waveguide Port Excitation for Symmetric Structures based on Conformal Non-uniform Mesh. In Proceedings of the 2023 24th International Vacuum Electronics Conference (IVEC), Chengdu, China, 25–28 April 2023; IEEE: Piscataway, NJ, USA, 2023. [Google Scholar]
- Mandal, A.; Maity, D. Study of local non-reflective boundary condition on soil domain. Procedia Eng. 2016, 144, 1252–1259. [Google Scholar] [CrossRef]
- Wang, W.; Song, X.; Yang, J.; Liu, F.; Gao, W. Experimental and numerical research on the effect of ogive-nose projectile penetrating UR50 ultra-early-strength concrete. Cem. Concr. Compos. 2023, 136, 104902. [Google Scholar] [CrossRef]
- Yan, Q.; Zhang, Y.; Sun, Q. Characteristic study on gas blast loadings in an urban utility tunnel. J. Perform. Constr. Facil. 2020, 34, 04020076. [Google Scholar] [CrossRef]
- Qin, R.; Hao, H.; Rousakis, T.; Lau, D. Effect of shrinkage reducing admixture on new-to-old concrete interface. Compos. Part B Eng. 2019, 167, 346–355. [Google Scholar] [CrossRef]
- Santos, P.M.; Júlio, E.N. A state-of-the-art review on shear-friction. Eng. Struct. 2012, 45, 435–448. [Google Scholar] [CrossRef]
- Rashid, K.; Ahmad, M.; Ueda, T.; Deng, J.; Aslam, K.; Nazir, I.; Sarwar, M.A. Experimental investigation of the bond strength between new to old concrete using different adhesive layers. Constr. Build. Mater. 2020, 249, 118798. [Google Scholar] [CrossRef]
- Hu, B.; Meng, T.-F.; Li, Y.; Li, D.-Z.; Chen, L. Dynamic splitting tensile bond behavior of new-to-old concrete interfaces. Constr. Build. Mater. 2021, 281, 122570. [Google Scholar] [CrossRef]
- Hu, B.; Li, Y.; Liu, Y. Dynamic slant shear bond behavior between new and old concrete. Constr. Build. Mater. 2020, 238, 117779. [Google Scholar] [CrossRef]
- Santos, P.M.; Júlio, E.N. Interface shear transfer on composite concrete members. ACI Struct. J. 2014, 111, 113. [Google Scholar]
- Xia, Z.; Li, H.; Xie, J.; Zong, Z.; Zhang, Z. Numerical study on dynamic response of a novel ribbed thin-walled UHPC box-type utility tunnel under gas explosion. Case Stud. Constr. Mater. 2024, 21, e03630. [Google Scholar] [CrossRef]
- Yang, Y.; Wu, C.; Liu, Z.; Du, J.; Zhang, H.; Xu, S.; Zhou, S. Protective effect of unbonded prestressed ultra-high performance reinforced concrete slab against gas explosion in buried utility tunnel. Process Saf. Environ. Prot. 2021, 149, 370–384. [Google Scholar] [CrossRef]
Figure 1.
Test setup [
24].
Figure 1.
Test setup [
24].
Figure 2.
Configuration of the specimen (Unit: mm).
Figure 2.
Configuration of the specimen (Unit: mm).
Figure 3.
Location of displacement sensors (Unit: mm).
Figure 3.
Location of displacement sensors (Unit: mm).
Figure 4.
Geometry of the slab.
Figure 4.
Geometry of the slab.
Figure 5.
Comparison of concrete damage between the test and numerical simulation. * The failure diagram of the experimental slab was adapted from Figure 10 in reference [
24].
Figure 5.
Comparison of concrete damage between the test and numerical simulation. * The failure diagram of the experimental slab was adapted from Figure 10 in reference [
24].
Figure 6.
Comparison of deflection-time history between test and numerical simulation.
Figure 6.
Comparison of deflection-time history between test and numerical simulation.
Figure 7.
Comparison between test and numerical simulation in utility tunnel blast resistance test. * The red points represent the corresponding positions of utility tunnel.
Figure 7.
Comparison between test and numerical simulation in utility tunnel blast resistance test. * The red points represent the corresponding positions of utility tunnel.
Figure 8.
Dimensions and construction of the composite precast assembled tunnel (Unit: mm). * Prefabricated components are represented by the shaded area, while the remaining sections are indicative of cast-in-place concrete areas.
Figure 8.
Dimensions and construction of the composite precast assembled tunnel (Unit: mm). * Prefabricated components are represented by the shaded area, while the remaining sections are indicative of cast-in-place concrete areas.
Figure 9.
Section diagram of composite precast assembled utility tunnel.
Figure 9.
Section diagram of composite precast assembled utility tunnel.
Figure 10.
Mesh sensitivity analysis.
Figure 10.
Mesh sensitivity analysis.
Figure 11.
Location of displacement in mid-span slab.
Figure 11.
Location of displacement in mid-span slab.
Figure 12.
Deflection–time history of mid-span slab.
Figure 12.
Deflection–time history of mid-span slab.
Figure 13.
Three key interfaces.
Figure 13.
Three key interfaces.
Figure 14.
Nodes at the interface.
Figure 14.
Nodes at the interface.
Figure 15.
Deflection–time history of relative displacement at the nodes on the interface: (a) relative displacement in normal direction; (b) relative displacement in tangential direction.
Figure 15.
Deflection–time history of relative displacement at the nodes on the interface: (a) relative displacement in normal direction; (b) relative displacement in tangential direction.
Figure 16.
Concrete damage of composite precast assembled tunnel at different moments.
Figure 16.
Concrete damage of composite precast assembled tunnel at different moments.
Figure 17.
Deflection–time history of mid-span slabs under different load.
Figure 17.
Deflection–time history of mid-span slabs under different load.
Figure 18.
Concrete damage of composite precast assembled tunnel under different pressure.
Figure 18.
Concrete damage of composite precast assembled tunnel under different pressure.
Figure 19.
Deflection–time history of mid-span under different interface strength.
Figure 19.
Deflection–time history of mid-span under different interface strength.
Figure 20.
Deflection–time history of roof slab under different concrete strengths.
Figure 20.
Deflection–time history of roof slab under different concrete strengths.
Figure 21.
Internal energy of tunnel under different peak pressure.
Figure 21.
Internal energy of tunnel under different peak pressure.
Figure 22.
Effect of reinforcement ratio on D/H under different loads.
Figure 22.
Effect of reinforcement ratio on D/H under different loads.
Figure 23.
Effect of reinforcement strength on D/H under different loads.
Figure 23.
Effect of reinforcement strength on D/H under different loads.
Table 1.
Key parameters involved in the K&C model.
Table 1.
Key parameters involved in the K&C model.
| Parameter | Value | Parameter | Value |
|---|
| fc (MPa) | 29.92 | a1 | 0.4463 |
| ρ0 (kg/m3) | 2400 | a2 (1/MPa) | 0.0028 |
| V | 0.19 | a1f | 0.4417 |
| ft (MPa) | 2.88 | a0y (MPa) | 6.4730 |
| wc (mm) | 64 | a1y | 0.6250 |
| b1 | 4.3 | a2f (1/MPa) | 0.0041 |
| b2 | −1.6 | a2y (1/MPa) | 0.0089 |
| a0 (MPa) | 8.5720 | | |
Table 2.
Reinforcement material parameters.
Table 2.
Reinforcement material parameters.
| Diameter/mm | ρ0 (kg/m3) | E/GPa | PR | SIGY/MPa | ETAN/GPa | C (1/s) | P | FS |
|---|
| 8 | 7850 | 200 | 0.3 | 448 | 2 | 40 | 5 | 0.14 |
| 14 | 7850 | 200 | 0.3 | 448 | 2 | 40 | 5 | 0.2 |
Table 3.
Parameters of interface strength.
Table 3.
Parameters of interface strength.
| Case | NFLS (MPa) | SFLS (MPa) |
|---|
| 1 | 0 | 0 |
| 2 | 2.5 | 13.5 |
| 3 | 5 | 27.0 |
| 4 | 7.5 | 40.4 |
| 5 | 10 | 53.9 |
| 6 | ∞ | ∞ |
Table 4.
Maximum relative displacement in normal direction (Unit: mm).
Table 4.
Maximum relative displacement in normal direction (Unit: mm).
| NFLS (MPa) | Maximum Relative Displacement in Normal Direction |
|---|
| Interface 1 | Interface 2 | Interface 3 |
|---|
| 2.5 | 0.035 | 0.040 | 4.120 |
| 5 | 0.016 | 0.013 | 0.009 |
| 7.5 | 0.003 | 0.010 | 0.009 |
| 10 | 0.002 | 0.008 | 0.004 |
Table 5.
Maximum relative displacement in tangential direction (Unit: mm).
Table 5.
Maximum relative displacement in tangential direction (Unit: mm).
| NFLS (MPa) | Maximum Relative Displacement in Tangential Direction |
|---|
| Interface 1 | Interface 2 | Interface 3 |
|---|
| 2.5 | 0.118 | 0.134 | 5.456 |
| 5 | 0.046 | 0.108 | 0.009 |
| 7.5 | 0.008 | 0.012 | 0.008 |
| 10 | 0.006 | 0.008 | 0.005 |
Table 6.
Internal energy of different interface strengths.
Table 6.
Internal energy of different interface strengths.
| NFLS (MPa) | 0 | 2.5 | 5 | 7.5 | 10 | ∞ |
| Internal energy (MJ) | 5.38 | 5.58 | 5.91 | 5.99 | 6.09 | 6.09 |
| Disclaimer/Publisher’s Note: The statements, opinions and data contained in all publications are solely those of the individual author(s) and contributor(s) and not of MDPI and/or the editor(s). MDPI and/or the editor(s) disclaim responsibility for any injury to people or property resulting from any ideas, methods, instructions or products referred to in the content. |
© 2025 by the authors. Licensee MDPI, Basel, Switzerland. This article is an open access article distributed under the terms and conditions of the Creative Commons Attribution (CC BY) license (https://creativecommons.org/licenses/by/4.0/).


