1. Introduction
Since the beginning of the Industrial Revolution, the resulting unprecedented industrial and economic development has largely relied on an energy system centered on fossil fuels, such as coal, oil, and natural gas. However, this development has been accompanied by significant emissions of carbon dioxide (CO
2) and other greenhouse gases (GHGs), identified as major contributors to the rise in global average temperatures and climate system instability [
1,
2].
According to the International Energy Agency, in 2023, approximately 80% of global CO
2 emissions still originated from fossil fuel combustion, with the transportation sector responsible for approximately 30% [
1]. Although the shipping industry plays a central role in international trade, it accounts for approximately 2.9% of total CO
2 emissions, and its contribution to climate change is steadily increasing [
3].
Consequently, the Intergovernmental Panel on Climate Change’s (IPCC) Sixth Assessment Report (AR6, 2021) clearly states that “human fossil fuel-based activities are the dominant cause of global warming”, emphasizing the urgent need for carbon neutrality (net zero) and strategies to phase out fossil fuels [
2]. This international trend underscores the urgent need to transition the energy structure within the transportation and maritime sectors.
Lithium-ion batteries are essential components of shipboard energy storage systems (ESS), particularly given regulations such as those from the Korean Register. Furthermore, they are considered a core technology for achieving the International Maritime Organization’s (IMO) GHG reduction targets.
Figure 1 presents the revised GHG reduction strategy adopted during the 80th session of the IMO’s Marine Environment Protection Committee. The IMO has established a strengthened strategy aiming to reduce GHG emissions by at least 20% by 2030 (compared to 2008 levels) and achieve net-zero carbon emissions by 2050 [
4,
5,
6,
7].
Improving energy efficiency and reducing atmospheric pollutants emitted from ships, such as NO
x, SO
x, and CO
2, are essential. Therefore, lithium-ion batteries are being increasingly used as core ESS for environmentally friendly ship operations. However, the internal temperature of these batteries is a critical factor directly affecting performance, safety, and lifespan. Improper thermal management can lead to serious safety risks, including thermal runaway [
4,
8].
Battery operation in marine environments demands higher reliability and durability than in typical land-based applications. Marine batteries are often exposed for extended periods to harsh conditions, such as high temperatures, salinity, and vibration, which increases degradation and thermal runaway risks [
9,
10,
11]. Depending on charge/discharge conditions and the external environment, the time to thermal runaway can be significantly reduced, and internal-temperature fluctuations directly impact system safety [
12,
13].
Currently, many systems monitor battery heat using temperature sensors attached to the surface. However, these sensors incur considerable installation and maintenance costs, and the discrepancy between surface and internal temperatures limits accurate thermal estimation [
14]. As an alternative, sensorless temperature estimation techniques, utilizing operational data, such as voltage, current, and state of charge (SoC), are gaining attention. These methods are regarded as potentially cost-effective and reliable solutions [
8,
15].
The long short-term memory (LSTM) model is particularly adept at learning dynamic changes in time-series data and capturing patterns of internal-temperature variation within batteries. LSTM-based models can learn the nonlinear thermal behavior of batteries and effectively incorporate historical data using input and forget gates, leading to more accurate internal-temperature estimation. Especially under high-temperature conditions, deep-learning-based internal-temperature estimation techniques can enhance battery safety and operational reliability [
16,
17].
Building on this background, this study proposes an artificial intelligence (AI)-based sensorless temperature estimation method for accurately and efficiently estimating the internal temperature of lithium-ion batteries within shipboard operating environments. This approach is expected to enhance battery safety and lifespan, thereby supporting environmentally sustainable ship operations in compliance with IMO regulations.
Research Scope and Structure
This study involved the development and evaluation of an AI-based sensorless method for accurately estimating the internal temperature of shipboard lithium-ion batteries without relying on physical sensors. Addressing the cost and reliability limitations of conventional sensor-based methods, this study employs a data-driven technique, categorized as a sensorless estimation strategy (illustrated in
Figure 2), to enhance temperature estimation accuracy and stability.
To achieve this, the initial research phase involves modeling an organic Rankine cycle (ORC)–ESS system based on real ship operational data to derive the ESS operating characteristics. Using HYSYS (AspenTech, Bedford, MA, USA) and MATLAB, charge/discharge conditions and power usage patterns are analyzed [
18]. Based on this analysis, key variables affecting battery temperature are selected, and an LSTM model is designed using these variables.
A MATLAB-based simulation environment is developed for this study. Real-world charge/discharge data serve as training data to evaluate the model’s performance. Simulation results indicate that the proposed sensorless temperature estimation method achieves lower error levels, in terms of root mean square error (RMSE) and mean absolute error (MAE), than conventional methods, and demonstrates stable performance under various operating conditions.
The proposed method offers potential for integration into battery management systems (BMS) to effectively prevent battery overheating, mitigate fire risks, and extend battery life. Furthermore, it presents a viable technical alternative for complying with the strengthened environmental regulations set forth by the IMO.
2. Temperature Detection System Configuration for Marine Lithium-Ion Batteries
This study aimed to achieve a stable power supply and efficient energy utilization by integrating an ORC power generation system with a marine battery system. The ORC system generates additional power by utilizing shipboard waste heat; however, owing to inherent variability in its power output, integration with a battery system is essential for maintaining power stability. A critical aspect of this integrated system is the thermal management of batteries. Therefore, this study also investigates configuration methods for battery-temperature detection and management systems.
In marine environments, characterized by high temperatures, humidity, salinity, and vibration, effective battery-temperature management is crucial. To achieve this, it is important to analyze the limitations of conventional sensor-based temperature detection methods and explore more reliable temperature sensing and control technologies. Consequently, in addition to traditional sensor-based approaches, this study investigates an AI-based sensorless temperature estimation method to develop a more precise and stable battery-temperature management system.
Through this combined approach, the study aims to optimize the integration between the ORC power generation and battery systems, thereby enhancing the reliability of energy storage and power supply within shipboard environments.
2.1. ORC–ESS Configuration
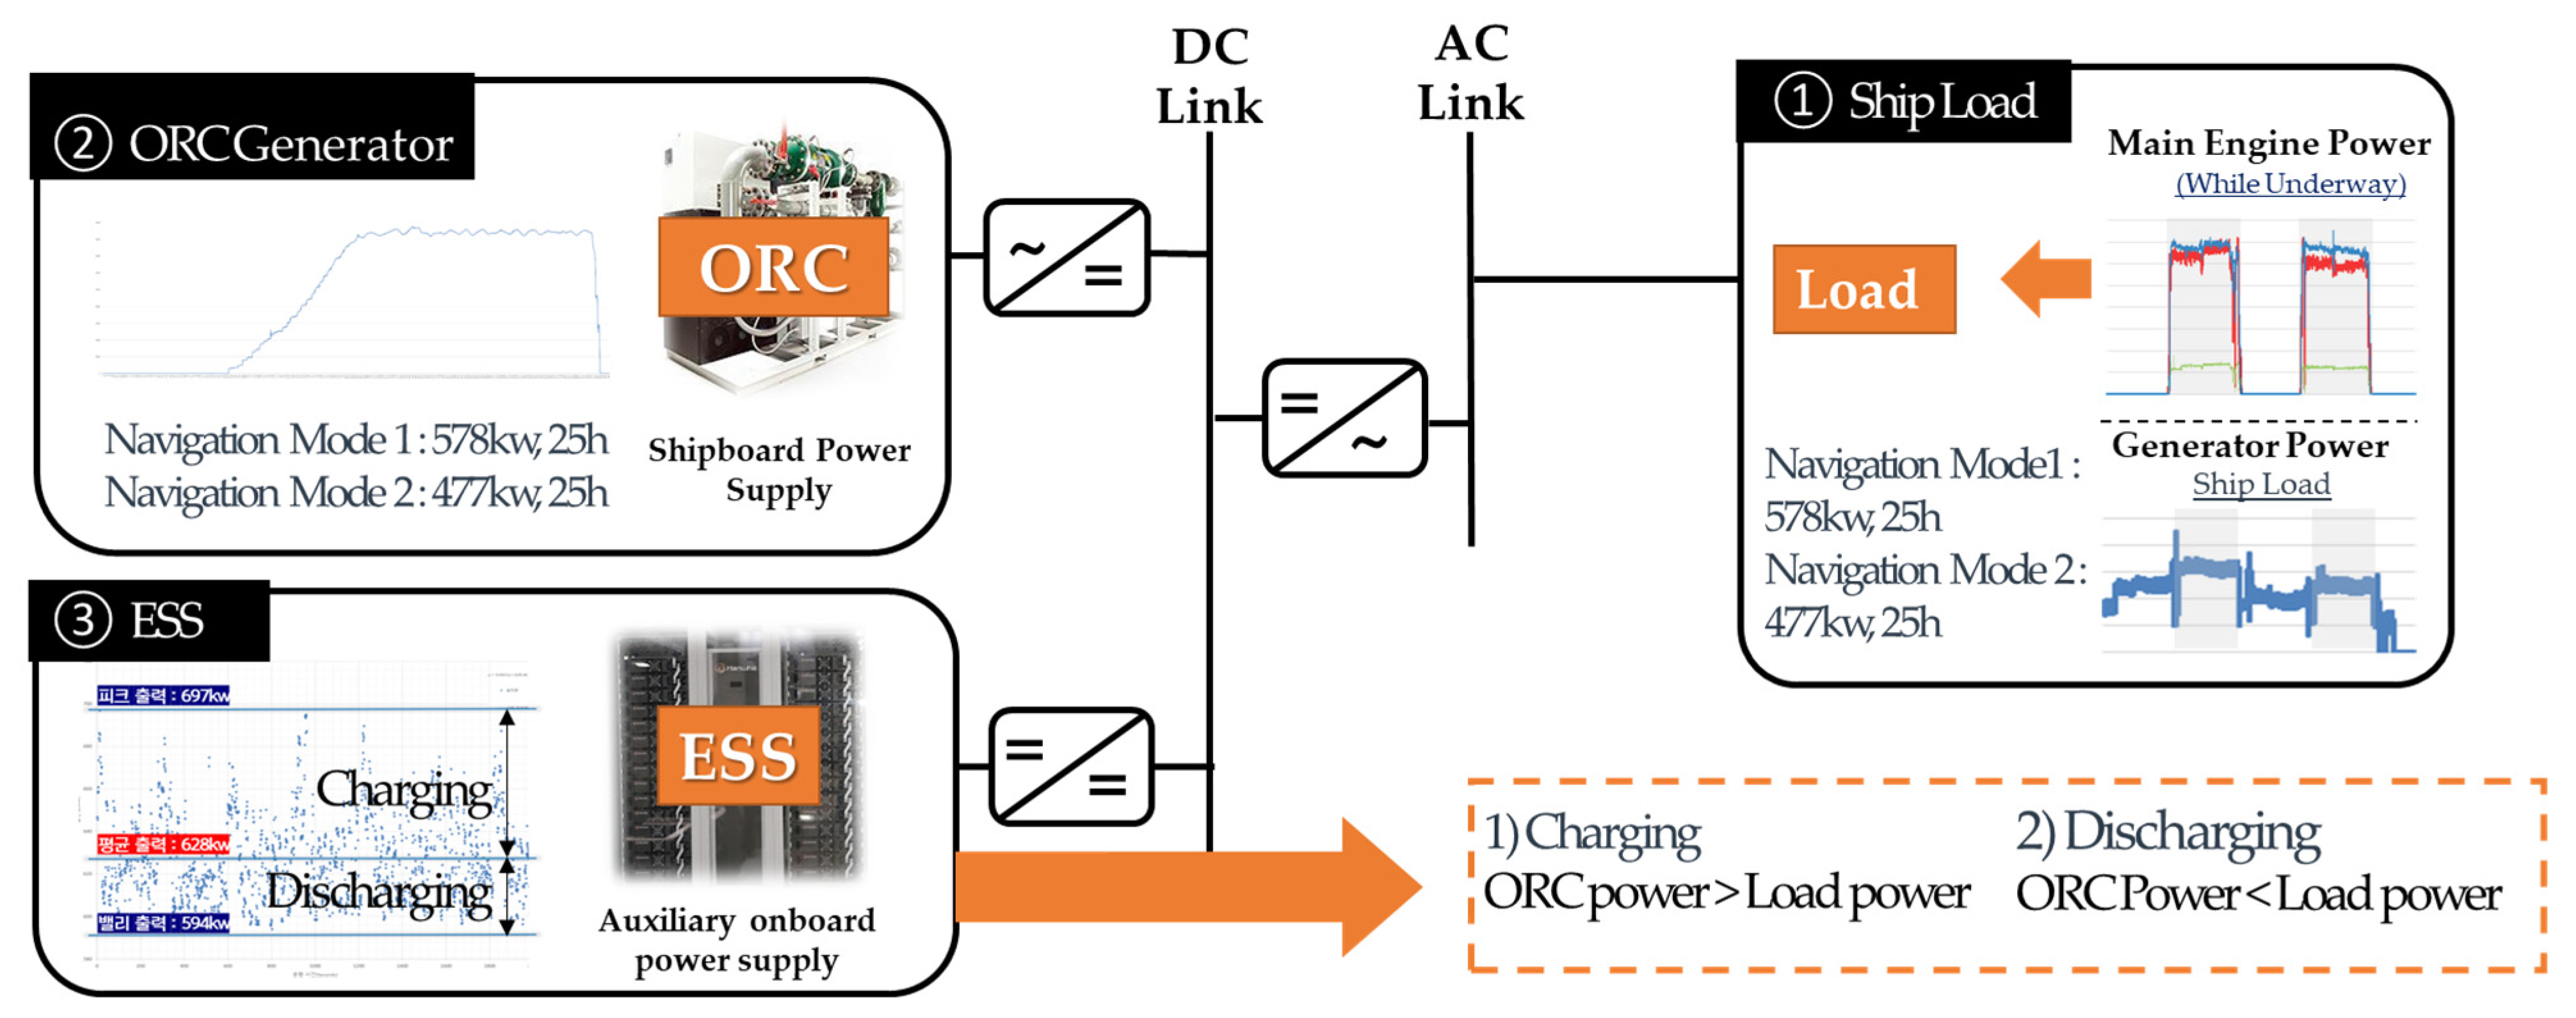
Figure 3 shows a block diagram of the proposed ORC–ESS power generation system for marine applications. The system comprises an ORC power generation unit that produces electricity from ship engine waste heat and a battery system designed to compensate for fluctuations in power output.
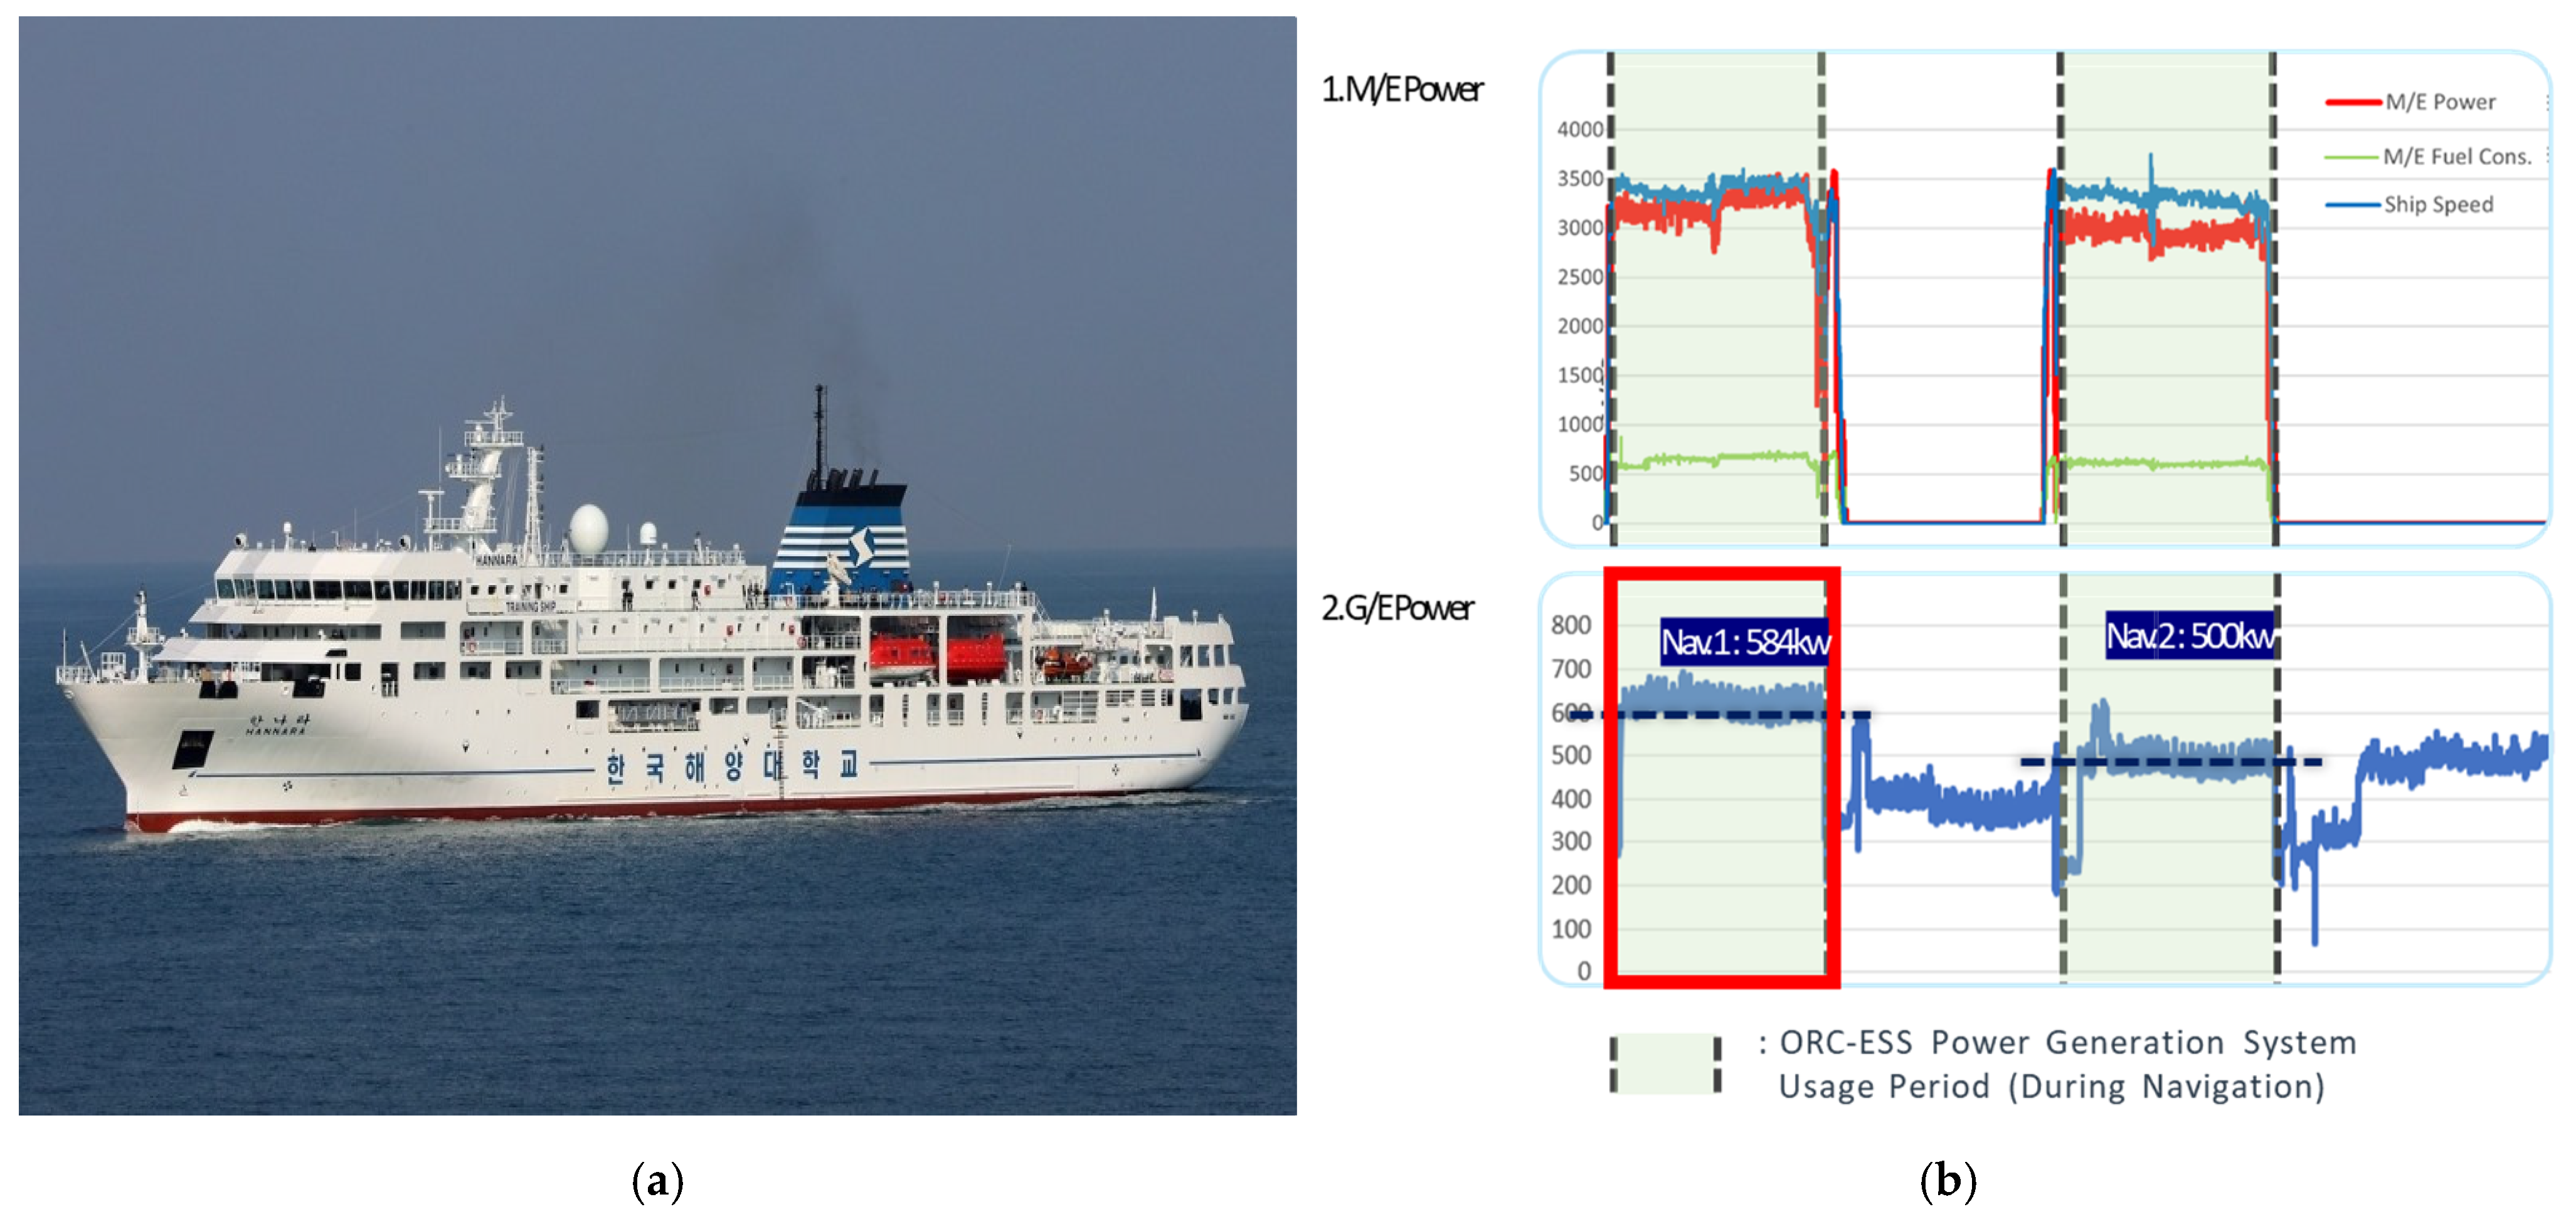
Figure 4 illustrates the analysis of operational data from the training ship,
Hannara, operated by Korea Maritime and Ocean University, used for modeling the ORC–ESS system. A total of 50 h of voyage data (25 h per leg) was collected during round trips between Busan and Masan Ports. Time intervals where both the main engine and speed log were operating normally were designated as representative voyage sections for analysis.
The characteristics of the power load during these intervals were analyzed in the context of using an ORC system powered by main engine waste heat. MATLAB was used to determine the mean and standard deviation (std) of the power load:
First leg: Average load of 578 kW, standard deviation of 97 kW.
Second leg: Average load of 477 kW, standard deviation of 61 kW.
The first leg exhibited both higher average power demand and greater load fluctuation, which is presumed to result from differences in sailing conditions and weather patterns encountered during that segment.
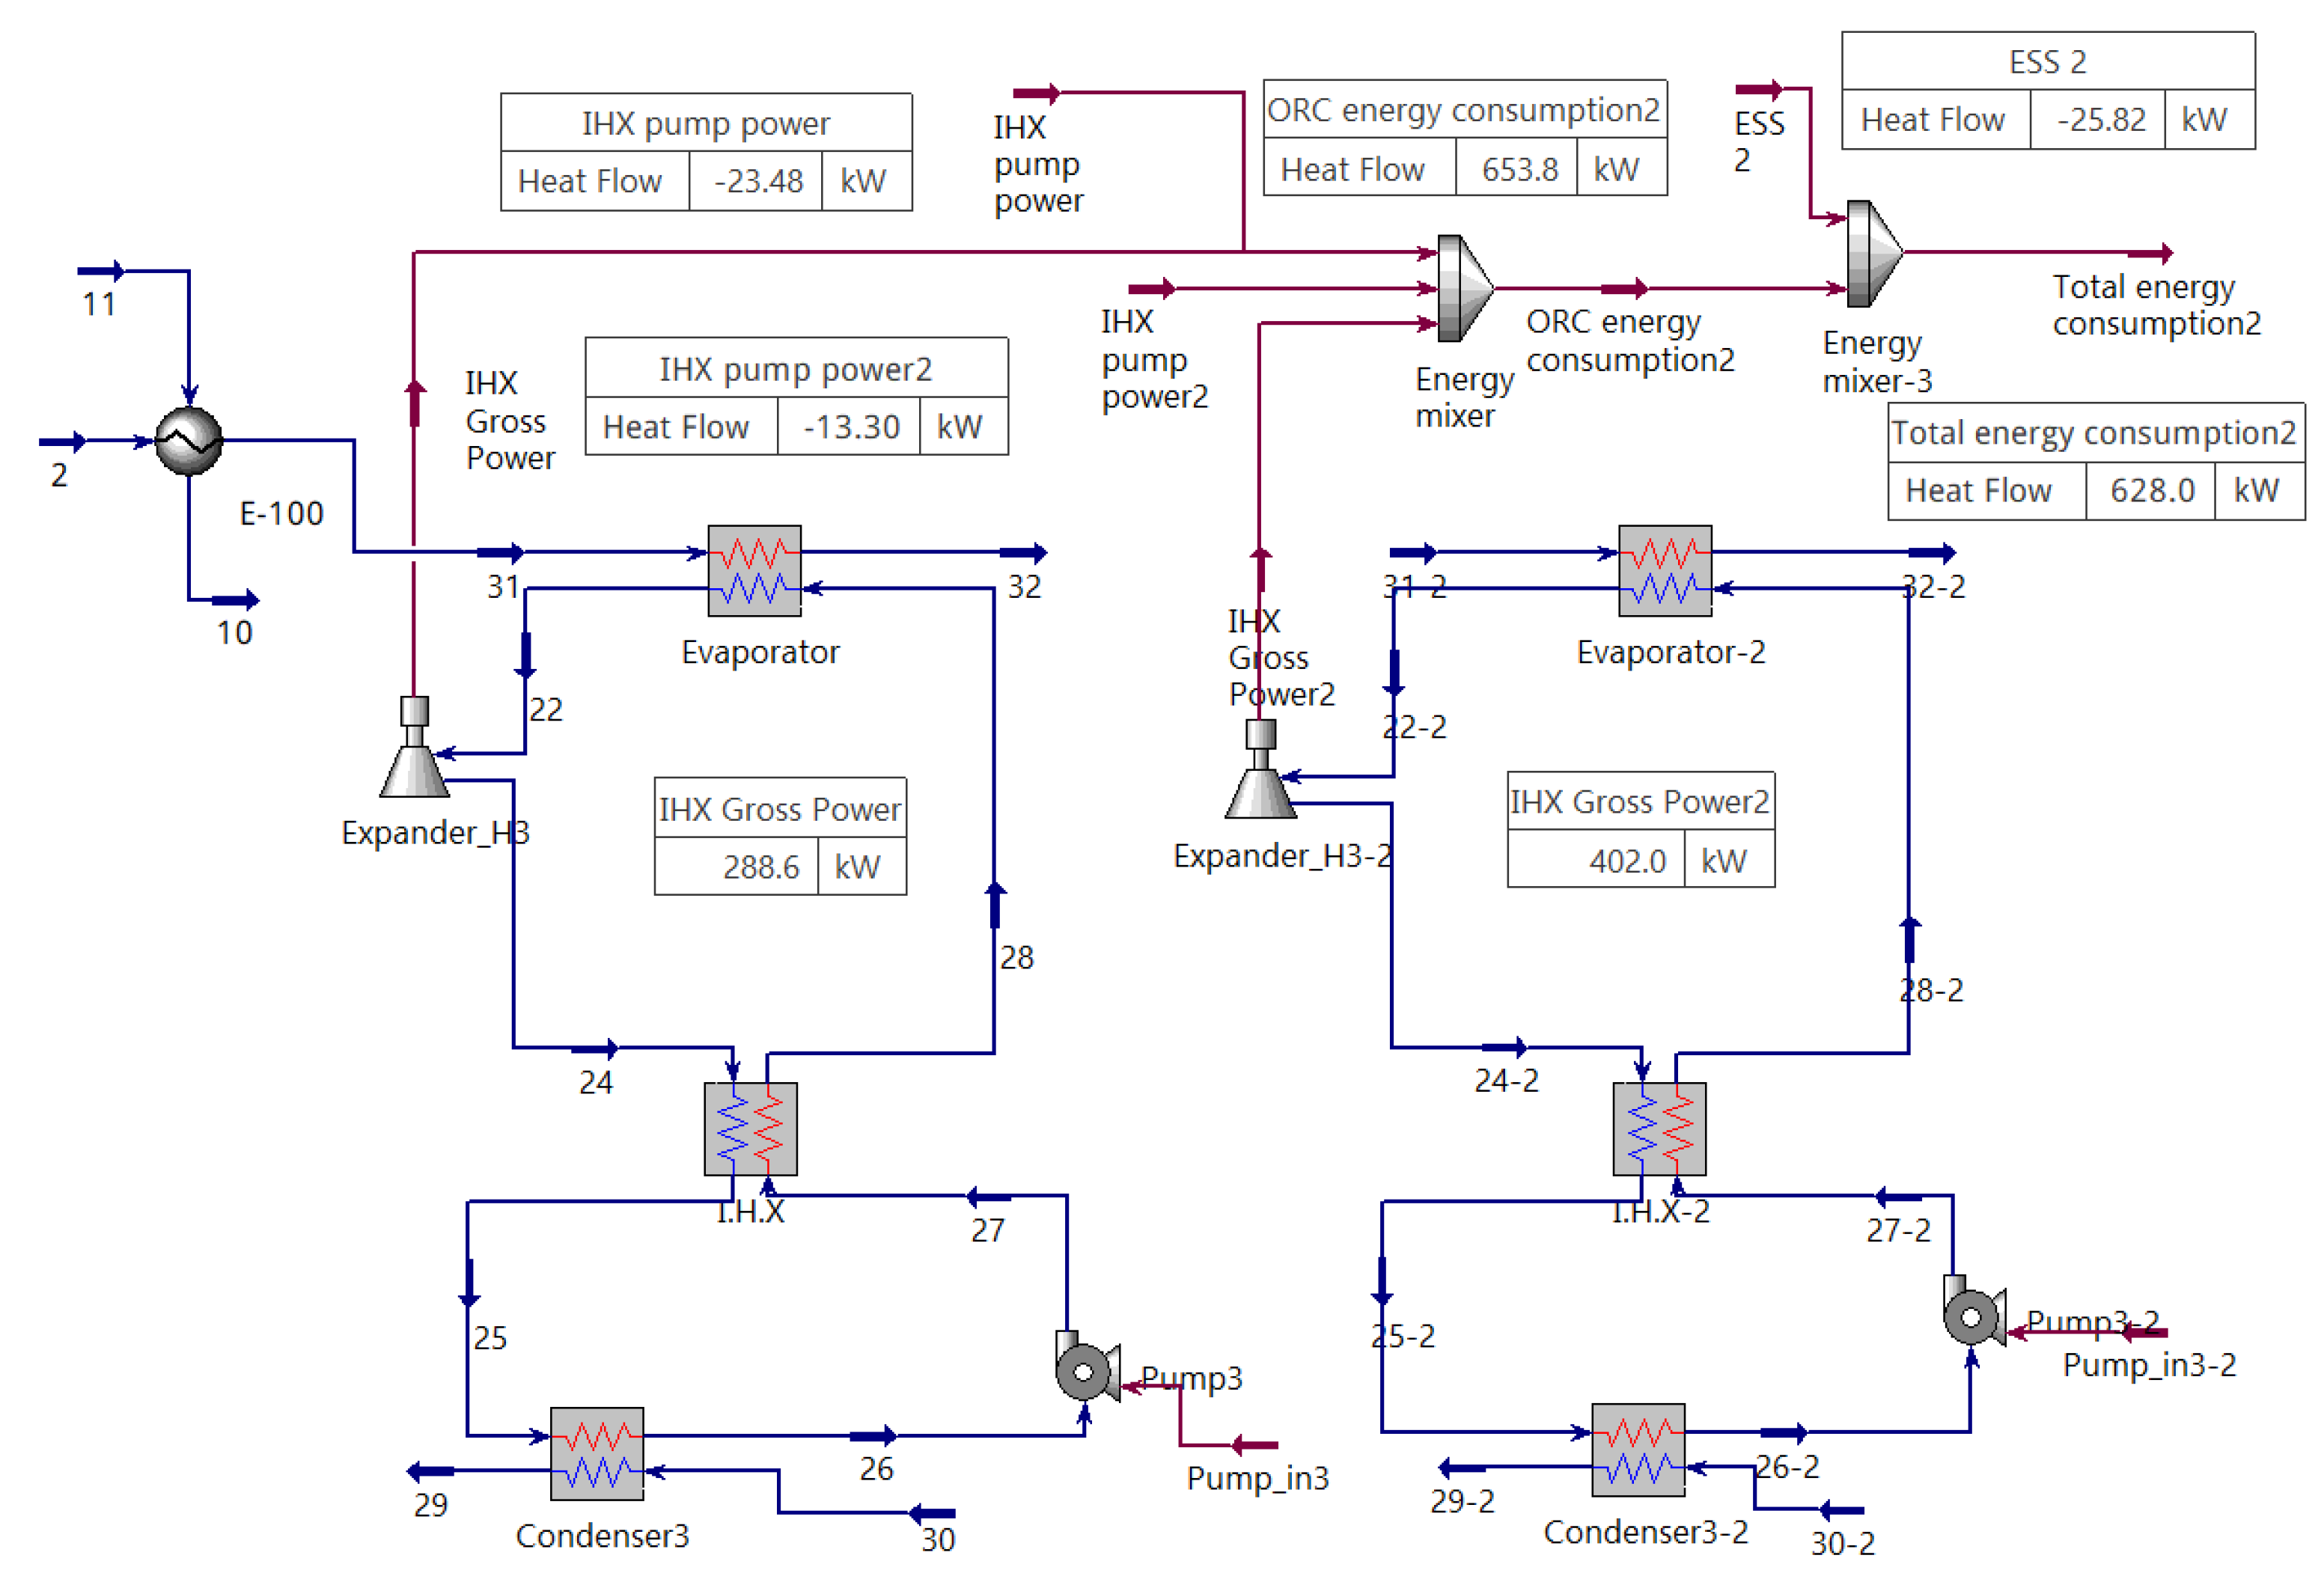
2.2. ORC System Modeling
Figure 5 illustrates the HYSYS simulation model of the ORC system, based on main engine waste heat parameters from the training ship,
Hannara. The engine specifications include an exhaust gas volume of 135,000 Nm
3/h and exhaust temperature of 320 °C. Additional heat sources, modeled as a heat transfer fluid (160 °C, 6 bar) and engine-cooling water (90 °C, 3 bar), were included based on typical main engine parameters.
The main operating conditions assumed for the ORC system simulation are summarized as follows:
Steam temperature difference: 30 °C,
Cooling water temperature difference: 20 °C,
Circulating cooling water temperature: 30 °C,
Turbine efficiency: 65%,
Pump efficiency: 80%.
Based on these parameters, the simulation indicated power generation of 288.6 kW from ORC Generator No. 1 (utilizing exhaust gas waste heat) and 353.6 kW from ORC Generator No. 2 (utilizing engine-cooling water and other waste heat sources), resulting in a gross power output of 642.2 kW. After accounting for pump power and internal consumption, the final net output was 584 kW.
The output of the ORC system can be modulated, primarily by regulating condenser-cooling water flow, allowing for adjustments based on ship operating conditions and load variations. The system aims to provide a stable power supply under varying marine environmental conditions.
2.3. Battery System Modeling for ORC Integration
Although the modeled ORC system exhibited an average net output of 584 kW with a standard deviation of 39.82 kW, the ship’s actual load showed a significantly higher standard deviation of 92 kW around a similar average power level. This discrepancy necessitates a battery system to stabilize power quality. However, optimal battery sizing in shipboard environments must consider constraints, such as maintenance requirements, installation costs, and available space.
To address the sizing challenge, a probabilistic approach employing the central limit theorem (CLT) was applied. The CLT allows complex variability to be approximated by a normal distribution. By modeling the fluctuations of both the ship’s load and ORC system’s output as normal distributions, the required battery capacity could be mathematically optimized.
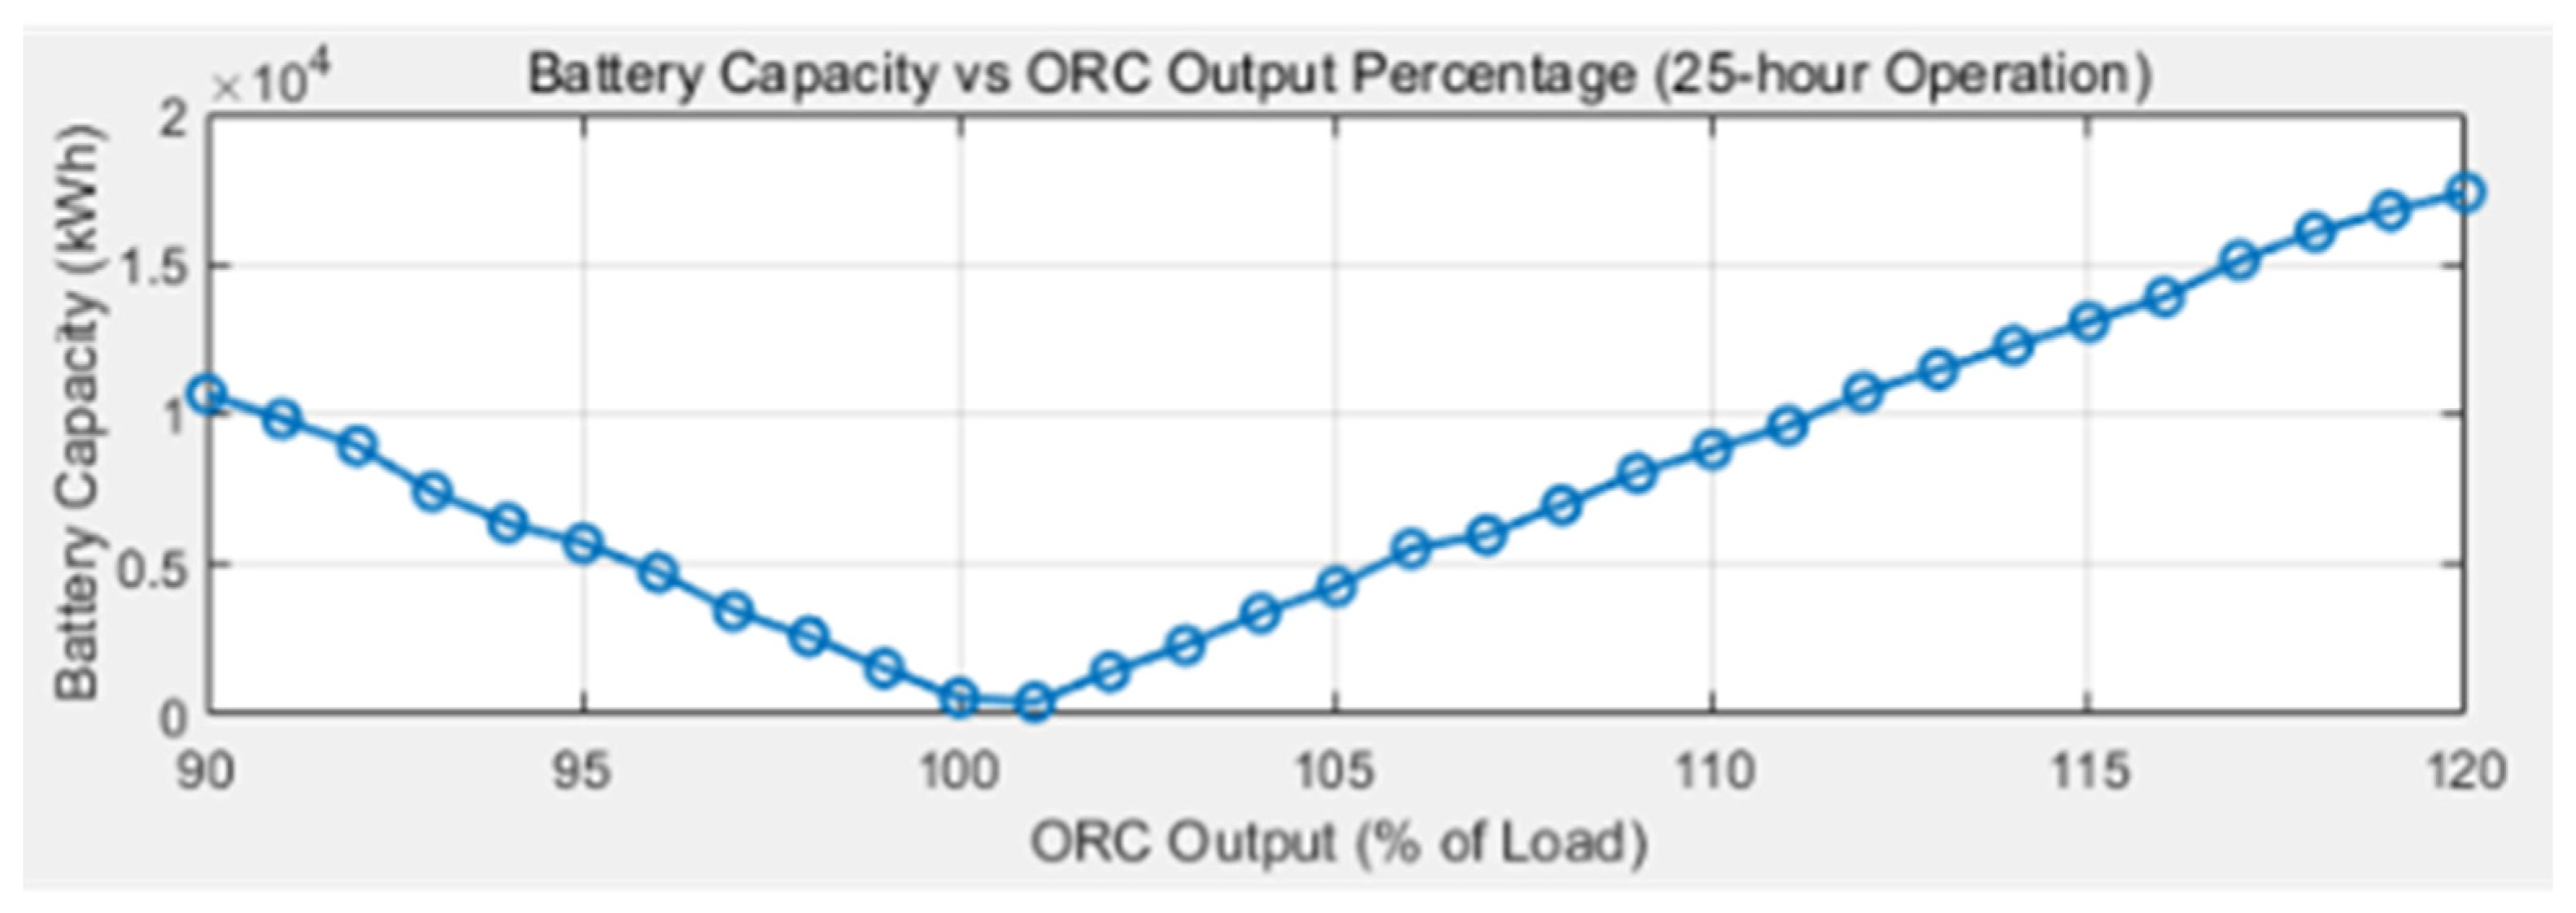
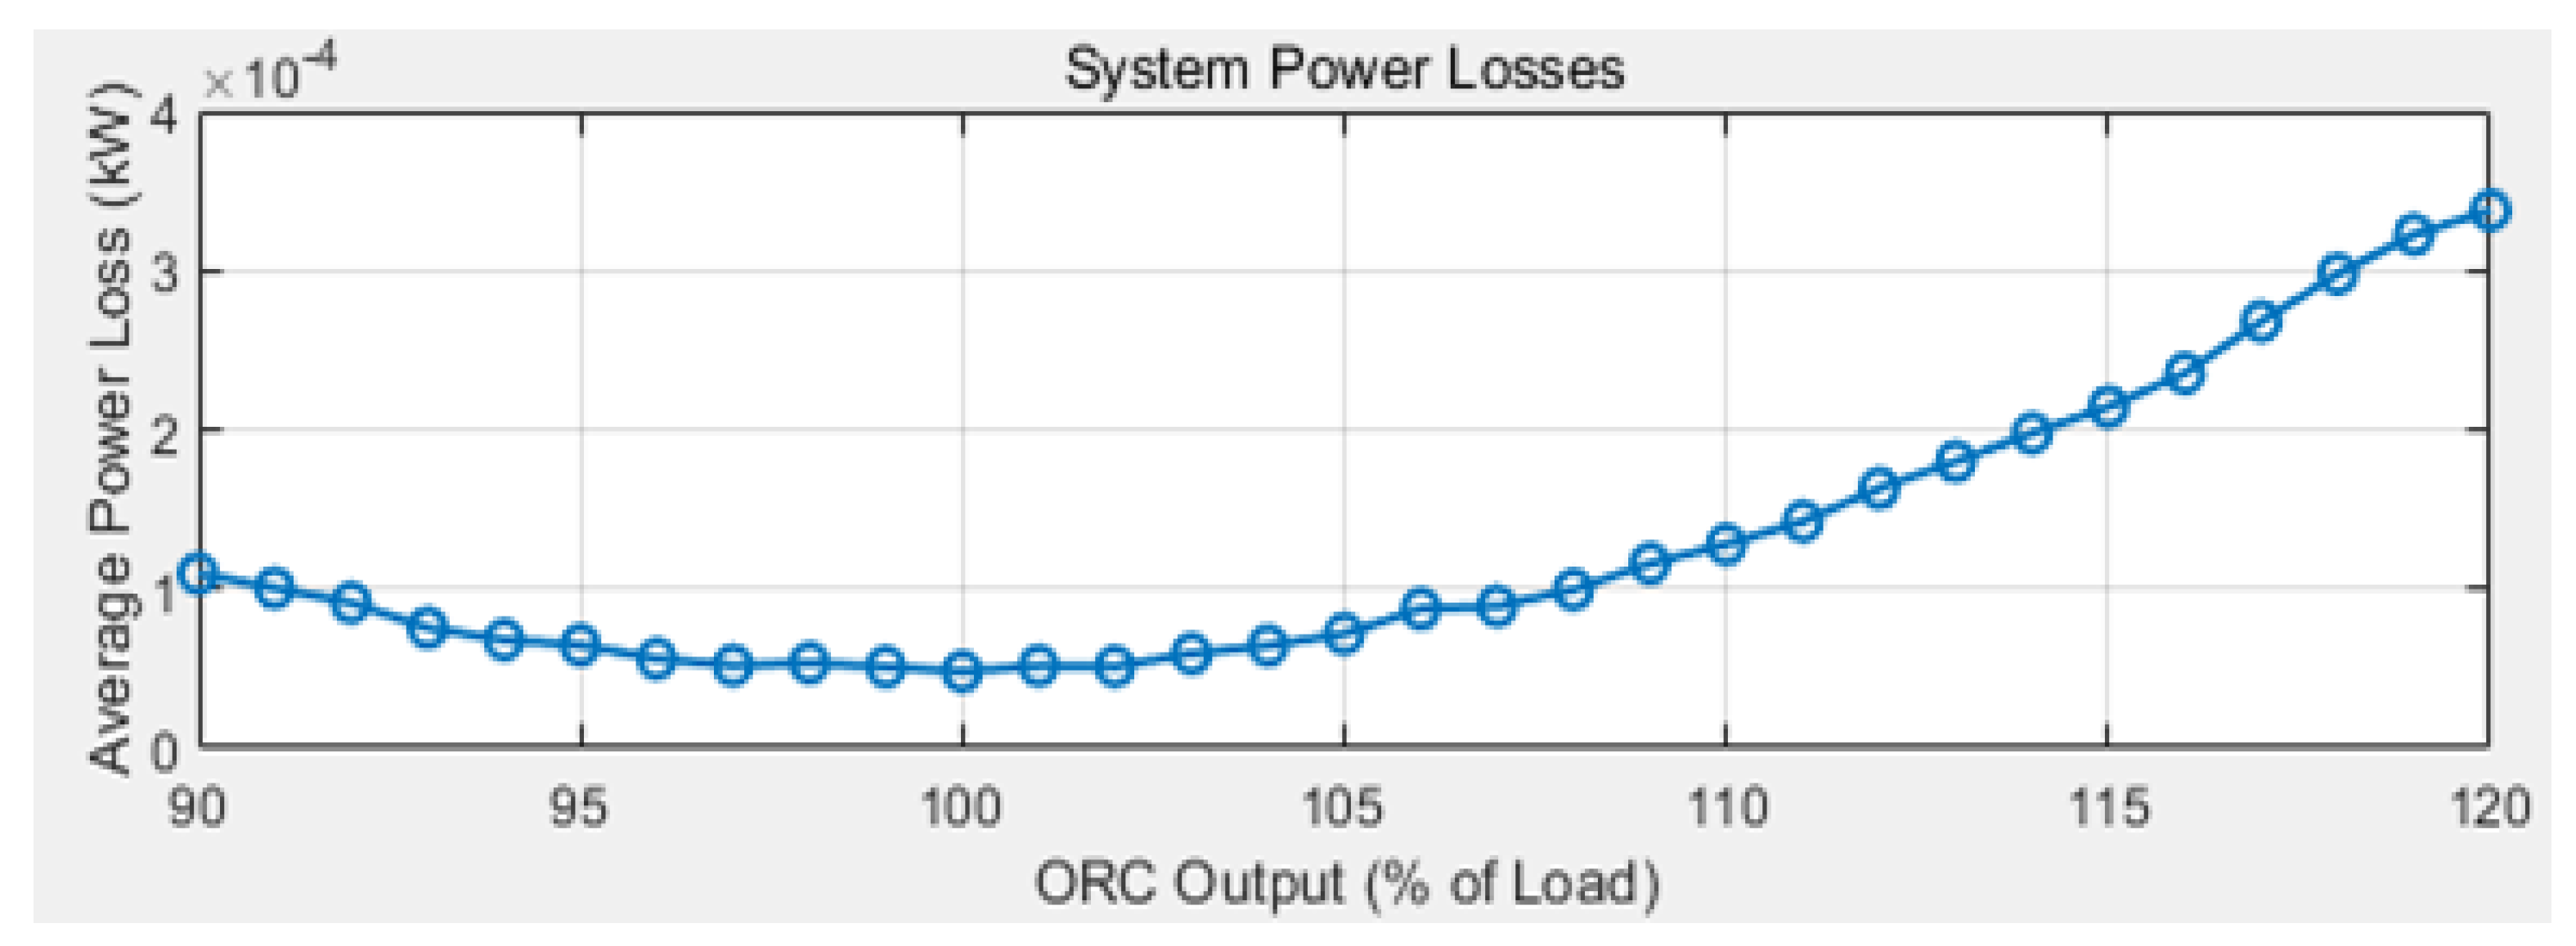
Simulations were performed to calculate the required battery capacity and associated power losses based on the proportion of the average load supplied by the ORC system. Battery capacity was determined based on the energy storage required to buffer fluctuations within a 20–80% SoC operating range. The final required capacity was calculated using temperature correction coefficients and degradation factors, as follows:
Simulation results indicated that the required battery capacity was minimized at 404.95 kWh when the ORC average output was set to 101% of the average load (equivalent to 589.84 kW). This optimal point reflects key system assumptions: 90% charge/discharge efficiency, a 20–80% SoC range, an internal resistance of 0.008 Ω, and a voltage range of 500–750 V. As shown in
Figure 6, the minimum battery capacity was achieved at this ORC output ratio, indicating optimal sizing under the given constraints. Concurrently,
Figure 7 demonstrates that system power loss was also minimized under these conditions. However, increasing the ORC output ratio further resulted in a nonlinear increase in power losses, highlighting the trade-off between overproduction and overall system efficiency.
An economic analysis comparing the integrated ORC–ESS system with conventional diesel generators indicated that the proposed system required an additional 6.32 m2 of installation space but achieved a weight reduction of 22.6 tons. While the initial investment cost increased by KRW 220 million, the system is projected to yield operational cost savings of KRW 5.14 billion over a 30-year period. These findings suggest that the ORC–ESS integrated system represents a technically and economically viable alternative for enhancing eco-friendly marine propulsion.
Furthermore, parameters derived from this optimized ORC–ESS system model—including charge/discharge efficiency, SoC range, internal resistance, voltage range, and the calculated 404.95 kWh capacity—served as the basis for constructing the dataset used to develop and validate the sensorless battery-temperature estimation model, the core focus of this study. This approach ensured that the model was trained and tested using parameters representative of battery behavior in real-world maritime environments.
3. Characteristics of Marine Lithium-Ion Batteries
Marine lithium-ion batteries must meet stringent requirements to ensure stable operation within unpredictable maritime environments. Additionally, high energy density is essential to maximize the efficient use of limited space onboard vessels.
Table 1 summarizes the key characteristics of lithium-ion and traditional lead-acid batteries.
Lithium-ion batteries offer high energy density (150–200 Wh/kg) and charge/discharge efficiency exceeding 95%. These features significantly improve space utilization on ships and operational cost-effectiveness compared to lead-acid alternatives. To manage operational stresses, BMS and thermal management systems are employed to control charge/discharge rates and manage heat generation, thereby extending battery life. Furthermore, specialized waterproof and flame-retardant designs contribute to reliable performance, even under harsh marine conditions.
These batteries typically support over 2000 charge/discharge cycles, with some advanced chemistries capable of sustaining more than 8000 cycles. Although the initial installation cost is relatively high, lithium-ion batteries provide superior long-term efficiency and sustainability, positioning them as a key component in modern eco-friendly marine energy systems.
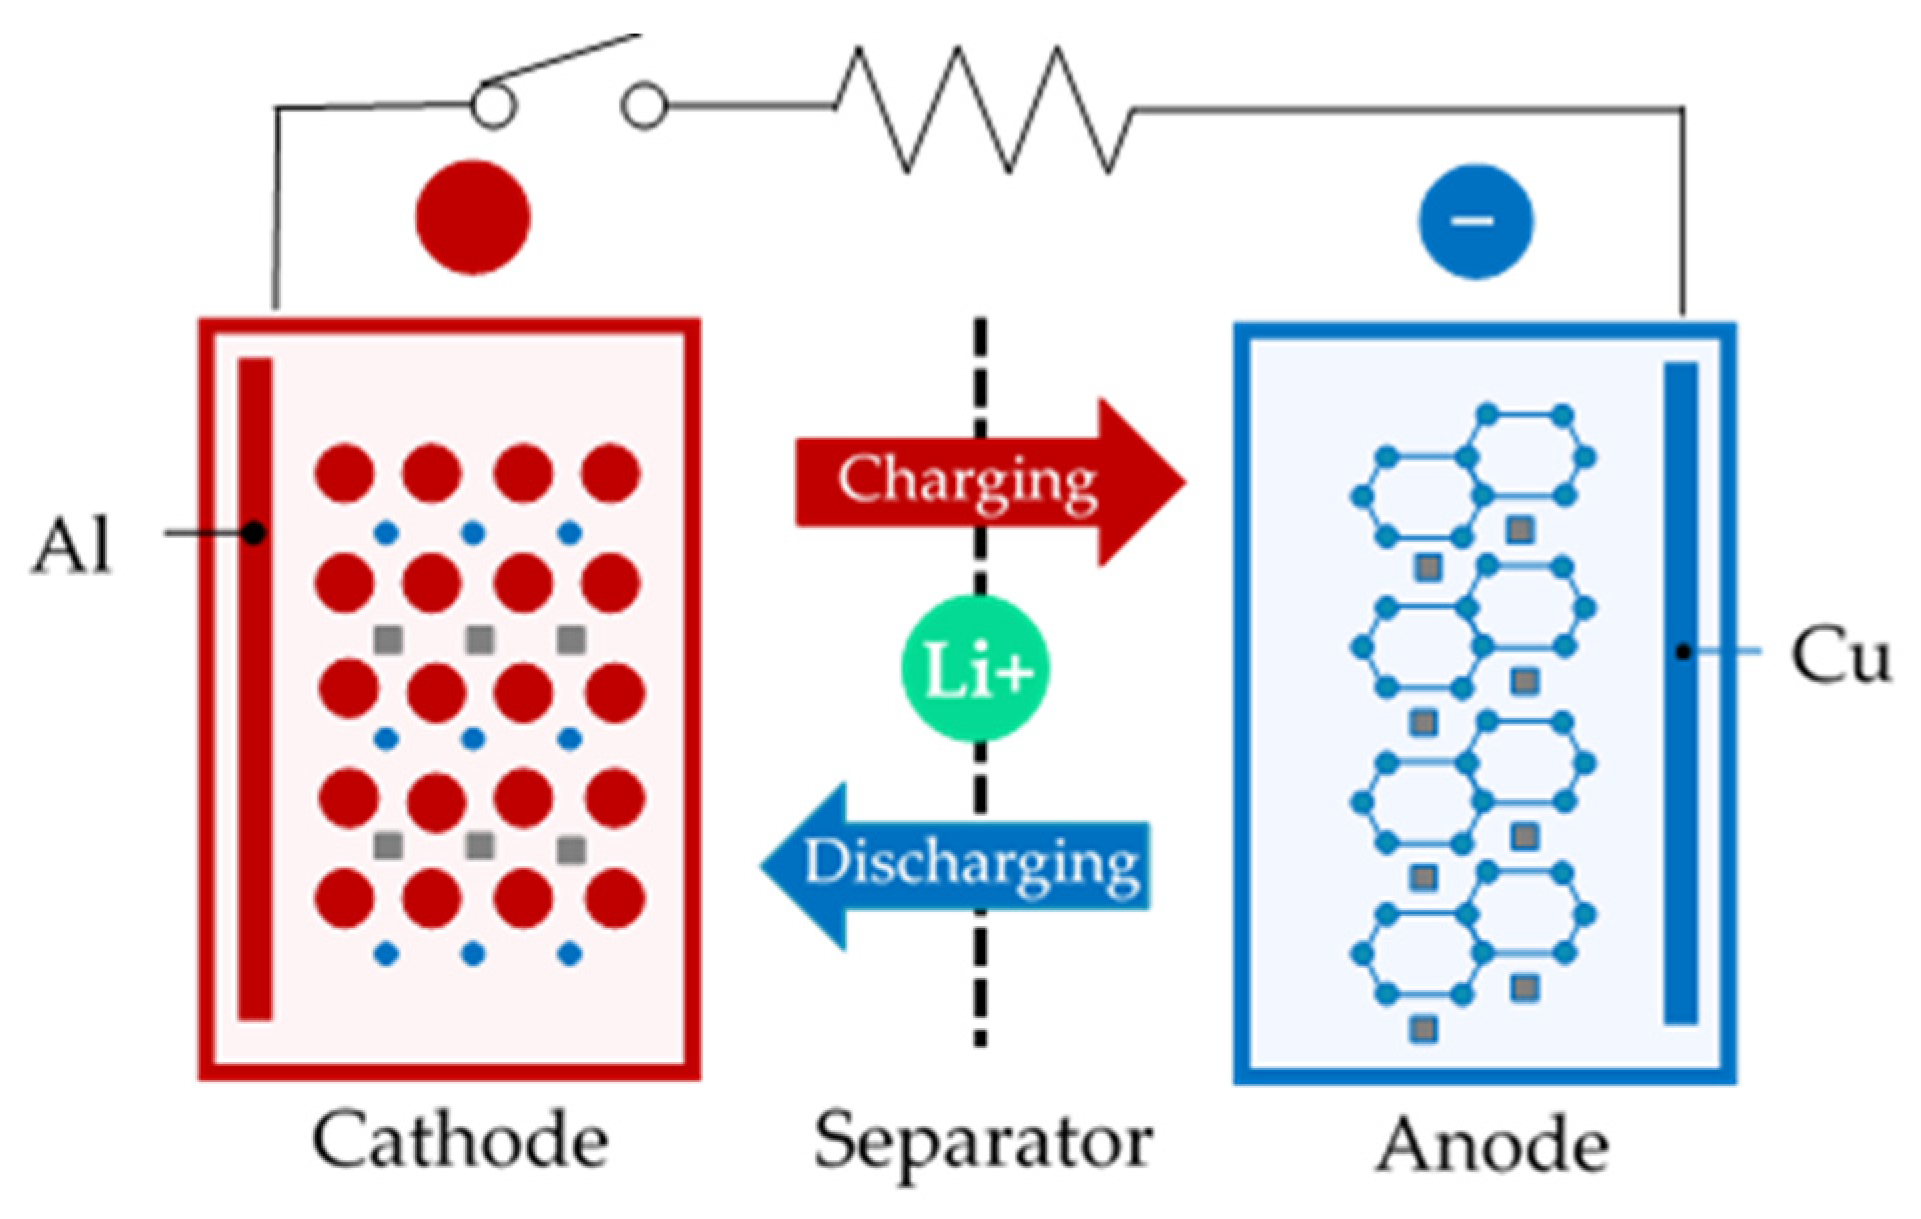
The schematic structure of a lithium-ion battery, illustrated in
Figure 8, comprises four primary components: the cathode, anode, electrolyte, and separator. The selection and properties of these elements critically determine the energy density, thermal stability, and overall operational safety of a battery.
The cathode typically consists of lithium-containing transition metal oxides, such as lithium cobalt oxide (LCO), nickel manganese cobalt (NMC), or lithium iron phosphate (LFP). While LCO offers high energy density, its thermal stability can be limited. NMC provides a favorable balance between performance metrics and cycle life, whereas LFP is known for its superior thermal stability and safety profile, making it particularly suitable for large-scale energy storage and demanding marine applications.
The anode, commonly made of graphite, facilitates the stable intercalation and de-intercalation of lithium ions during charging and discharging. However, operation at high C-rates can increase internal resistance and associated heat generation, potentially degrading performance over time. To address these limitations, alternative anode materials, such as silicon, which offer higher theoretical capacity, are being explored, though challenges related to volume expansion and cycle life stability remain.
The electrolyte—usually a lithium salt dissolved in an organic solvent—enables ion transport between the cathode and anode. Despite its effectiveness in facilitating ion transport, conventional organic electrolytes can be prone to thermal decomposition at elevated temperatures. This vulnerability has motivated research into safer alternatives, such as solid-state electrolytes [
19].
The separator physically isolates the cathode and anode, preventing internal short circuits while allowing lithium ions to pass through its porous structure. Its material properties, including microporosity and high thermal resistance, are essential for ensuring safe battery operation, especially within the demanding context of marine environments.
This intricate internal structure and electrochemical charge/discharge mechanism enable lithium-ion batteries to achieve high energy density and reliable performance, making them suitable for diverse applications ranging from portable electronics to large-scale marine ESS.
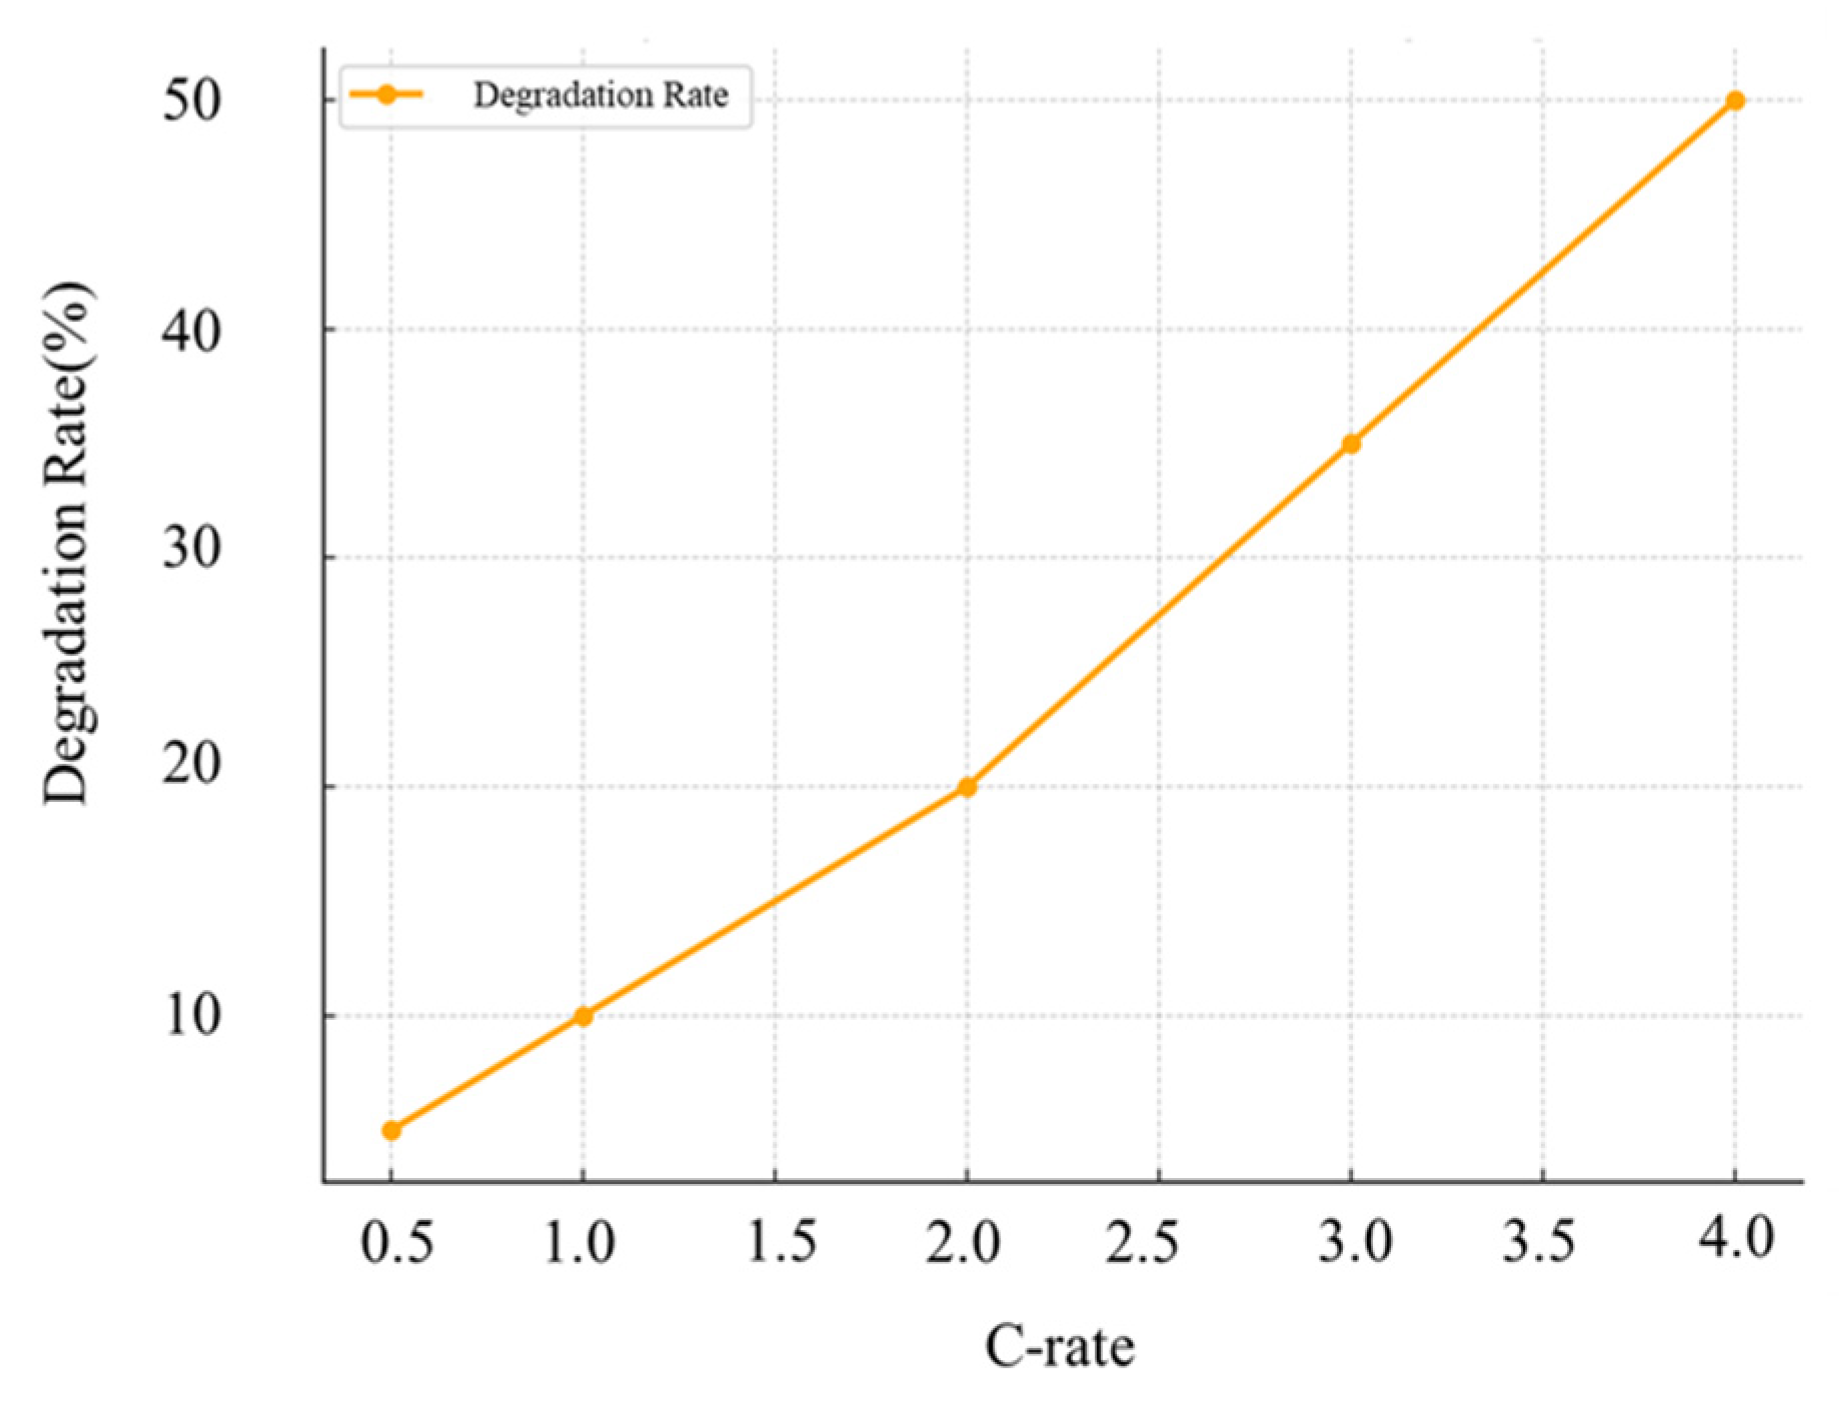
However, a battery’s performance and operational lifespan are highly sensitive to operating conditions, particularly the charge/discharge rate (C-rate) and depth of discharge (DoD). As illustrated in
Figure 9, the rate of capacity degradation increases significantly at higher C-rates [
20]. Operation at a low rate, like 0.5 C, may result in degradation of around 5% over a certain period, whereas that at a high rate of 4.0 C can increase degradation to nearly 50%. The sharp increase observed beyond 2.0 C is primarily attributed to increased internal resistance and heat generation. Therefore, careful C-rate management is crucial in the design and operation of marine battery systems.
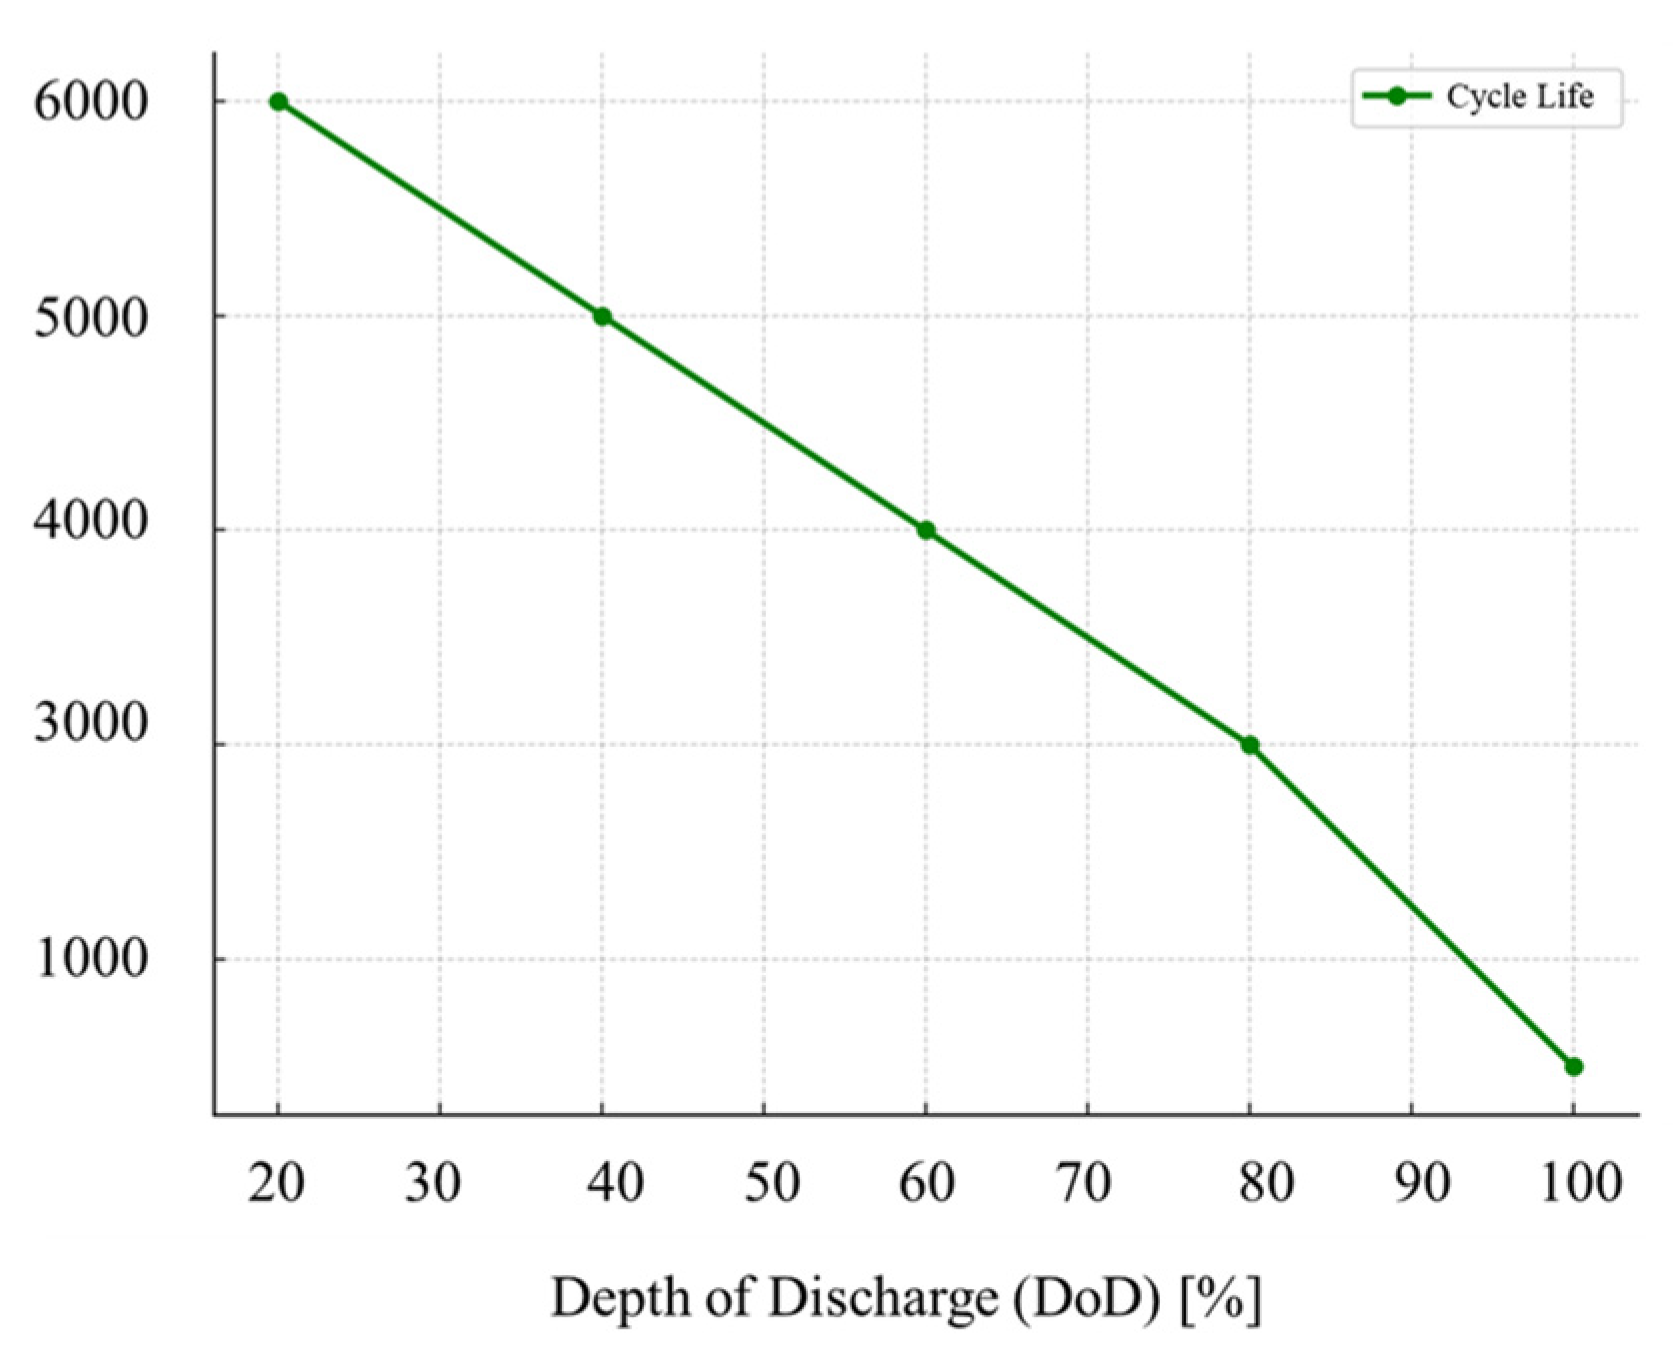
Similarly,
Figure 10 demonstrates the significant impact of DoD on battery cycle life. Operating a battery with shallow discharges (e.g., 20% DoD) can allow for over 10,000 cycles, whereas consistently deep discharges (e.g., 100% DoD) may limit the lifespan to only 500–1000 cycles. This reduction is primarily due to accelerated chemical degradation mechanisms associated with deep cycling. Therefore, limiting the operational DoD, often to ≤80%, is generally recommended, particularly in shipboard applications, to enhance both the economic viability and operational stability of the battery system.
In conclusion, ensuring the long-term reliability and safety of lithium-ion battery systems in demanding marine applications requires a holistic approach involving careful selection of materials, appropriate thermal management, and optimal control strategies for operational parameters, such as C-rate and DoD.
4. Sensorless Battery-Temperature Estimation
4.1. Overview and Limitations of Conventional Temperature Estimation Methods
In current industrial applications, direct temperature measurement using physical sensors remains a widely adopted approach [
21]. Devices such as negative/positive temperature coefficient thermistors, resistance temperature detectors, and multi-point sensor arrays are commonly employed to monitor the battery-pack temperatures in real time. However, this direct measurement method has several inherent limitations, including potential discrepancies between measured surface temperatures and actual internal temperatures, response delays, and measurement errors arising from sensor drift or aging. Particularly in large-scale ESS and marine battery packs comprising numerous cells, installing sensors on every cell is often impractical, which hinders the timely detection of localized overheating (hot spots). Additionally, environmental factors prevalent in marine settings, such as vibration, humidity, and salinity, can adversely affect sensor durability and reliability over time.
Redundancy is a critical requirement in shipboard systems. To enhance the overall reliability of battery-temperature management, adopting redundant measurement strategies that utilize multiple data sources is preferable to relying solely on single-point sensor measurements [
22]. Such redundancy allows for continuous temperature monitoring even if a sensor fails or provides anomalous data, thereby strengthening overall battery safety.
To overcome the limitations associated with conventional sensor-based methods, sensorless temperature estimation techniques, often leveraging AI, have gained increasing attention [
23]. When implemented alongside traditional sensors, these methods can potentially improve the accuracy and resolution of temperature monitoring, enabling more precise real-time assessment of battery thermal conditions. Sensorless estimation methods are generally categorized into three main types: analytical model-based, observer-based, and data-driven approaches [
24,
25]. In high-reliability applications, such as maritime systems, combining insights from multiple methods is essential to ensure overall robustness and stability of the temperature management system.
4.1.1. Analytical-Based Method
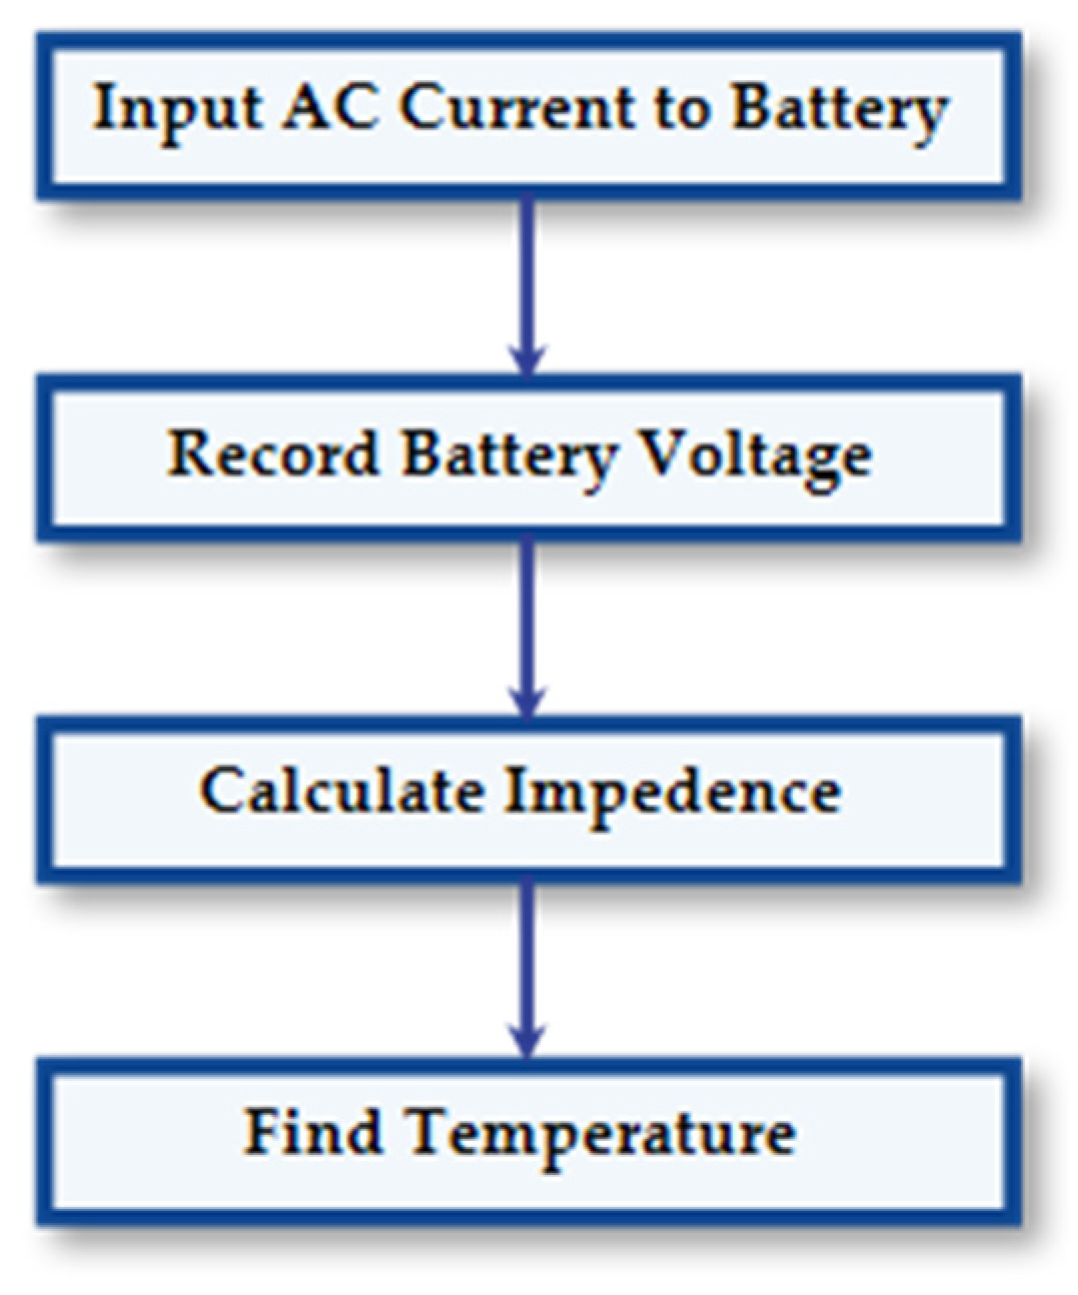
Analytical model-based methods estimate battery temperature by leveraging the established relationship between the electrochemical impedance of the battery and its temperature [
26]. These methods typically employ lookup tables or curve-fitting equations derived from impedance measurements (analyzing magnitude and phase shifts at single or multiple frequencies) to establish a direct correlation with temperature (
Figure 11) [
27].
This approach offers several advantages, including relative ease of implementation, low computational complexity, suitability for real-time application, and minimal additional hardware requirements. However, its performance is highly dependent on the accuracy of the underlying impedance-temperature model. Estimation accuracy is significantly influenced by the precision and reliability of the impedance measurements themselves [
28].
Additionally, frequent updates to the lookup tables or model parameters are required to account for changes in battery characteristics owing to aging or variations in operating conditions, which can be challenging to implement accurately. Because impedance measurement accuracy is critical, careful optimization of the measurement frequencies and conditions is essential for reliable temperature estimation [
29].
4.1.2. Observer-Based Methods
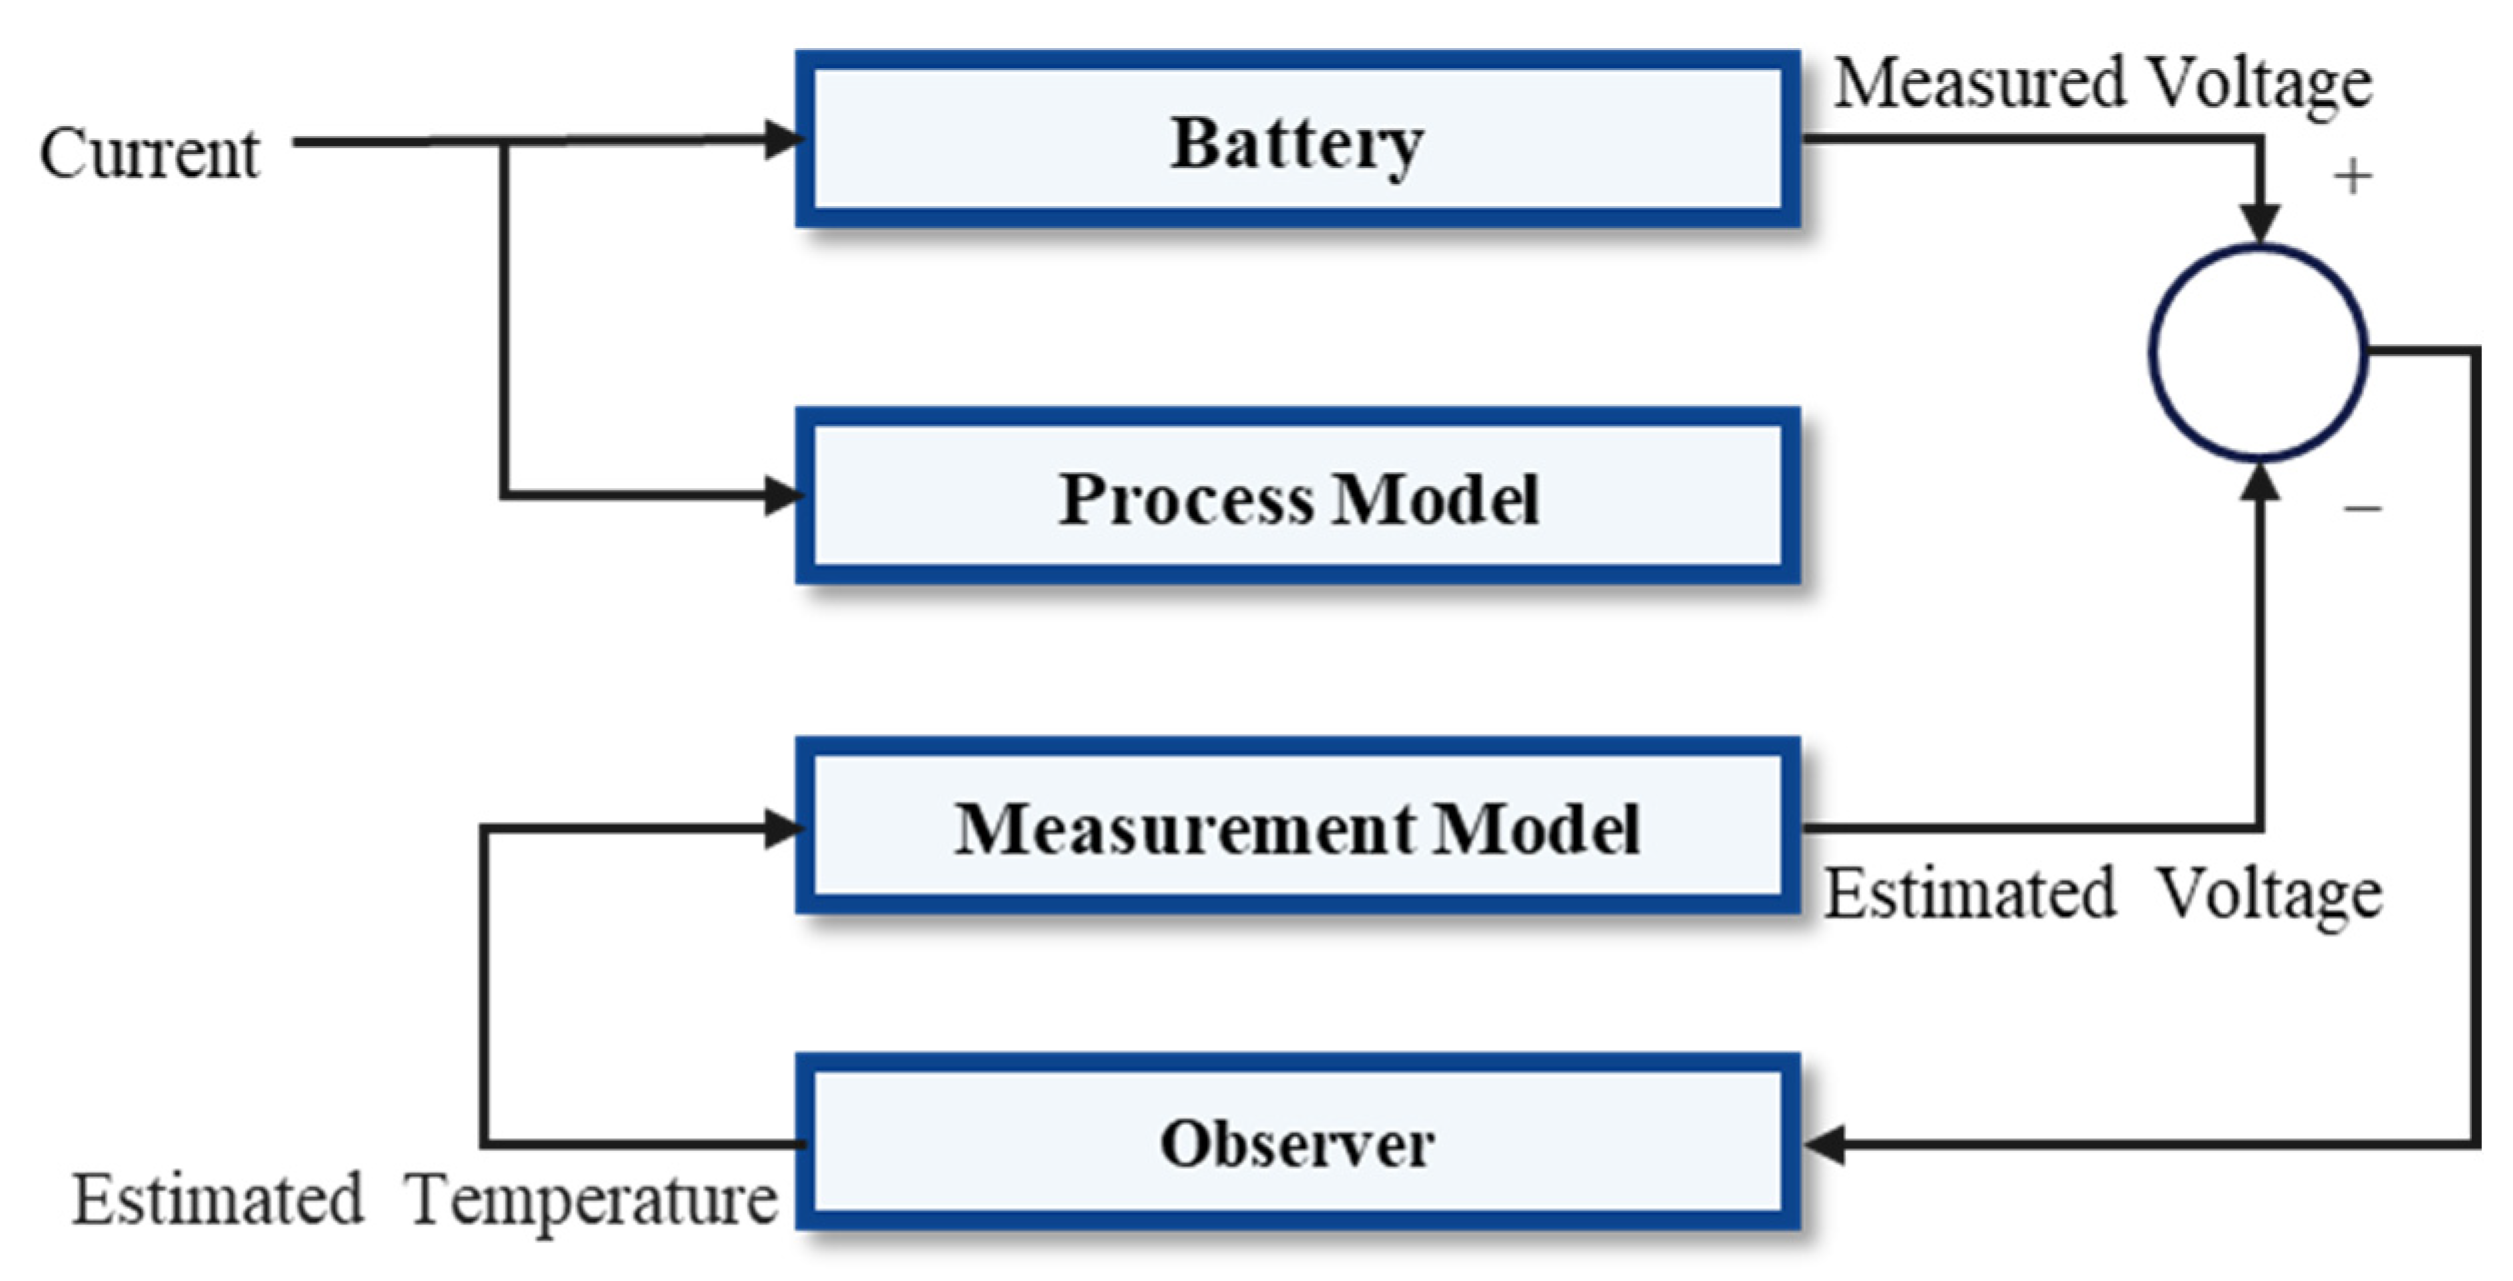
Analytical model-based methods estimate battery temperature by leveraging the established relationship between the electrochemical impedance of the battery and its temperature [
26]. These methods typically employ lookup tables or curve-fitting equations derived from impedance measurements (analyzing magnitude and phase shifts at single or multiple frequencies) to establish a direct correlation with temperature (
Figure 12) [
27].
However, the effectiveness of observer-based methods relies heavily on the availability of accurate dynamic (thermal) and measurement models. Model parameters may require periodic updates to reflect battery aging or changing environmental conditions. The computational complexity can also be relatively high compared to simpler analytical models, potentially posing challenges for implementation in real-time applications. If the underlying models are inaccurate or poorly parameterized, the overall estimation performance can significantly deteriorate.
In summary, while observer-based methods offer strong robustness to noise and can correct for initial errors, their practical effectiveness is highly contingent on the accuracy and validity of the system models used.
4.1.3. Data-Driven Methods
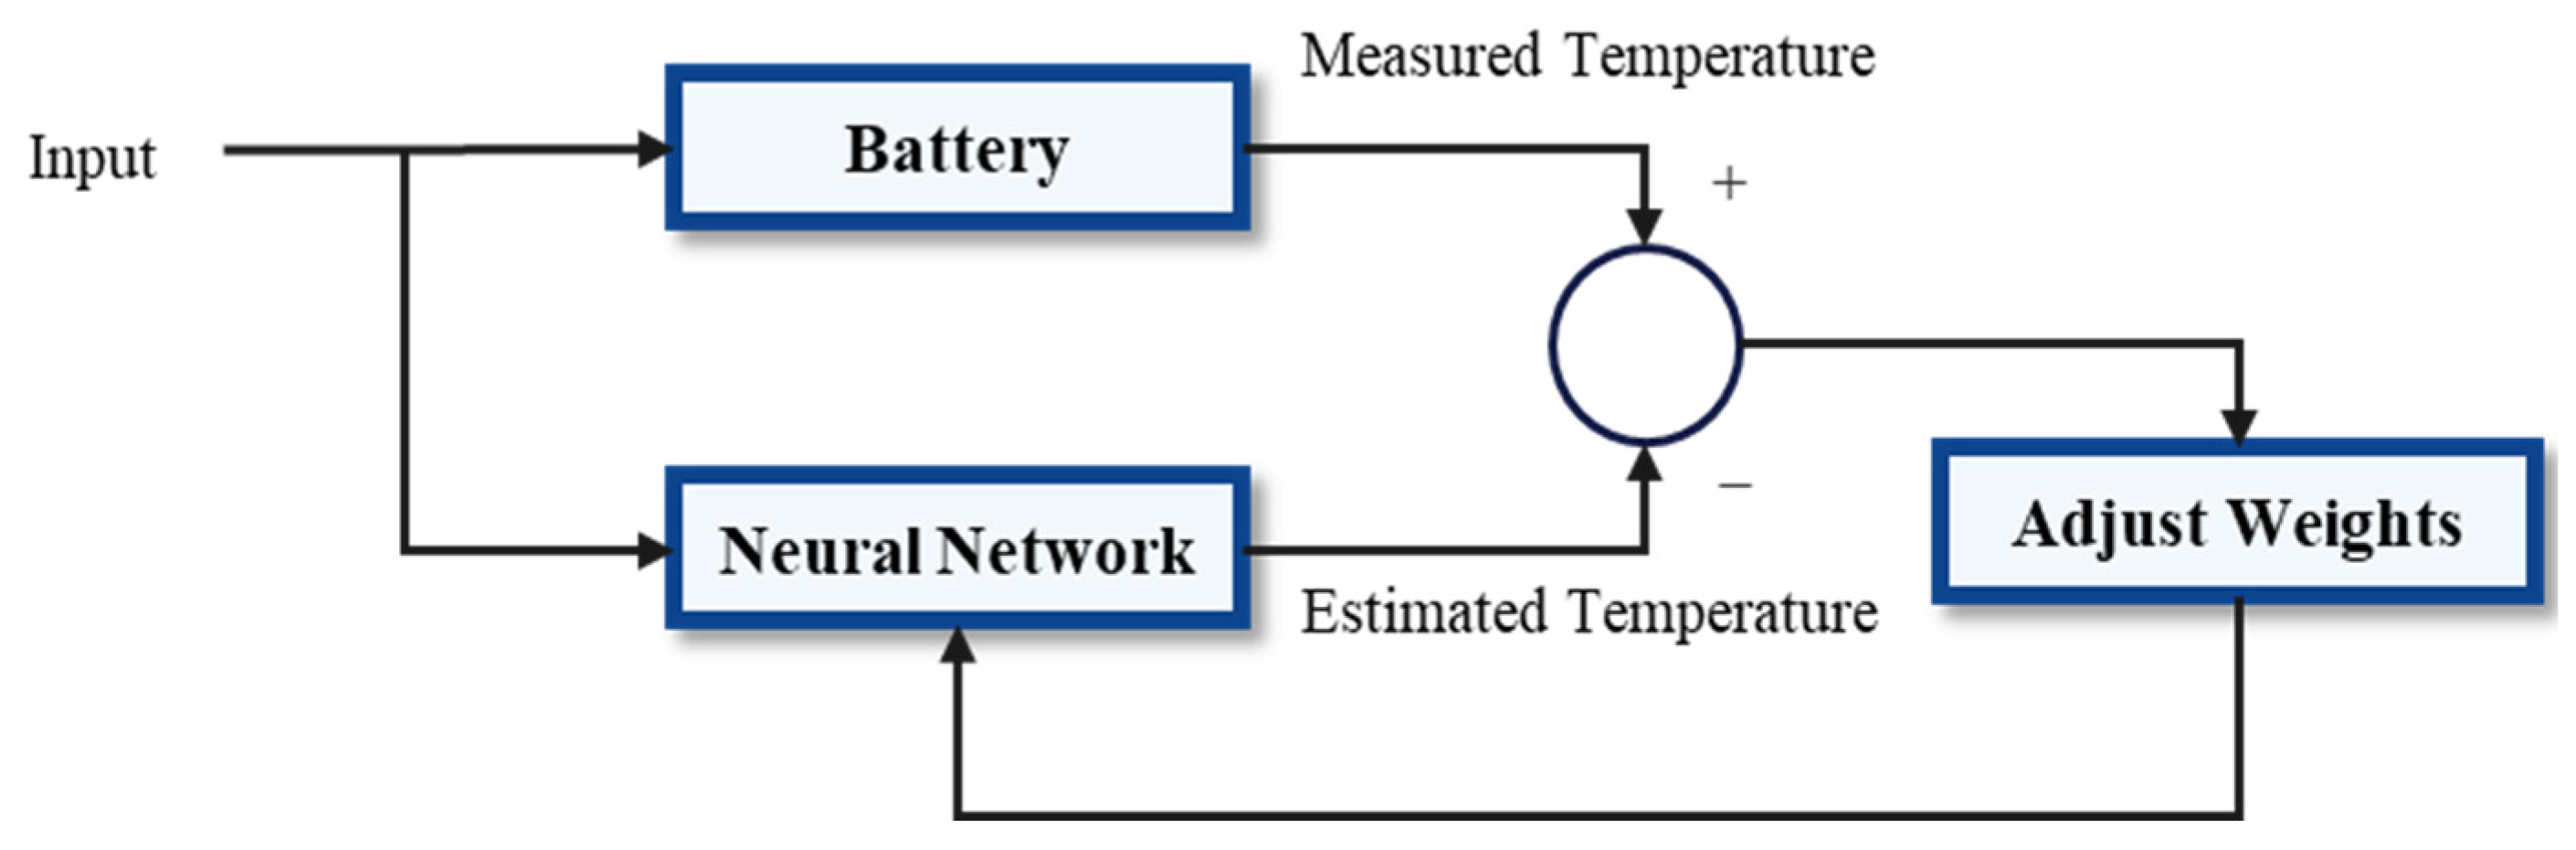
Data-driven methods estimate instantaneous battery temperature using machine learning models, particularly artificial neural networks, which have gained prominence with recent advancements in deep learning [
28,
29,
30,
31]. These approaches employ models such as LSTM or gated recurrent unit networks—both types of recurrent neural networks (RNNs) designed for sequential data—or standard feedforward neural networks to learn complex, potentially nonlinear patterns directly from large volumes of historical operational data. Input variables typically include measured voltage, current, and calculated SoC (
Figure 13).
When trained on sufficiently representative data, this approach offers high stability and robust performance across various operating conditions captured in the training set. Additionally, the inherent parallelism in many neural network computations can facilitate fast response times. Furthermore, these models excel at learning complex nonlinear relationships, enabling them to capture intricate temperature variations within the battery and support real-time temperature estimation.
However, this approach requires substantial amounts of high-quality, representative training data covering the expected range of operating conditions. The model’s performance is highly dependent on the quality and diversity of the dataset. Training complex deep-learning models also demands significant computational resources, and the model’s performance may degrade when applied to environments different from those represented in the training dataset.
In essence, data-driven methods can effectively model the dynamic thermal behavior of batteries and offer powerful real-time estimation capabilities. Nevertheless, their reliance on large, high-quality datasets and potentially demanding computational requirements necessitates careful consideration of computational efficiency for real-time applications.
4.2. Key Limitations of Data-Driven Temperature Estimation Methods
Although data-driven temperature estimation methods can achieve high accuracy using typical inputs, such as SoC, voltage, and current, they face certain limitations. Relying solely on these standard electrical parameters might not fully capture the complex thermal behavior of batteries under all situations, owing to the restricted scope of input variables. Additionally, as highlighted previously, their performance heavily depends on the quality, quantity, and diversity of the training dataset, potentially leading to reduced accuracy under novel or underrepresented operating conditions.
Furthermore, these methods often require significant computational resources, particularly for training complex deep-learning models, which can limit their applicability in resource-constrained real-time embedded systems commonly found in BMS applications. Lastly, they tend to have low adaptability to new operating environments, leading to reduced reliability under unexpected or untrained conditions.
5. Proposed AI-Based Sensorless Temperature Estimation Method
Temperature management of marine lithium-ion batteries is critical for ensuring both operational safety and optimal battery lifespan. To address this challenge, this study proposes an LSTM-based sensorless temperature estimation method for effective temperature estimation. LSTM networks, a type of RNNs, can learn both short- and long-term dependencies within time-series data. This characteristic makes them well suited for capturing the detailed patterns of battery-temperature variation under dynamic operating conditions.
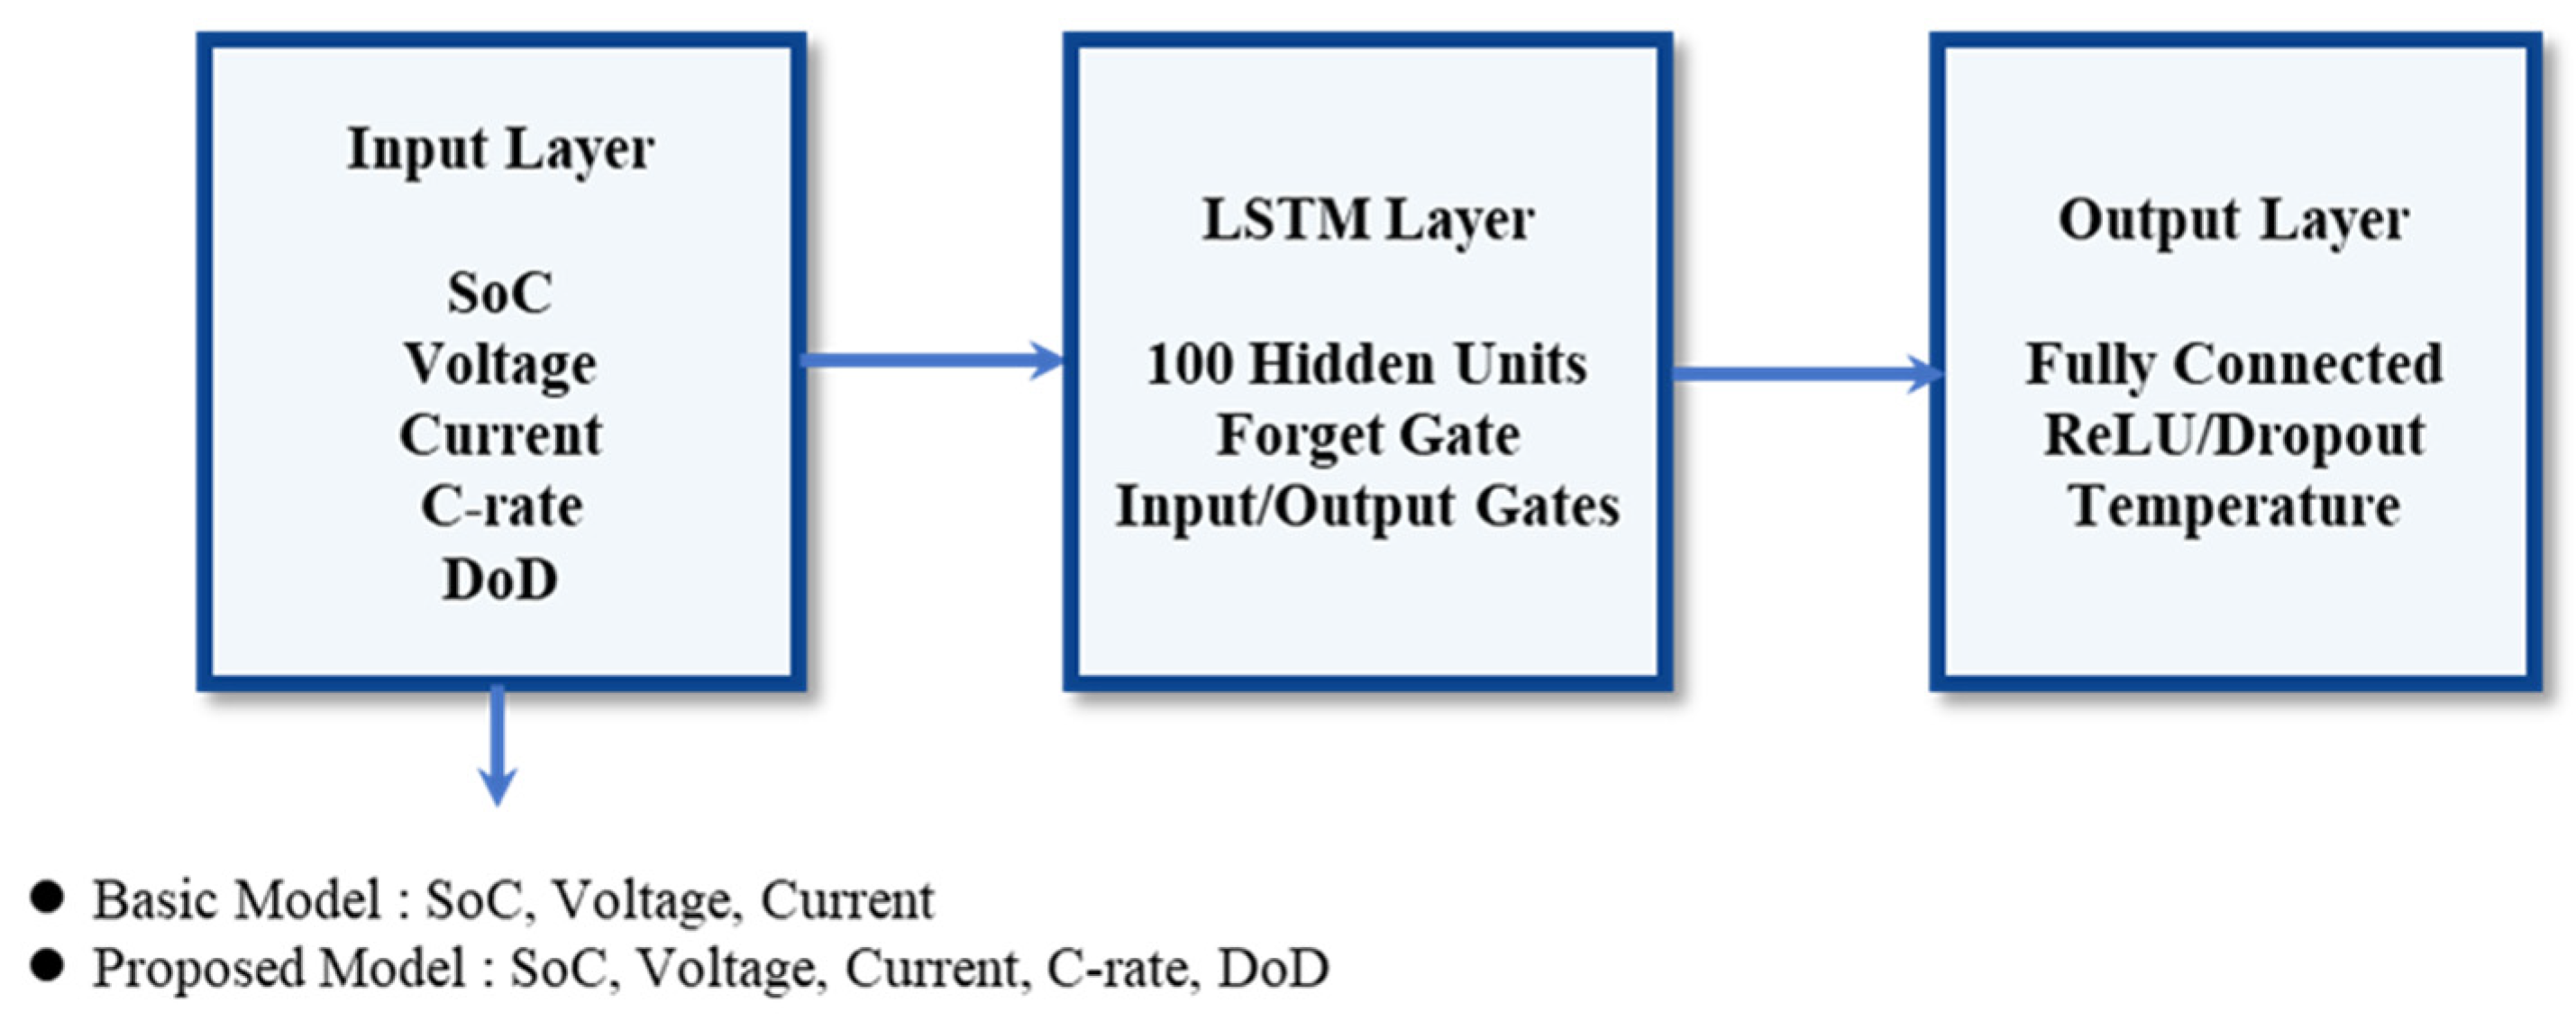
The proposed method incorporates not only conventional input variables, such as SoC, voltage, and current, but also includes C-rate and DoD. This expanded input set provides a more comprehensive reflection of factors affecting battery temperature. The model architecture comprises 100 LSTM units and incorporates the rectified linear unit (ReLU) activation function to estimate the final temperature. This approach is anticipated to deliver stable performance across diverse operating conditions, thereby enhancing overall battery safety and reliability.
5.1. Variable Selection and Data Preprocessing
This study aimed to differentiate itself from existing data-driven temperature estimation methods by introducing additional relevant parameters to develop a more accurate temperature estimation model. To achieve this, variables such as C-rate and DoD were included alongside standard inputs to enhance the scope of the input data. This allowed for a more precise analysis of the battery’s thermal behavior and its relationship with operational parameters influencing degradation rates.
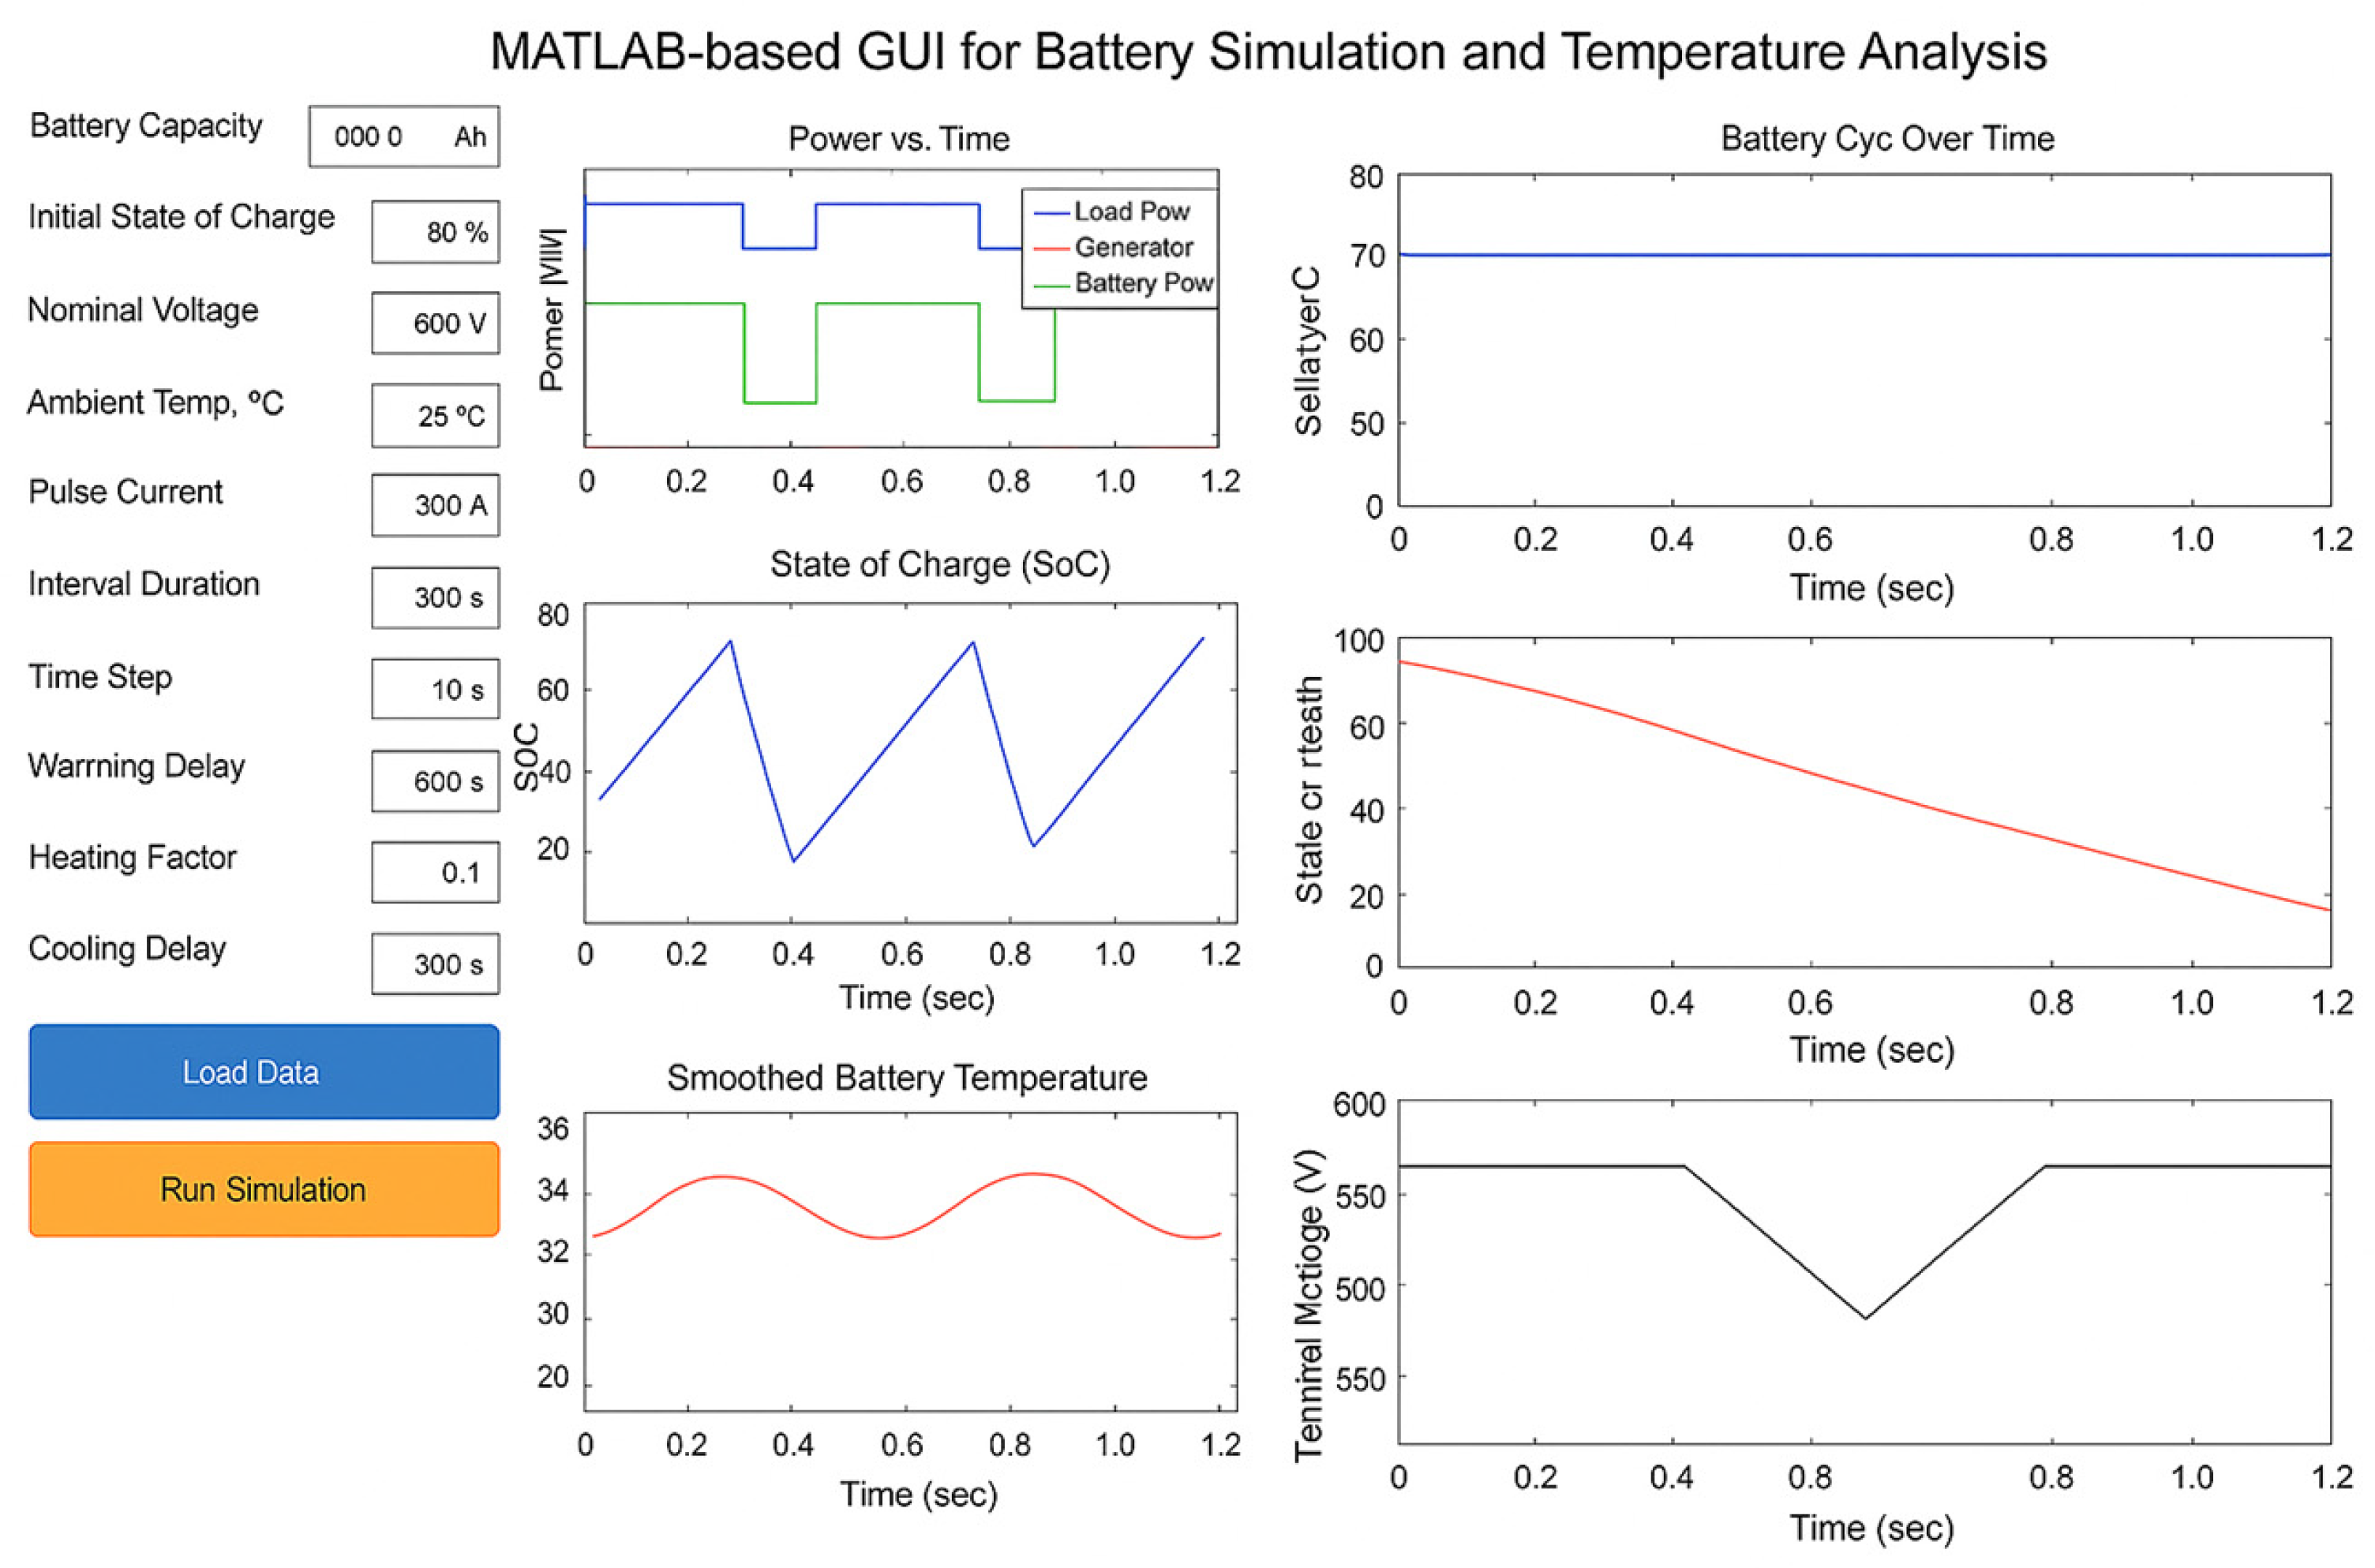
To validate the proposed algorithm, key parameters were extracted from an existing shipboard battery system, and simulations were conducted under various operational scenarios. A MATLAB-based graphical user interface (GUI) was developed (
Figure 14) to facilitate user-friendly input of essential battery characteristics, including capacity, voltage range, internal resistance, and initial SoC. The program provides visual outputs for major indicators, such as SoC, state of health, temperature, voltage behavior, and degradation trends, thereby improving the intuitiveness and accessibility of battery behavior analysis for users.
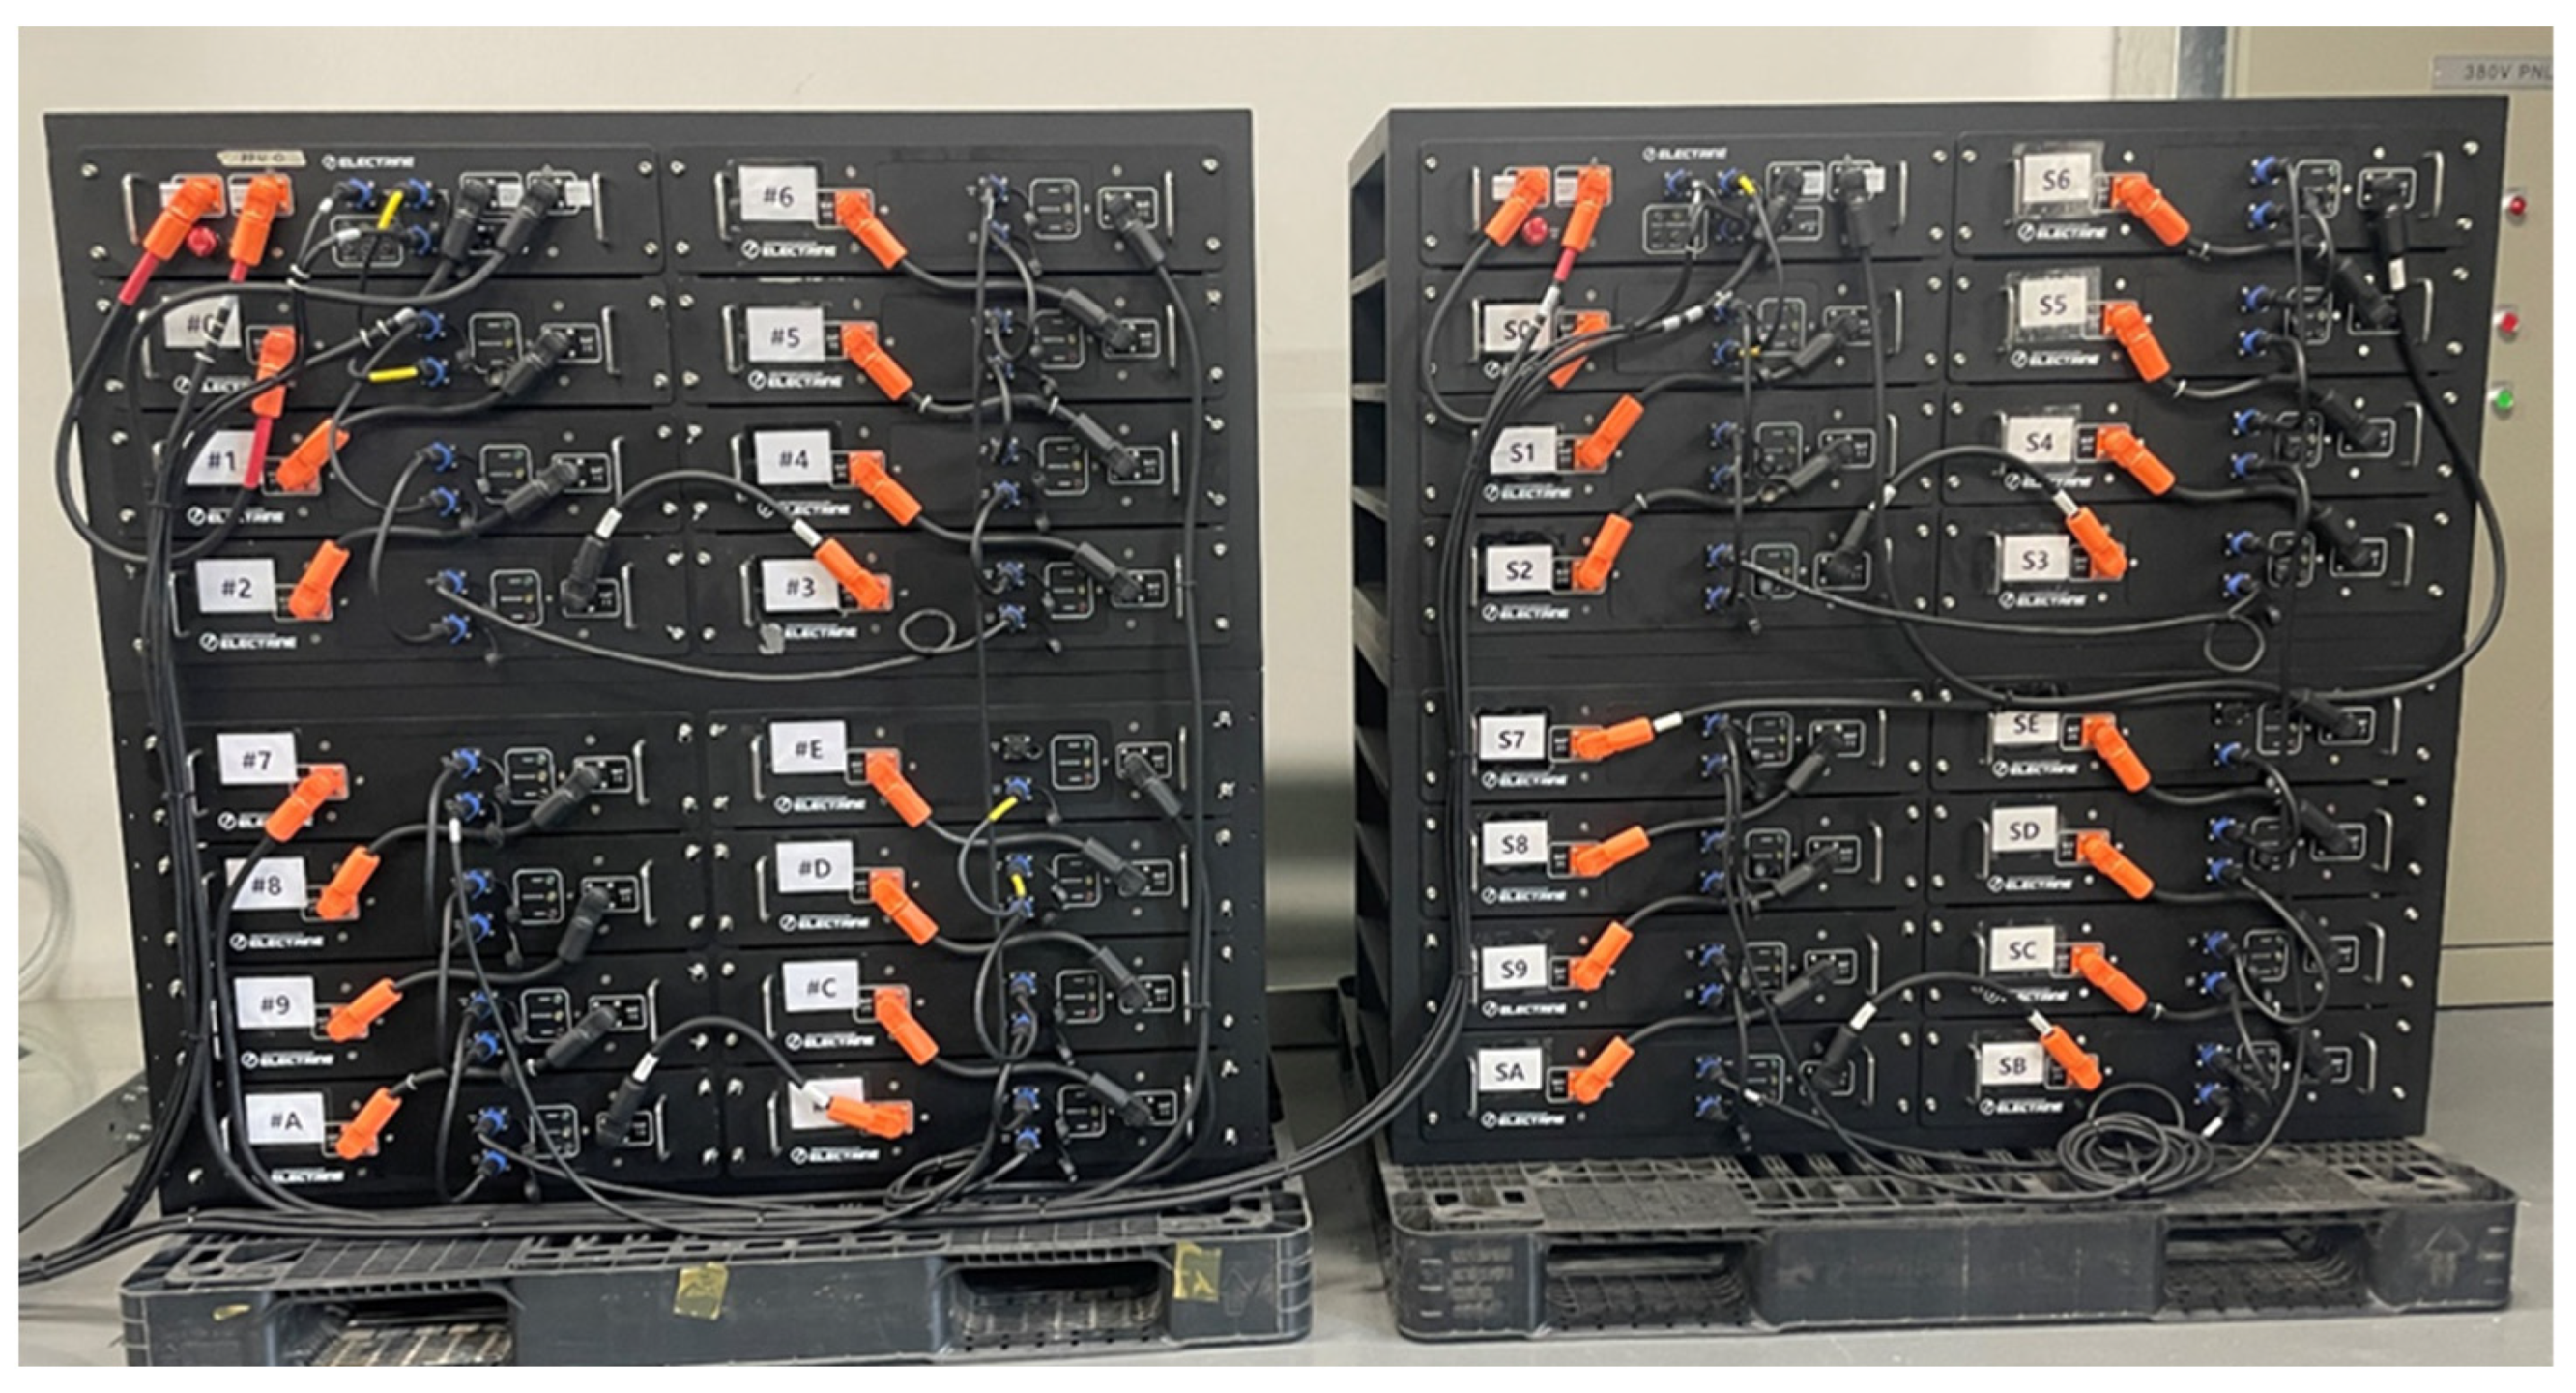
Furthermore, the real-world shipboard battery system used for parameter extraction and subsequent model validation is depicted in
Figure 15. This setup, comprising multiple lithium-ion battery modules connected in series and parallel configurations, was used to ensure that the simulations and the developed algorithm accurately reflected operational conditions within marine environments.
In particular, this research aimed to compare and analyze various factors affecting battery-temperature estimation and evaluate the impact of parameters (C-rate and DoD) not addressed in previous research on thermal management performance. Through comprehensive data analysis and validation against conditions representative of real-world operation, the objective was to improve the accuracy of battery-temperature estimation and establish a foundation for maximizing the safety and efficiency of marine battery systems in future applications.
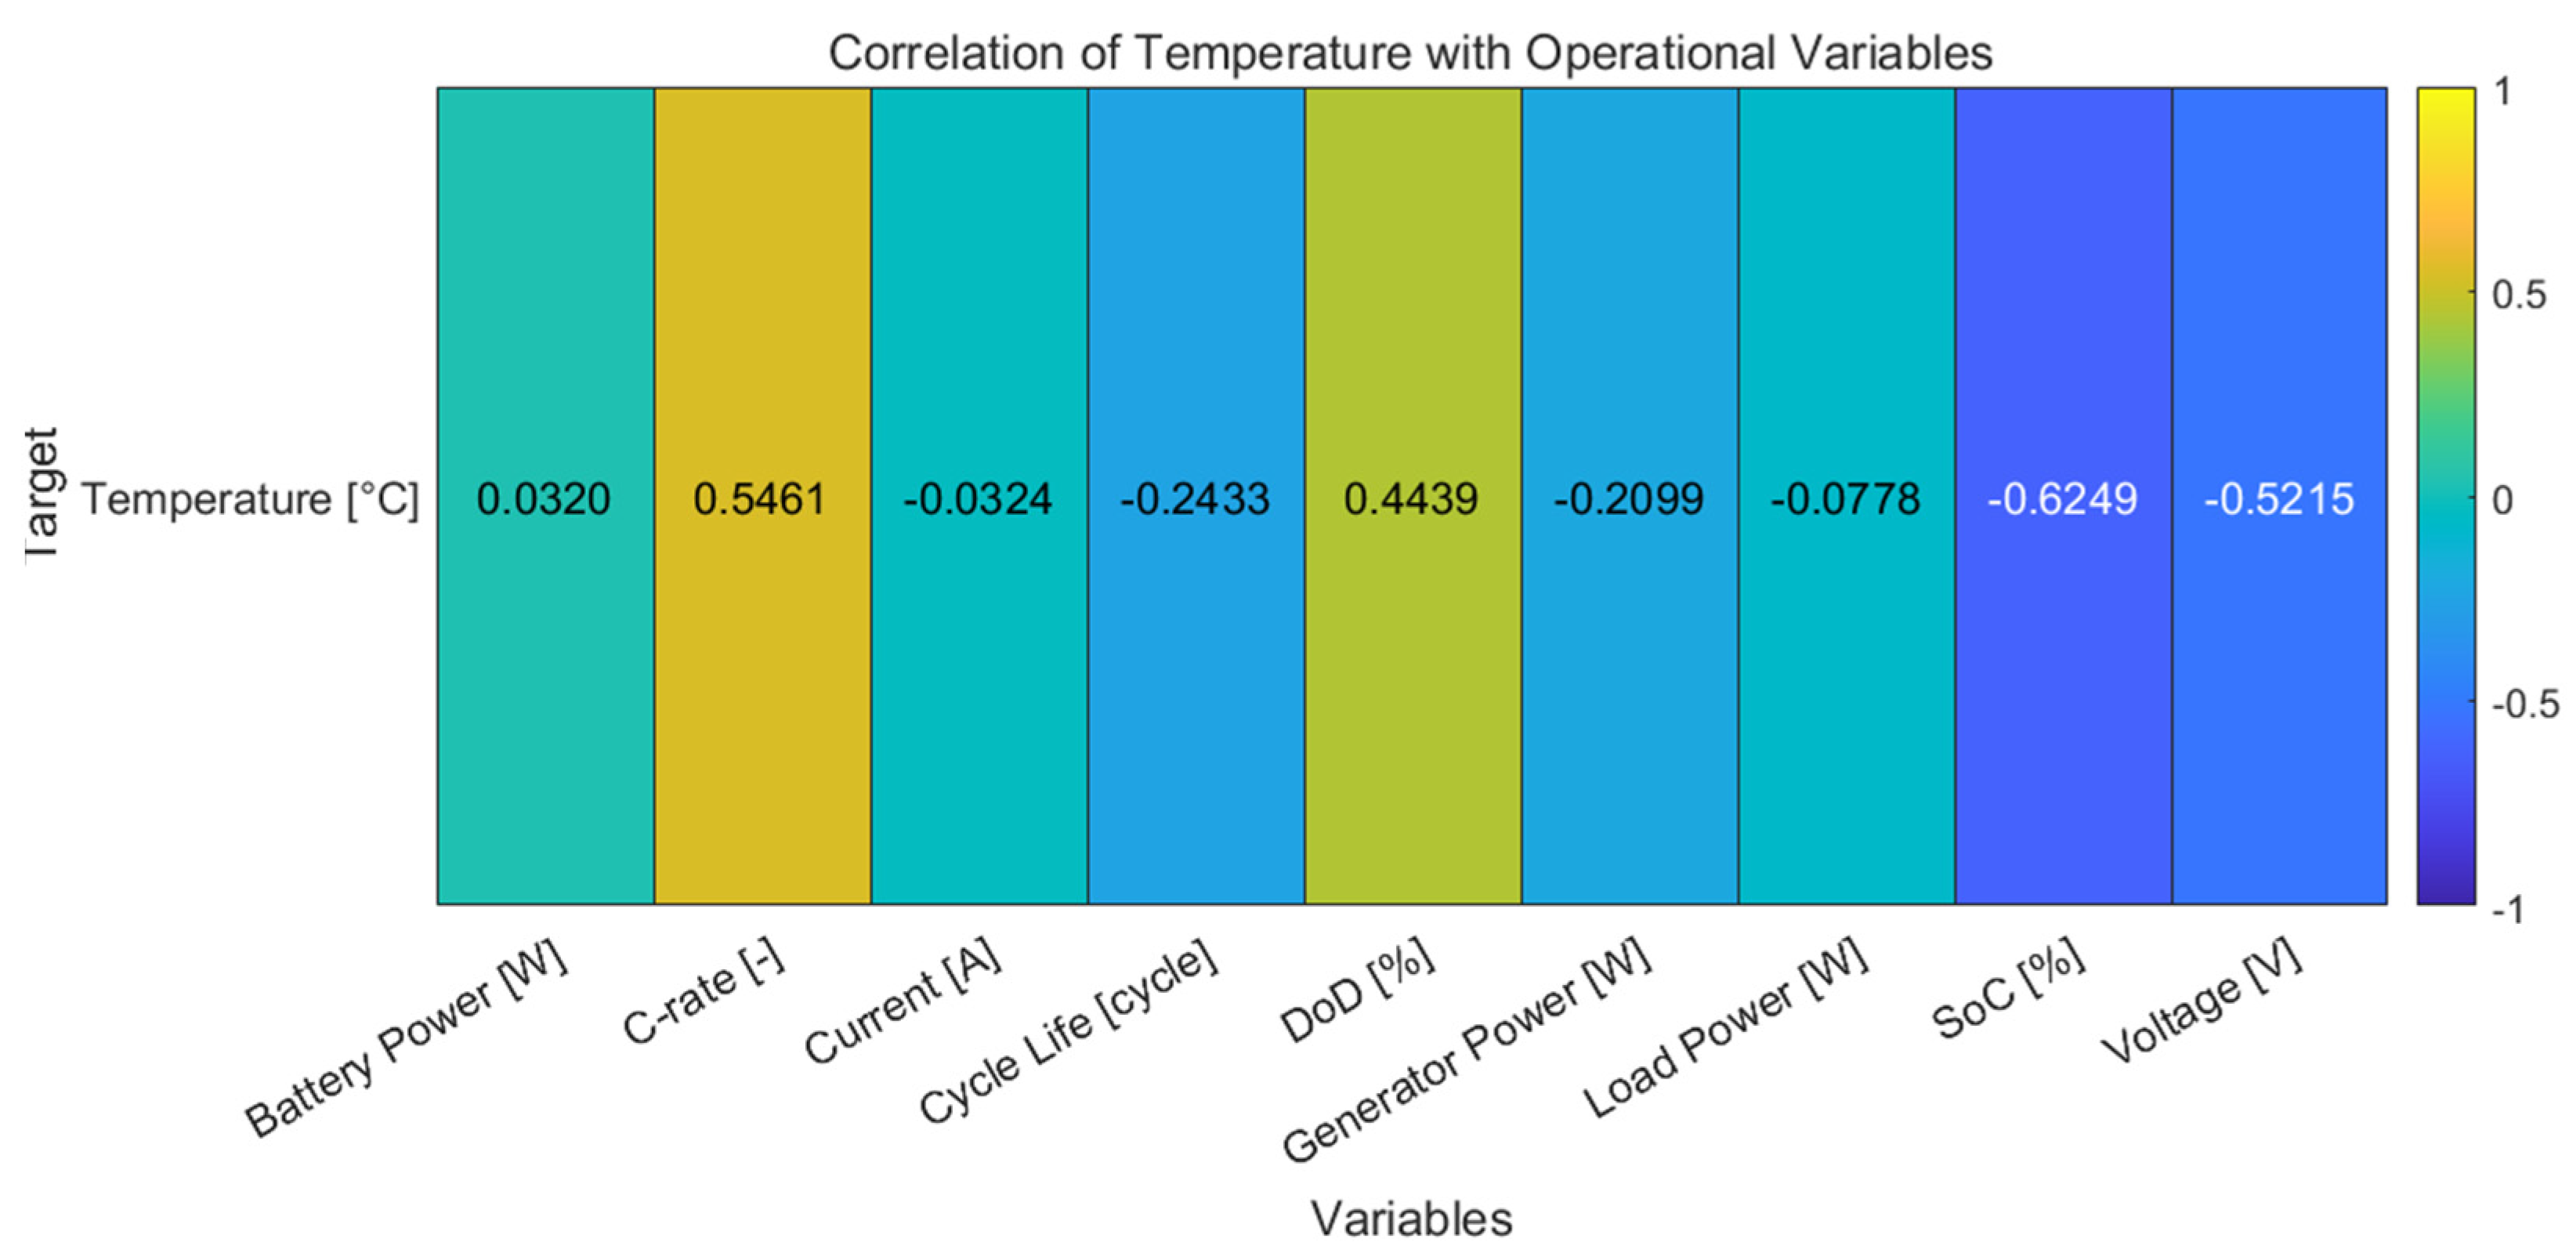
Figure 16 presents a heatmap illustrating the correlation between battery temperature and the selected key variables, generated using MATLAB. In this analysis, various parameters potentially affecting battery temperature were considered, and their relationships with temperature were quantitatively evaluated using correlation coefficients. A correlation coefficient close to +1 indicates a strong positive linear correlation, while a value close to –1 signifies a strong negative linear correlation. Values near 0 suggest a weak or no linear correlation.
According to the heatmap analysis for the specific dataset used, the SoC exhibited the strongest inverse relationship with temperature (correlation coefficient of –0.6249). This indicates that higher SoC levels tended to correlate with lower battery temperatures under the observed operating conditions. By contrast, the C-rate showed a strong positive correlation (0.5461), reflecting that higher C-rates generally increased internal heat generation. Finally, voltage displayed a negative correlation (–0.5215) with temperature, whereas the DoD had a positive correlation (0.4439).
These findings suggest that within this dataset, as SoC and voltage increased, battery temperature tended to decrease, whereas increases in C-rate and DoD were associated with higher temperatures. This insight serves as a valuable reference point for developing battery-temperature management strategies and validating the model’s inputs. Based on this correlation analysis, the temperature estimation model utilizing these variables was developed with the goal of establishing a more accurate temperature estimation method.
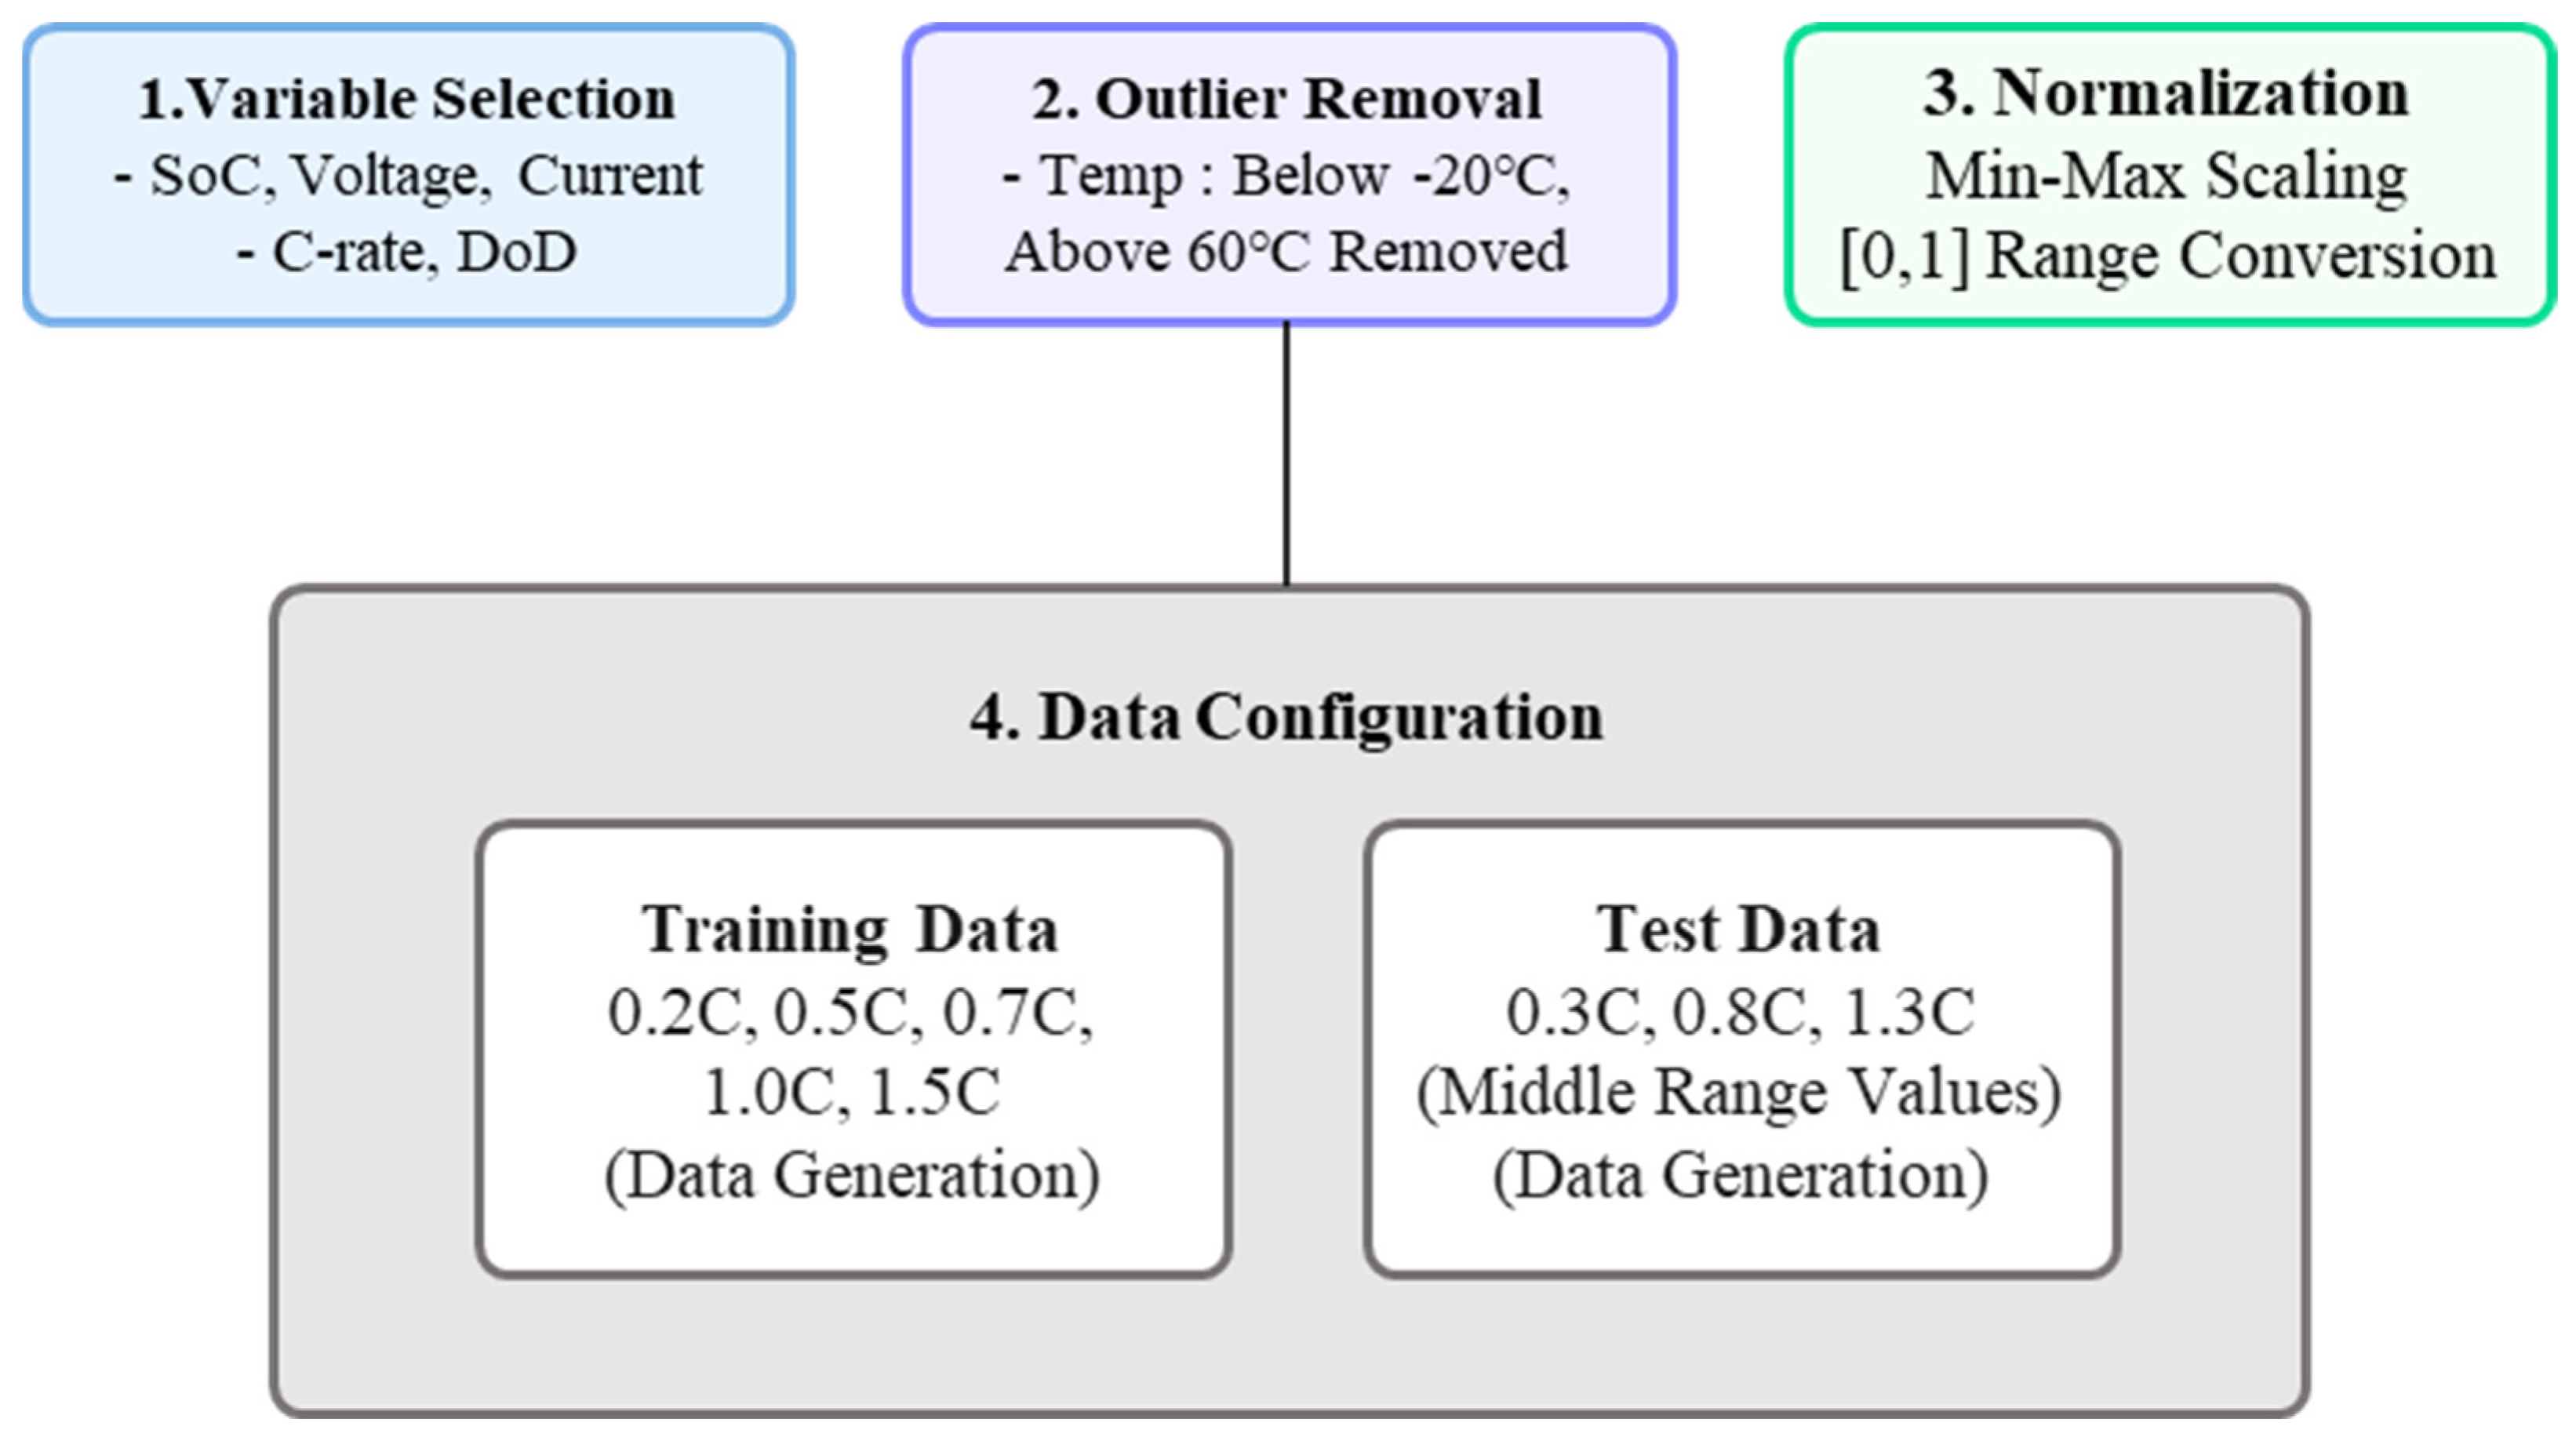
The data preprocessing pipeline involved three primary stages: outlier removal, data normalization, and the construction of distinct training and testing datasets.
Figure 17 visually summarizes this preprocessing workflow, outlining the steps from initial variable selection through outlier handling, normalization, and the final dataset partitioning.
5.2. Mathematical Modeling and LSTM Network Architecture
In this study, a long short-term memory (LSTM) neural network was utilized to estimate the internal temperature of lithium-ion batteries based on multivariate input features. The LSTM, an advanced form of the recurrent neural network (RNN), was specifically designed to effectively learn temporal dependencies and long-range correlations within time-series data.
5.2.1. Definition of Input Variables
The model input at each time step ttt consists of the following electrochemical features:
: current at time t (A),
: voltage at time t (V),
: state of charge, normalized between 0 and 1,
: ratio of actual current to the nominal current, reflecting load conditions,
: depth of discharge, representing the ratio of discharged energy relative to the previous charge,
: timestamp in seconds.
These variables are directly associated with the heat generation and accumulation characteristics of the battery under real-world operating conditions. Among them, the C-rate indicates transient current loading, where higher C-rates often result in increased thermal stress. The DoD represents the extent of energy depletion, which is closely related to aging mechanisms and helps quantitatively describe thermal behavior.
The model predicts the battery’s internal temperature at the next time step, t + 1t + 1t + 1, using past sequences of input vectors, formulated as [
32]:
where
k denotes the sequence length (e.g., 10–30 time steps), and
is the function represented by the LSTM network.
5.2.2. LSTM Network Architecture
The internal structure of the LSTM cell comprises the following gated operations [
33]:
σ is the sigmoid activation function,
tanh is the hyperbolic tangent function,
denotes the elementwise (Hadamard) product,
are the weight matrices for the respective gates,
are the corresponding bias vectors,
is the hidden state at time t,
is the cell state at time t.
The final hidden state, , is passed through a fully connected (FC) layer to yield the predicted temperature output. This architecture enables the network to learn both short-term dynamics and long-term dependencies critical for accurate thermal behavior prediction.
5.2.3. Model Training and Loss Function
The model was trained using the mean squared error (MSE) loss function to minimize the discrepancy between the predicted temperature
and the actual measured temperature
. The MSE is defined as [
34,
35]:
where
N is the number of data samples. By minimizing this objective function, the model parameters were optimized to enhance predictive accuracy across various operational scenarios.
5.3. LSTM-Based Temperature Estimation Algorithm
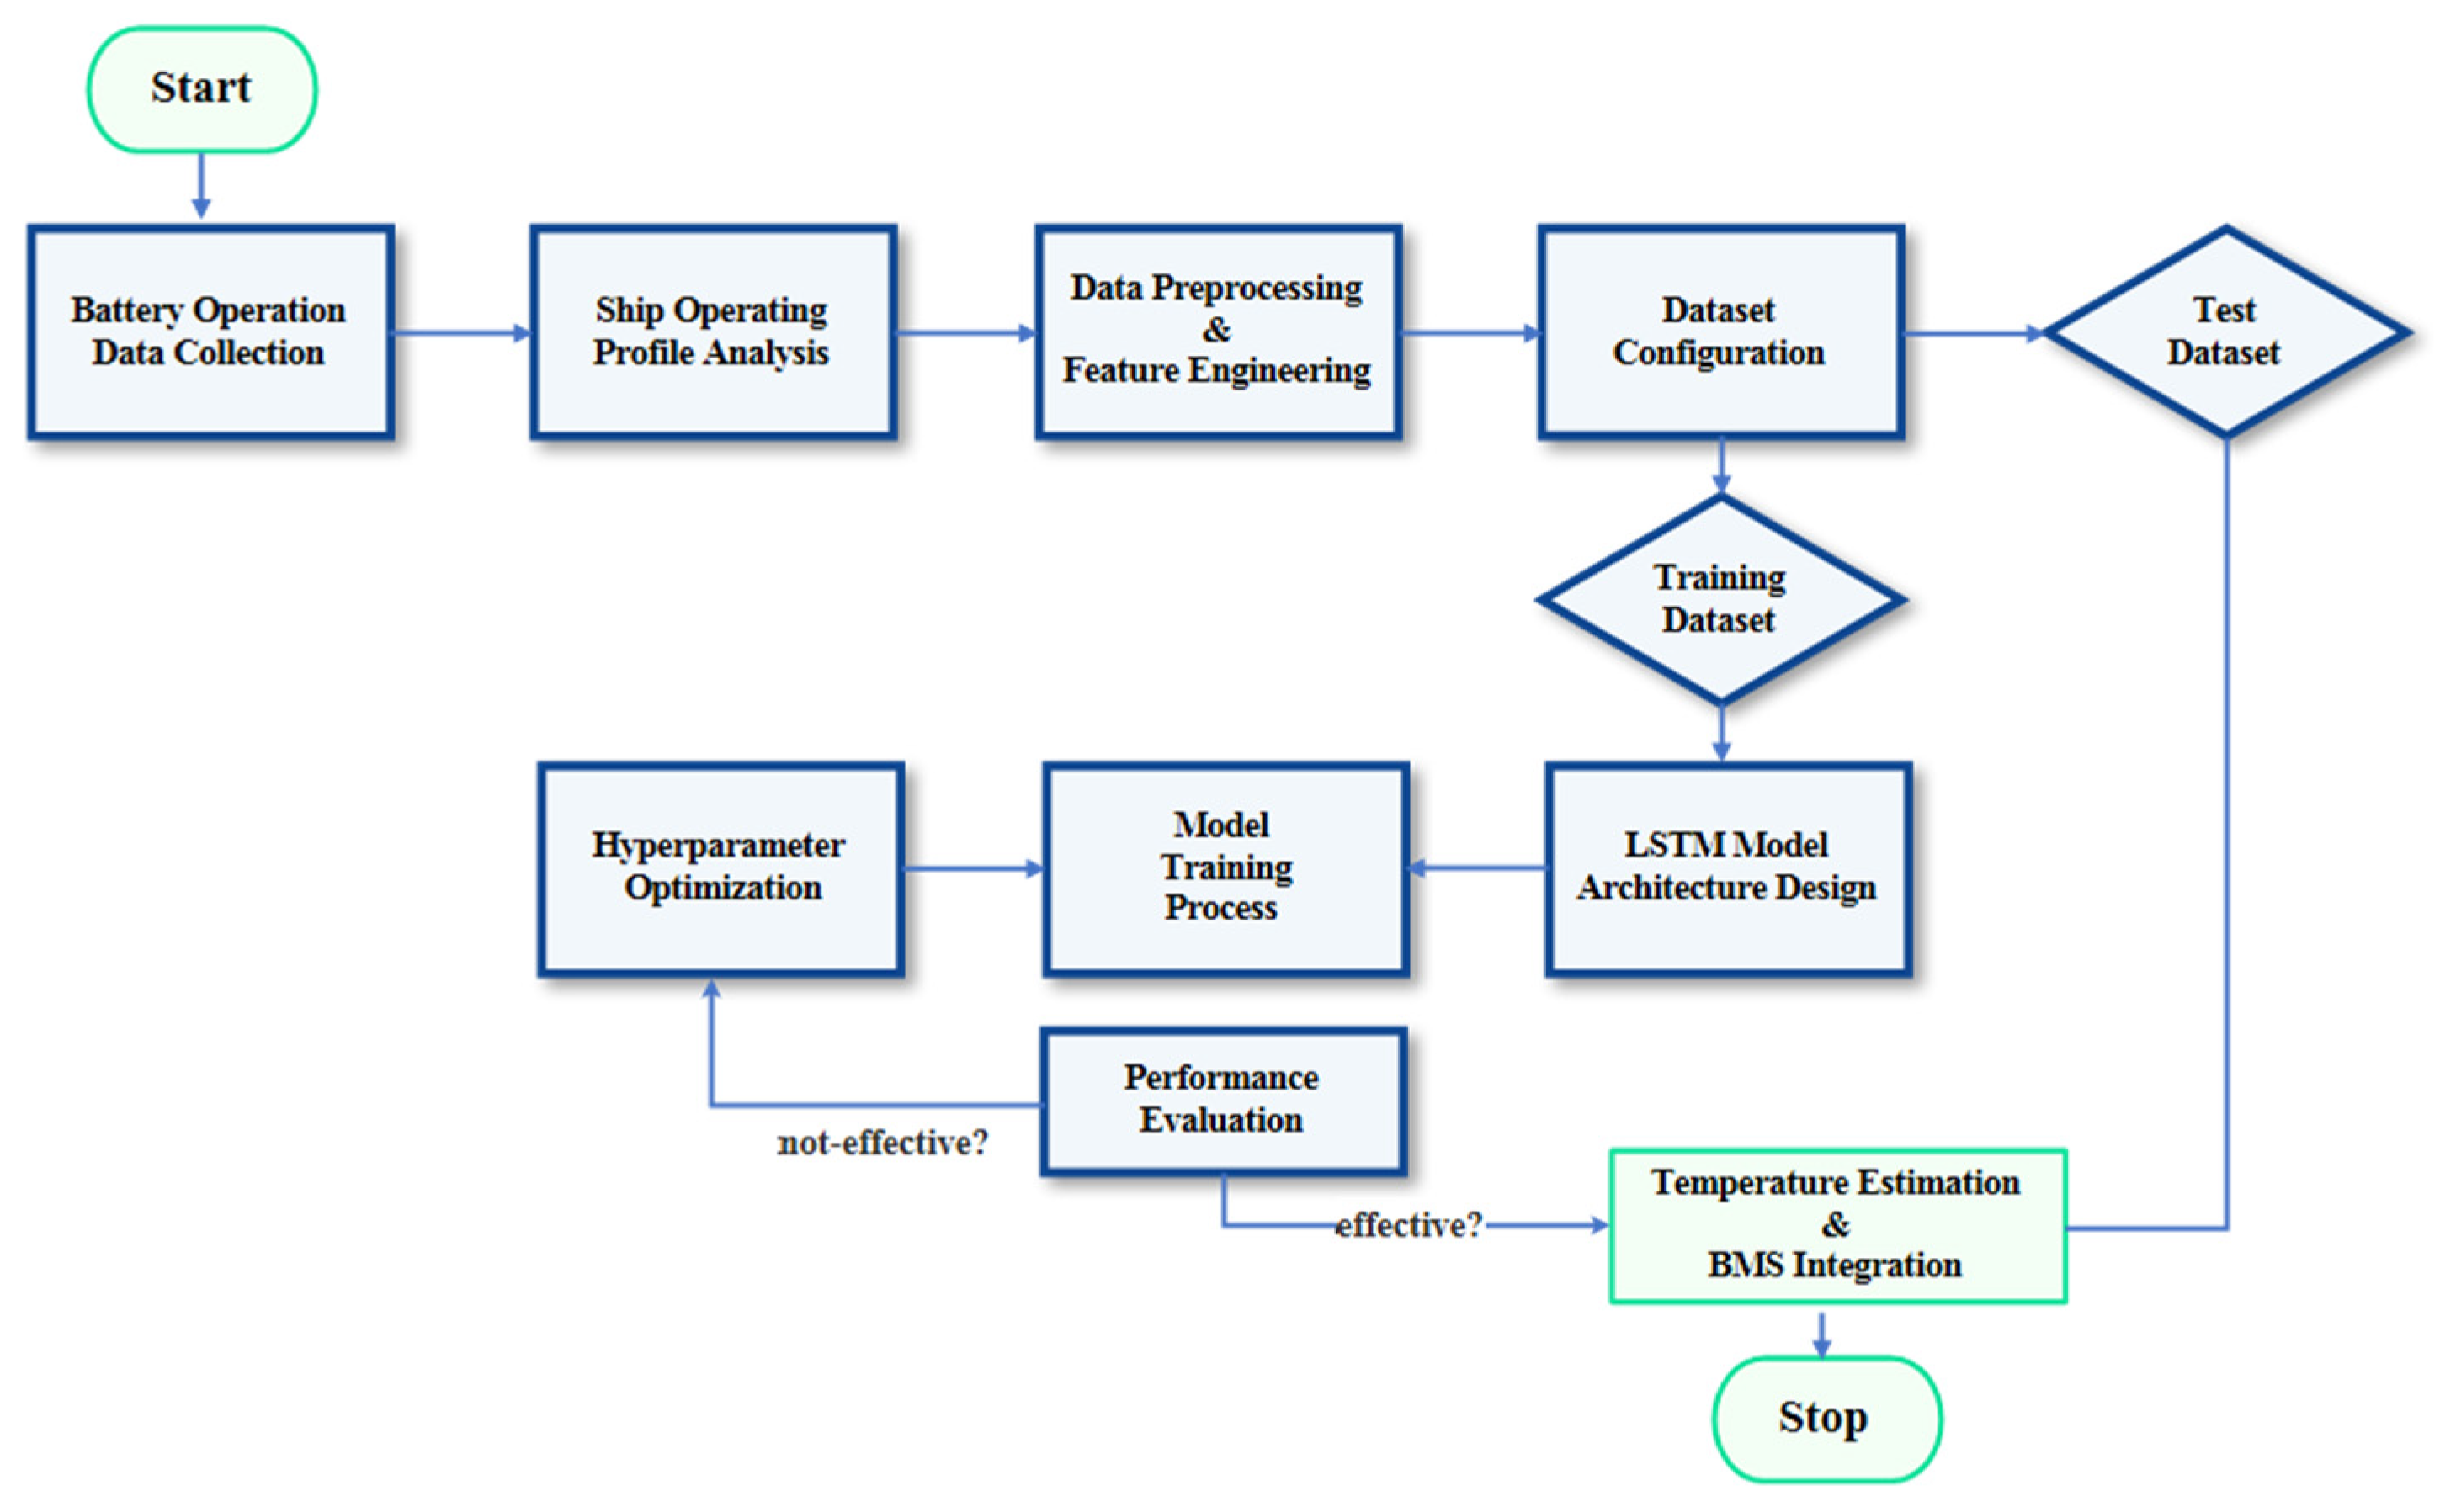
The proposed LSTM-based sensorless temperature estimation method followed a structured process: data preparation, model development, performance evaluation, and system integration. Initially, relevant battery operational data and corresponding ship navigation profiles were analyzed to generate appropriate training and testing datasets. These datasets then underwent normalization and feature engineering to transform the raw data into a format suitable for effective model training.
Subsequently, the LSTM model architecture was designed and trained using the prepared dataset, and its performance was rigorously validated using standard evaluation metrics, such as RMSE and MAE. Based on the validation results, model hyperparameters were fine-tuned, as required, to optimize model performance. Finally, the optimized model was applied to estimate battery temperature in deployment and integrated with a BMS to support thermal management decisions under real-world conditions.
Distinct from some conventional models, the proposed approach incorporated C-rate and DoD as additional input variables. This allowed for a potentially more precise representation of the dynamic thermal characteristics of the battery system (
Figure 18).
The proposed LSTM-based sensorless temperature estimation model was specifically designed to accurately reflect the dynamic thermal characteristics of a battery. Unlike conventional models that consider only SoC, voltage, and current, the proposed model incorporated C-rate and DoD as additional inputs, aiming for more accurate temperature estimation compared to models using fewer inputs.
The model architecture comprised a hidden layer containing 100 LSTM units, followed by auxiliary layers, including a fully connected layer for feature extraction, ReLU activation layer, dropout layer (to mitigate overfitting), and finally, a regression layer that outputs the estimated temperature. Notably, the “forget gate” mechanism within the LSTM units enabled the model to selectively retain or discard information from previous time steps, enhancing its ability to learn long-term dependencies relevant to temperature estimation, thereby improving learning efficiency and estimation accuracy.
Figure 19 visually contrasts the structure of a conventional model with that of the proposed extended model, highlighting how the inclusion of additional input variables (C-rate and DoD) and the specific architectural improvements contributed to enhanced temperature estimations.
5.4. Training and Implementation
The LSTM model was developed and trained using MATLAB’s Deep Learning Toolbox. To thoroughly evaluate its generalization performance, distinct training and testing datasets were carefully constructed using data collected under various C-rate conditions. The training set included data corresponding to C-rates of 0.2 C, 0.5 C, 0.7 C, 1.0 C, and 1.5 C, whereas the test set included data from different C-rates (0.3 C, 0.8 C, and 1.3 C), ensuring no overlap in the specific C-rate conditions between the two sets.
The primary settings employed for model training are summarized in
Table 2. Techniques such as random shuffling of training data batches and the application of dropout were employed during training to prevent overfitting. The model’s performance was quantitatively evaluated using RMSE and MAE metrics, calculated on the independent testing dataset.
The accompanying MATLAB code illustrates the implementation of the LSTM architecture using the selected input variables (SoC, voltage, current, C-rate, and DoD). It also includes the script executing the model training process based on the defined training options specified in
Table 2.
6. Results and Discussion
Battery temperature was estimated using the developed LSTM models (baseline and proposed), and their performance was quantitatively evaluated on the unseen test set. The results are presented in
Table 3.
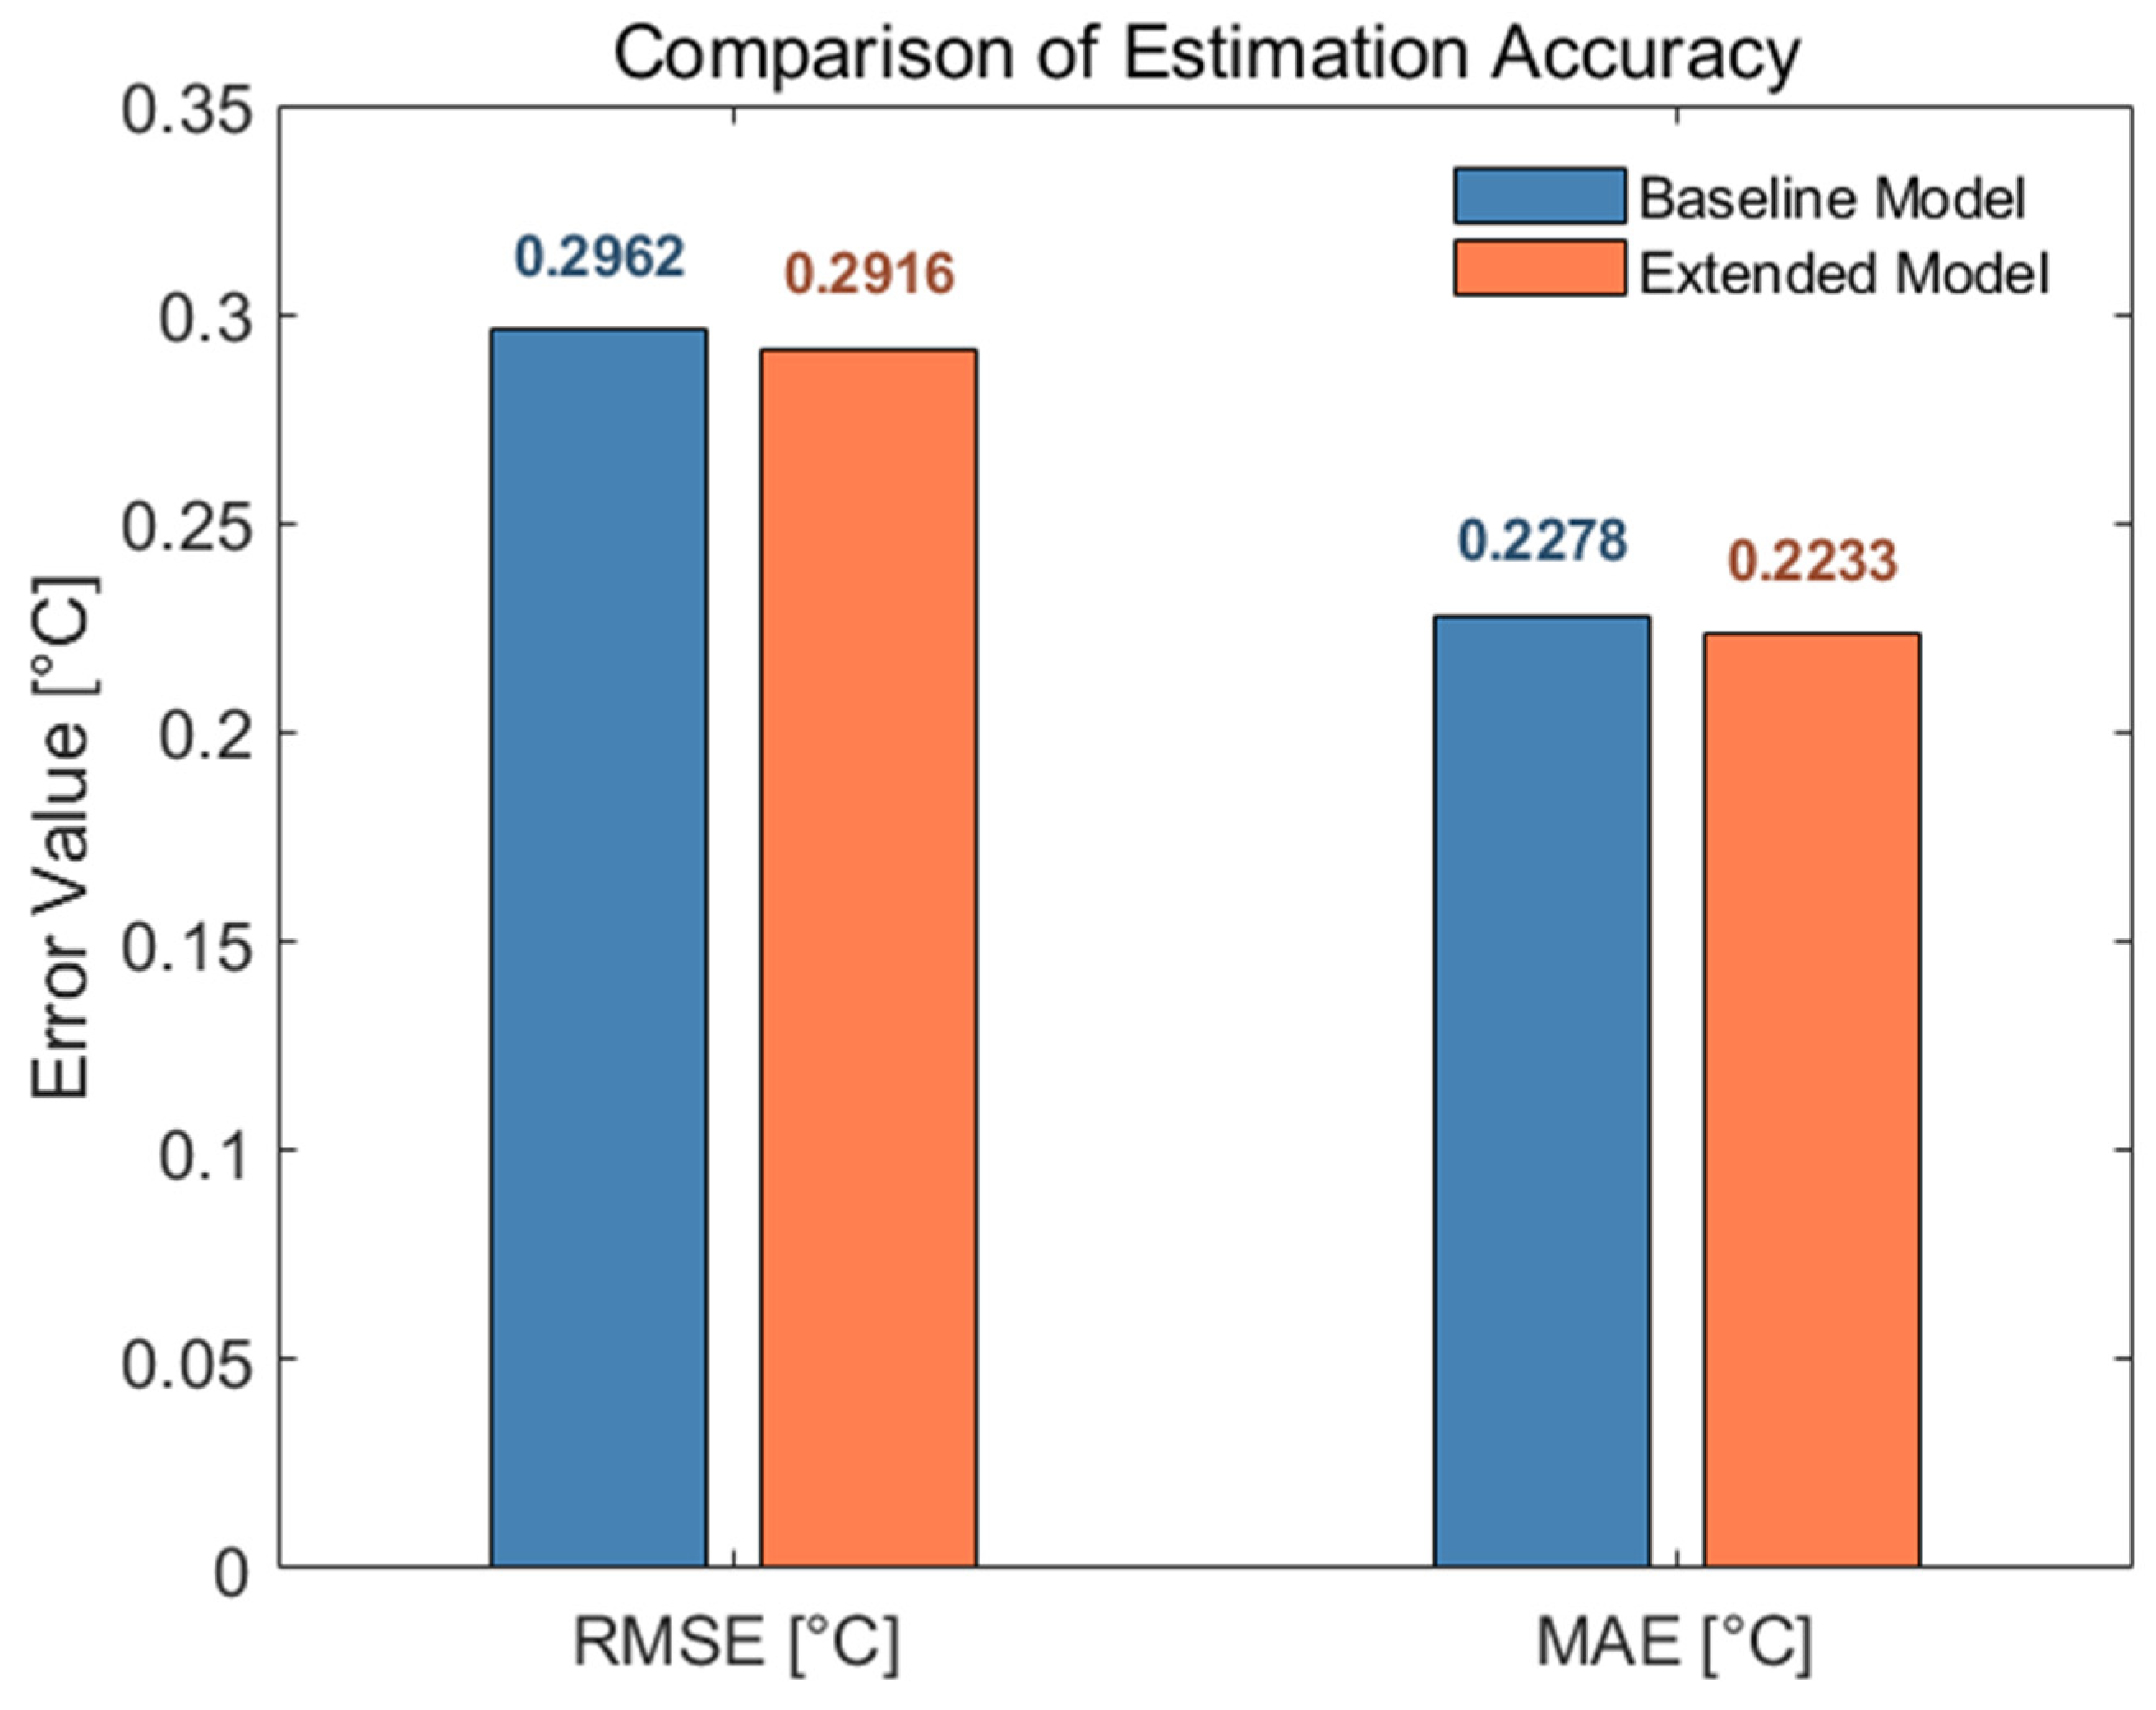
The extended model demonstrated superior battery-temperature estimation performance compared to the baseline model. Specifically, the RMSE decreased by approximately 1.5%, indicating an overall enhancement in estimation accuracy. Similarly, the MAE decreased by about 2.0%, suggesting that the extended model could estimate the actual temperature values more precisely. These quantitative results indicate that the extended model provided more reliable battery-temperature estimations than the baseline model using fewer inputs.
This performance difference is visually illustrated in the bar chart presented in
Figure 20, which clearly demonstrates that the extended model achieved lower RMSE and MAE values than the baseline model, thereby offering superior estimation performance.
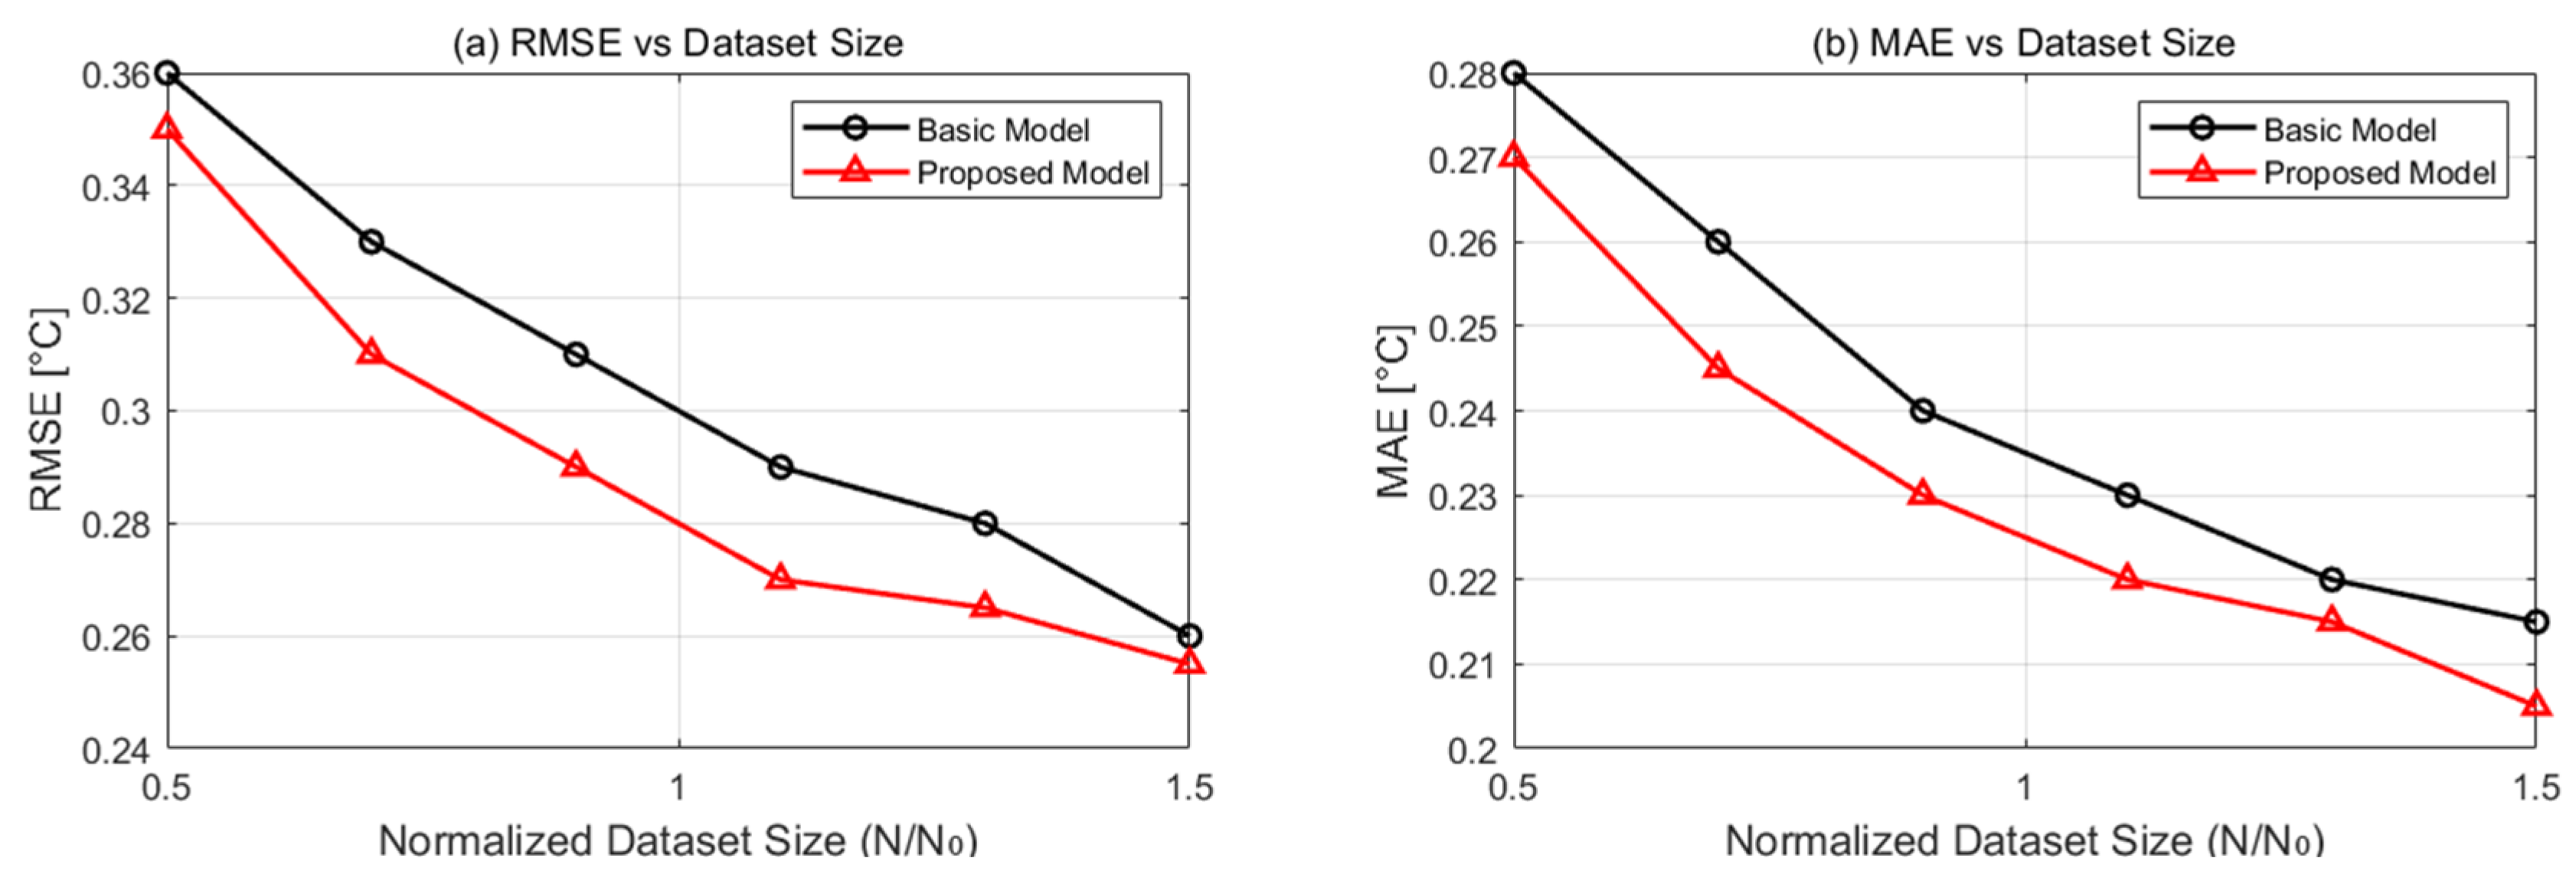
Figure 21 compares the estimation performances of the baseline and proposed models under varying amounts of training data. The dataset size was normalized relative to a reference size (N/N
0). Two performance metrics, RMSE and mean squared error (MSE), were used for this evaluation. As expected, with the increased dataset size, both models exhibited improved performance, indicated by the decreasing error values. However, the proposed model consistently achieved lower RMSE and MSE across all tested dataset scales. This advantage was particularly noticeable under limited data conditions (e.g., N/N
0 = 0.5 or 0.7), suggesting superior generalization capability and robustness of the proposed model. Thus, the proposed model was less sensitive to data scarcity and maintained reliable estimation accuracy even when the training dataset was relatively small.
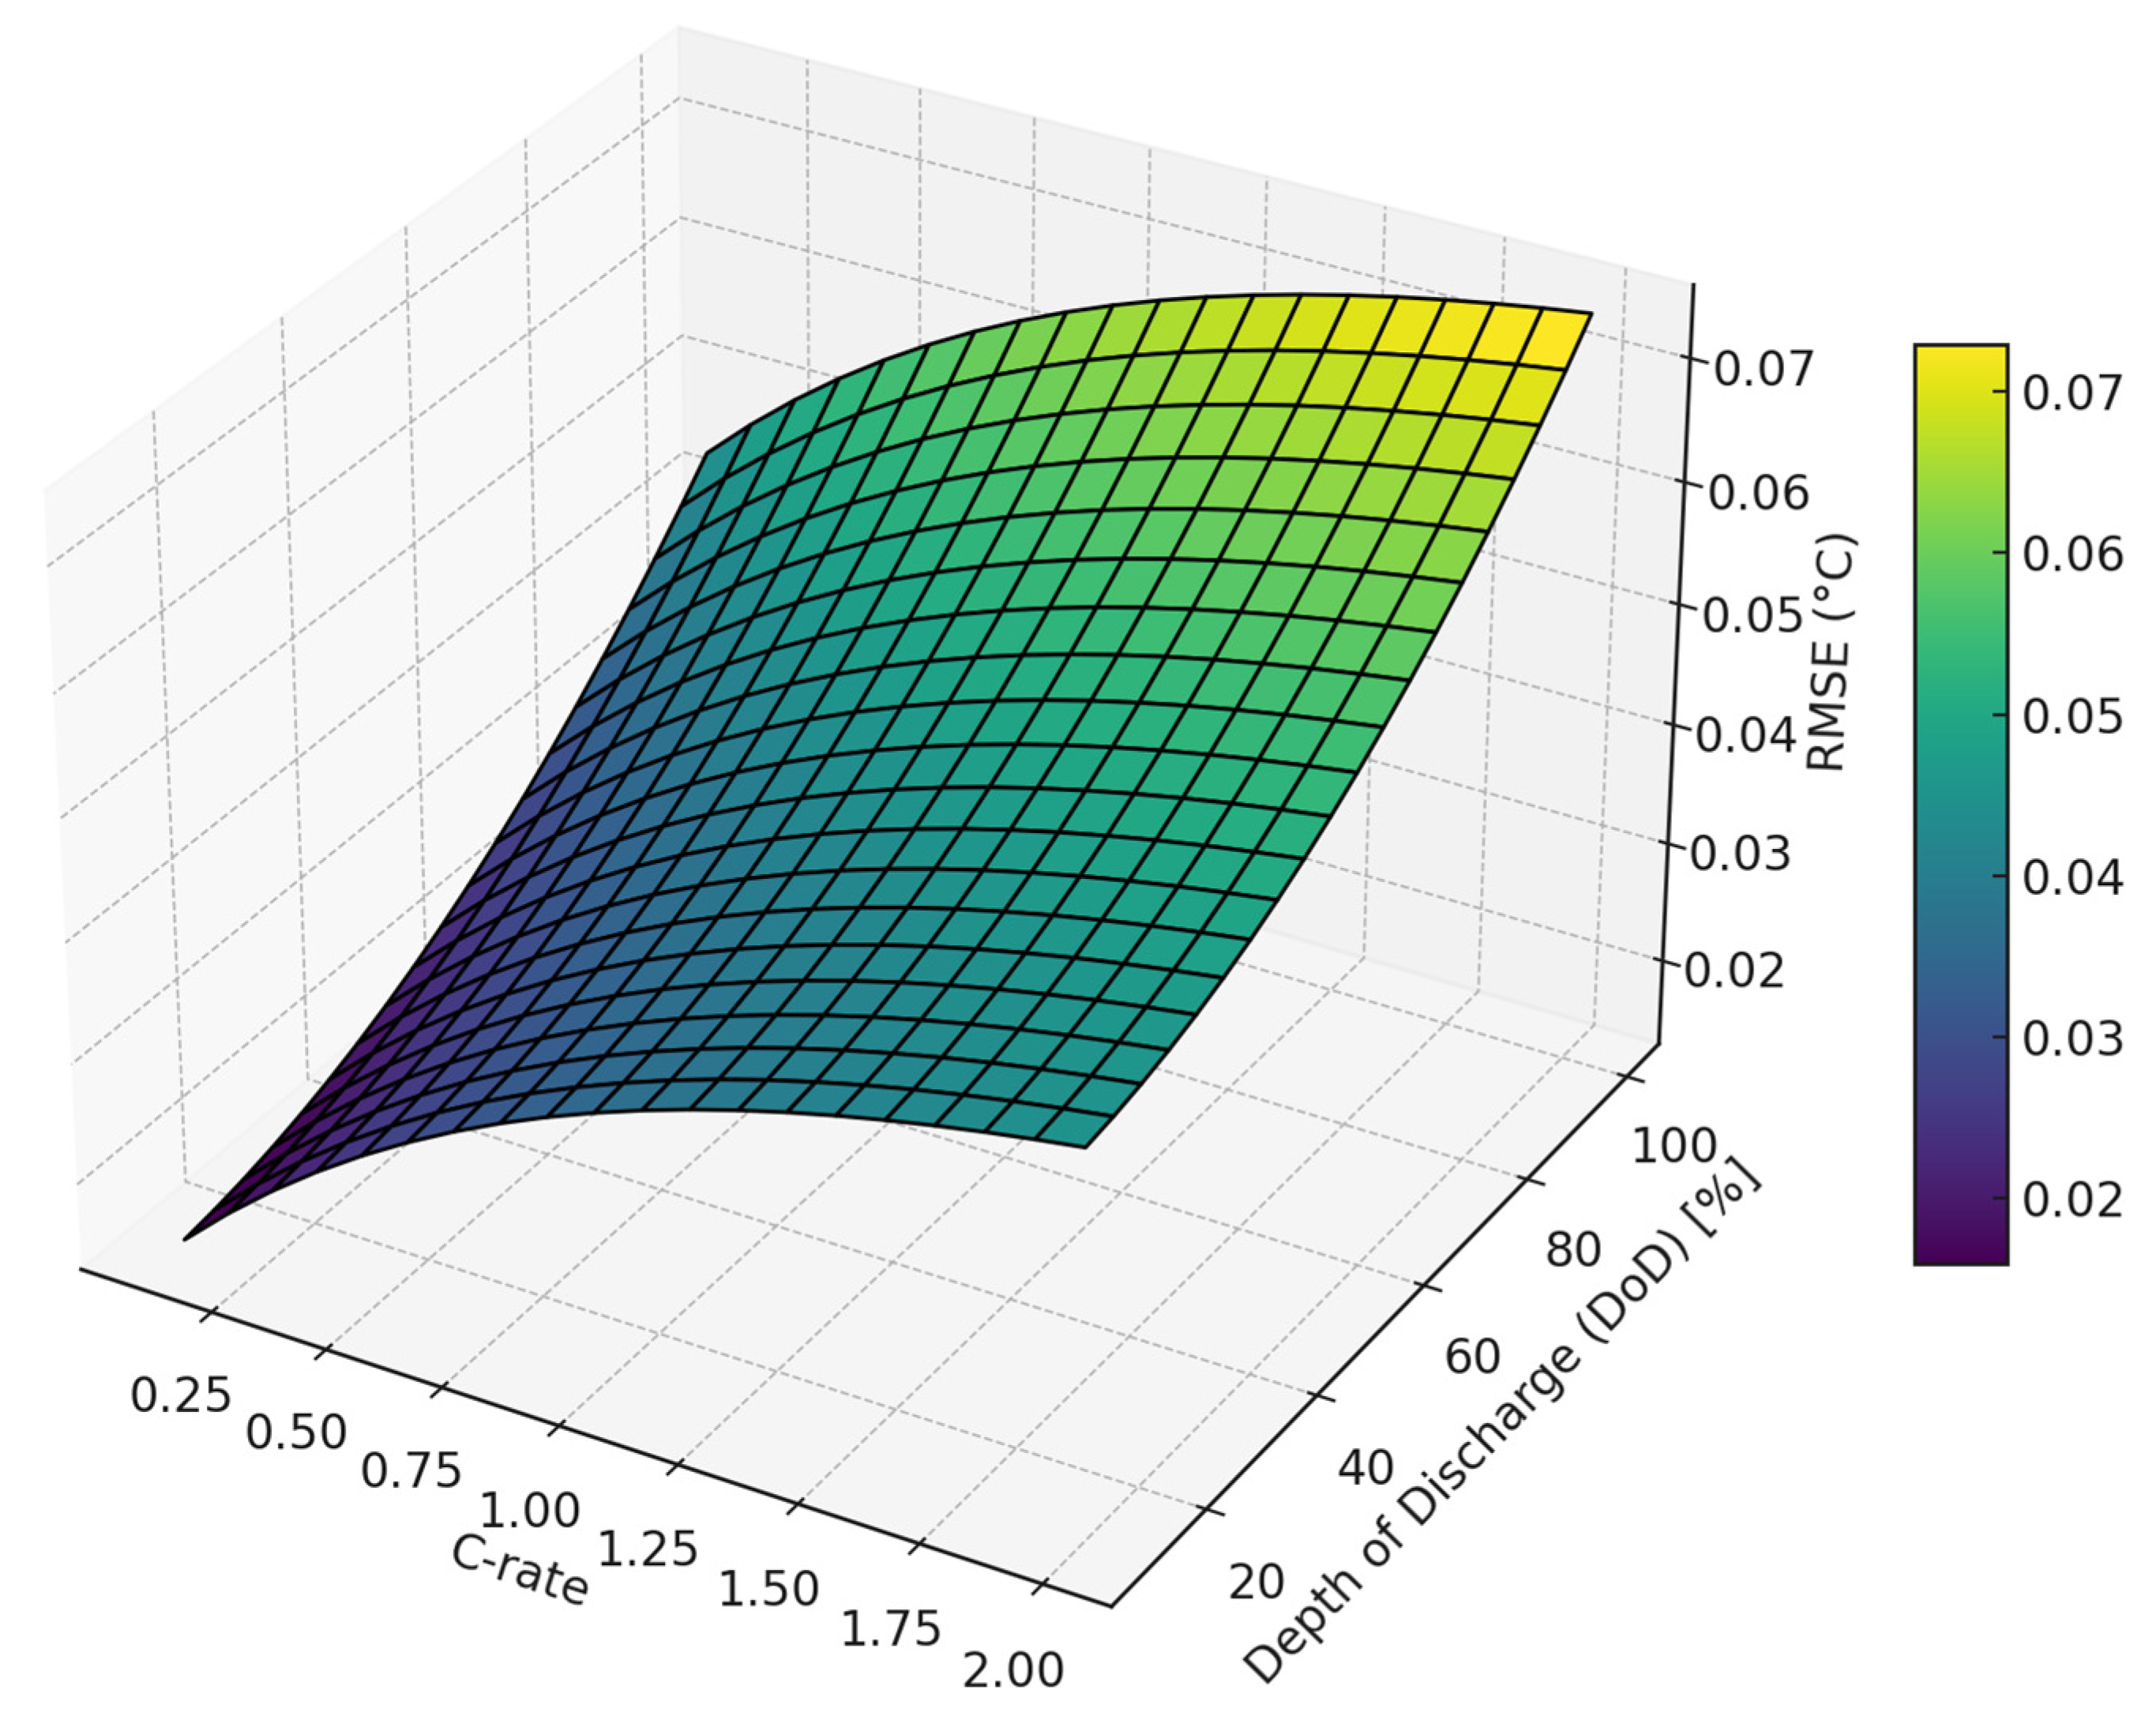
Figure 21 presents a three-dimensional visualization of how the root mean square error (RMSE) varied with changes in the C-rate and depth of discharge (DoD). As observed in the figure, the inclusion of these two variables as input features led to an overall reduction in RMSE, suggesting that they contributed positively to the accuracy of battery-temperature estimation [
36,
37]. Notably, the decrease in RMSE became more pronounced under high C-rate and deep discharge conditions, indicating that thermal response nonlinearity was particularly significant in such regimes [
38]. These results experimentally support the notion that C-rate and DoD are not merely derived input features, but rather physically meaningful variables that can quantitatively characterize the thermal behavior of lithium-ion batteries.
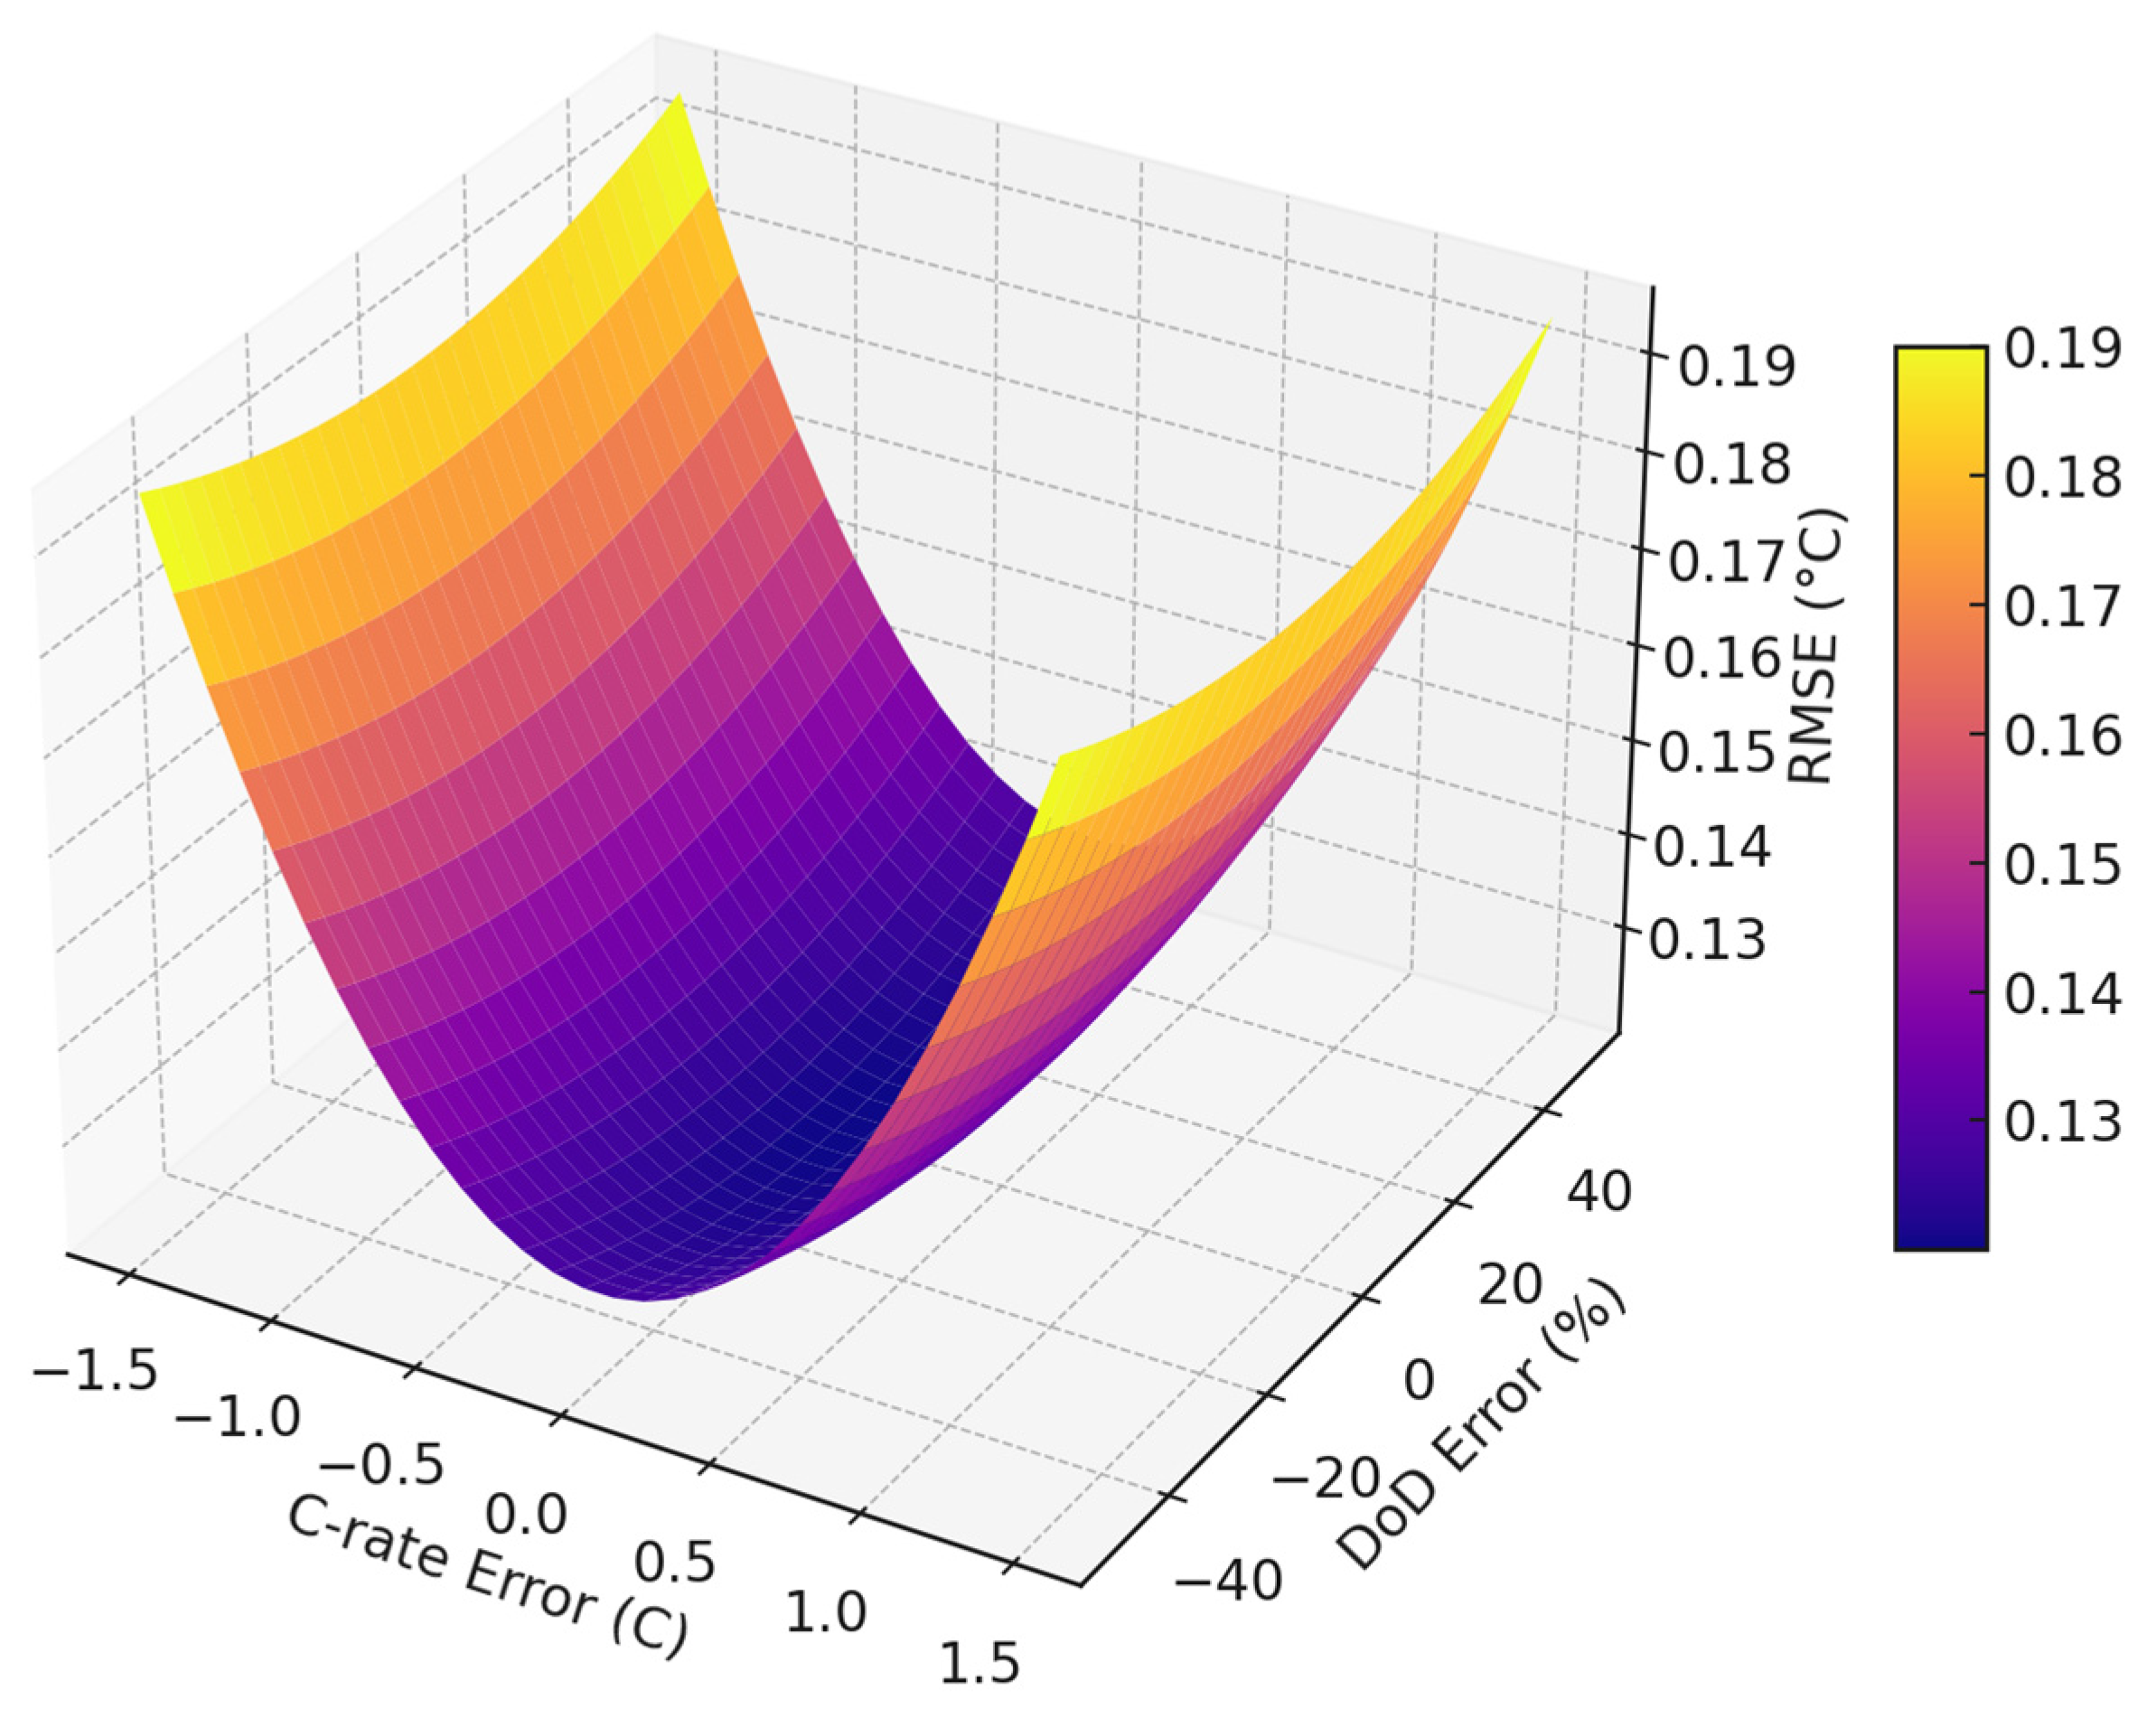
In this study, C-rate and depth of discharge (DoD) were incorporated as input features into the battery temperature prediction model to enhance its estimation performance. To quantitatively evaluate the impact of input accuracy on prediction precision, a three-dimensional surface plot was constructed to illustrate the variation in root mean square error (RMSE) as a function of C-rate and DoD error.
As shown in
Figure 22, RMSE increased steadily with the compounded error in both C-rate and DoD. This indicates that the accuracy of these physical parameters significantly affected the reliability of temperature prediction. In particular, when a ±1.5 C-rate error and ±50% DoD error were present, the average RMSE increased by approximately 0.12 °C, with a maximum increase of over 0.2 °C.
These findings demonstrated that C-rate and DoD are not simply derived features, but essential physical input parameters. Their inclusion substantiates their practical significance in improving the model’s thermal prediction accuracy across various operating conditions, thereby reinforcing their value in real-time battery management systems [
37].
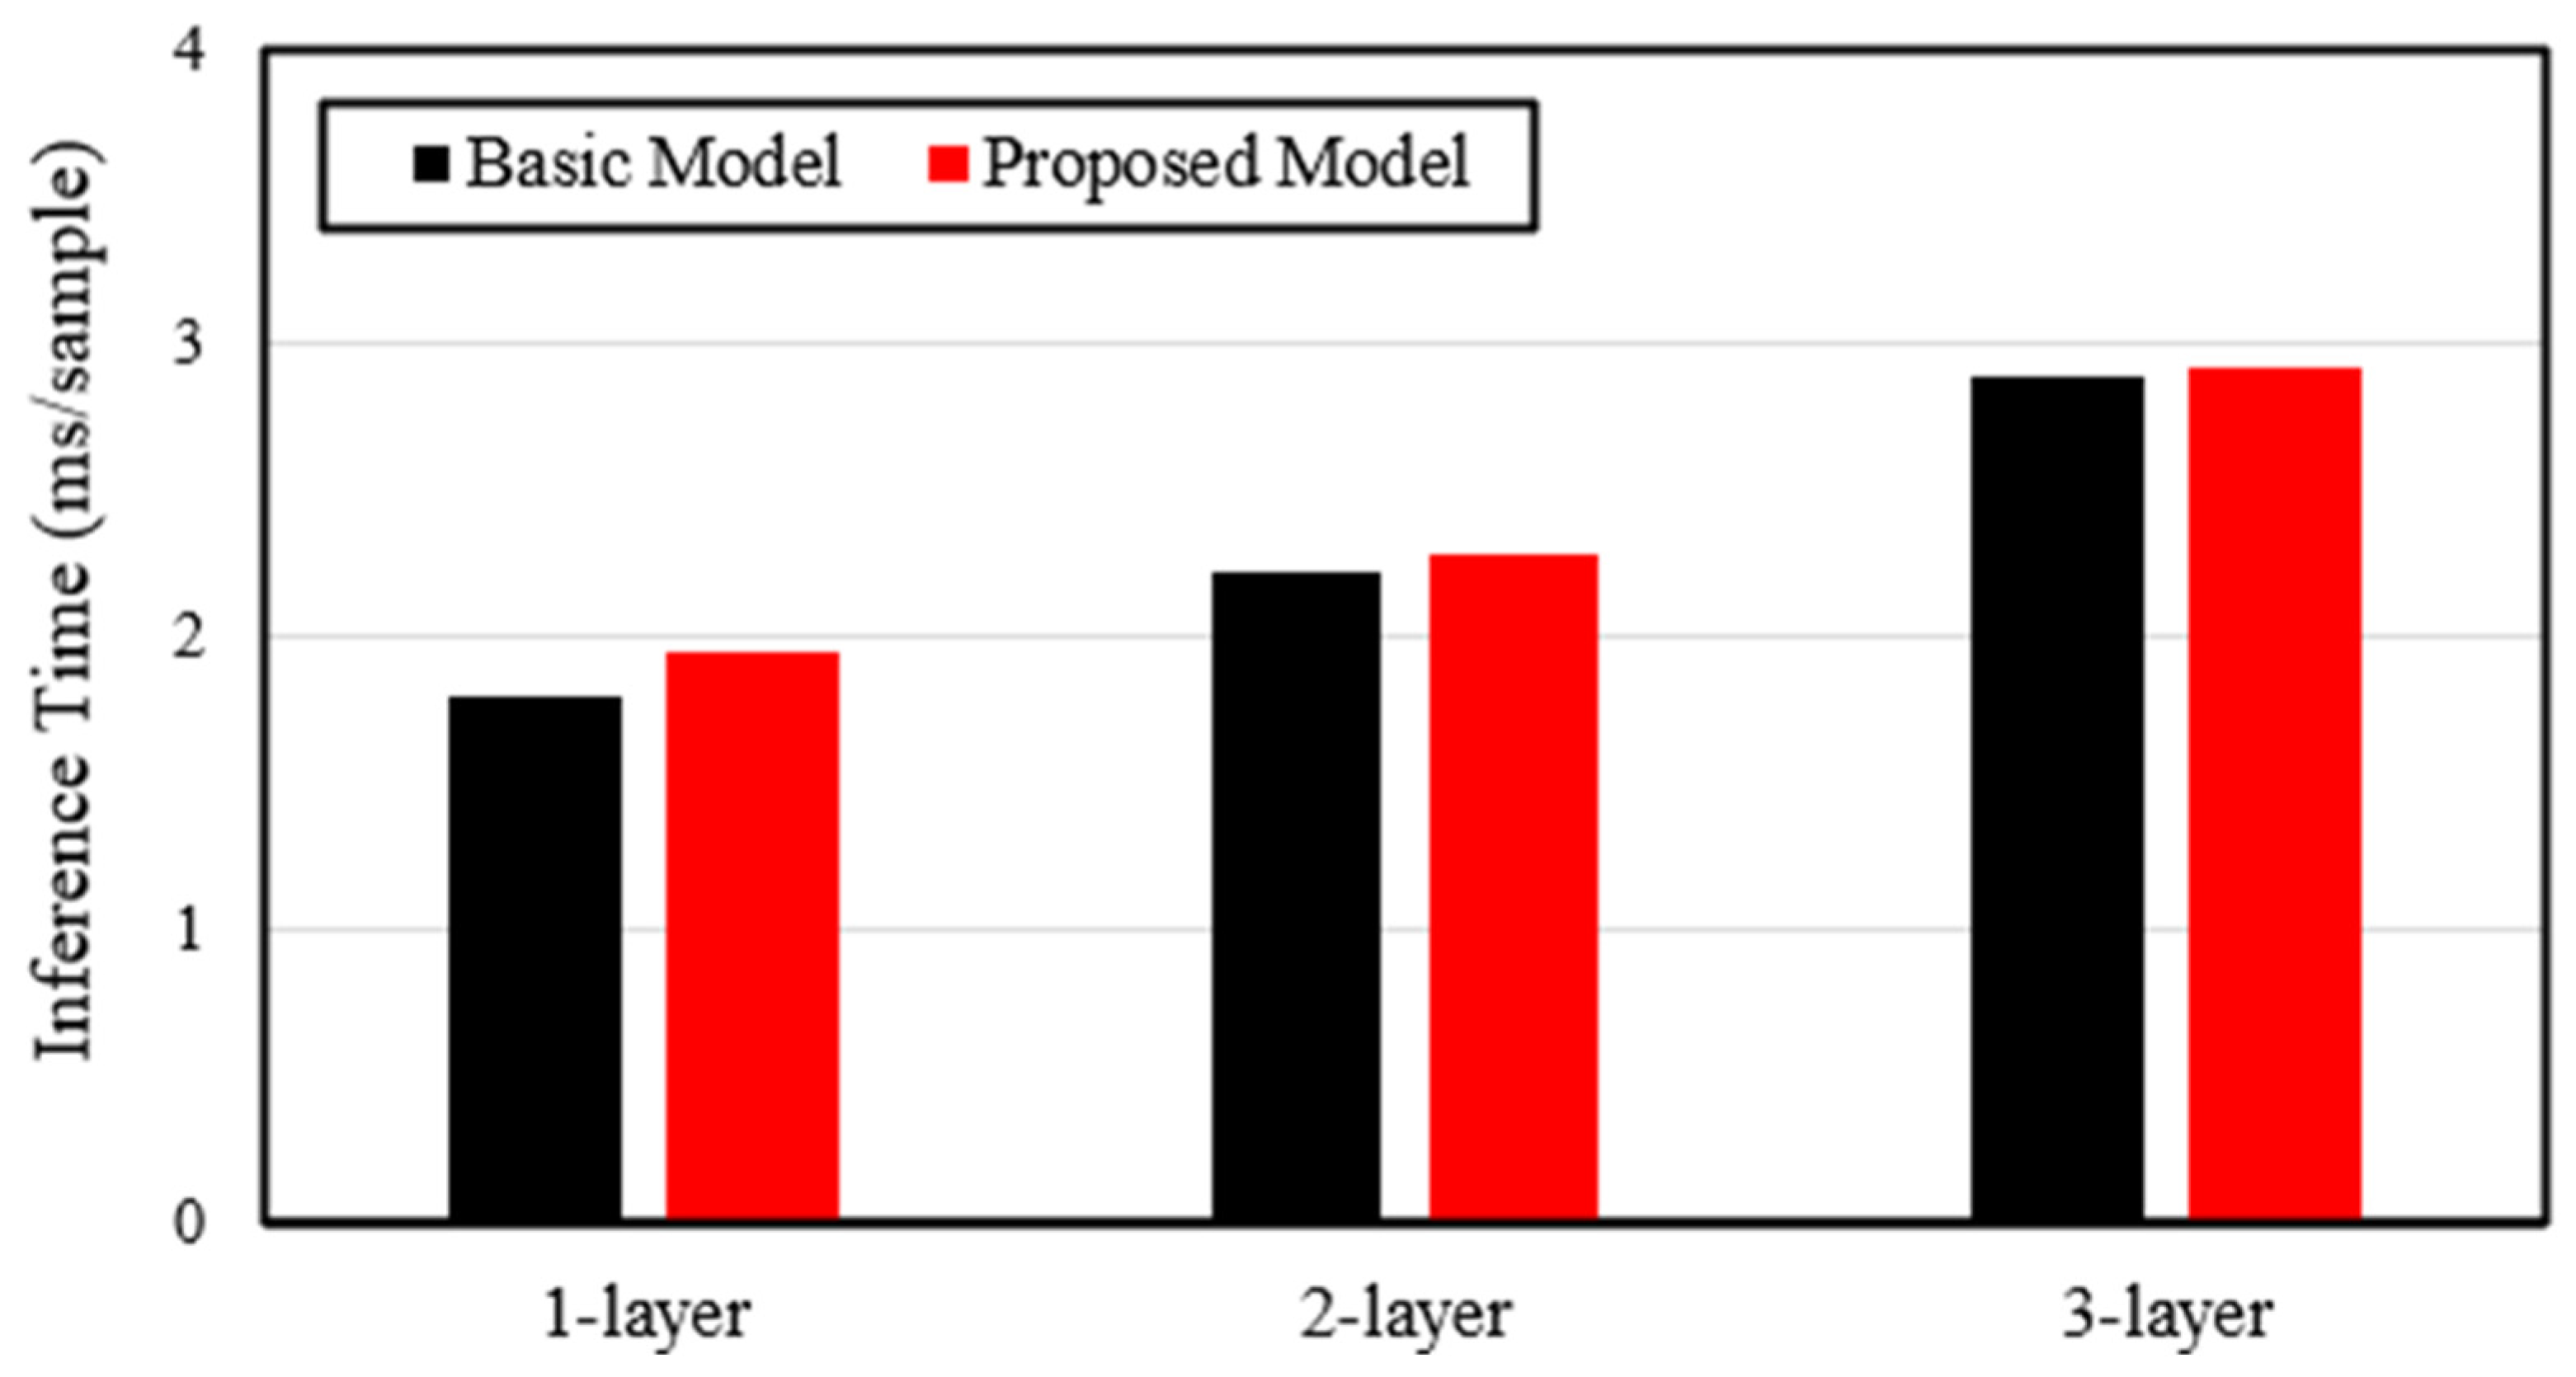
Figure 23 illustrates the inference time per sample (measured in ms/sample) for both models as the number of LSTM layers in the architecture was increased from 1 to 3. As anticipated, the inference time increased for both models with deeper architectures owing to the higher computational complexity. However, the proposed model exhibited a nearly identical inference time to that of the baseline model across all tested configurations. This indicates that the architectural modifications and expanded input features in the proposed model introduced minimal computational overhead during the inference phase. This result underscores the suitability of the proposed model for scalable deployment while preserving responsiveness for real-time applications.
The proposed extended model demonstrated higher accuracy and reliability than the baseline model for battery-temperature estimation, maintaining stable performance across the tested charge/discharge conditions.
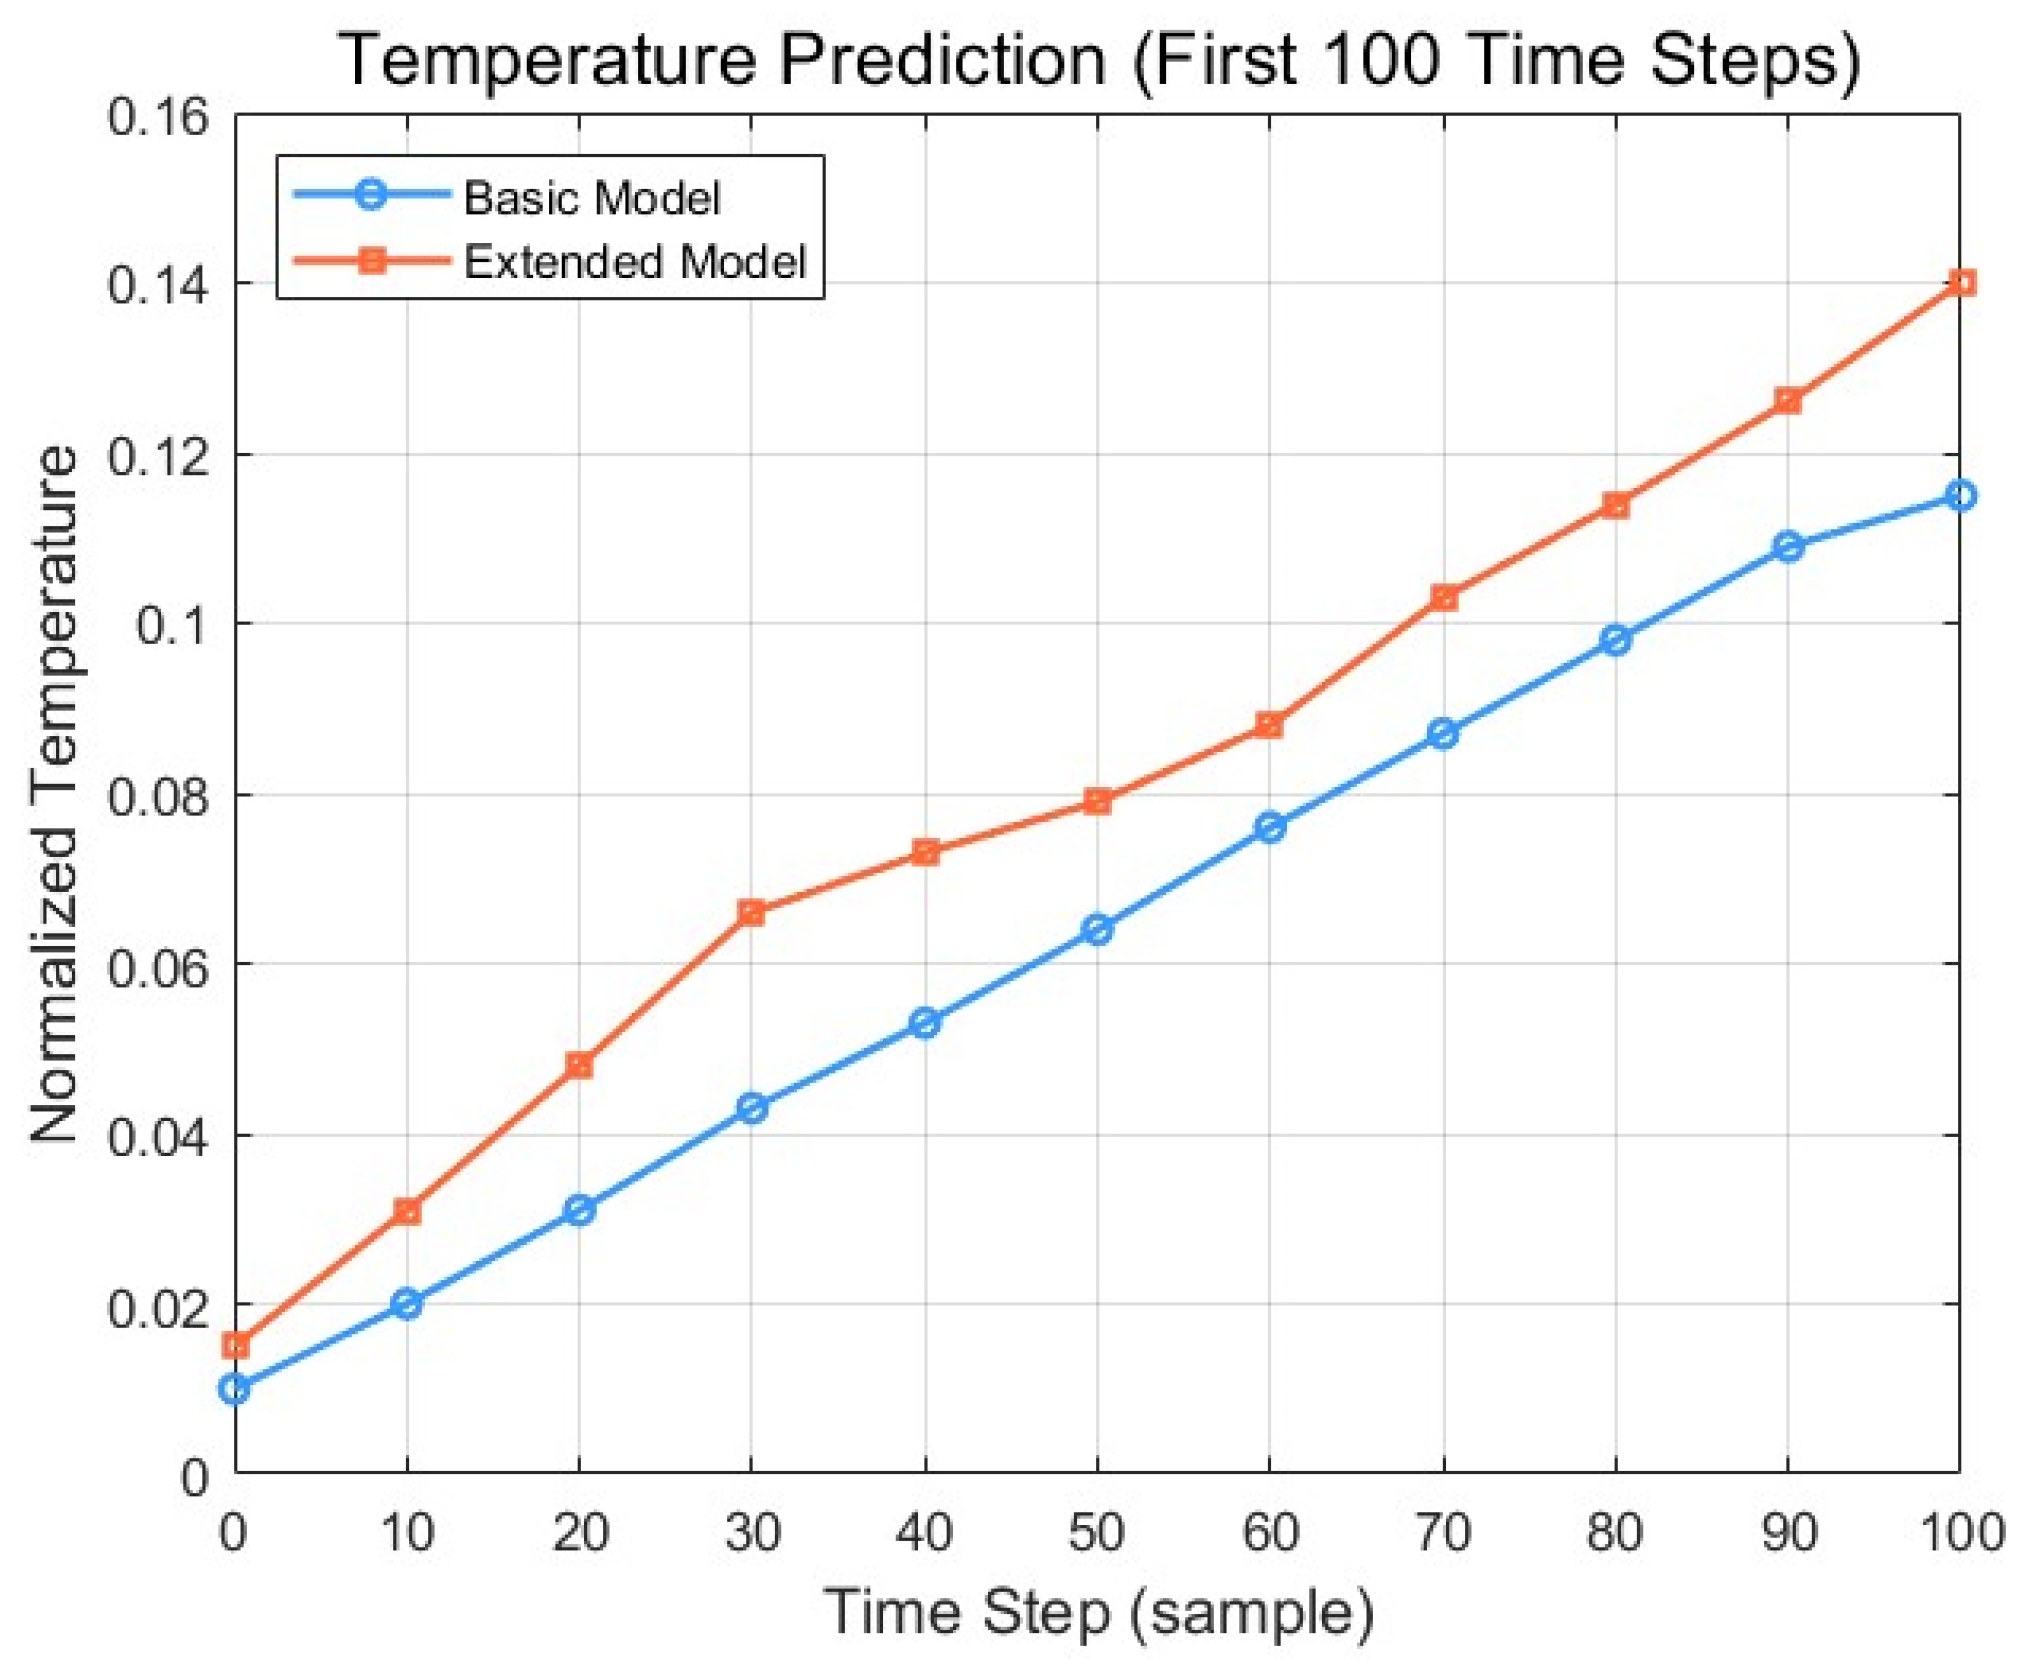
Figure 24 compares the estimation results of both models against the actual temperature over the first 100 time steps of a test sequence. While both models exhibited a gradual increasing temperature trend, the extended model consistently maintained more stable estimation performance, closely tracking the actual values.
The baseline model displayed a tendency to overestimate the battery temperature, particularly as time progressed. This is likely attributable to its limited input variables (SoC, voltage, and current), which may not fully capture the complex thermal dynamics influencing the battery’s temperature evolution. By contrast, the extended model, which incorporated C-rate and DoD as additional input features, achieved more precise temperature estimation and exhibited improved stability in its estimations over the depicted period.
Notably, the observed divergence between the two models’ estimations over time suggests that the extended model more effectively reflected the dynamic thermal behavior of the battery system. As visually supported by
Figure 25, the extended model outperformed the baseline model in both estimation accuracy and stability within this timeframe, demonstrating its capacity to provide reliable results under varying operating conditions.
Figure 26 compares the estimation error distributions for the baseline and extended models, offering valuable insights into their stability and reliability characteristics. The error distribution for the baseline model appeared relatively widespread, showing a tendency for errors to deviate more significantly from the mean. This suggests relatively unstable performance and a higher likelihood of larger estimation errors occurring under certain charge/discharge conditions.
By contrast, the extended model exhibited a more concentrated error distribution centered closely around the center with lower variance. This indicates more consistent and stable estimation performance. The higher probability density within a narrow error range for the extended model suggests that incorporating C-rate and DoD as additional inputs allowed for a more accurate representation and estimation of battery-temperature variations across the test data.
In conclusion, the analysis presented in
Figure 26 demonstrates that the extended model not only reduced the average estimation error but also improved the stability of the estimations. This indicates strong potential for reliable performance if the model is integrated into real-world BMSs.
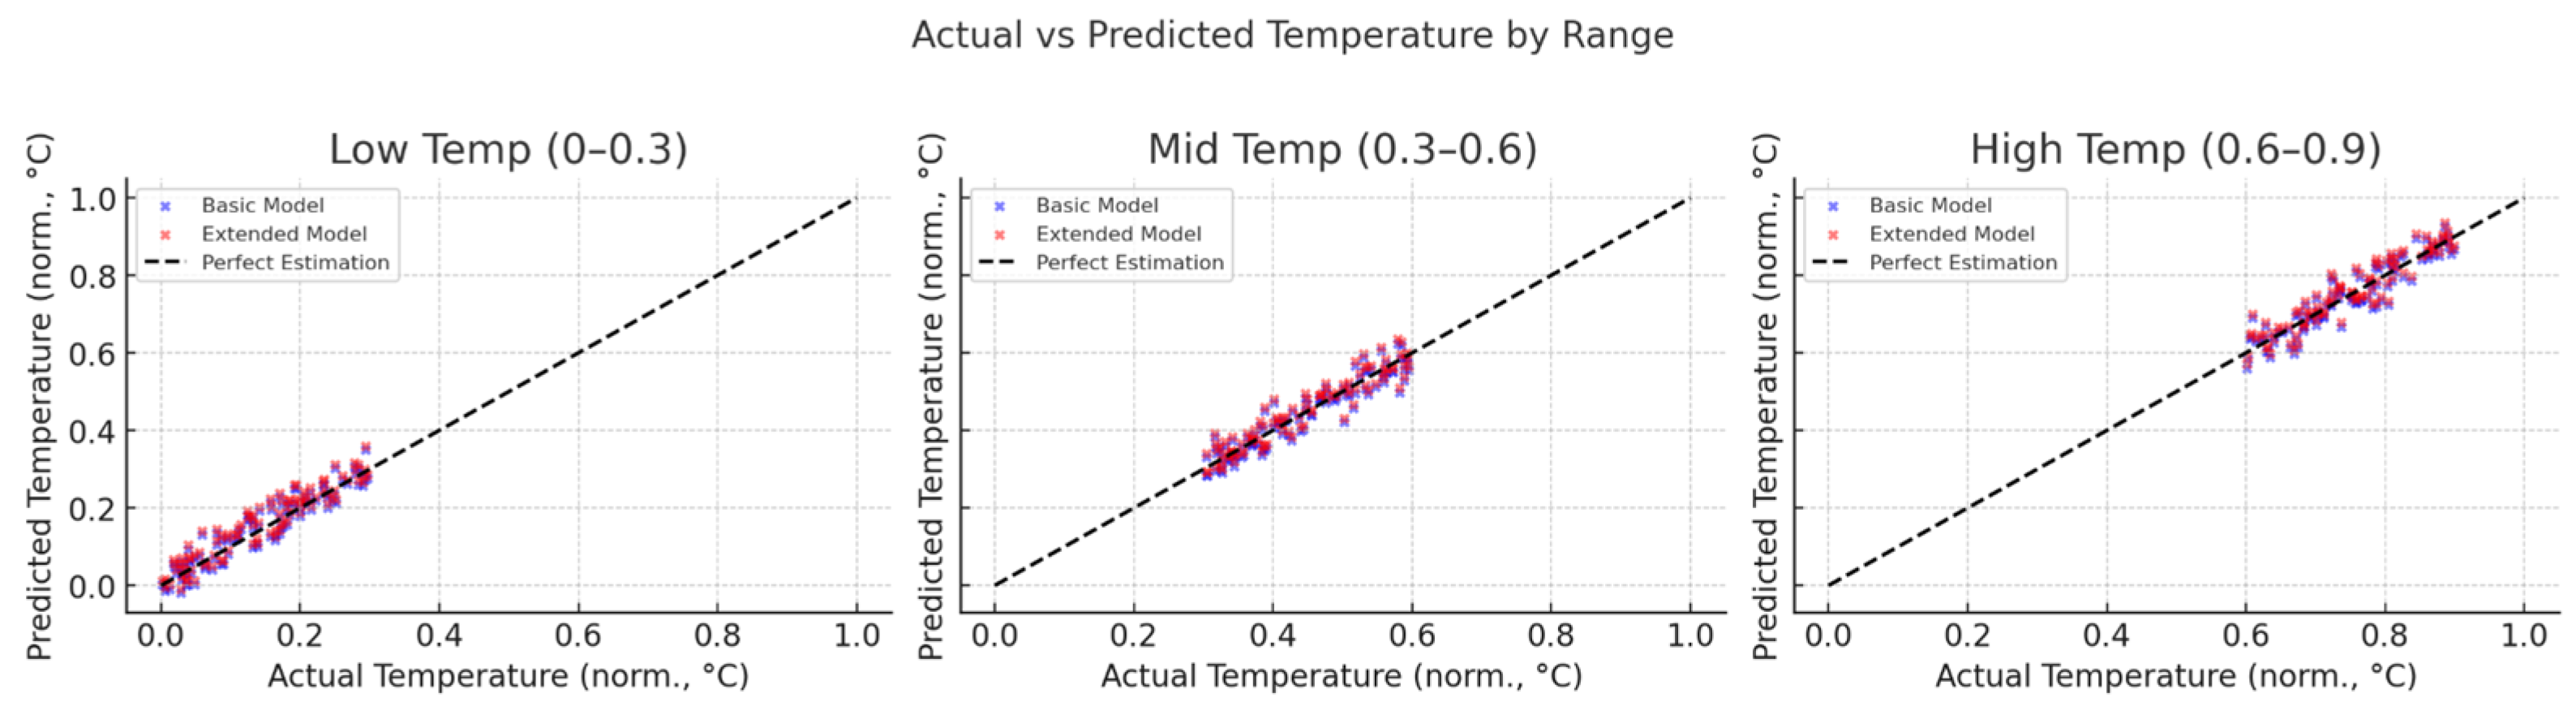
A scatter plot comparing the actual and estimated temperatures is presented in
Figure 27. To facilitate a more detailed analysis, the temperature range was divided into three intervals—Low (0–0.3), Mid (0.3–0.6), and High (0.6–0.9)—with each interval displayed as a separate subplot. Each plot includes an ideal reference line (y = x) to better visualize the estimation error and overall prediction trend.
The data points corresponding to the baseline model were more widely scattered across all three subplots, with a substantial number of points deviating noticeably from the ideal line. This dispersion indicates inconsistent and unstable performance, especially under specific charge and discharge conditions. Notably, the scatter was more pronounced in the high-temperature region, suggesting that the baseline model lacks sufficient responsiveness to thermal variations.
In contrast, the extended model demonstrated a significantly tighter clustering of points around the ideal estimation line. This close alignment indicates that the predicted temperatures were more consistently accurate across different operating conditions. In all three temperature intervals, the extended model showed improved stability and precision, with particularly strong performance in the Low and High ranges. These results highlight the value of including additional input variables, such as C-rate and DoD, which contributed to enhanced predictive performance under both low and high thermal stress conditions.
In summary,
Figure 27 visually confirms that the extended model outperformed the baseline model in terms of estimation accuracy and reliability. When integrated into a battery management system (BMS), this improved predictive capability could support enhanced operational safety by enabling more accurate monitoring of thermal conditions and earlier detection of temperature anomalies.
7. Conclusions
With the recent strengthening of environmental regulations by the IMO and increasing demand for eco-friendly ship operations, effective temperature management of onboard lithium-ion batteries has emerged as a critical operational issue. Battery temperature directly impacts performance, safety, and overall lifespan, and inadequate thermal control can lead to severe consequences, including thermal runaway events. Therefore, developing efficient and reliable battery-temperature estimation technologies is essential for modern maritime applications.
In this study, operational data collected from the training ship, Hannara, operated by Korea Maritime and Ocean University, were used to model an integrated ORC–ESS. Key battery parameters relevant to thermal behavior, specifically SoC, voltage, current, C-rate, and DoD, were identified as key inputs for temperature estimation. A comparative analysis between a conventional data-driven model (using fewer inputs) and the proposed LSTM-based sensorless temperature estimation method (using the extended input set) demonstrated improved performance with the proposed approach. The extended model achieved a 1.5% reduction in RMSE and a 2% reduction in MAE on the test dataset, indicating enhanced estimation accuracy and stability. This performance improvement was primarily attributed to the LSTM network’s inherent capability to effectively learn complex nonlinear characteristics and temporal dependencies influencing battery thermal dynamics from the input data.
Future work should focus on applying and rigorously validating the proposed method in diverse, real-world maritime environments to further ascertain the practicality and robustness of sensorless temperature estimation under operational conditions. Moreover, exploration of additional, potentially more nuanced evaluation metrics beyond RMSE and MAE is warranted. Furthermore, the development of hybrid models, potentially combining LSTM with other RNN architectures or other modeling techniques, will be investigated to further enhance the estimation accuracy. Through these continued efforts, this line of research is expected to contribute meaningfully to the ongoing advancement and adoption of safer and more efficient eco-friendly ship technologies.


