Abstract
Pressure significantly influences lithium (Li) deposition behavior. Although previous studies investigating the influence of pressure on Li deposition have often overlooked the impact of mechanical spacer pressure within the cell, this work specifically focuses on this detail. In this study, we explored the effects of mechanical spacer pressure on the electrochemical properties, deposition morphology, solid–electrolyte interphase (SEI), and thermal stability of Li metal deposition, using spacer pressure as a variable in a small-sized electrode half-cell. The experimental results demonstrate that higher spacer pressure positively enhances Li deposition performance across multiple metrics. However, the beneficial effects of higher spacer pressure decrease with increasing deposition capacity. Specifically, at a low deposition capacity (1 mAh/cm2), a higher spacer pressure facilitates Li metal deposition by promoting SEI stabilization, enabling easier deposition, reducing impedance, and enhancing thermal stability. Conversely, at a high deposition capacity (4 mAh/cm2), the spacer pressure does not significantly improve the aforementioned properties. This study combines the morphology of deposited Li with electrochemical and thermal stability assessments, providing valuable research methods and results for evaluating the effects of external pressure on Li metal deposition.
1. Introduction
Lithium (Li) metal is considered one of the most promising anode materials for the future [1]. The Li metal anode exhibits advantages including low density, low chemical potential, and high theoretical specific capacity (3860 mAh/g), which is over 10 times greater than that of traditional graphite anode (372 mAh/g). Its extremely low electrode potential (−3.04 V vs. SHE) [2,3,4,5] enables compatibility with high-voltage cathodes. However, despite these advantages, the Li metal anode still faces significant challenges in practical applications and industrialization, including low cycling efficiency and safety concerns [6,7,8].
The low cycling efficiency and safety issues of Li metal batteries can be attributed to several factors: the high reactivity of Li metal, significant volume changes during cycling, and the dendritic deposition tendencies [9,10]. In contrast, Li ion batteries with graphite anodes exhibit minimal volumetric change (less than 10%) during cycling, while Li metal anodes undergo significant volume fluctuations. Specifically, Li metal anodes undergo repeated plating/stripping cycles during the charge/discharge processes, leading to dramatic volume changes. For instance, at a deposition capacity of 1 mAh/cm2, the thickness of the Li metal anode can increase by approximately 5 μm [11,12]. These considerable volume changes generate mechanical pressure that may overwhelm and rupture the solid–electrolyte interphase (SEI) on the Li deposition surface. Consequently, the Li metal is re-exposed to the electrolyte, leading to uncontrolled Li electrolyte reactions.
In addition to the pressure generated by the expansion of the Li deposition volume [13], electrodeposits face multiple internal and external pressure sources. The SEI layer can induce inhomogeneous compression effects due to its mechanical stiffness [14]. The battery separator possesses mechanical strength that exerts stress on Li dendrites during their growth [15]. The crimping pressure during battery assembly also contributes to mechanical pressure [16,17]. Fang et al. [18] employed a pressure experimental setup to investigate the impact of uniaxial stack pressure on the Coulombic efficiency and deposition morphology of lithium. They found that increasing the pressure enhanced the Coulombic efficiency from 82% to 92%, resulting in a denser lithium deposition morphology. However, excessively high pressure did not yield further improvements. Louli et al. [11] investigated the effect of external mechanical pressure on the performance of anode-free lithium metal pouch cells. Their findings demonstrated that increasing the initial average pressure from 75 to 2200 kPa generally enhances the cycling performance and lithium plating efficiency of anode-free cells. Zhang et al. [19] developed a contact mechanics model of the electrode–separator interface to elucidate how dendrite growth is inhibited when lithium metal pouch cells are subjected to external loads.
To study the effects of external pressure on Li metal deposition, researchers commonly use external pressure devices to apply pressure to the entire coin cell [18,20]. However, these experimental methods pose practical challenges, and the operational procedures often involve multiple limitations. Additionally, coin cell components like spacers and springs come in various sizes. During coin cell assembly, the different sizes of the spacers and springs lead to different pressures on the anode and cathode, as shown in Figure 1 [16]. Nevertheless, this variability has received limited attention in prior studies.
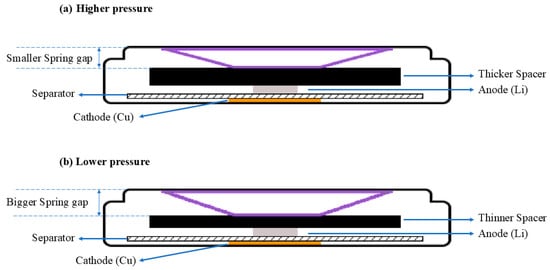
Figure 1.
Cross-sectional diagram of a coin cell exhibiting varying internal pressures (this internal pressure is at the cell level). (a) Higher internal pressure with greater spring compression due to a thicker spacer, leading to a smaller spring gap; (b) lower internal pressure with smaller spring compression due to a thinner spacer, leading to a larger spring gap. Adapted from [16] with permission from the Springer Nature. Copyright 2022.
Therefore, in this study, we used spacers of varying heights to control the external pressure during Li deposition. Specifically, the crimping pressure applied during cell assembly was consistently set at 1000 psi. The internal components of the cell were uniform in size, with the exception of the spacers. A spacer with a height of 1.5 mm generated higher pressure, while a spacer with a height of 1.0 mm generated lower pressure. Using this research method, we investigated the effects of spacer pressure on multiple aspects of Li metal deposition, including electrochemical properties, deposition morphology, the solid–electrolyte interphase (SEI), and thermal stability. This pressure-regulation method through spacer height adjustment allows rapid identification of pressure effects on Li deposition, and the procedure is straightforward and easily adaptable. Furthermore, we employed small-sized electrodes for this study because this very small size structure reduces the mass-transfer limitations in the Li deposition process [21]. The thermal stability tests were performed directly on the complete working electrode, thereby minimizing experimental errors.
2. Materials and Methods
2.1. Prepare the Material
The electrolyte was 1 M lithium hexafluorophosphate (LiPF6) in 1:1 v/v ethylene carbonate (EC)/diethyl carbonate (DEC) (Dodo chemical, Jiangsu, China). The coin cell type was LIR2032, and the size of the spring was Ø15.4 × 1.1 mm. The spacer diameter was 16.2 mm, with heights of 1.5 mm (H = 1.5 mm) and 1.0 mm (H = 1.0 mm) for the thick and thin spacers, respectively. The separator was a 25 µm thick polypropylene–polyethylene–polypropylene (PP-PE-PP) separator (Celgard 2325, Tianjin Leviathan Technology Co., Ltd., Tianjin, China). The Li foil thickness was 500 μm, and the Cu foil thickness was 25 μm.
The Cu foil and coin cell case were washed with ethanol to remove surface contaminants and subsequently dried in a vacuum oven for 1 h. The Cu, Li, and separator were cut using a slicer with diameters of 4 mm (Cu), 2 mm (Li), and 16 mm (separator), with the Li foil cut in an argon-filled glove box (Mikrouna, O2 < 0.01 ppm, H2O < 0.01 ppm).
2.2. Electrochemical Experiments
2.2.1. Assembly and Disassembly of Coin Cells
The Cu foil served as the working electrode, and the Li foil served as the counter/reference electrode. The coin cell was assembled in the following order from bottom to top: cathode shell → Cu → electrolyte → separator → electrolyte → Li → spacer → spring → anode shell, and it was then crimped using a coin cell crimping machine (MRX-SF120, Shenzhen Mingrui Xiang Automation Equipment Co., Ltd., Shenzhen, China) at ~1000 psi. The cells were then left overnight in preparation for testing.
Some coin cells require disassembly experiments to extract the working electrodes for scanning electron microscopy (SEM) or differential scanning calorimetry (DSC) experiments. A coin cell disassembler (MRX-CX120, Shenzhen Mingrui Xiang Automation Equipment Co., Ltd., Shenzhen, China) was used to disassemble the cell and extract the working electrode. The working electrode was cleaned with 1,3-dioxolane (≥99.5%, Meryer Co., Ltd., Shanghai, China). During the cleaning process, the working electrode was initially immersed in a beaker containing 1,3-dioxolane for over 30 min. The liquid was stirred during the immersion. Afterward, the immersed electrode was removed and allowed to dry naturally in a glove box for 10 min. This procedure was repeated three times to minimize the effects of residual solvent. Finally, the cleaned electrodes were placed in the glove box with a cyclic argon purge environment for over 8 h before the subsequent experiments.
2.2.2. Electrodeposition
The electrodeposition experiments were conducted using the constant current mode in the NEWARE electrochemical testing system (NEWARE BTS-4000, Neware Technology Ltd., Shenzhen, China) at room temperature, with a current density of J = 1 mA/cm2 and deposition capacities of 1 mAh/cm2 and 4 mAh/cm2.
2.2.3. Cycling Test
The Coulombic efficiency was evaluated at J = 1 mA/cm2 using the NEWARE electrochemical testing system at room temperature. The cells were initially cycled between 0–1 V at 50 μA/cm2 for five cycles to stabilize the SEI and remove surface contaminations [22,23,24]. Subsequently, 1 mAh/cm2 of Li was deposited onto the working electrode at J = 1 mA/cm2 for 1 h, set aside for 10 min, and then stripped to 1 V at J = 1 mA/cm2 to complete one cycle and set aside for 10 min, followed by the next cycle.
2.2.4. Electrochemical Impedance Spectroscopy (EIS)
EIS measurements were conducted using an electrochemical workstation (DH7000C, Jiangsu Donghua Analytical Instruments CO., Ltd., Jiangsu, China). The frequency range for the measurements spanned from 1 MHz to 0.1 Hz, with a 5 mV amplitude. After the measurements were completed, we used the software (version number: 6.22.11.9) for the analysis of experimental data and fitting of equivalent circuits.
2.3. SEM Sample Preparation and Imaging
Samples were prepared in a glove box. The cleaned and dried working electrodes were affixed to the sample stage using conductive tape, and then, the samples were sealed in argon-filled containers for transport. During the experiments, the sample stage was rapidly inserted into the SEM chamber, immediately evacuated, and imaged. The experiments were conducted using a Field Emission Scanning Electron Microscope (Apreo S LoVac, FEI, Brno, Czechia) equipped with an EDS (Octane Elect Super, EDAX, Pittsburgh, PA, USA).
2.4. Thermal Stability Analysis
The differential scanning calorimeter (DSC1, Mettler Toledo International Inc., Zurich, Switzerland) was used to assess the thermal stability of Li deposition. The sample was prepared in the glove box. The measurement temperature range was 30–340 °C, with a heating rate of 5 °C/min.
2.5. Approximate Estimation of Spacer Pressure
To estimate the internal pressure generated by varying spacer heights in the LIR2032 coin cell, we conducted a simplified mechanical analysis based on the elastic compression of the stainless-steel spring used in the cell assembly. The total internal cavity height was fixed at 2.6 mm, which was determined by subtracting the case thickness (0.6 mm) from the total cell height (3.2 mm). When the total height of the internal components exceeds 2.6 mm, the stainless-steel spring becomes compressed, exerting mechanical pressure on the electrode.
Assuming the spring behaves as a linear elastic material, the internal compressive pressure can be approximated using the following equation:
where σ is the internal compressive pressure (GPa), E is the Young’s modulus of stainless steel (approximately 200 GPa), ΔL is the compression length of the spring (mm), and L0 is the original, uncompressed thickness of the spring (1.1 mm).
When the height of the spacer is 1.0 mm, the total stack thickness is calculated as follows: 1.1 mm (spring) + 1.0 mm (spacer) + 0.5 mm (Li) + 0.025 mm (separator) + 0.025 mm (Cu) = 2.65 mm. The compression of the spring is given by ΔL = 2.65 mm − 2.6 mm = 0.05 mm. The internal compressive pressure can be calculated using the Equation (1) σ = 200 × (0.05/1.1) ≈ 9.1 GPa. When the height of the spacer is increased to 1.5 mm, the internal compressive pressure rises to approximately 100 GPa. It is important to note that the pressure derived from the calculations above is merely a rough estimate.
These values represent theoretical upper-bound estimates of the pressure transmitted to the electrode, under the assumption of full elastic behavior and complete load transfer. Although real-world conditions may involve partial plastic deformation, non-uniform pressure distribution, or pressure relaxation, this model illustrates the monotonic relationship between spacer height and internal mechanical pressure, justifying our experimental design using spacer height as a controllable variable.
3. Results and Discussion
3.1. Effect of Spacer Pressure on Li Deposition Overpotentials
Two characteristic overpotentials can be observed during constant-current deposition: (1) nucleation overpotential (ηn), defined as the voltage peak during the initial stage of Li deposition and representing the driving force for Li metal nucleation on the collector, and (2) plateau overpotential (ηp), representing the driving force for the growth of Li metal after nucleation. These two parameters are critical to characterizing the nucleation and growth dynamics of Li metal [25,26].
At the onset of Li deposition, the potential of the working electrode rapidly drops to −ηn (below 0 V), at which point the electrochemical overpotential drives the nucleation of Li embryos. After nucleation, the overpotential gradually rises to −ηp, facilitating the sustained growth of Li atoms. The influence of electrode polarization on the growth of Li atoms is less significant compared to the nucleation phase [27]. This is because attaching a Li adatom to an existing nucleus is thermodynamically more favorable and involves a lower energy barrier than forming a stable Li embryo [28].
In Li-Cu half cells, the nucleation overpotential originates from a heterogeneous nucleation barrier caused by the thermodynamic mismatch between Li and Cu [29]. Extensive research has been conducted on the heterogeneous nucleation mechanism of Li deposition, with various strategies proposed to mitigate this barrier [30,31,32]. These strategies include zinc plating on the surface of the copper collector to modify its properties [22] and selecting collector materials with high Li solubility [29]. However, the influence of spacer pressure on the heterogeneous nucleation overpotential of Li on Cu foil remains underexplored.
Therefore, we investigated the effect of spacer pressure on the overpotential for Li metal deposition during constant current deposition. Figure 2a illustrates the effect of spacer pressure on the voltage profile of the Li metal deposition process. Figure 2b presents a statistical analysis of the specific values of nucleation overpotentials and plateau overpotentials. The specific values corresponding to each sample depicted in Figure 2b are provided in Tables S1 and S2 in the Supplementary Information. From Figure 2, we can quantify the impact of spacer pressure on Li deposition overpotential. At a current density of 1 mA/cm2, the mean nucleation overpotential (ηn1) for Li deposition under higher spacer pressure (H = 1.5 mm) was 112 mV, while the mean nucleation overpotential (ηn2) for Li deposition under lower spacer pressure (H = 1.0 mm) was 185 mV, which is approximately 70 mV higher than ηn1. Regarding the plateau overpotential (ηp), during the actual Li deposition process, ηp gradually decreased with increasing deposition time and capacity. At a deposition capacity of 1 mAh/cm2, the mean value of ηp1 was 80 mV, while the average value of ηp2 was 100 mV, which is about 20 mV higher than ηp1. When the deposition capacity reached 4 mAh/cm2, the difference in plateau overpotential between the two conditions became minimal, with mean values of 65 mV (ηp1) and 69 mV (ηp2), respectively.
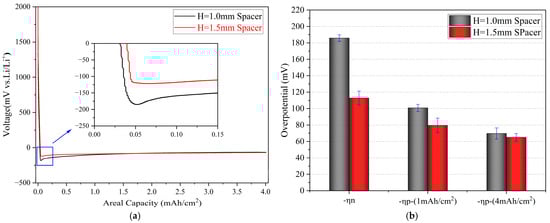
Figure 2.
(a) Voltage–capacity curves of cells with different heights of spacers; the inset shows an enlarged picture of the nucleation overpotential region. (b) The values of various overpotentials, along with the statistical information derived from five samples for each condition, are detailed in Tables S1 and S2.
The experimental results demonstrate that, under identical cell crimping pressures (1000 psi), varying spacer heights result in different pressures on the cathode and anode. During Li deposition, a higher spacer pressure leads to a reduced nucleation overpotential and a lower platform overpotential. This indicates that a higher spacer pressure promotes Li nucleation and growth on the Cu collector. However, during the Li metal growth stage following nucleation, the influence of spacer pressure weakens with increasing deposition capacity, becoming less significant.
After electrodeposition, electrochemical impedance spectroscopy (EIS) was conducted to further analyze the effect of varying spacer pressures on the impedance behavior of Li deposition, as illustrated in Figure 3. The equivalent circuit model presented in the inset of Figure 4 was used to interpret the EIS data. In most of the literature, Ru is defined as the solution resistance; however, it should be noted that Ru encompasses not only the solution resistance but also the impedance arising from physical factors such as contact resistance and collector resistance. Multiple cells were assembled under each experimental condition to ensure data reliability. As shown in Figure 5a, the Ru of cells with the thick spacer consistently ranged between 2 and 3 Ω, indicating greater stability. In contrast, the Ru of cells with the thin spacer fluctuated between 3 and 20 Ω, demonstrating significant instability. Based on the information regarding the mean and standard deviation of Ru presented in Figure 5b, it is evident that the error bars for the Ru values measured under lower spacer pressure conditions (H = 1.0 mm spacer) are excessively long, indicating substantial variability in the data. This discrepancy may be attributed to the higher pressure applied by the thick spacer, which improves the contact between the internal components of the cell and leads to a more stable Ru. Conversely, the use of a thin spacer may lead to insufficient pressure, creating gaps and other factors that contribute to instability.
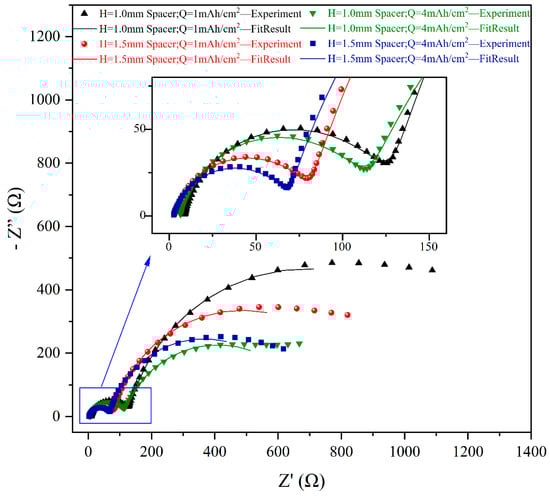
Figure 3.
Nyquist plots of Li deposition under different conditions; inset provides a magnified view of the high-frequency region.
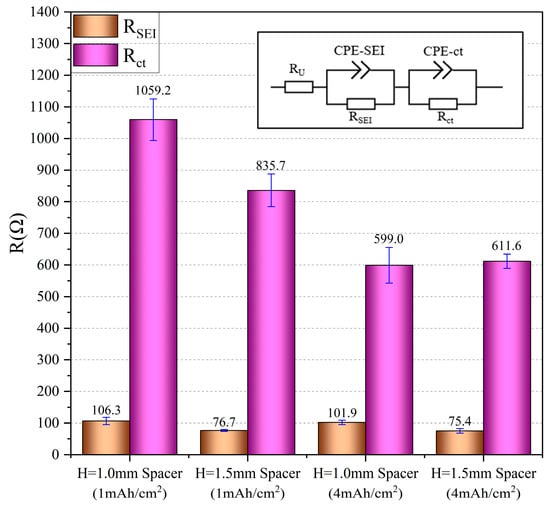
Figure 4.
The results of the statistical analysis for lithium deposition, including the RSEI and RCT values under various spacer pressure conditions; the inset illustrates the equivalent circuit model of Figure 3.
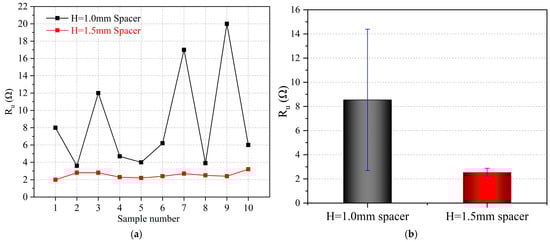
Figure 5.
(a) Ru values measured at different spacer pressures. (b) Mean and standard deviation information of Ru values at different spacer pressures.
By examining the detailed impedance simulation data presented in Figure 4 and Tables S3 and S4, we found that at a deposition capacity of 1 mAh/cm2, the SEI impedance (RSEI) and charge transfer impedance (RCT) of Li deposition with a thick spacer were significantly lower than those of the Li deposition with a thin spacer. When the deposition capacity was increased to 4 mAh/cm2, the RSEI for thick-spacer Li deposition remained lower than that for thin-spacer Li deposition; however, the RCT for both configurations appears to converge towards similar values. Furthermore, as the deposition capacity increases, both the RSEI and RCT of Li deposition decrease, regardless of the spacer type.
It can be concluded that higher spacer pressure reduces the impedance of Li deposition, including both the SEI impedance and the charge transfer impedance. However, as the amount of Li deposition increases, the influence of pressure on charge transfer impedance gradually diminishes. This observation is consistent with the previous analysis on the effect of spacer pressure on overpotential.
3.2. Effect of Spacer Pressure on Cell Coulombic Efficiency
Coulombic efficiency (CE) is a widely used metric for evaluating cell cycle life, as it quantifies the loss of Li during each cycle [12,33,34]. In Li-Cu half cells, CE is calculated as the ratio of the stripped Li capacity to the deposited Li capacity on the Cu collector [35], as defined in Equation (2). Figure 6 shows the voltage–time profile during cycling, while Figure 7 presents the CE variation with cycle number. Overall, the thick-spacer cell exhibits a higher average CE compared to the thin-spacer cell. The CE of the thick-spacer cell decreases smoothly with increasing cycle number, while the thin-spacer cell shows a significantly fluctuating decline.
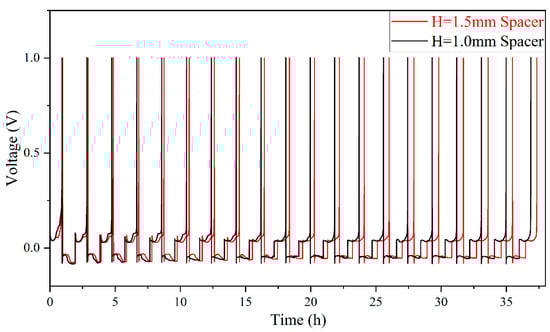
Figure 6.
Cycle curves at different spacer pressures.
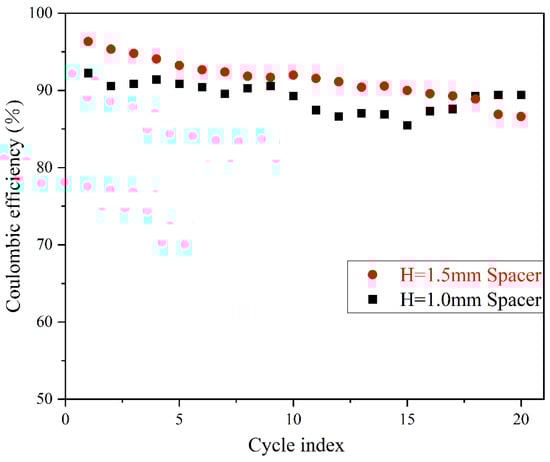
Figure 7.
Comparison of CE at different spacer pressures.
The post-cycling electrochemical impedance spectroscopy results are shown in Figure 8, with the corresponding equivalent circuit model in Figure 9. Most of the Li metal deposition on the Cu collector is stripped after cycling, leaving only the SEI layer on the surface. The RSEI of the thick-spacer cell is lower than that of the thin-spacer cell. This result is consistent with the trend observed in the EIS trends discussed in Section 3.1.
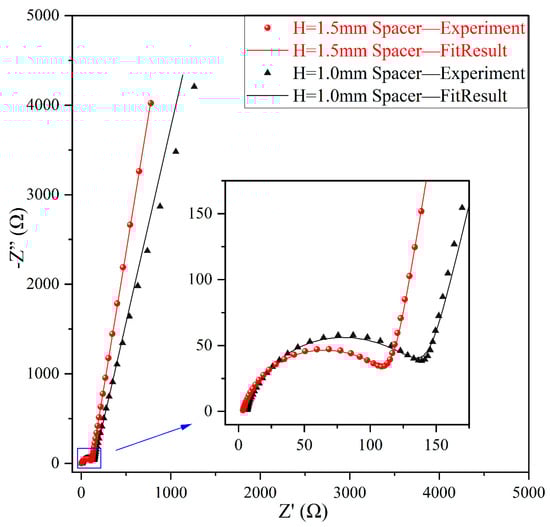
Figure 8.
Nyquist plots at different spacer pressures after cycling; inset provides a magnified view of the high-frequency region.
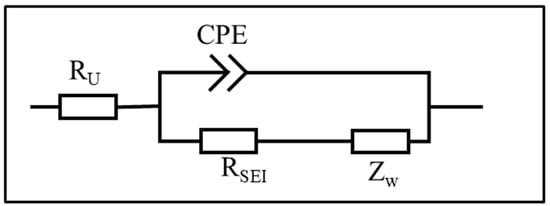
Figure 9.
The equivalent circuit model of Figure 8.
3.3. Effect of Spacer Pressure on the Morphology and SEI of Li Deposition
The morphology of deposited Li under different conditions was examined using scanning electron microscopy (SEM), as shown in Figure 10. At 1 mAh/cm2 deposition capacity, the morphologies of the Li deposition under both thin- and thick-spacer pressures were quite similar, exhibiting a bulk shape. The Li deposition under thick-spacer pressure was slightly larger in size compared to that under thin-spacer pressure. When the deposition capacity was increased to 4 mAh/cm2, the Li morphology in both pressure conditions remained bulk-deposited but with an increase in size. The surface morphology of Li deposition under the thick-spacer pressure was smoother and more uniform, with neighboring Li bulk structures exhibiting tighter packing due to the higher pressure applied by the thick spacer. Overall, while spacer pressure had limited influence on Li deposition morphology, the higher spacer pressure resulted in flatter and more compact Li deposition.
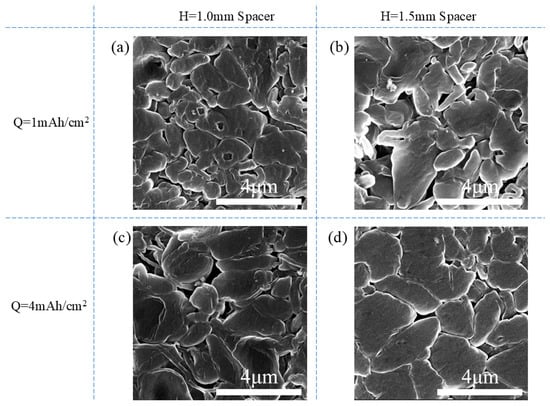
Figure 10.
The morphology of Li deposition. Li deposition of Q = 1 mAh/cm2, H = 1.0 mm spacer (a); Q = 1 mAh/cm2, H = 1.5 mm spacer (b); Q = 4 mAh/cm2, H = 1.0 mm spacer (c); Q = 4 mAh/cm2, H = 1.5 mm spacer (d).
The elemental distribution of the solid–electrolyte interphase (SEI) and its relative composition on the deposited Li surface were analyzed using energy-dispersive spectroscopy (EDS). As shown in Figure 11, at a deposition capacity of 1 mAh/cm2, the SEI on the surface of Li deposition under high pressure from a thick spacer contained a greater proportion of inorganic components such as F and P. This observation highlights the differences in SEI composition between the two conditions: the SEI formed under thick-spacer pressure shows a higher concentration of inorganic components. Studies have demonstrated that SEI with a greater abundance of inorganic components can effectively reduce the interfacial transfer barrier of Li ions [36,37,38], and it exhibits enhanced stability and improved uniformity in Li ion conductivity [39]. Thus, from this perspective, the SEI formed under higher spacer pressure demonstrates superior properties. However, when the deposition capacity is increased to 4 mAh/cm2, the elemental composition of deposited Li surface SEI in both thin- and thick-spacer cells becomes nearly identical. This indicates that with increasing deposition capacity, the spacer pressure no longer provides significant advantages in the elemental composition of the SEI.
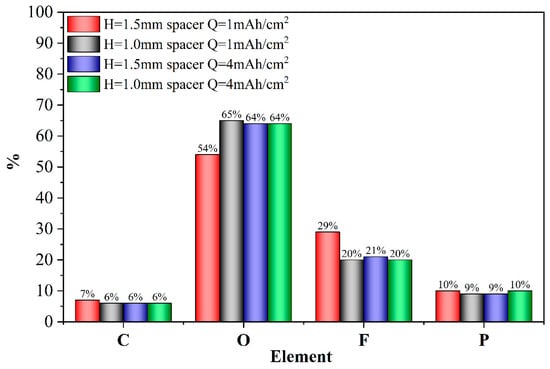
Figure 11.
Comparison of elemental distribution of SEI formed on Li deposition.
In fact, through the related studies conducted by other researchers, we find that the effect of pressure on SEI is considerably more complex. Zhou et al. [40] investigated the pressure-induced changes in the structure and properties of the SEI through simulations, demonstrating that higher pressure favors the formation of a thin and dense SEI. Lim et al. [41] conducted related experiments that revealed the SEI under higher spacer pressure conditions is thinner and more uniform, allowing for more complete coverage of lithium deposition. Fang et al. [18] employed cryo-TEM to determine that stack pressure has minimal effects on the structures, components, and distributions of the SEI. Fan et al. [42] utilized molecular dynamics simulation to comprehensively investigate how pressure influences the dynamic growth, structural changes, and performance transitions of SEI in lithium metal batteries. Their findings revealed a delicate balance between pressure, lithium ion transport properties, the mechanical properties of the SEI, and the growth of lithium dendrites. Therefore, in the future, we should conduct a more comprehensive experimental study on the pressure-induced growth of SEI.
3.4. Effect of Spacer Pressure on the Thermal Stability of Li Deposition
The DSC technique was employed to assess the effects of different conditions on the thermal stability of Li deposition [43,44,45,46,47]. In this study, we utilized a working electrode with a diameter of 4 mm. This method enables the electrode to be placed intact into a 25 μL gold crucible, enabling DSC experiments to be conducted on the complete electrode and thus providing more comprehensive and accurate results regarding thermal stability. This approach overcomes the limitation of conventional DSC experiments, which require cutting large electrodes to fit crucibles [48].
As shown in Figure 12 and Figure 13 and summarized in Table 1, at 1 mAh/cm2 deposition capacity, Li deposition under thin-spacer pressure starts to slowly exotherm at 200 °C, reaching its peak exothermic activity at 275 °C and ending the exotherm at approximately 290 °C, resulting in a larger total exothermic amount. In contrast, Li deposition under thick-spacer pressure shows a delayed exothermic onset only after 270 °C and ends at 300 °C, with two minor exothermic peaks observed during the process, resulting in a lower total exothermic amount. Overall, the thermal stability of Li deposition under thick-spacer pressure is significantly superior to that under thin-spacer pressure.
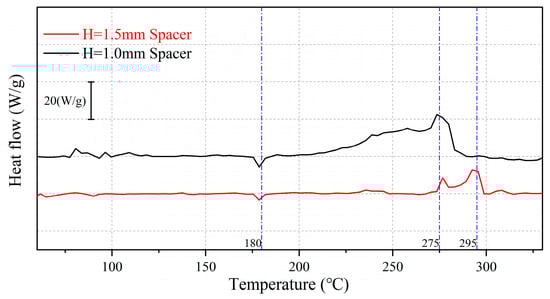
Figure 12.
Comparison of thermal stability curves for Li deposition with Q = 1 mAh/cm2.
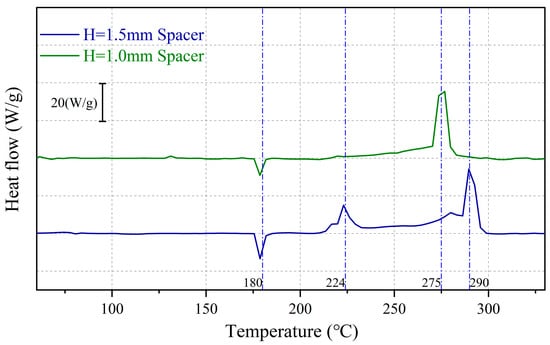
Figure 13.
Comparison of thermal stability curves for Li deposition with Q = 4 mAh/cm2.

Table 1.
Peak exothermic temperature and exothermic amount of Li deposition under different conditions. The exothermic quantities are normalized to the mass of Li deposition.
However, the thermal stability of Li deposition under thick-spacer pressure deteriorated when the deposition capacity was increased to 4 mAh/cm2, resulting in a minor exothermic peak around 224 °C and a subsequent major exothermic peak around 290 °C. On the other hand, Li deposition under thin-spacer pressure exhibited an exothermic activity starting at 270 °C, with a single exothermic peak. Overall, Li deposition under thick-spacer pressure exhibits higher exothermicity.
In fact, the samples under each condition contain very similar components, specifically the Li deposition body and the SEI on its surface. The primary difference lies in the varying degrees of densification of the Li deposition, which are influenced by different spacer pressures. This variation results in differing amounts of electrolyte residue within the internal gaps of the Li deposition after repeated cleaning. Additionally, the structure and coverage of the SEI on the Li deposition surface exhibit slight differences. These variations contribute to the differing thermal stability of Li deposition under various conditions. As illustrated in Figure 14, pristine Li metal melts at 180 °C and undergoes a violent exothermic reaction with the electrolyte. Experimental studies conducted by Gan and Jiang et al. [43,44] demonstrated that the SEI decomposes exothermally before reaching 180 °C. However, in our experiments, no exothermic peaks of SEI were observed before 180 °C in the thermal stability curves. Therefore, we argue that the exothermic peak observed in this experiment may result from the coupled exothermic reactions of the SEI, Li deposition, and residual electrolyte within the Li deposition, which interact at elevated temperatures. Consequently, the differences in the structure of the SEI and Li deposition under each condition account for the variations in the location and total intensity of the exothermic peaks.
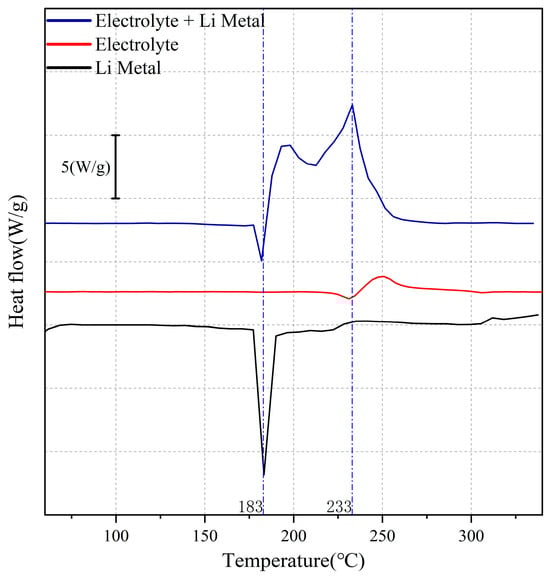
Figure 14.
Thermal stability curves of Li metal, electrolyte, and electrolyte + Li metal.
It is evident that when the deposition capacity is low, for example, 1 mAh/cm2, increased spacer pressure improves the thermal stability of Li deposition. However, with increasing deposition capacity, this higher spacer pressure advantage no longer provides significant thermal stability improvements for Li deposition.
4. Conclusions
In this study, we investigated the effects of spacer pressure on multiple properties of Li metal deposition. The height of the spacer was used as a proxy for the pressure variable in this methodology, which is simple and experimentally reproducible. Furthermore, we used small coin cell electrodes for our experiments, as these electrode sizes facilitate more comprehensive results in testing the thermal stability of Li deposition. These methods provide valuable data for laboratory studies investigating the effect of external pressure on Li metal deposition.
We observe that higher spacer pressure leads to a flatter and more compact Li deposition morphology. Through electrodeposition, cycling tests, and electrochemical impedance spectroscopy (EIS), we found that higher spacer pressure reduces deposition overpotentials, lowers Li nucleation barriers, and reduces cell impedance, leading to enhanced stability and higher coulombic efficiency (CE). However, when the deposition capacity is increased to 4 mAh/cm2, the advantages of higher spacer pressure in Li deposition are no longer evident. This trend is also reflected in the SEI and thermal stability of Li deposition.
It can be concluded that at a low deposition capacity, a higher spacer pressure promotes Li deposition, leading to a more stable SEI, easier deposition, reduced impedance, and improved thermal stability. However, when the deposition capacity is increased to 4 mAh/cm2, spacer pressure no longer significantly enhances these properties. This may be attributed to the fact that increased deposition capacity generates a significant expansion pressure from the Li metal deposition itself, which reduces the relative influence of the spacer pressure. The theoretical thickness of lithium deposition is 5 μm when the lithium deposition capacity is 1 mAh/cm2, and it increases to 20 μm when the capacity is 4 mAh/cm2. However, the actual thickness of lithium deposition often exceeds these theoretical values (5 μm or 20 μm). This discrepancy arises because the lithium deposition density achieved through electrodeposition is lower than that of a pristine lithium sheet. Additionally, under lower spacer pressure conditions, a thicker lithium deposition layer is produced, as the volume expansion in this scenario is greater than that observed under higher spacer pressure conditions [41]. Consequently, we attribute the diminishing returns of enhancement pressure at 4 mAh/cm2 to the expansion pressure associated with lithium deposition. Further investigation is required to understand how the internal pressure from Li metal deposition, caused by its own volume expansion, interacts with the external pressure.
Our study was conducted using a coin half-cell system. In future research, the method of using spacer pressure height as a proxy for the pressure variable can be generalized to full-cell systems. The most straightforward application is the coin full-cell, where researchers need only to replace the working and counter electrodes with positive and negative electrodes that are loaded with active material. The full-cell system allows for more comprehensive electrochemical experiments and cell performance testing and analysis compared to the half-cell system, yielding more reliable and extensive experimental results. Furthermore, the quantification and detection of pressure can be enhanced by incorporating appropriate pressure sensors to achieve a more accurate pressure range.
Supplementary Materials
The following supporting information can be downloaded at: https://www.mdpi.com/article/10.3390/pr13051599/s1, Table S1: Numerical and statistical information on various overpotentials under thin spacer condition (H = 1.0 mm Spacer); Table S2: Numerical and statistical information on various overpotentials under thick spacer condition (H = 1.5 mm Spacer); Table S3: Results of EIS experiments under thin spacer condition (H = 1.0 mm Spacer), best-fit data of equivalent circuit model for each cell; Table S4: Results of EIS experiments under thick spacer condition (H = 1.5 mm Spacer), best-fit data of equivalent circuit model for each cell.
Author Contributions
Conceptualization, M.X. and L.H.; data curation, M.X.; formal analysis, Y.Z. and H.F.; funding acquisition, L.H. and Y.Z.; investigation, M.X.; methodology, M.X. and L.H.; project administration, Y.Z. and H.F.; resources, L.H. and Y.Z.; software, M.X. and Y.Z.; supervision, L.H.; validation, M.X. and H.F.; visualization, M.X.; writing—original draft, M.X.; writing—review and editing, L.H. and H.F. All authors have read and agreed to the published version of the manuscript.
Funding
This research was funded by Tianjin Science and Technology Plan Project, grant number (NO.22PTZWHZ00050).
Data Availability Statement
The original contributions presented in this study are included in the article. Further inquiries can be directed to the corresponding authors.
Conflicts of Interest
Authors Yiqiang Zhao and Huiqun Fu were employed by Tianjin CETC New Energy Research Institute Co., Ltd. The remaining authors declare that the research was conducted in the absence of any commercial or financial relationships that could be construed as a potential conflict of interest.
Abbreviations
The following abbreviations are used in this manuscript:
| SEI | Solid–electrolyte interphase |
| EIS | Electrochemical impedance spectra |
| CE | Coulombic efficiency |
| SEM | Scanning electron microscopy |
| EDS | Energy-dispersive spectroscopy |
| DSC | Differential scanning calorimetry |
References
- Mousaei, A.; Naderi, Y.; Bayram, I.S. Advancing State of Charge Management in Electric Vehicles with Machine Learning: A Technological Review. IEEE Access 2024, 12, 43255–43283. [Google Scholar] [CrossRef]
- Yuan, S.; Kong, T.; Zhang, Y.; Dong, P.; Zhang, Y.; Dong, X.; Wang, Y.; Xia, Y. Advanced Electrolyte Design for High-Energy-Density Li-Metal Batteries under Practical Conditions. Angew. Chem. Int. Ed. 2021, 60, 25624–25638. [Google Scholar] [CrossRef]
- Wu, B.; Chen, C.; Raijmakers, L.H.J.; Liu, J.; Danilov, D.L.; Eichel, R.; Notten, P.H.L. Li-growth and SEI engineering for anode-free Li-metal rechargeable batteries: A review of current advances. Energy Storage Mater. 2023, 57, 508–539. [Google Scholar] [CrossRef]
- Liu, B.; Zhang, J.; Xu, W. Advancing Lithium Metal Batteries. Joule 2018, 2, 833–845. [Google Scholar] [CrossRef]
- Cheng, X.; Zhang, R.; Zhao, C.; Zhang, Q. Toward Safe Lithium Metal Anode in Rechargeable Batteries: A Review. Chem. Rev. 2017, 117, 10403–10473. [Google Scholar] [CrossRef] [PubMed]
- Chen, X.; Zhao, B.; Yan, C.; Zhang, Q. Review on Li Deposition in Working Batteries: From Nucleation to Early Growth. Adv. Mater. 2021, 33, 2004128. [Google Scholar] [CrossRef]
- Patel, M.; Mishra, K.; Banerjee, R.; Chaudhari, J.; Kanchan, D.K.; Kumar, D. Fundamentals, recent developments and prospects of lithium and non-lithium electrochemical rechargeable battery systems. J. Energy Chem. 2023, 81, 221–259. [Google Scholar] [CrossRef]
- Liang, H.; Wang, L.; Sheng, L.; Xu, H.; Song, Y.; He, X. Focus on the Electroplating Chemistry of Li Ions in Nonaqueous Liquid Electrolytes: Toward Stable Lithium Metal Batteries. Electrochem. Energy R. 2022, 5, 23. [Google Scholar] [CrossRef]
- Gao, M.; Li, H.; Xu, L.; Xue, Q.; Wang, X.; Bai, Y.; Wu, C. Lithium metal batteries for high energy density: Fundamental electrochemistry and challenges. J. Energy Chem. 2021, 59, 666–687. [Google Scholar] [CrossRef]
- Wei, Z.; Wang, X.; Zhou, M.; Papović, S.; Zheng, K.; Świerczek, K.; Wu, J.; Xin, X. Revitalizing Lithium Metal Batteries: Strategies for Tackling Dead Lithium Formation and Reactivation. Small 2024, 20, 2407395. [Google Scholar] [CrossRef]
- Louli, A.J.; Genovese, M.; Weber, R.; Hames, S.G.; Logan, E.R.; Dahn, J.R. Exploring the Impact of Mechanical Pressure on the Performance of Anode-Free Lithium Metal Cells. J. Electrochem. Soc. 2019, 166, A1291. [Google Scholar] [CrossRef]
- Xiao, J.; Li, Q.; Bi, Y.; Cai, M.; Dunn, B.; Glossmann, T.; Liu, J.; Osaka, T.; Sugiura, R.; Wu, B.; et al. Understanding and applying coulombic efficiency in lithium metal batteries. Nat. Energy 2020, 5, 561–568. [Google Scholar] [CrossRef]
- Jana, A.; García, R.E. Lithium dendrite growth mechanisms in liquid electrolytes. Nano Energy 2017, 41, 552–565. [Google Scholar] [CrossRef]
- Verma, P.; Maire, P.; Novák, P. A review of the features and analyses of the solid electrolyte interphase in Li-ion batteries. Electrochim. Acta 2010, 55, 6332–6341. [Google Scholar] [CrossRef]
- Thakur, A.K.; Kumar, A.; Park, H.; Kim, H.; Ahmed, M.S.; Saleque, A.M.; Vikram, M.P.; Saidur, R.; Ma, Y.; Hwang, J. Composite separators for internal thermal management in rechargeable lithium batteries: A review. J. Energy Storage 2023, 73, 108873. [Google Scholar] [CrossRef]
- Dai, F.; Cai, M. Best practices in lithium battery cell preparation and evaluation. Commun. Mater. 2022, 3, 64. [Google Scholar] [CrossRef]
- Zhou, Y. External pressure: An overlooked metric in evaluating next-generation battery performance. Curr. Opin. Electrochem. 2022, 31, 100916. [Google Scholar] [CrossRef]
- Fang, C.; Lu, B.; Pawar, G.; Zhang, M.; Cheng, D.; Chen, S.; Ceja, M.; Doux, J.; Musrock, H.; Cai, M.; et al. Pressure-tailored lithium deposition and dissolution in lithium metal batteries. Nat. Energy 2021, 6, 987–994. [Google Scholar] [CrossRef]
- Zhang, X.; Wang, Q.J.; Harrison, K.L.; Jungjohann, K.; Boyce, B.L.; Roberts, S.A.; Attia, P.M.; Harris, S.J. Rethinking How External Pressure Can Suppress Dendrites in Lithium Metal Batteries. J. Electrochem. Soc. 2019, 166, A3639. [Google Scholar] [CrossRef]
- Wang, H.; Han, Y.; Su, F.; Yi, Z.; Xie, L.; Sun, G.; Huang, X.; Chen, J.; Li, X.; Wang, Z.; et al. Internal pressure regulation enables reliable electrochemical performance evaluation of lithium-ion full coin cell. J. Power Sources 2024, 600, 234235. [Google Scholar] [CrossRef]
- Yuan, X.; Liu, B.; Mecklenburg, M.; Li, Y. Ultrafast deposition of faceted lithium polyhedra by outpacing SEI formation. Nature 2023, 620, 86–91. [Google Scholar] [CrossRef] [PubMed]
- Zhang, N.; Yu, S.; Abruña, H.D. Regulating lithium nucleation and growth by zinc modified current collectors. Nano Res. 2020, 13, 45–51. [Google Scholar] [CrossRef]
- Yang, C.; Yin, Y.; Zhang, S.; Li, N.; Guo, Y. Accommodating lithium into 3D current collectors with a submicron skeleton towards long-life lithium metal anodes. Nat. Commun. 2015, 6, 8058. [Google Scholar] [CrossRef]
- Zheng, G.; Lee, S.W.; Liang, Z.; Lee, H.; Yan, K.; Yao, H.; Wang, H.; Li, W.; Chu, S.; Cui, Y. Interconnected hollow carbon nanospheres for stable lithium metal anodes. Nat. Nanotechnol. 2014, 9, 618–623. [Google Scholar] [CrossRef]
- Jo, S.; Kwon, B.; Oh, J.; Lee, J.; Park, K.; Lee, K.T. The roles of nucleation and growth kinetics in determining Li metal morphology for Li metal batteries: Columnar versus spherical growth. J. Mater. Chem. A 2022, 10, 5520–5529. [Google Scholar] [CrossRef]
- Fan, Y.; Liao, J.; Luo, D.; Huang, Y.; Sun, F.; Nan, J. In situ formation of a lithiophilic surface on 3D current collectors to regulate lithium nucleation and growth for dendrite-free lithium metal anodes. Chem. Eng. J. 2023, 453, 139903. [Google Scholar] [CrossRef]
- Zhang, R.; Chen, X.; Chen, X.; Cheng, X.; Zhang, X.; Yan, C.; Zhang, Q. Lithiophilic Sites in Doped Graphene Guide Uniform Lithium Nucleation for Dendrite-Free Lithium Metal Anodes. Angew. Chem. Int. Ed. 2017, 56, 7764–7768. [Google Scholar] [CrossRef] [PubMed]
- Pei, A.; Zheng, G.; Shi, F.; Li, Y.; Cui, Y. Nanoscale Nucleation and Growth of Electrodeposited Lithium Metal. Nano Lett. 2017, 17, 1132–1139. [Google Scholar] [CrossRef]
- Yan, K.; Lu, Z.; Lee, H.; Xiong, F.; Hsu, P.; Li, Y.; Zhao, J.; Chu, S.; Cui, Y. Selective deposition and stable encapsulation of lithium through heterogeneous seeded growth. Nat. Energy 2016, 1, 16010. [Google Scholar] [CrossRef]
- Wood, K.N.; Kazyak, E.; Chadwick, A.F.; Chen, K.; Zhang, J.; Thornton, K.; Dasgupta, N.P. Dendrites and Pits: Untangling the Complex Behavior of Lithium Metal Anodes through Operando Video Microscopy. ACS Cent. Sci. 2016, 2, 790–801. [Google Scholar] [CrossRef]
- Bieker, G.; Winter, M.; Bieker, P. Electrochemical in situ investigations of SEI and dendrite formation on the lithium metal anode. Phys. Chem. Chem. Phys. 2015, 17, 8670–8679. [Google Scholar] [CrossRef] [PubMed]
- Chen, K.; Wood, K.N.; Kazyak, E.; LePage, W.S.; Davis, A.L.; Sanchez, A.J.; Dasgupta, N.P. Dead lithium: Mass transport effects on voltage, capacity, and failure of lithium metal anodes. J. Mater. Chem. A 2017, 5, 11671–11681. [Google Scholar] [CrossRef]
- Chen, S.; Niu, C.; Lee, H.; Li, Q.; Yu, L.; Xu, W.; Zhang, J.; Dufek, E.J.; Whittingham, M.S.; Meng, S.; et al. Critical Parameters for Evaluating Coin Cells and Pouch Cells of Rechargeable Li-Metal Batteries. Joule 2019, 3, 1094–1105. [Google Scholar] [CrossRef]
- Adams, B.D.; Zheng, J.; Ren, X.; Xu, W.; Zhang, J. Accurate Determination of Coulombic Efficiency for Lithium Metal Anodes and Lithium Metal Batteries. Adv. Energy Mater. 2018, 8, 1702097. [Google Scholar] [CrossRef]
- Mohammadi, A.; Djafer, S.; Sayegh, S.; Naylor, A.J.; Bechelany, M.; Younesi, R.; Monconduit, L.; Stievano, L. Assessing Coulombic Efficiency in Lithium Metal Anodes. Chem. Mater. 2023, 35, 2381–2393. [Google Scholar] [CrossRef]
- Li, B.; Chao, Y.; Li, M.; Xiao, Y.; Li, R.; Yang, K.; Cui, X.; Xu, G.; Li, L.; Yang, C.; et al. A Review of Solid Electrolyte Interphase (SEI) and Dendrite Formation in Lithium Batteries. Electrochem. Energy R. 2023, 6, 7. [Google Scholar] [CrossRef]
- Xu, R.; Yan, C.; Xiao, Y.; Zhao, M.; Yuan, H.; Huang, J. The reduction of interfacial transfer barrier of Li ions enabled by inorganics-rich solid-electrolyte interphase. Energy Storage Mater. 2020, 28, 401–406. [Google Scholar] [CrossRef]
- Jagger, B.; Pasta, M. Solid electrolyte interphases in lithium metal batteries. Joule 2023, 7, 2228–2244. [Google Scholar] [CrossRef]
- Wang, Q.; Zhao, C.; Wang, S.; Wang, J.; Liu, M.; Ganapathy, S.; Bai, X.; Li, B.; Wagemaker, M. Clarifying the Relationship between the Lithium Deposition Coverage and Microstructure in Lithium Metal Batteries. J. Am. Chem. Soc. 2022, 144, 21961–21971. [Google Scholar] [CrossRef]
- Zhou, M.; Feng, C.; Xiong, R.; Li, L.; Huang, T.; Li, M.; Zhang, Y.; Zhou, H. Molecular Insights into the Structure and Property Variation of the Pressure-Induced Solid Electrolyte Interphase on a Lithium Metal Anode. Acs. Appl. Mater. Inter. 2022, 14, 24875–24885. [Google Scholar] [CrossRef]
- Lim, H.; Nguyen, D.T.; Lochala, J.A.; Cao, X.; Zhang, J. Improving Cycling Performance of Anode-Free Lithium Batteries by Pressure and Voltage Control. Acs. Energy Lett. 2024, 9, 126–135. [Google Scholar] [CrossRef]
- Fan, Y.; Chen, H.; Yang, C.; Yang, Z.; Li, S.; Xu, Z.; Li, B.; Chen, Z.; Shang, Z.; Zheng, S.; et al. Investigating the pressure-induced evolution of solid electrolyte interphase on Li metal anodes: A ReaxFF molecular dynamics study. J. Energy Storage 2024, 91, 111966. [Google Scholar] [CrossRef]
- Gan, L.; Chen, R.; Xu, X.; Zan, M.; Li, Q.; Wang, Q.; Yu, X.; Li, H. Comparative study of thermal stability of lithium metal anode in carbonate and ether based electrolytes. J. Power Sources 2022, 551, 232182. [Google Scholar] [CrossRef]
- Jiang, F.; Yang, S.; Cheng, X.; Shi, P.; Ding, J.; Chen, X.; Yuan, H.; Liu, L.; Huang, J.; Zhang, Q. Thermal safety of dendritic lithium against non-aqueous electrolyte in pouch-type lithium metal batteries. J. Energy Chem. 2022, 72, 158–165. [Google Scholar] [CrossRef]
- Hellweg, L.; Beuse, T.; Winter, M.; Börner, M. Influence of Lithium Metal Deposition on Thermal Stability: Combined DSC and Morphology Analysis of Cyclic Aged Lithium Metal Batteries. J. Electrochem. Soc. 2023, 170, 040530. [Google Scholar] [CrossRef]
- Puthusseri, D.; Parmananda, M.; Mukherjee, P.P.; Pol, V.G. Probing the Thermal Safety of Li Metal Batteries. J. Electrochem. Soc. 2020, 167, 120513. [Google Scholar] [CrossRef]
- Lu, B.; Cheng, D.; Sreenarayanan, B.; Li, W.; Bhamwala, B.; Bao, W.; Meng, Y.S. Key Parameters in Determining the Reactivity of Lithium Metal Battery. Acs. Energy Lett. 2023, 8, 3230–3238. [Google Scholar] [CrossRef]
- Pirsaheb, M.; Seifi, H.; Gholami, T.; Ganduh, S.H.; Jasim, L.S.; Mahdi, M.A.; Salavati-Niasari, M. Thermal analysis techniques for evaluating the thermal stability of battery materials: A comprehensive review. J. Anal. Appl. Pyrol 2023, 174, 106136. [Google Scholar] [CrossRef]
Disclaimer/Publisher’s Note: The statements, opinions and data contained in all publications are solely those of the individual author(s) and contributor(s) and not of MDPI and/or the editor(s). MDPI and/or the editor(s) disclaim responsibility for any injury to people or property resulting from any ideas, methods, instructions or products referred to in the content. |
© 2025 by the authors. Licensee MDPI, Basel, Switzerland. This article is an open access article distributed under the terms and conditions of the Creative Commons Attribution (CC BY) license (https://creativecommons.org/licenses/by/4.0/).