1. Introduction
In modern power systems, Gas Insulated Switchgear (GIS) disconnectors are significant core equipment. They mainly play the function of achieving circuits’ electrical isolation via mechanical operation and guaranteeing the secure operation of the power grid [
1,
2]. Nonetheless, GIS disconnectors tend to have faults. Thus, over the past few years, their mechanical state monitoring has been focused by power system specialists [
3,
4,
5]. Particularly, the diagnostic approaches based upon the vibration signals, drive motor power, and drive motor current have aroused great attention.
Because of their easy operation and high diagnostic efficiency, fault diagnosis approaches based upon the drive motor current have been widely favored. The current signal of the drive motor is a vital element of the disconnector operation. It directly embodies the changes in mechanical load in the switching procedure. Hence, GIS disconnectors’ mechanical faults can be effectively diagnosed by analyzing the motor current. A research project put forward a GIS disconnector fault diagnosis approach based upon current feature values as well as a random forest algorithm and took pivotal time points and peak values in the motor current signal as the model inputs. On this basis, high diagnosis accuracy was achieved. At the same time, this method integrated intelligent algorithms, which not only overcome the traditional manual analyses’ inefficiencies, but also greatly heightened the intelligent diagnosis level [
6]. Based on the current analysis, several researchers have crafted a GIS disconnector operation state monitoring device to gather the drive motor’s real-time current waveforms using sensors. Through an analysis of the current signal variation modes during opening and closing operations, the system decides the completion situation of the operation and offers an effective technical solution for state monitoring [
7]. Although great advancement has been made in GIS disconnector fault diagnosis through the use of the motor current, this domain still has some challenges. For example, in intricate operation situations, supply voltage fluctuations are likely to influence motor current signals. This restricts characteristic extraction and diagnosis precision. Given that GIS disconnectors become more complicated and their operation contexts become more diversified, mere reliance on motor current signals may not be enough to holistically embody their mechanical status.
Based on current-based sensing, drive motor power-based monitoring approaches have been further developed. Power signals refer to the cutting-edge tool originating from current signals, and they can embody variations in motor mechanical load in a more intuitive manner. Researchers have proposed a GIS disconnector mechanical fault diagnosis model based on motor power signals, integrating the motion principles of operating mechanisms and a secondary circuit design. Through an analysis of trip failure faults in three-position GIS disconnectors, real-time power signal acquisition and dynamic monitoring enable precise fault type identification [
8]. Another study experimentally validated the positive correlation between the power and mechanical load during GIS disconnector switching processes and established a mathematical model relating the drive motor’s input power to output power [
9]. Although the power signal-based methods are advantageous in the diagnosis of a mechanical fault, they are still confronted with some challenges. In fact, power signals alone are unable to precisely decide the contact state of the conductive elements in the disconnector. Due to the fact that power signals are reliant on current and voltage measurements, sensor sensitivity and installation positioning are likely to influence their accuracy.
With further progress, researchers have started to delve into state sensing approaches based upon vibration signals. When high-sensitivity vibration sensors are used to identify GIS disconnector operational vibration signals and they are combined with cutting-edge signal processing algorithms, it is possible to extract abundant diagnostic characteristics. For instance, cutting-edge time–frequency analysis approaches like Wavelet Transform have been used for decomposing and extracting features from vibration signals. While effectively filtering noise in intricate operation settings, these techniques extract pivotal features that embody changes in mechanical states [
10]. In other studies, the Second-Order Synchro-Squeezing Fourier Transform (FSST2) has been integrated with deep transfer learning algorithms, and pre-trained models have been employed to identify vibration signal modes in GIS disconnectors. This reinforces diagnosis precision and robustness to a great extent [
11]. Nonetheless, existing techniques for extraction of vibration signal features are still comparatively restricted.
In this study, vibration signals during the switching procedures of GIS disconnectors are focused. By applying variational mode decomposition (VMD) followed by a bispectrum-based sideband feature enhancement technique, this paper aims to extract effective features from vibration signals to accurately diagnose jamming faults in GIS disconnectors.
2. Introduction to Mathematical Principles
Compared with traditional methods that divide vibration spectra into equally spaced frequency bands, the proposed approach demonstrates significant advantages. Prior studies often apply fixed-band segmentation with limited frequency coverage, which fails to reflect the actual mechanical behavior and restricts diagnostic precision. In contrast, our method employs VMD to decompose vibration signals into modes with concentrated spectral energy, each with potential physical significance. These modal components better capture the mechanical characteristics of components under different dynamic conditions. Furthermore, by applying bispectral analysis to quantify sideband asymmetry within each mode, we are able to reveal nonlinear coupling phenomena associated with mechanical faults such as jamming. This combined method allows for more sensitive and interpretable fault identification, particularly for complex systems like GIS disconnectors, which include both gear-driven structures and impact-type motion features.
The typical vibration curve of the closing process of a GIS disconnector is shown in
Figure 1.
As observed in
Figure 1, the vibration signal exhibits broadband and non-stationary characteristics. It can also be reasonably inferred that the sensitivity of vibration signals to the initial contact time point varies among different GIS disconnectors or at different positions of the same disconnector. To accurately extract impulse features from the vibration signal, this paper employs the variational mode decomposition (VMD) algorithm [
11,
12,
13]. VMD is a decomposition method for non-stationary signals, the core idea of which is to decompose the original signal into multiple Intrinsic Mode Functions (IMFs), each concentrated in a specific frequency band, thus enabling multi-scale signal analysis. When applied to vibration signals, VMD effectively separates impulse features from background noise, providing a reliable means for precise feature identification.
The mathematical process of the VMD algorithm can be expressed as follows: The core objective of the VMD algorithm is to decompose the input signal into several Intrinsic Mode Functions (IMFs), ensuring that each mode’s frequency spectrum is concentrated in a specific frequency band. Assuming the input signal is
f(
t), its decomposition can be represented as follows:
where
uk(
t) represents the
k-th modal component of the signal, and
K is the total number of modal components.
To ensure that each mode’s frequency spectrum is concentrated within a specific frequency band, VMD applies frequency center modulation to each modal component. The modulated modal component can be expressed as follows:
where
represents the center frequency of the
k-th mode.
The key objective of VMD is to minimize the total bandwidth of all modal components. This bandwidth measure is obtained by computing the instantaneous frequency derivative of the analytic signal, which is derived using the Hilbert transform. The mathematical representation is given by the following:
where
represents the Hilbert transform. Therefore, the optimization objective function of VMD is defined as minimizing the sum of the bandwidths of all modes. By minimizing this term, the frequency energy of each mode is ensured to be concentrated around its center frequency, thereby achieving efficient mode decomposition. The optimization function is formulated as follows:
To introduce the signal reconstruction constraint, VMD employs the Lagrange multiplier method. This ensures that the decomposed modal components can accurately reconstruct the original signal while guaranteeing that the sum of all modal components satisfies the signal reconstruction condition. The Lagrange function is expressed as follows:
During the optimization process, the modal components and center frequencies are updated iteratively using the following equations:
To update the center frequencies, the following equation is used:
Through the above iterative process, VMD can decompose the input signal into several modal components.
To optimize the decomposition further, a target function is introduced with the objective of minimizing the power spectral entropy (PSE), ensuring that each mode retains its key energy characteristics while reducing redundancy. The objective function is defined as follows:
Before optimization begins, the initial range and step size of α are set, typically based on empirical knowledge or signal characteristics. Within the predefined range of α, a stepwise testing approach is employed. For each tested α value, the decomposition is performed, and the objective function value is calculated. The optimal α is chosen as the one that minimizes the objective function value. Finally, it is determined that α = 2000 achieves the optimization goal.
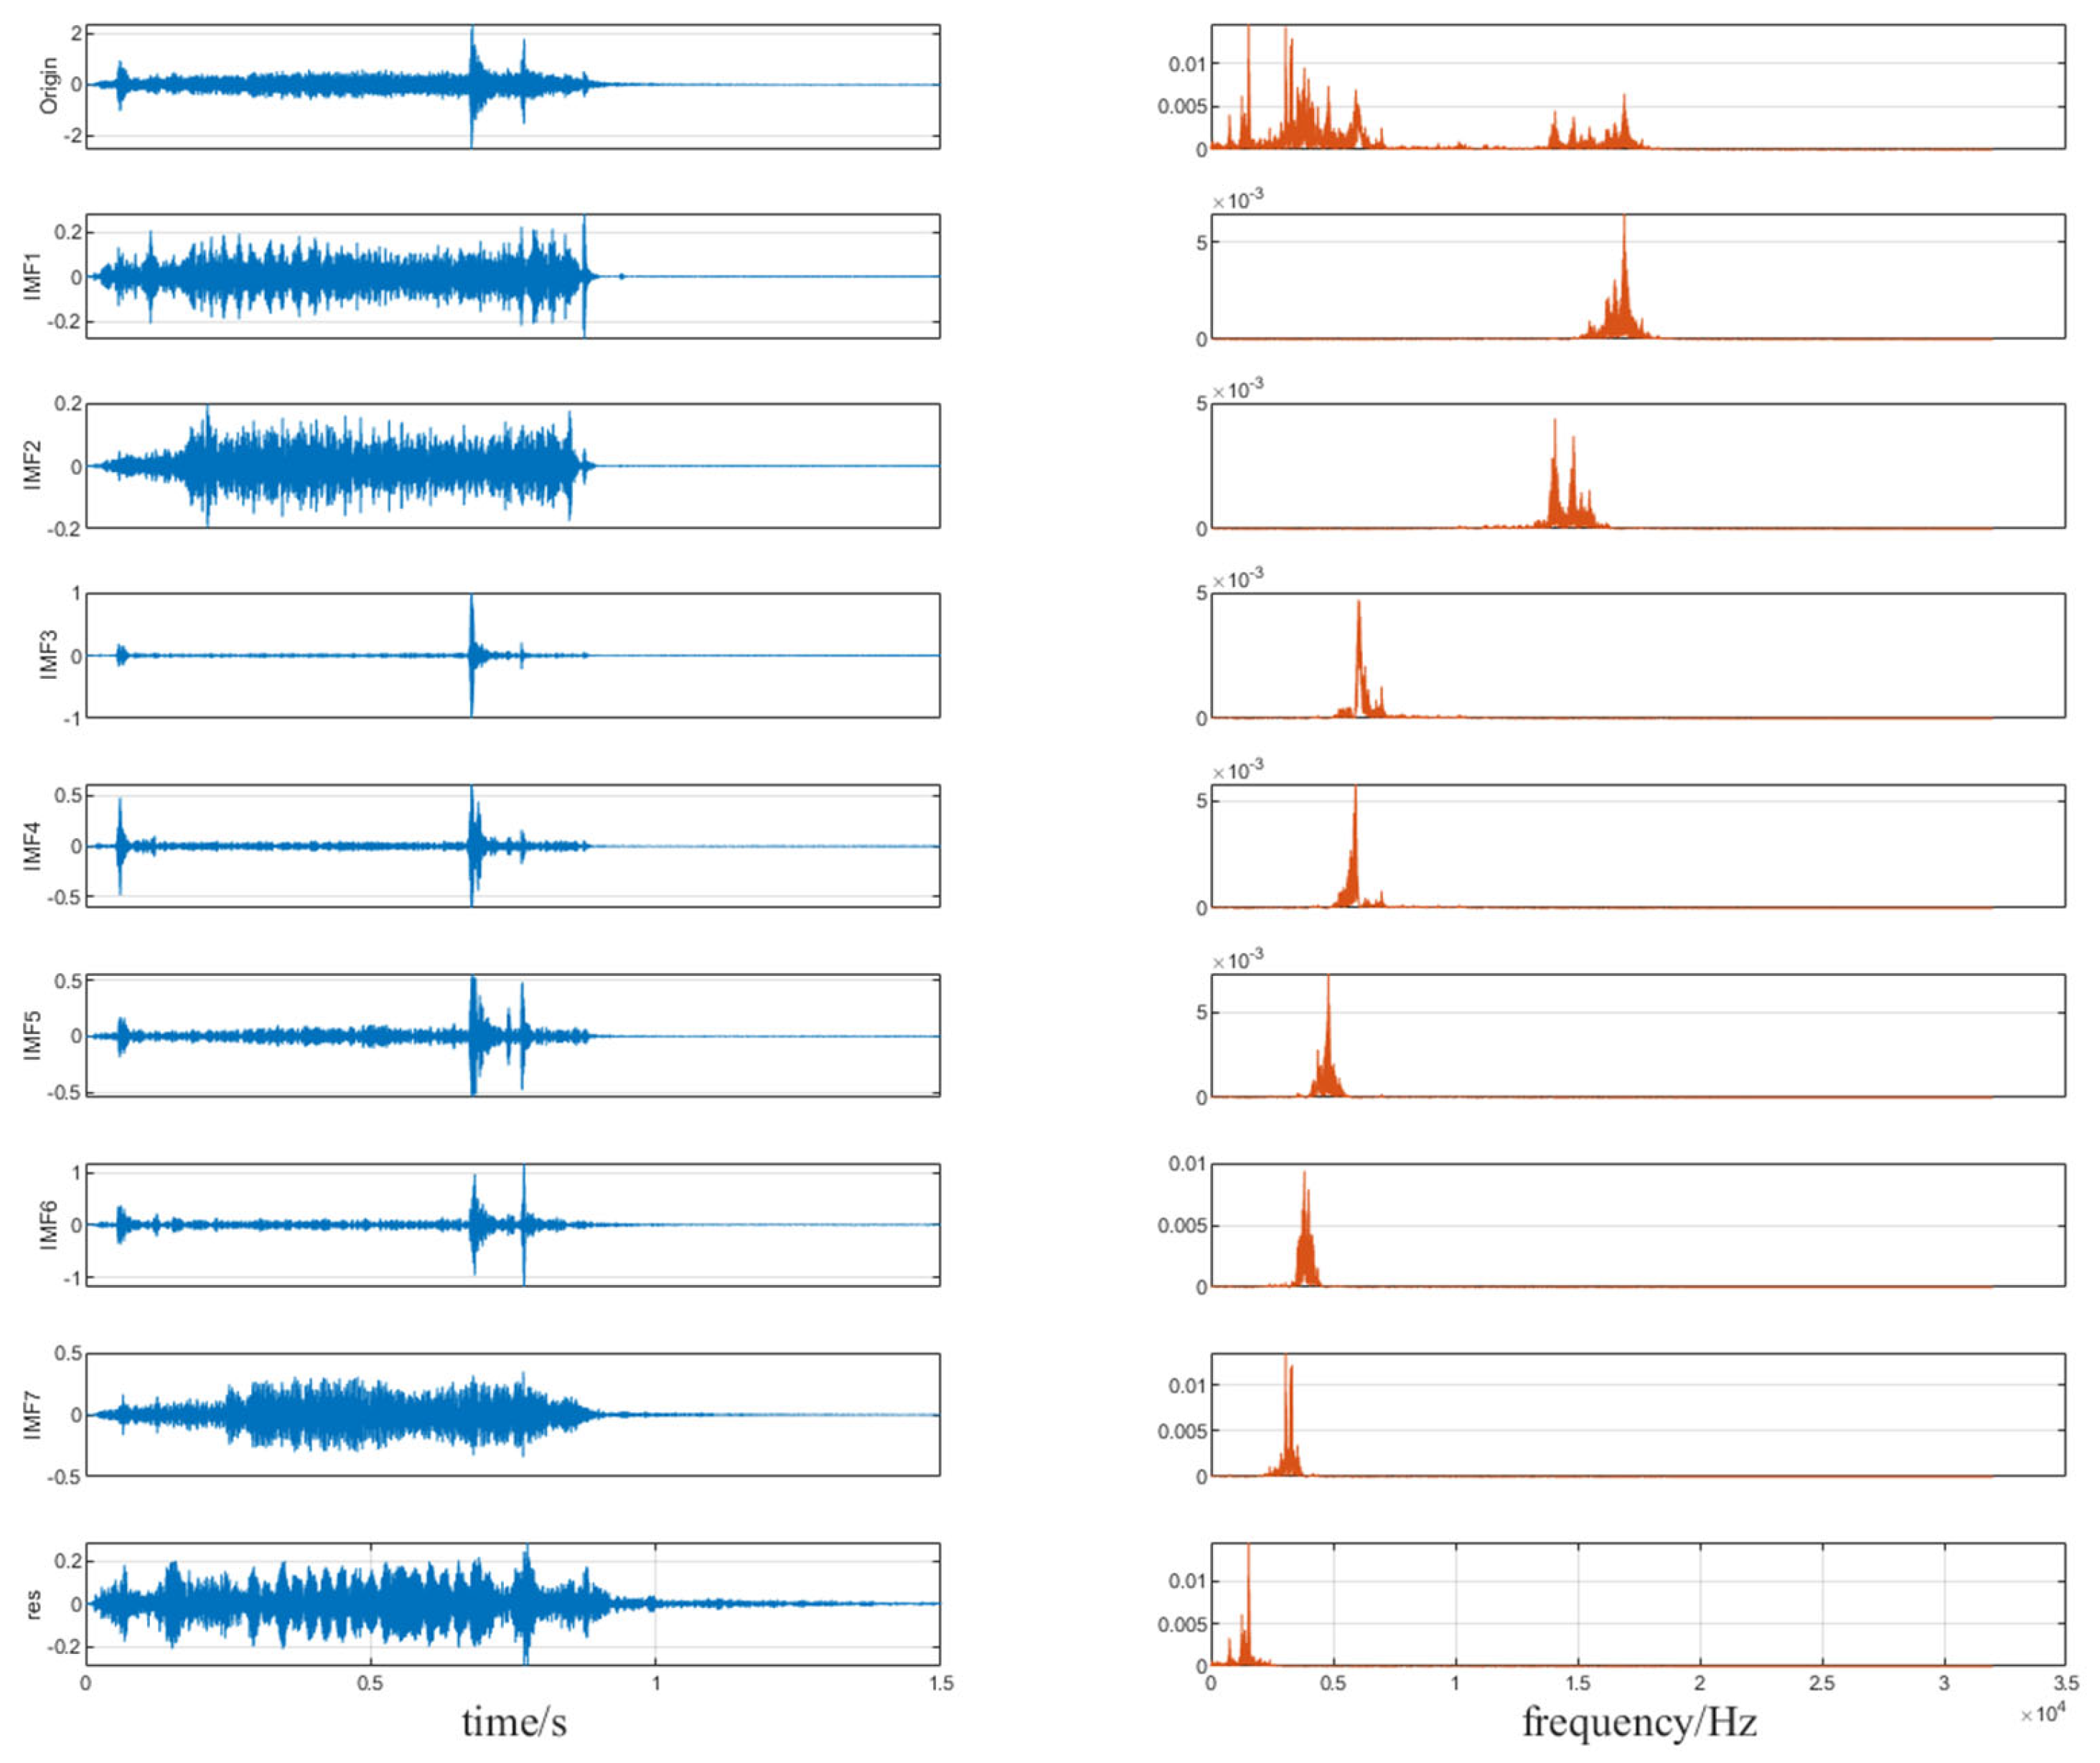
By applying the aforementioned modal decomposition process to the vibration signal, the following decomposition results are obtained in
Figure 2:
In our implementation, the number of decomposition modes was set to eight. This selection was based on the empirical spectral analysis of vibration signals from various GIS disconnector units, where approximately eight prominent center frequencies were consistently observed. We also tested decomposition settings ranging from six to ten modes, and eight modes yielded the best balance between feature concentration and classification performance. While the original spectral plots were not included due to the variability across different devices, we emphasize that this selection reflects a trade-off between model complexity and physical interpretability. Each mode is assumed to correspond to mechanical structures or combinations of components with similar dynamic characteristics, making the eight-mode decomposition both practical and physically meaningful.
Through VMD decomposition, 16 modal components and their corresponding center frequencies were extracted from the signal. These center frequencies have clear physical significance in the mechanical operation of the rotating mechanism. For example, low-frequency modes typically reflect the overall rotational stability or inertial effects, while high-frequency modes are closely related to gear meshing, bearing vibrations, or the dynamic characteristics of localized mechanical components.
However, under jamming fault conditions, mechanical characteristics change, such as increased local friction or enhanced nonlinear coupling, leading to significant variations in the sideband characteristics of certain center frequencies. These changes are often manifested as a redistribution of energy, increased sideband asymmetry, and enhanced frequency coupling, making them critical features for identifying jamming faults.
Bispectral analysis refers to a very appropriate instrument for analyzing these complicated signal features. The bispectrum is a third-order statistical measure. While revealing the signal’s frequency elements, it captures different frequencies’ nonlinear coupling and modulation effects. In comparison to conventional spectral analysis, the bispectrum is not sensitive to Gaussian noise, so that it is more robust in the extraction of frequency sidebands’ fine details under jamming fault situations. Apart from that, the phase coupling and frequency interaction in the signal is quantified by the bispectrum. This offers distinct advantages in the analysis of mechanical nonlinear actions.
Hence, a bispectral analysis is conducted to extract sideband features from the 16 modal components acquired via VMD. Meanwhile, the bispectral features of every center frequency as well as its sidebands are quantified to reveal the nonlinear changes under jamming fault situations.
Furthermore, the feature extraction approach based upon bispectral analysis as well as its application in fault diagnosis will be comprehensively introduced.
3. Definition of Bispectrum
The bispectrum is a third-order statistical characteristic of a signal, used to reveal the nonlinear interactions and phase coupling relationships between different frequency components. For a time-series signal
x(
t), its bispectrum is defined as follows [
14,
15,
16,
17,
18]:
where
denotes the expectation operator and
is the Fourier transform.
is the complex conjugate of
. The bispectrum can reveal whether
and
interact nonlinearly to generate a new frequency component
. If the bispectrum value is significant, it indicates the presence of frequency coupling. Unlike traditional power spectral analysis, which disregards phase information, the bispectrum retains phase relationships, allowing for the quantification of nonlinear phase coupling in the signal.
Since real-world signals are finite-length time series, the mathematical expectation of the bispectrum needs to be estimated by averaging over multiple segments of data. Let
be the
n-th segment of the signal; then, the bispectrum estimation formula is given by the following:
Bispectrum-based sideband information extraction primarily focuses on the frequency interaction effects around the center frequency
. The extraction method quantifies the asymmetry of sidebands on both sides of the center frequency.
The numerator in (11) quantifies the energy difference between the two sides of the center frequency. When the energy on the high-frequency side is greater, it indicates that high-frequency nonlinear effects or high-frequency modulation may be enhanced in the system. Conversely, if the energy on the low-frequency side is greater, it may reflect low-frequency dynamic effects dominating the system, such as inertia effects or enhanced low-frequency vibrations.
The denominator normalizes the asymmetry index, ensuring that it remains within a comparable range. This allows the energy distribution of different modal components and frequency bands to have a consistent measurement standard. The normalization ensures that the index only reflects the relative difference between both sides’ energy, without being affected by absolute amplitude values.
If the result equals 0, it means the energy on both sides of the center frequency is completely symmetrical, indicating a balanced vibration frequency distribution and weak modulation effects. If the result is greater than 0, the energy on the high-frequency side is larger, which may indicate enhanced high-frequency modulation or the nonlinear coupling of rigid components. If the result is less than 0, the energy on the low-frequency side is larger, which could correspond to low-frequency nonlinear effects or significant influence from slow dynamic processes.
Quantifying the asymmetry of sidebands around the center frequency fundamentally reflects whether the frequency components’ energy distribution in the signal is balanced. This is crucial for revealing modulation characteristics and nonlinear coupling effects in the system.
In mechanical systems, the symmetry of sidebands is typically influenced by dynamical behaviors, such as vibration, friction, meshing, and other nonlinear processes. These effects cause frequency components to shift in their distribution on either side of the center frequency.
If the sideband energy distribution is balanced, it suggests that the system’s vibration characteristics are relatively stable, with uniform coupling among frequency components. If the sidebands show significant asymmetry, it could indicate asymmetric dynamic effects or changes in modulation signals, such as high-frequency modulation enhancement due to faulty components and the suppression of low-frequency vibrations due to system constraints. By quantitatively analyzing sideband asymmetry, frequency feature variations can be captured more sensitively. This highlights nonlinear behaviors and dynamic anomalies within the signal, providing critical information for condition monitoring and fault diagnosis.
The final objective of this section is to construct a feature matrix for the vibration signal. Since the previous section has already extracted modal signals with multiple center frequencies, the purpose of this section can be represented by the following (12):
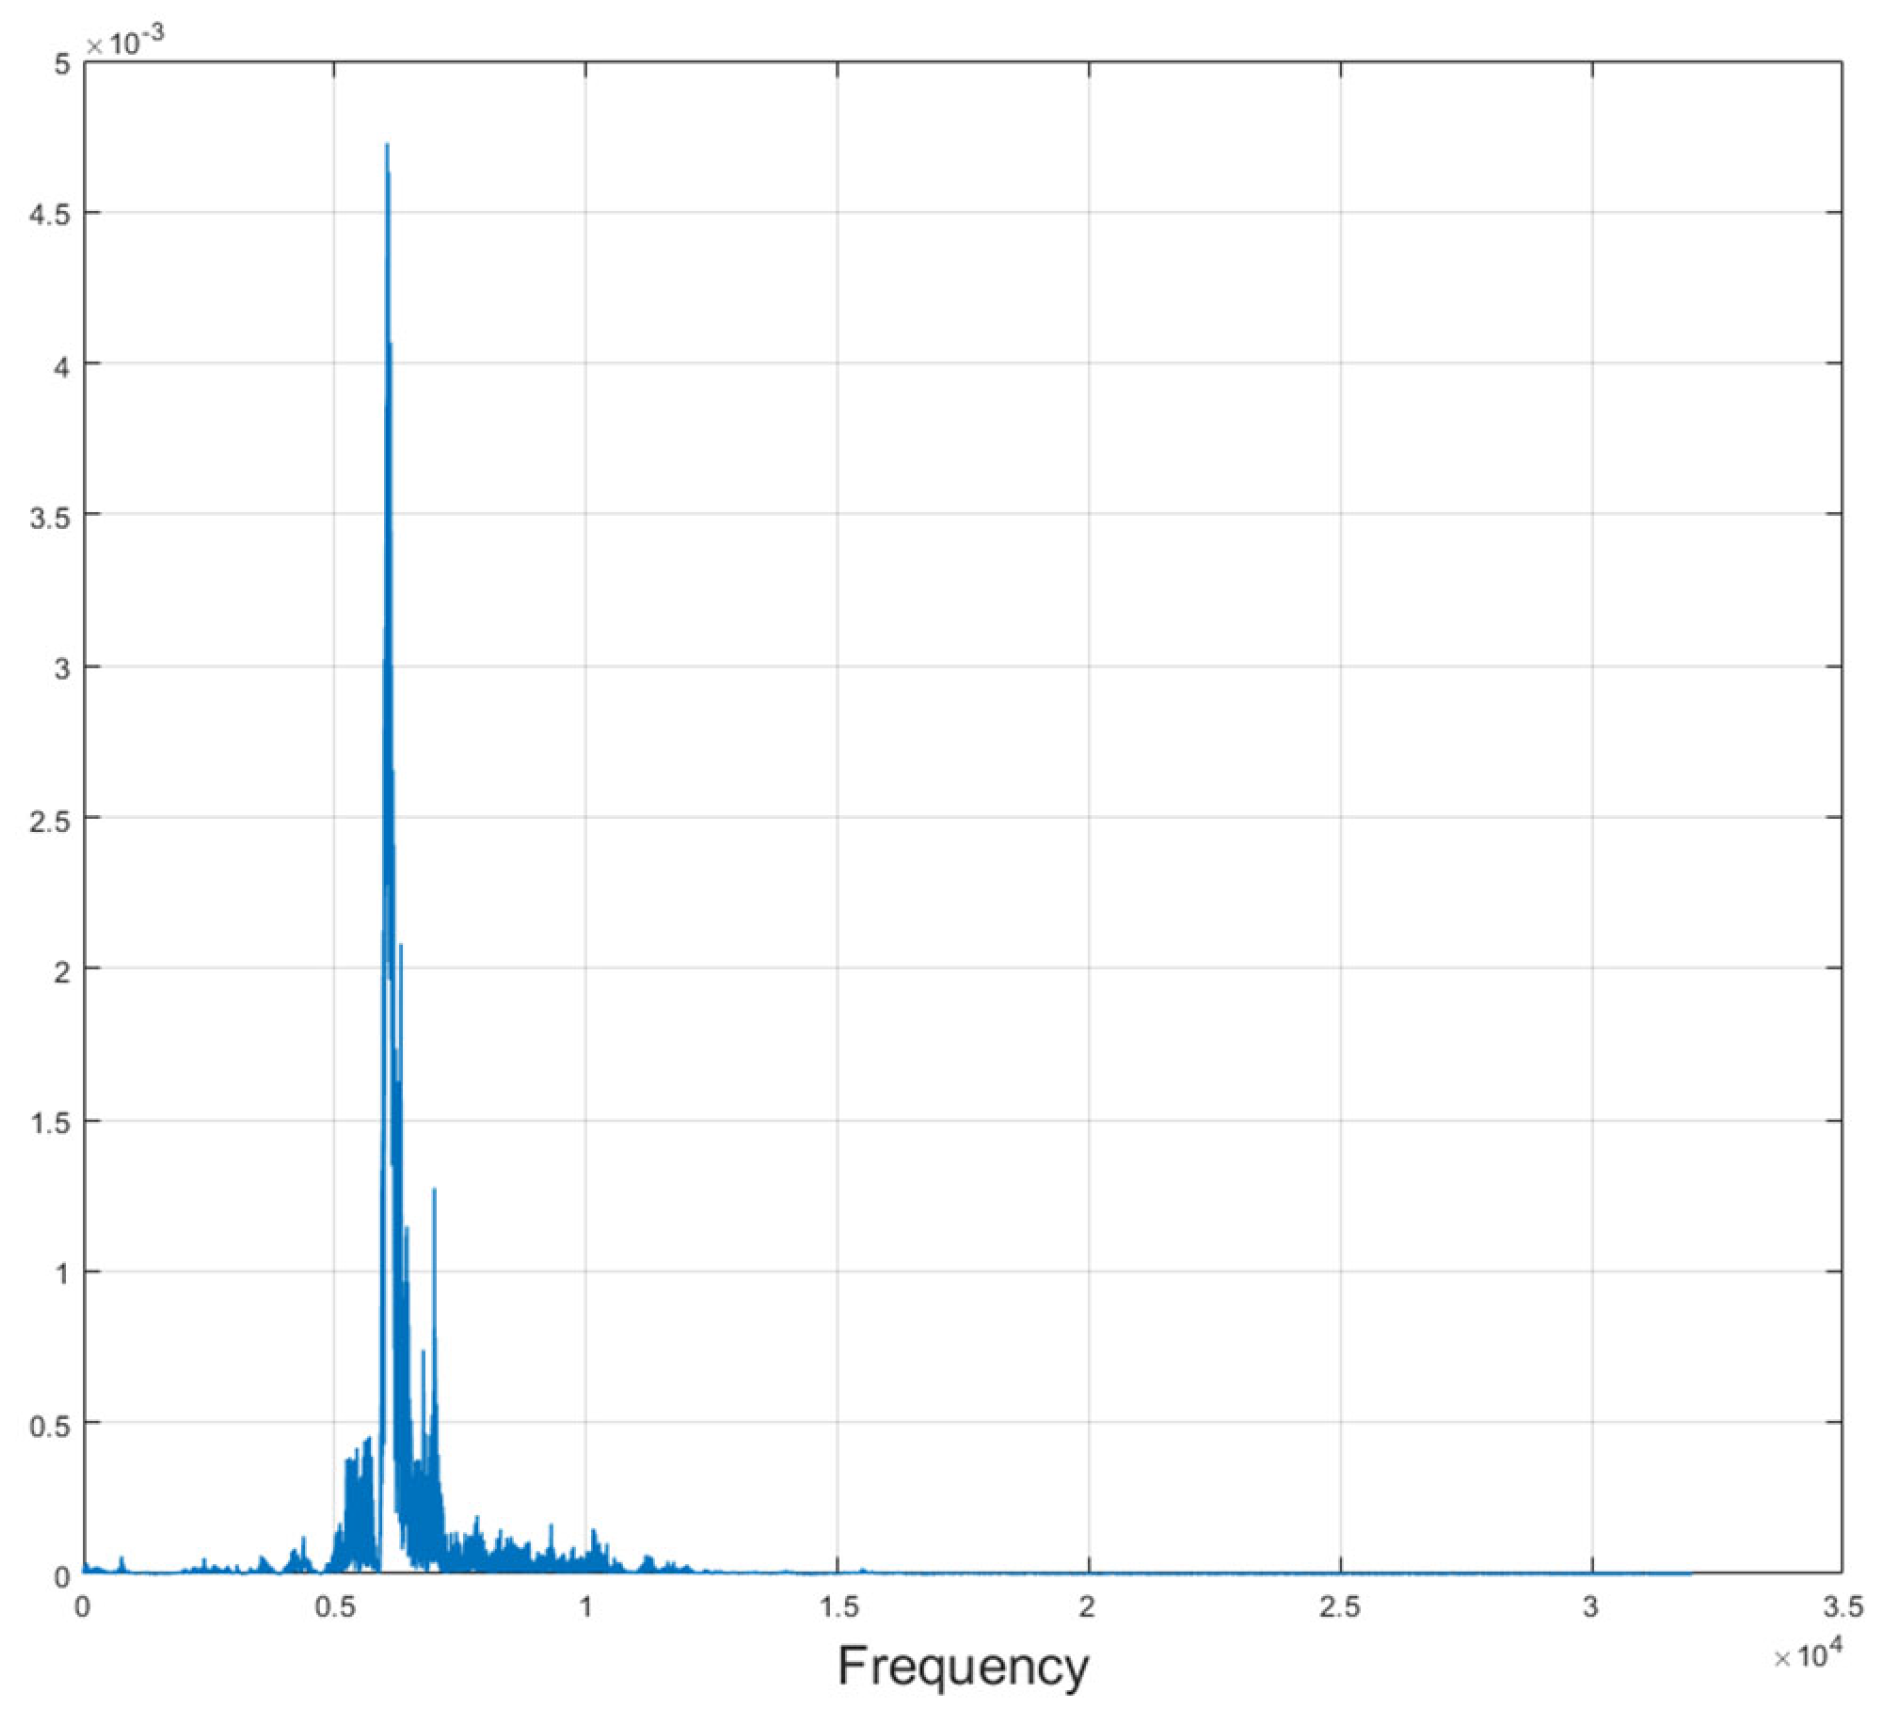
That is, for each modal component, asymmetry extraction is performed within a bandwidth of ±Δ
f around its center frequency. The value of Δ
f can be determined based on the frequency distribution results of each mode obtained in the previous section, as illustrated in
Figure 3.
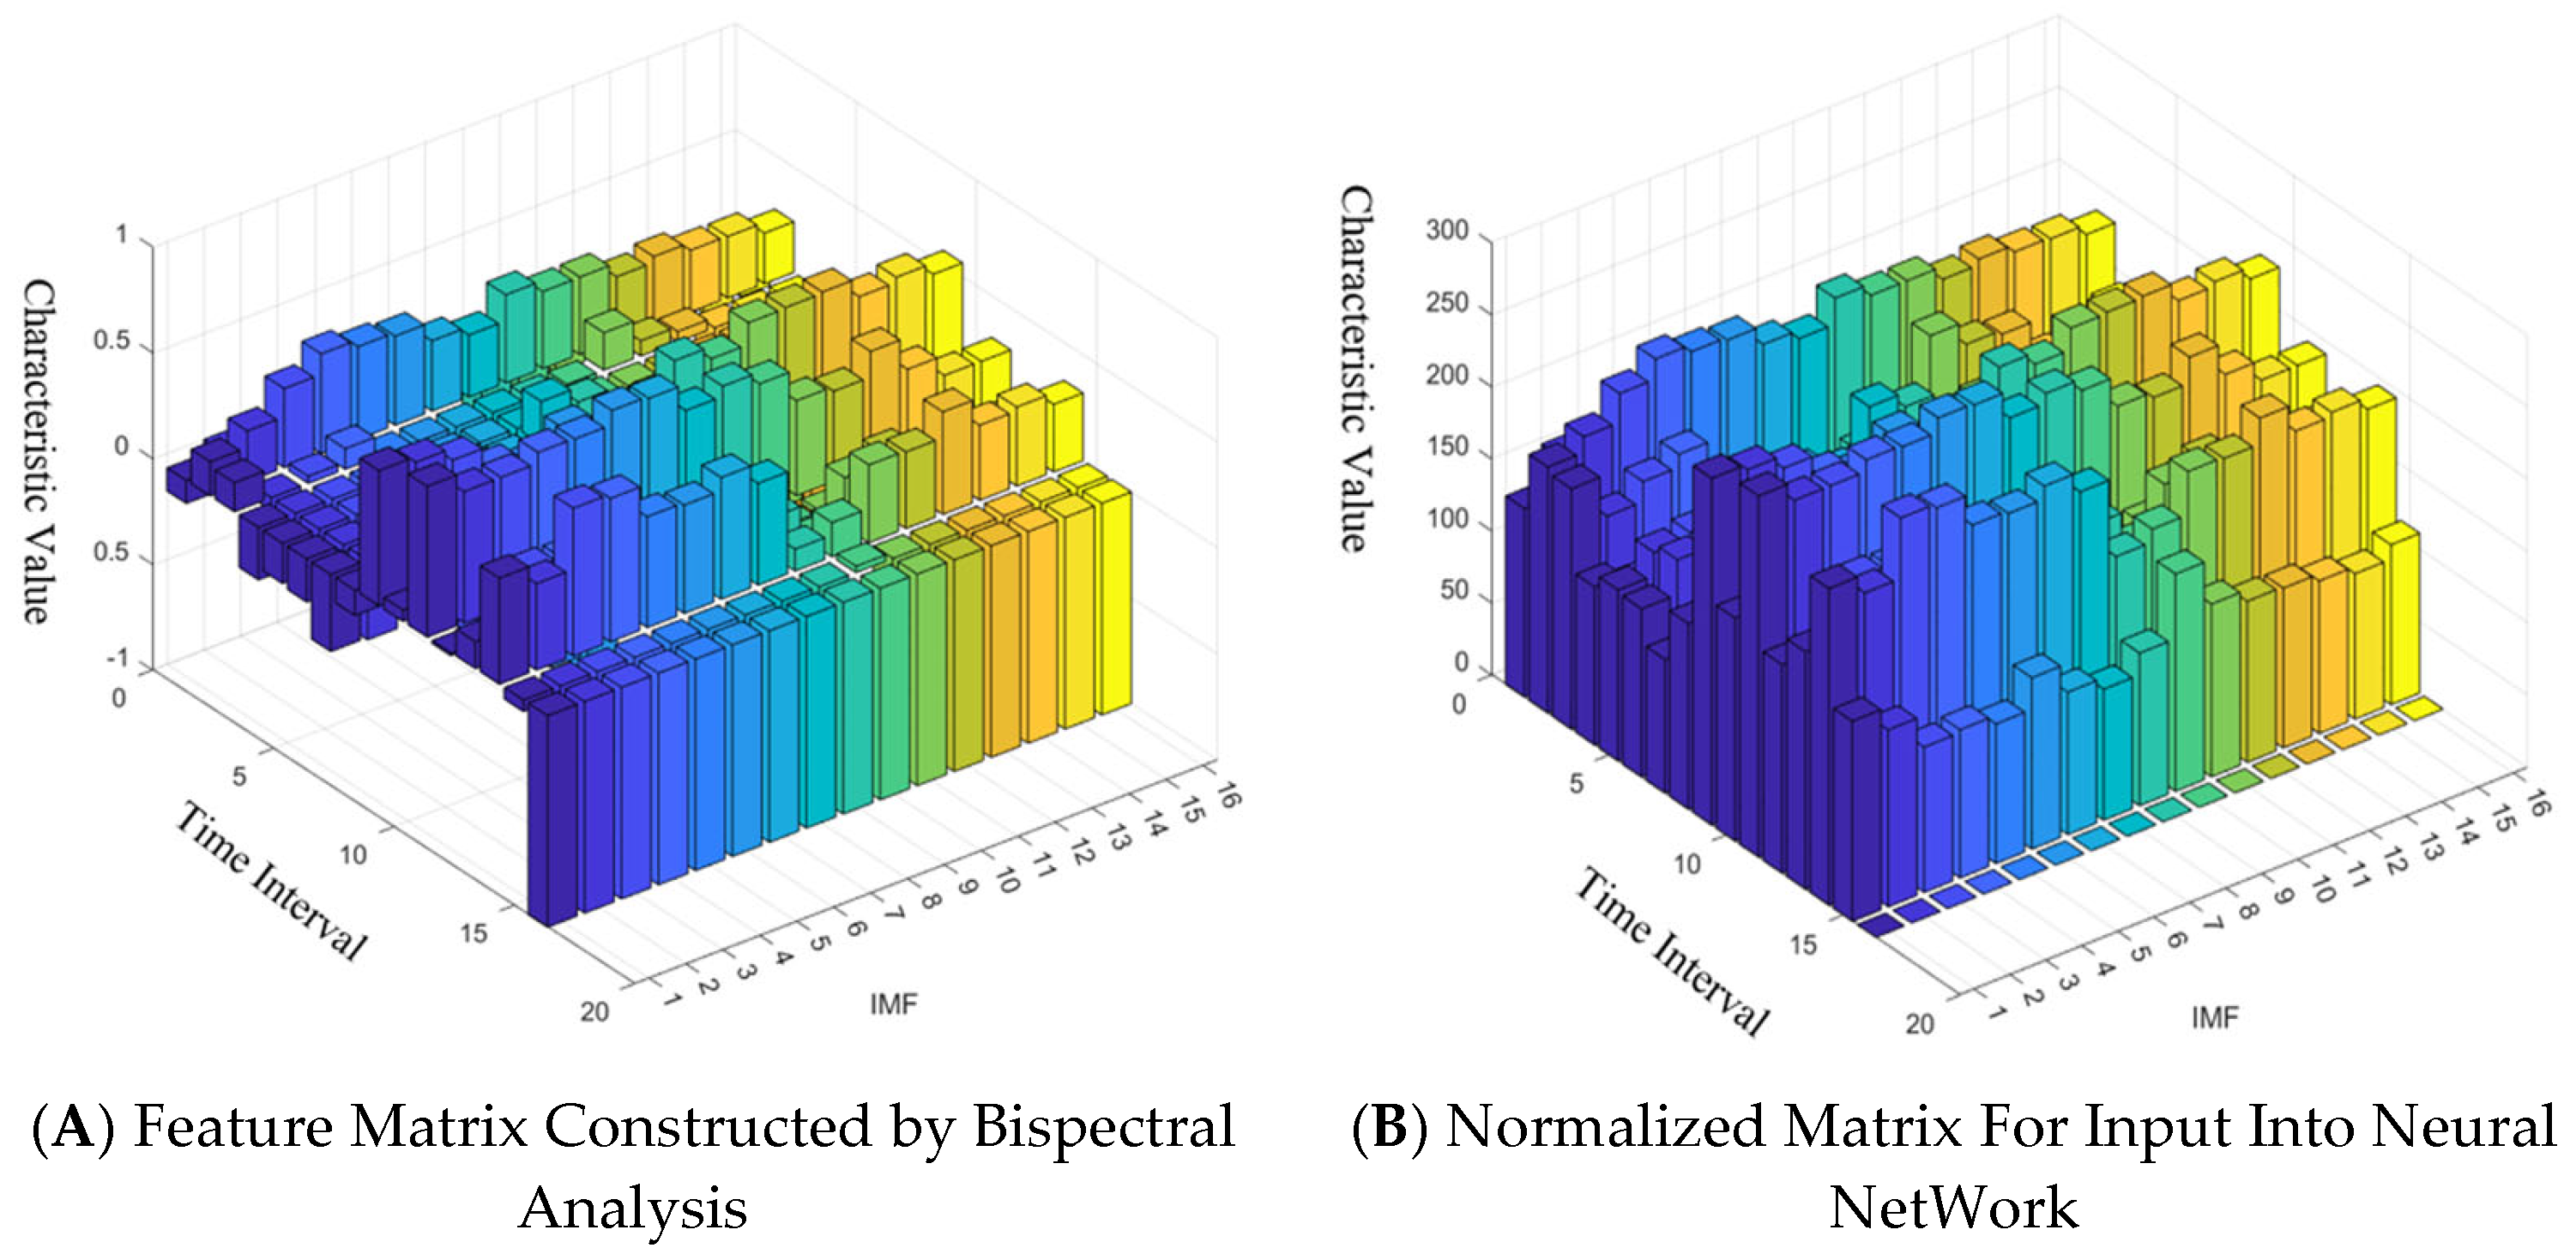
The feature matrix constructed using the above algorithm, after normalization to the 0–255 range, is shown in
Figure 4, different colors are used to distinguish various modal components derived from the variational mode decomposition (VMD). Each color corresponds to a different mode, representing distinct frequency components or dynamic behaviors in the vibration signal.
The sideband feature extraction method has greater significance in vibration signal analysis compared to the method of separating the vibration signal into equal-spaced frequency bands and calculating energy. The traditional equal-spaced frequency band separation method divides the entire frequency spectrum into fixed-width bands and calculates the energy in each band. This method has a certain reference value when the signal spectrum characteristics are uniformly distributed, or the target characteristic frequency is unknown. However, it has several significant drawbacks.
First, equal-spaced separation ignores possible modulation effects and sideband characteristics in the signal, making it unable to accurately capture the nonlinear characteristics specific to mechanical faults. Second, given that the frequency bands have a fixed width, it is hard to adjust to energy distributions of different frequency elements, which may trigger a blurred feature and declined extraction accuracy. In comparison, the sideband feature extraction approach analyzes the center frequency’s energy distribution, so that it can more intuitively reveal modulation actions and nonlinear coupling features in vibration signals. To be specific, this approach firstly decides the target center frequency. Furthermore, a specific range of sidebands are set on both sides for quantifying the high-frequency and low-frequency sides’ energy difference. At the same time, such a feature extraction approach is conductive to effectively capturing modulation effects induced by mechanical faults or the asymmetric sideband distribution caused by poor gear meshing. The sideband feature extraction could calculate sideband asymmetry to explicitly manifest the operation status of the mechanical system and greatly heighten the fault diagnosis sensitivity and specificity.
Based on the target fault’s physical features, the sideband feature extraction approach can conduct the flexible adjustment of the sideband range to accurately extract a crucial frequency message in different application situations. Due to such a targeted method, it obtains a unique edge in identifying complicated mechanical systems’ dynamic behavior. In comparison, fixed frequency segmentation makes the equal-spaced frequency band separation method incapable of dynamically adjusting to different mechanical states or fault categories. As a result, it is easy to lose significant characteristics. Therefore, in terms of physical significance in feature representation, as well as enhancing diagnostic performance and robustness, the sideband feature extraction method far surpasses the energy calculation method based on equal-spaced frequency band separation. It provides a more effective tool and theoretical support for the refined analysis of vibration signals.
4. Experiment and Analysis
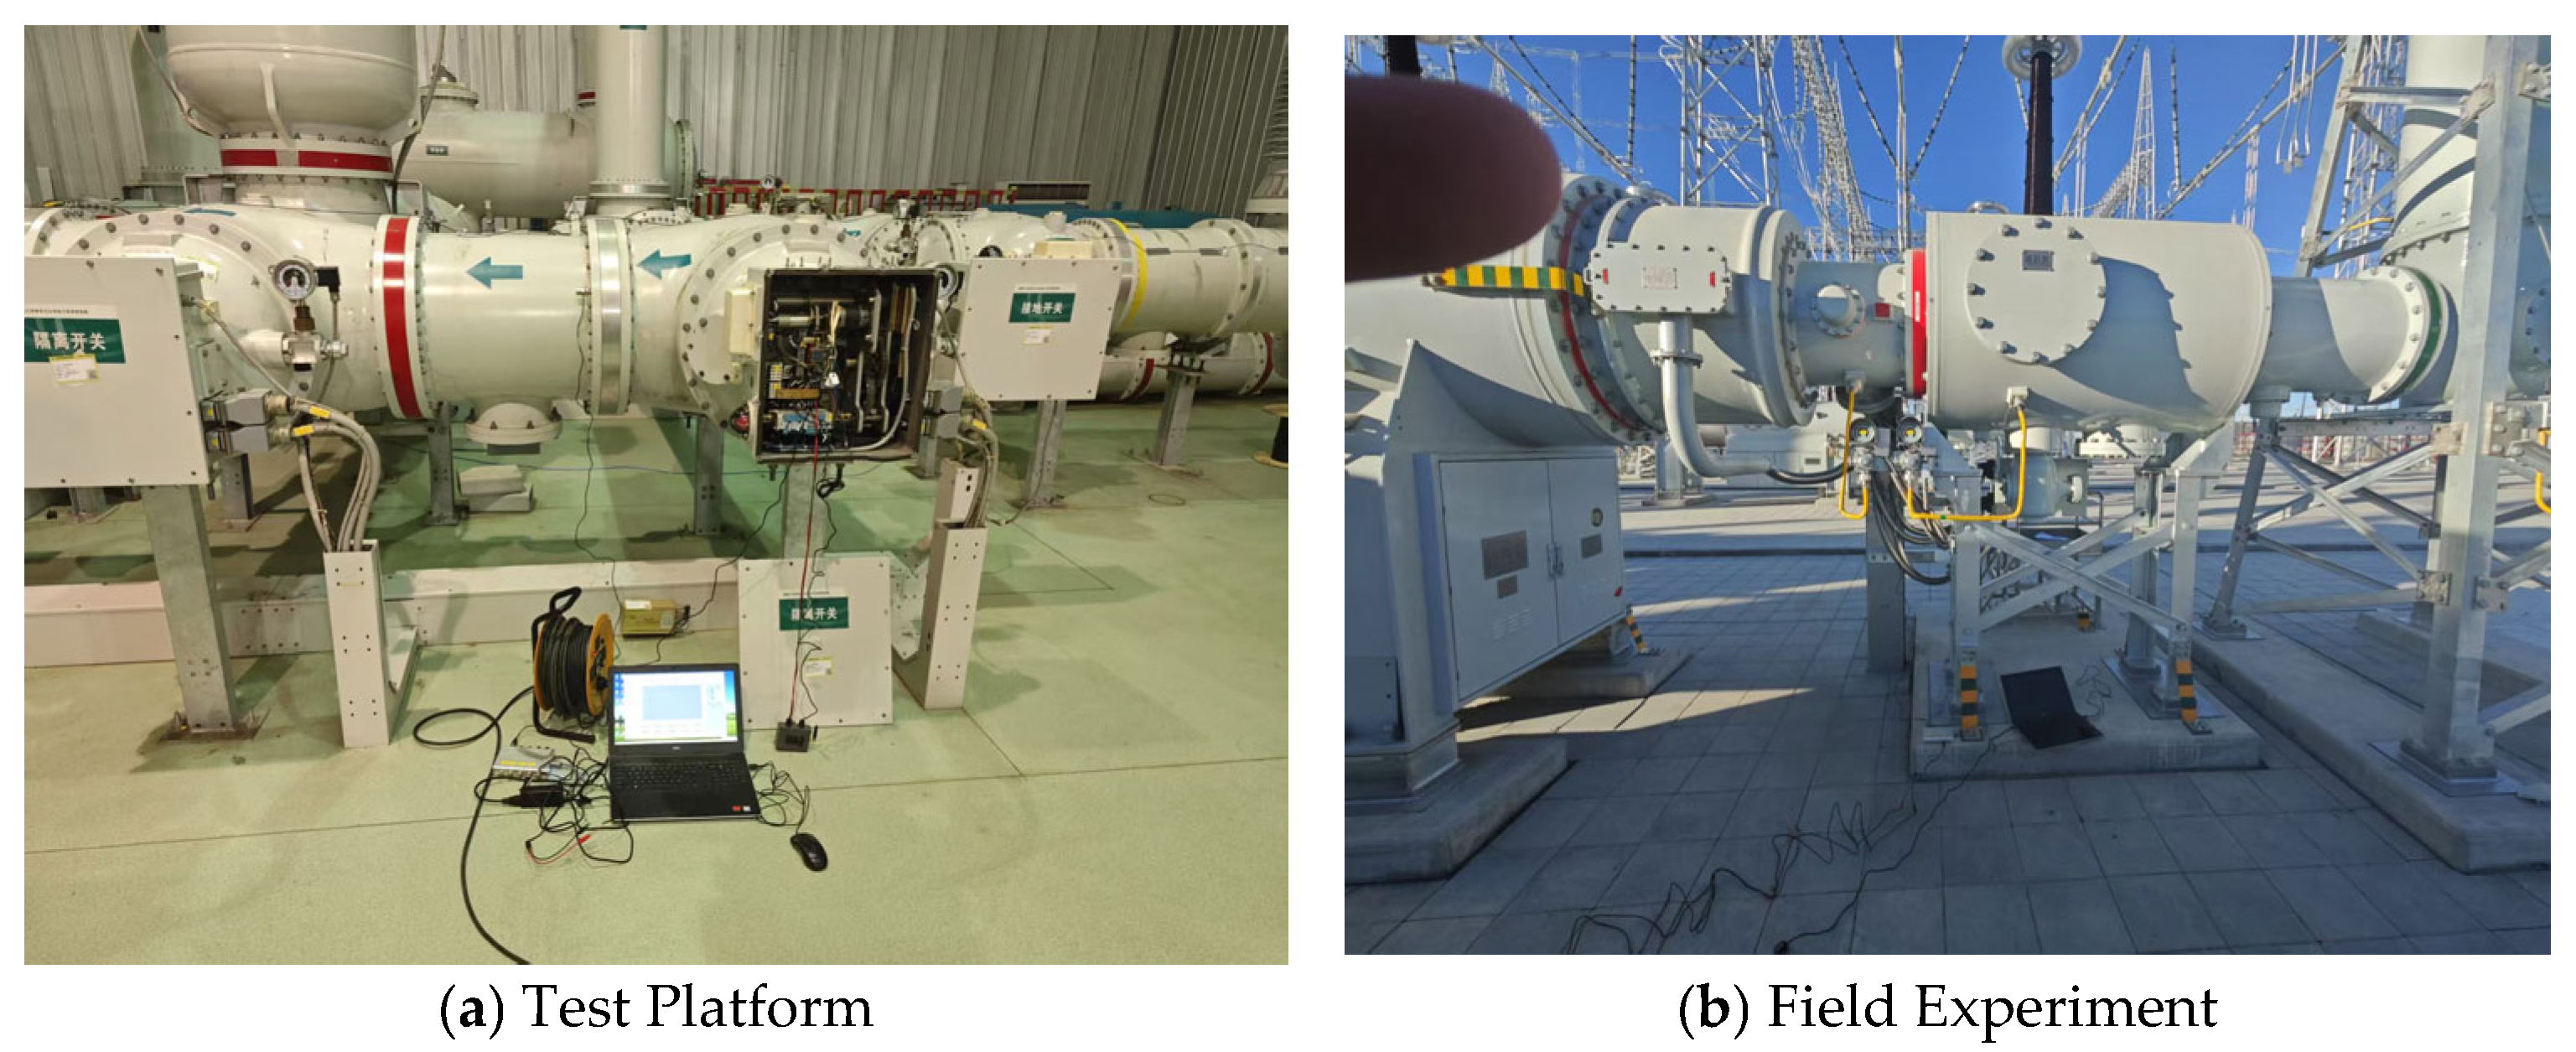
In this study, data acquisition includes two main approaches: on-site industrial measurements and experimental platform testing, corresponding to signals from real operating environments and those obtained under simulated experimental conditions.
The hardware system used in both the industrial and laboratory environments consisted of a high-sensitivity vibration acquisition module and a synchronized power monitoring system. The vibration signals were collected using 100 mV/g piezoelectric accelerometers with a 50 g measurement range and a 60 kHz sampling frequency, ensuring the accurate capture of fast transient mechanical events. To minimize the influence of structural resonance and ambient noise, sensors were mounted on the actuator housing using magnetic bases and verified through preliminary calibration experiments.
The collected vibration signals showed clear transient impacts during switching operations. In normal switching cases, the signals exhibit periodic impulsive patterns corresponding to mechanical contacts and separations, with dominant frequency components between 500 Hz and 5 kHz. Under simulated jamming faults, the signals demonstrated an increased amplitude variance, extended impulse durations, and higher harmonic content, particularly in the 2–8 kHz range. These differences support the feasibility of distinguishing fault types via time–frequency analysis.
Moreover, variations between 220 kV and 330 kV GIS disconnector units were observed. While both systems demonstrated similar structural operation phases, the 330 kV units produced higher amplitude vibration signatures due to increased mechanical inertia and structural rigidity. This difference was considered during feature normalization and model training to avoid data bias.
All acquisition channels were synchronized using the same DAQ clock to ensure alignment between vibration and power signals. Pre-processing steps included baseline correction and anti-alias filtering using a 20 kHz low-pass Butterworth filter.
In total, the dataset includes 512 samples, covering both normal and faulty operating conditions; the industrial on-site measurement data include 330 kV GIS disconnector normal switching data, collected from a 330 kV substation, consisting of synchronized power and vibration signals, with a total of 240 pairs covering multiple normal operating conditions. Additionally, 220 kV GIS disconnector normal switching data were obtained from a 220 kV substation, also containing synchronized power and vibration signals, totaling 52 pairs. Experimental platform test data consist of 100 normal switching samples collected in a laboratory environment using high-precision power and vibration sensors. Fault simulation data were generated by simulating six types of typical mechanical faults on the experimental platform, including incomplete opening, incomplete closing, failure to open, failure to close, mechanism jamming, and meshing jamming, with 20 samples collected for each fault type, totaling 120 samples.
In total, the dataset includes 512 samples, covering both normal and fault operating conditions, with normal data accounting for approximately 76.6% and fault data accounting for 23.4%. These samples provide essential data support for training and testing the diagnostic model. Despite the diversity in data sources, challenges remain, including uneven sample distribution, limited sample quantity, and insufficient diversity. In particular, the small number of fault samples may reduce the model’s ability to recognize fault patterns. Therefore, this study introduces data augmentation techniques to improve data quality and enhance model diagnostic performance.
To address the issues of a limited sample size, imbalanced distribution, and insufficient feature diversity, the following data augmentation methods were implemented: noise perturbation augmentation, where small-amplitude random noise (such as Gaussian noise) is superimposed on the raw signals (both power and vibration signals) to simulate potential signal fluctuations in real-world environments. For vibration signals, noise with an amplitude of 10% to 20% of the signal’s standard deviation σ was added to enhance robustness to environmental noise. Time-series transformations were applied, including slight forward or backward shifts along the time axis to simulate potential sampling time deviations, such as shifting the columns of the power signal segment matrix left or right. Time stretching and compression were used to modify the temporal distribution characteristics of the signal, increasing sample diversity. Amplitude scaling was also applied, where the overall amplitude of power and vibration signals was linearly scaled (e.g., increased or decreased by 10%) to simulate signal characteristic changes under different load conditions. Local peak adjustments were made by randomly modifying local peaks in the signal to generate samples that better resemble actual operating conditions.
To address the issue of a limited number of fault samples, data augmentation was used to generate synthetic samples for each fault type, expanding each fault category to 100 samples, increasing the total number of fault samples to 600. Additionally, normalization and random perturbation were applied to the 220 kV and 330 kV normal operation data to increase the diversity of normal state samples. Following these augmentation strategies, the dataset expanded from 512 samples to 1400 samples, including an increase in normal data from 392 to 700 samples and fault data from 120 to 700 samples, with each fault category containing 100 samples.
The augmented dataset exhibits the following characteristics: improved distribution balance, where the normal-to-fault sample ratio was adjusted to 1:1, significantly alleviating the imbalance problem; enhanced diversity, achieved through noise perturbation, time axis transformation, and modal augmentation, significantly improving sample diversity and enabling the model to adapt to more complex operating conditions; and enriched signal features, as the augmentation methods introduced more variations in signal patterns, enhancing the model’s ability to learn key diagnostic features (
Table 3 and
Table 4).
To ensure the model’s ability to learn from each fault category, particular attention was given to the distribution of normal and fault samples during the partitioning process. Specifically, normal data consisted of 700 samples, with 490 used for training, 105 for validation, and 105 for testing. Fault data also consisted of 700 samples, with each fault category containing 100 samples, distributed as 70 for training, 15 for validation, and 15 for testing. The fault categories consisted of incomplete opening (class 1), incomplete closing (class 2), failure to open (class 3), failure to close (class 4), mechanism jamming (class 5), and meshing jamming (class 6). Meanwhile, every category followed the same training–validation–test split.
In this research, a LeNet-5-based neural network was built for vibration signals’ fault classification and feature extraction. As the classical convolutional neural network (CNN) architecture, LeNet-5 is quite suitable for small-scale datasets and shows excellent performance in tasks of pattern recognition and classification. The model includes an input layer, convolutional layers, pooling layers, fully connected layers, and an output layer. In this way, crucial features in vibration signals can be automatically learned and the fault diagnosis accuracy and robustness are improved as well.
To be specific, the network consists of two convolutional layers (Conv1 and Conv2) for the extraction of local features from vibration signals. Apart from that, every convolutional layer is followed by a pooling layer. In addition to the reduction in the data dimensionality, it lowers calculation complexity and strengthens the features’ translation invariance. In the wake of feature extraction, the fully connected layers (FC) merge and improve deep features. Beyond that, the probability distribution is outputted by the final Softmax classification layer for different fault categories. This enables the accurate classification of diverse fault modes.
To ensure robustness, we performed multiple random splits in the dataset. Specifically, we randomly selected data four times, and for each split, we divided it into training, validation, and test sets. The performance metrics were then averaged (rounded to the nearest integer) across the splits. Since the data samples are similar, the results from each split were very close, with only slight differences observed.
During training, the model is optimized using a fixed learning rate and a cross-entropy loss function to enhance classification performance. By leveraging the LeNet-5 architecture, the model effectively identifies key patterns in GIS disconnector vibration signals, achieving the automatic classification of normal and multiple fault states. This provides a highly efficient and reliable approach for intelligent fault diagnosis.
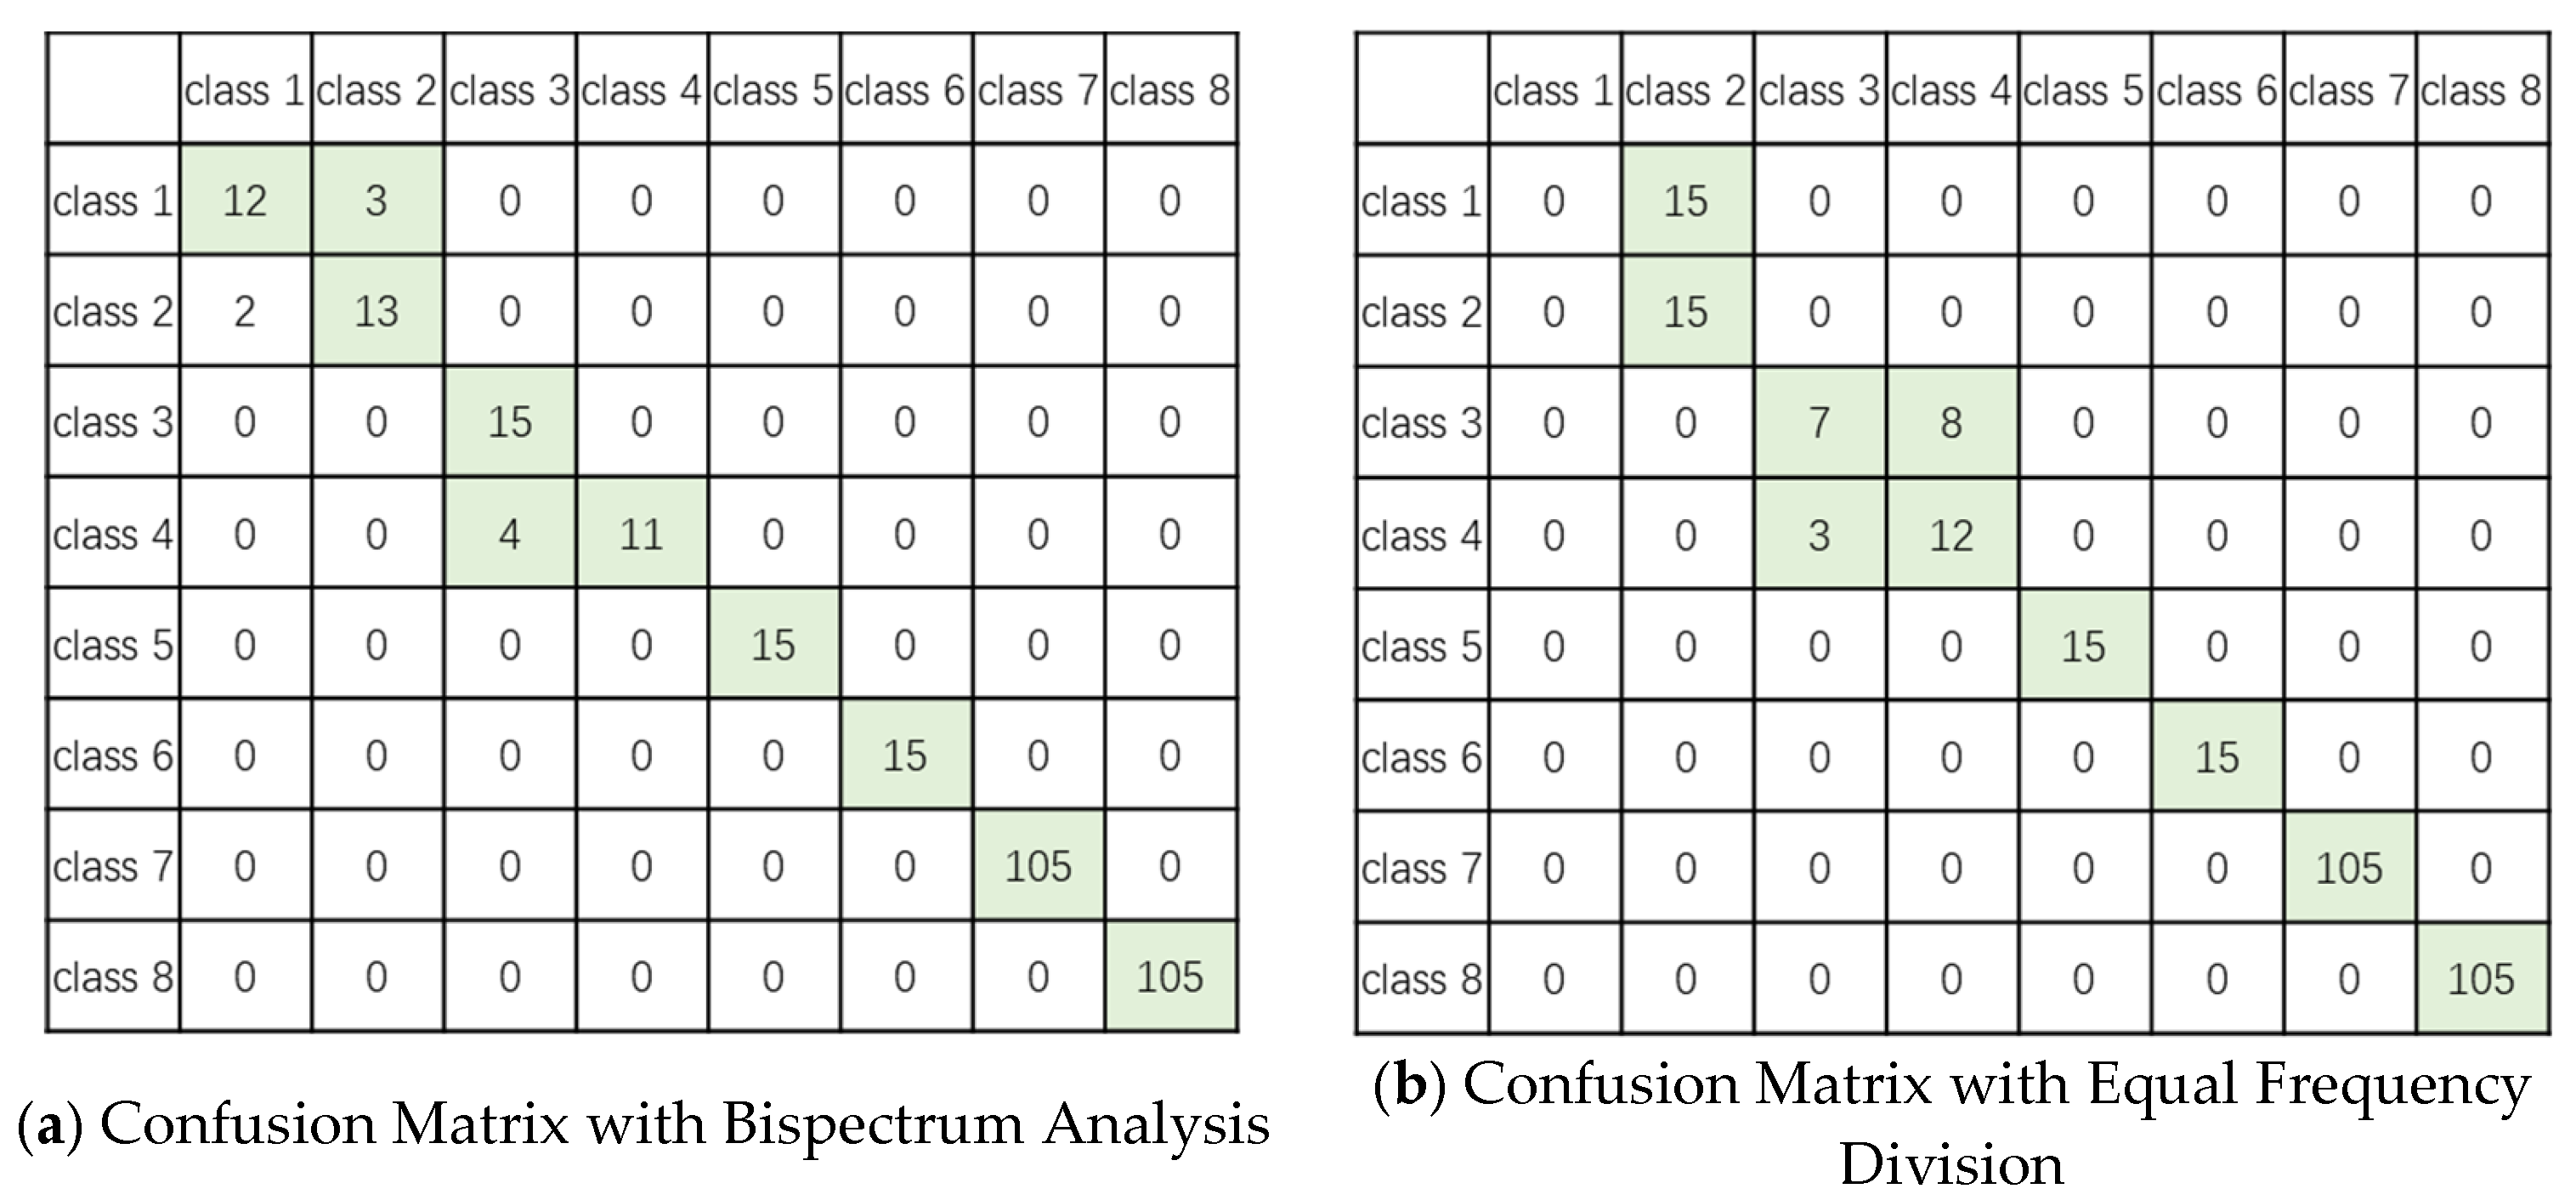
The classification accuracy of incomplete opening (class 1) and incomplete closing (class 2) remained at a high level, reaching 93.3% and 100%, respectively. This performance indicates that the features of the signals were effectively expressed, significantly enhancing the distinction between these categories. However, for the classification of failure to open (class 3) and failure to close (class 4) faults, misclassification phenomena were still relatively prominent. Specifically, ten samples of failure to open were misclassified as failure to close, while four samples of failure to close were misclassified as failure to open.
Another set of misclassification cases occurred between meshing jamming (class 6) and normal closing (class 8). This is because meshing jamming and normal closing exhibit a high degree of similarity in the modal characteristics of vibration signals. In particular, when there are no initial separation and initial contact points, the waveform changes in these two conditions in both the time and frequency domains are difficult to distinguish. Although vibration signals can capture localized abnormalities in the mechanical movement process, for such faults without clear key time points, the combination of vibration signals and power signals still struggles to fully resolve the issue of pattern similarity. This suggests that additional feature extraction techniques or advanced fusion strategies, such as incorporating higher-order spectral analysis or deep learning-based feature attention mechanisms, may be necessary to further enhance the model’s ability to differentiate these conditions. Future research could also explore multi-sensor integration to provide complementary information and improve diagnostic robustness in complex scenarios.
To provide a more detailed evaluation of the model’s performance, we have also calculated the precision, recall, and F1-score for each class. These metrics offer a clearer understanding of the model’s ability to correctly classify each fault type, complementing the confusion matrix results. The table below shows the precision, recall, and F1-score for each class, demonstrating the balanced performance of the model across different fault types (
Table 5).
In
Figure 6, we present a comparison of the original confusion matrix and the modified confusion matrix obtained through the equal frequency division of the vibration signal. These two matrices illustrate the impact of using bispectrum analysis versus frequency division for fault diagnosis in high-voltage isolation switches.
The first matrix (left) represents the fault diagnosis results obtained by applying bispectrum analysis. The matrix shows that the model effectively distinguishes between fault classes, with a high accuracy in detecting the true positive cases for each fault class. The diagonal elements indicate a high number of correct classifications, while the off-diagonal elements are relatively low, suggesting that the model has good generalization and performs well even under noisy conditions. The overall accuracy is 98.33%, demonstrating the efficacy of bispectrum analysis in capturing complex fault patterns and nonlinear features in the vibration signal.
The second matrix (right) represents the performance when the vibration signal is divided equally across frequencies, without using VMD or bispectrum analysis. While this method helps balance the frequency spectrum, it does not capture the nonlinear interactions and phase coupling characteristics inherent in the signal. As a result, the off-diagonal values are slightly higher compared to the bispectrum method, indicating a greater number of misclassifications between classes. The overall accuracy in this case is 91.33%, which is lower than the accuracy achieved with bispectrum analysis. This demonstrates the limitations of using frequency division alone, which fails to fully exploit the detailed signal features that are essential for accurate fault diagnosis.
The comparison between the two matrices highlights the performance advantage of bispectrum analysis in fault diagnosis. While frequency division provides a balanced spectral representation, it does not capture the full complexity of the signal, leading to lower classification accuracy. In contrast, bispectrum analysis enhances feature extraction by revealing higher-order spectral information, leading to a more accurate fault detection.
5. Conclusions
This study presents a GIS disconnector mechanism jamming fault diagnosis method based on sideband information enhancement, integrating variational mode decomposition (VMD) and bispectrum analysis to effectively extract key features from vibration signals. The proposed method demonstrates its ability to capture nonlinear coupling effects and modulation characteristics associated with mechanical faults, significantly improving diagnostic accuracy compared to traditional spectral analysis techniques.
The experimental results validate the effectiveness of the method, with high classification accuracy for incomplete opening (93.3%) and incomplete closing (100%), indicating that the extracted features provide a strong discriminative power. However, misclassification between failure to open and failure to close, as well as between meshing jamming and normal closing, highlights the challenges posed by similar modal characteristics in vibration signals. These findings emphasize the need for multi-source signal fusion, such as combining power and vibration signals, to further enhance fault discrimination in complex conditions.
Additionally, data augmentation techniques, including noise perturbation, time-series transformation, and amplitude scaling, successfully balanced the dataset and improved model robustness. The deployment of a LeNet-5-based neural network further optimized feature extraction and classification, enabling the efficient learning of fault characteristics.
Despite the improvements achieved, certain fault conditions still exhibit high similarity in signal patterns, limiting classification performance in some cases. Future work will focus on enhancing feature extraction techniques, integrating additional sensing modalities, and refining deep learning architectures to further improve fault diagnosis reliability and adaptability in real-world applications.
The research findings provide a valuable technical foundation for the intelligent monitoring of GIS disconnector faults, offering a practical approach for power system maintenance and condition-based monitoring, ultimately contributing to the safe and stable operation of the power grid.
Despite the promising results, this study has certain limitations. Specifically, due to structural and operational differences among various GIS disconnector models, the proposed diagnostic method requires a separate signal analysis and feature extraction for each type. This means that the model must be retrained for every new disconnector model, which limits its scalability and universal applicability in large-scale power systems.
Future research will aim to improve the generalizability and adaptability of the diagnostic framework. One potential direction is the application of transfer learning or domain adaptation techniques, enabling models trained on one disconnector type to be adapted to others with minimal data. Additionally, incorporating multi-source data such as acoustic, thermal, or electrical signals may further enhance robustness and reduce dependence on device-specific vibration patterns. Developing a unified, physically interpretable feature representation could also contribute to more scalable and widely applicable fault diagnosis solutions.


