Article

Application of Deep Learning Techniques for Air Quality Prediction: A Case Study in Macau

by
Thomas M. T. Lei
1,*,
Jianxiu Cai
2,
Wan-Hee Cheng
3,
Tonni Agustiono Kurniawan
4,
Altaf Hossain Molla
5,
Mohd Shahrul Mohd Nadzir
6,
Steven Soon-Kai Kong
7 and
L.-W. Antony Chen
8
1
Institute of Science and Environment, University of Saint Joseph, Macau 999078, China
2
Faculty of Applied Sciences, Macau Polytechnic University, Macau 999078, China
3
Faculty of Health and Life Sciences, INTI International University, Persiaran Perdana BBN, Putra Nilai, Nilai 71800, Negeri Sembilan, Malaysia
4
College of Environment and Ecology, Xiamen University, Xiamen 361102, China
5
Department of Mechanical and Manufacturing Engineering, Faculty of Engineering and Built Environment, Universiti Kebangsaan Malaysia (UKM), Bangi 43600, Selangor, Malaysia
6
Department of Earth Sciences and Environment, Faculty of Science and Technology, Universiti Kebangsaan Malaysia (UKM), Bangi 43600, Selangor, Malaysia
7
Department of Atmospheric Sciences, National Central University, Taoyuan 32001, Taiwan
8
Department of Environmental and Global Health, School of Public Health, University of Nevada, Las Vegas, NV 89154, USA
*
Author to whom correspondence should be addressed.
Processes 2025, 13(5), 1507; https://doi.org/10.3390/pr13051507
Submission received: 4 April 2025 / Revised: 8 May 2025 / Accepted: 13 May 2025 / Published: 14 May 2025

Abstract

:
To better inform the public about ambient air quality and associated health risks and prevent cardiovascular and chronic respiratory diseases in Macau, the local government authorities apply the Air Quality Index (AQI) for air quality management within its jurisdiction. The application of AQI requires first determining the sub-indices for several pollutants, including respirable suspended particulates (PM10), fine suspended particulates (PM2.5), nitrogen dioxide (NO2), ozone (O3), sulfur dioxide (SO2), and carbon monoxide (CO). Accurate prediction of AQI is crucial in providing early warnings to the public before pollution episodes occur. To improve AQI prediction accuracy, deep learning methods such as artificial neural networks (ANNs) and long short-term memory (LSTM) models were applied to forecast the six pollutants commonly found in the AQI. The data for this study was accessed from the Macau High-Density Residential Air Quality Monitoring Station (AQMS), which is located in an area with high traffic and high population density near a 24 h land border-crossing facility connecting Zhuhai and Macau. The novelty of this work lies in its potential to enhance operational AQI forecasting for Macau. The ANN and LSTM models were run five times, with average pollutant forecasts obtained for each model. Results demonstrated that both models accurately predicted pollutant concentrations of the upcoming 24 h, with PM10 and CO showing the highest predictive accuracy, reflected in high Pearson Correlation Coefficient (PCC) between 0.84 and 0.87 and Kendall’s Tau Coefficient (KTC) between 0.66 and 0.70 values and low Mean Bias (MB) between 0.06 and 0.10, Mean Fractional Bias (MFB) between 0.09 and 0.11, Root Mean Square Error (RMSE) between 0.14 and 0.21, and Mean Absolute Error (MAE) between 0.11 and 0.17. Overall, the LSTM model consistently delivered the highest PCC (0.87) and KTC (0.70) values and the lowest MB (0.06), MFB (0.09), RMSE (0.14), and MAE (0.11) across all six pollutants, with the lowest SD (0.01), indicating greater precision and reliability. As a result, the study concludes that the LSTM model outperforms the ANN model in forecasting air pollutants in Macau, offering a more accurate and consistent prediction tool for local air quality management.

1. Introduction

1.1. Background of Macau AQI

The Air Quality Index (AQI) is a vital tool that government agencies around the world utilize to monitor air quality conditions and assess the associated impacts on public health and the broader community. Calculating AQI requires obtaining sub-indices for several key pollutants, including respirable suspended particulates (PM10), fine suspended particulates (PM2.5), nitrogen dioxide (NO2), ozone (O3), sulfur dioxide (SO2), and carbon monoxide (CO). The highest pollutant sub-index represents the AQI level for each air quality monitoring station (AQMS). An AQI above 100 indicates poor air quality, prompting recommendations to limit outdoor activity, particularly for vulnerable groups like children, elderly citizens, pregnant women, and those with respiratory or cardiovascular conditions [1].
As a global tourist destination, the Macau Special Administrative Region (SAR) welcomed a total of 34.9 million tourists in 2024, representing an increase of 23.8% compared to the previous year of 2023 [2]. There were more than 253,000 registered motor vehicles in Macau [3]. The Gross Domestic Product (GDP) per capita in Macau was over 73,500 USD in 2024 [4].
The highest annual Macau Air Quality Index (MAQI) recorded for each of the key air pollutants in 2024 is compared with the latest World Health Organization (WHO) Air Quality Guideline (AQG) 2021 in Table 1. All the key pollutants (except for CO) have exceeded the WHO guideline, particularly PM10 by nearly 3 times and PM2.5 and NO2 by over 4 times the recommended limits [5]. In addition, there were 14 unhealthy days attributed to high PM2.5 and 28 unhealthy days attributed to high O3 levels in 2024 [6]. This is of great concern for the health and well-being of the local community.

1.2. Health Effects of Air Pollution

Air pollution poses significant challenges in urban areas and impacts both outdoor and indoor environments. Outdoor pollution originates from natural sources, such as volcanic eruptions and wildfires, and anthropogenic sources, including vehicle emissions, industrial discharges, and energy production [7]. Exposure to hazardous air pollutants has well-documented detrimental effects on the immune system and respiratory and cardiovascular health, contributing to diseases like asthma, chronic obstructive pulmonary disease (COPD), and lung cancer [8]. The economic repercussions are also severe, as air pollution impacts labor productivity, reduces agricultural crop yields, and affects livestock health [9].
Among key air pollutants, PM contains microscopic solid or liquid particles that are small enough to be inhaled and cause serious health problems. PM10 refers to particles with an aerodynamic diameter equal to or less than 10 μm, and it can penetrate deep into human lungs and sometimes even into the bloodstream. PM2.5 refers to particles with an aerodynamic diameter equal to or less than 2.5 μm, posing the greatest health risk [5,6].
Agricultural biomass burning and forest fires during fire seasons intensify PM2.5 emissions [10], while winter heating practices further elevate the pollutant level [11]. Additionally, natural wind erosion adds substantial PM to the atmosphere, particularly during the spring season [12], and low wind speed and mixing layer height in winter lead to higher PM2.5 concentrations [13]. Indoor pollution also presents substantial health risks due to the considerable time people spend indoors in offices and homes, highlighting the importance of improving indoor air quality (IAQ) [14].
Varying meteorological, geographic, and human activity-related factors present challenges in predicting air pollution levels [15]. Advanced forecasting models are increasingly essential for predicting extreme pollution episodes, particularly in densely populated megacities, to ensure timely warnings [16]. This is particularly important in China, including Macau, where PM2.5 and other pollutant levels remain high [17].

1.3. Novelty and Objective of This Work

The primary knowledge gap addressed in this study revolves around understanding which machine learning (ML) forecasting model—Artificial Neural Network (ANN) or Long Short-Term Memory (LSTM)—is more effective for predicting AQI pollutants; specifically in coastal urban settings like Macau. Previous ML studies have focused on more common methods, such as multiple linear regression (MLR), random forest (RF), gradient boosting (GB), and support vector regression (SVR) [9,15,18]. Due to the computationally intensive nature of ANN and LSTM deep learning frameworks, they have not been widely used, and it is uncommon for a single study to explore both models simultaneously. Furthermore, a direct comparison of ANN and LSTM model predictions has not been carried out in a region with unique coastal characteristics such as Macau. Coastal regions, with distinct meteorological conditions such as high humidity, sea breeze, and varied pollutant dispersion patterns, may impact model accuracy.
To bridge these knowledge gaps, this study aims to develop and apply novel ML methods, specifically ANN and LSTM models, to improve air pollution forecasting. Model-specific performance and reliability for predicting key AQI pollutants under the specific coastal conditions of Macau are evaluated. This technological advancement could significantly enhance operational air quality management by providing timely and precise predictions, enabling authorities and citizens to better mitigate exposure risks in response to pollution episodes.

2. Materials and Methods

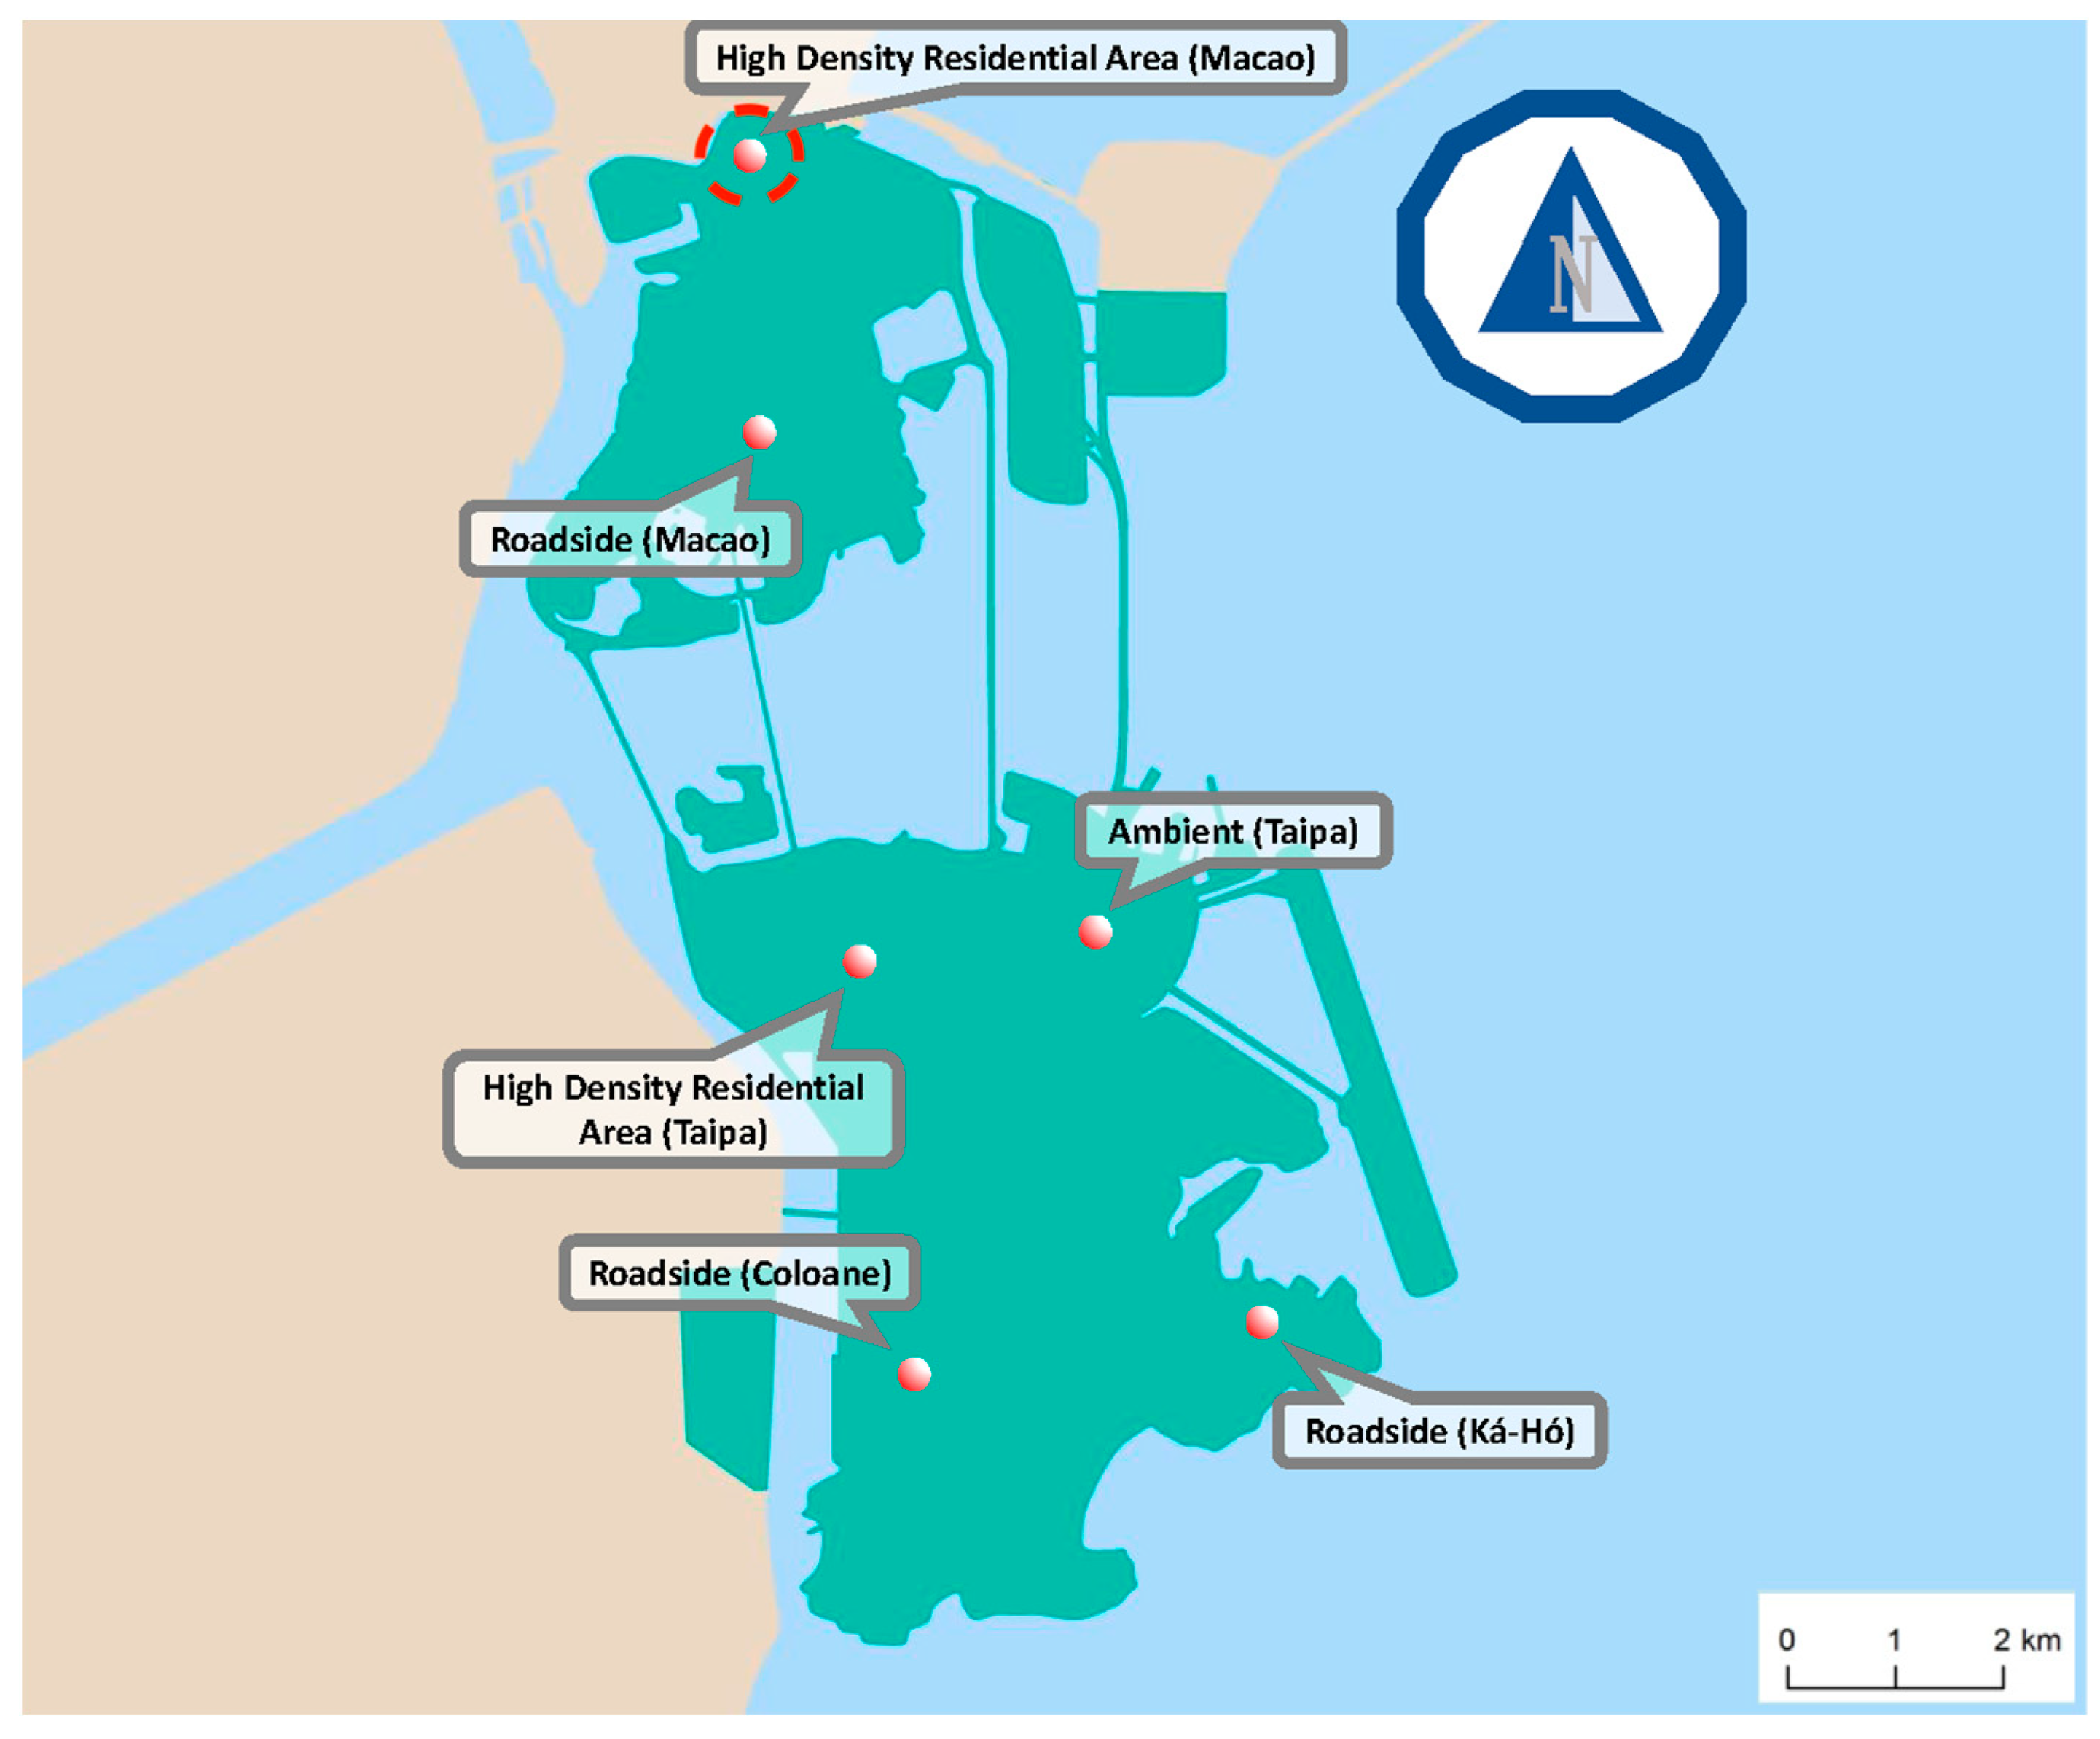
2.1. Data Collection

Air pollution is challenging to predict due to the complex chemical, physical, and biological processes involved. To improve classification and analysis, variables from air quality measurements, surface meteorological data, and upper-air observations were incorporated into deep learning models.
The data sets used to develop the ANN and LSTM models were sourced from the Macau Meteorological and Geophysical Bureau (SMG) and the Hong Kong Observatory (HKO). The air quality data were collected locally at the Macau air quality monitoring station (AQMS), and the surface meteorological data were collected at a local weather station. Since SMG does not measure upper air meteorology, vertical sounding data were obtained from the nearby Hong Kong King’s Park (WMO 45004) using a weather balloon with a radiosonde for this study.
The Macau High-Density Residential Area AQMS is located in the northernmost part of the Macau peninsula (Figure 1). This site is strategically significant due to its proximity to two major border crossing points: the Border Gate and Qingmao Port, which connect residents of mainland China and Macau. In 2023 alone, over 100 million people crossed the Border Gate and nearly 30 million through the Qingmao Port. This substantial cross-border traffic underscores the critical need to monitor and predict air quality in this area to better manage public health risks associated with pollution exposure. This work focuses on air quality proximate to the border crossing facilities, which many residents and tourists visit daily. The other AQMS in Macau were not considered in this study due to their long distance from the borders.
The study period spans 2020 and 2021, covering both the peak and recovery phases of the COVID-19 pandemic. Air quality in Macau improved significantly in early 2020 due to lockdown and stay-at-home orders but gradually declined as intervention measures became the new normal. Therefore, being able to accurately predict air quality throughout this period highlights the robustness of the ANN and LSTM models.

2.2. Study Workflow

Figure 2 presents the workflow for this air pollution forecasting study. The model development begins with collecting meteorological and air quality data from the SMG and HKO. Next, data curation is performed to eliminate noise and invalid entries, ensuring data integrity. Since there were some days without a valid record, these entries must be dropped to ensure the accuracy of the dataset. For example, the entries with −999 concentrations must be removed from the dataset because these are invalid entries from the raw dataset obtained from SMG and HKO. The curated data are split into training and testing sets using a 7:2 ratio. Previous studies showed that the optimal splitting for each sub-dataset size is the following: training, validation, and testing with sizes of 70%, 20%, and 10%, respectively. Data should be split so that data sets can have a high amount of training data, and a 70-20-10 ratio for training, validation, and test splits is optimal for small data sets [19].
Table 2 summarizes the training and test data sets in this study. In the modeling phase, both ANN and LSTM models are applied to the dataset, with each running five times to produce average results. Previous studies have shown that the optimal training of the model is to run it five times. Each experiment is run five times, and the average results after five separate runs are shown, because AI models will collapse when trained on recursively generated data [20].
Previous studies have shown that standard deviation (SD) is commonly used to evaluate the model performance in air quality models. To quantify the average and variability of model performance, the RMSE and its SD across models’ outputs are often calculated [21].
This study applied the data from 7 years (2013 to 2019) as the training set and the data from 2 years (2020 to 2021) as the test set. This work is developed using TensorFlow 2.6.2 in Python.

2.3. Variable Predictors, Model Parameters, and Hyperparameters

Table 3 shows the variables used in the ANN and LSTM models, which are divided into three categories: air quality data, meteorological variables, and others.
Table 4 shows the model parameters and hyperparameters applied in the ANN and LSTM models, which are essential for achieving the best prediction performance.

2.4. Learning Algorithm

ANN is widely used for time series predictions and excels in handling complex non-linear mapping problems. It is a versatile computational approach applicable in various domains, including classification, forecasting, and pattern recognition [22]. ANNs capacity to predict air pollution stems from its ability to capture non-linear dependencies within data, such as the intricate relationships between meteorological and air pollutant variables. However, ANN lacks memory cells, which limits its capability to capture long-term dependencies in time series data [23]. ANN architecture comprises three primary layers—an input layer, hidden layers, and an output layer—each containing neurons (or nodes) that work together to process and map inputs to outputs [24].
LSTM is an advanced form of Recurrent Neural Network (RNN) and is often employed for forecasting meteorological conditions, weather patterns, precipitation likelihood, and air pollution levels. LSTM is specially designed to address the gradient problem common in RNNs, using memory blocks that enable it to retain information over extended time periods [25]. LSTM effectively processes long-term sequential data, making it well-suited for predicting future time series. Research indicates that LSTM can accurately capture short- and long-term patterns within historical datasets [26]. Its architecture comprises an input gate, output gate, and forget gate, which manage data flow and retention across time steps [27]. This ability to capture extended temporal dependencies and periodic patterns makes LSTM an excellent choice for air quality forecasting, particularly in recognizing long-duration trends [28].

2.5. Model Performance Evaluation

Several performance metrics were used to compare the model-predicted and actual air quality variables. Pearson Correlation Coefficient (PCC), also noted as “r”, is the most common measure of linear correlation between two variables in a statistical analysis. Kendall’s Tau Coefficient (KTC) is a non-parametric statistical method used to measure the strength and direction of association between two variables. Root Mean Squared Error (RMSE) is a performance measure defined as the square root of the expectation of the squared difference between estimated and actual values, which is commonly used in assessing the accuracy of parameter estimates. Furthermore, Mean Absolute Error (MAE) is a metric that measures the average magnitude of the absolute errors between the predicted and actual values. MB is a statistical measure that indicates the average difference between predicted and actual values. MFB refers to the model’s tendency to overestimate or underestimate observed values.
The equations are shown in the following and implemented in Python using TensorFlow 2.6.2 for calculation:
M B = 1 N N t = 1 M i O i
M F B = 2 N   N t = 1   ( M i O i M i + O i )
R M S E = i = 1 N ( y i ^ y i ) 2 N
M A E = 1 N i = 1 N | y i ^ y i |
P C C ( r ) = 1 i = 1 N ( y i y ¯ ) ( y i ^ y ^ ¯ ) i = 1 N ( y i y ¯ ) 2 i = 1 N ( y i ^ y ^ ¯ ) 2
where y i represents the observed (measured) pollutant concentration; y i ^ denotes the i th sample of prediction values of regression model; and N is the sample number. Furthermore,
K T C = P Q ( P + Q + T ) ( P + Q + U )
where P illustrates the number of concordant pairs, Q the number of discordant pairs, T the number of ties only in x , and U the number of ties only in y .
To evaluate the model performance, a numerical value near or equal to 1 is desirable for both PCC and KTC. In contrast, a value near or equal to 0 is desirable for both MB, MFB, RMSE, and MAE.

3. Results and Discussions

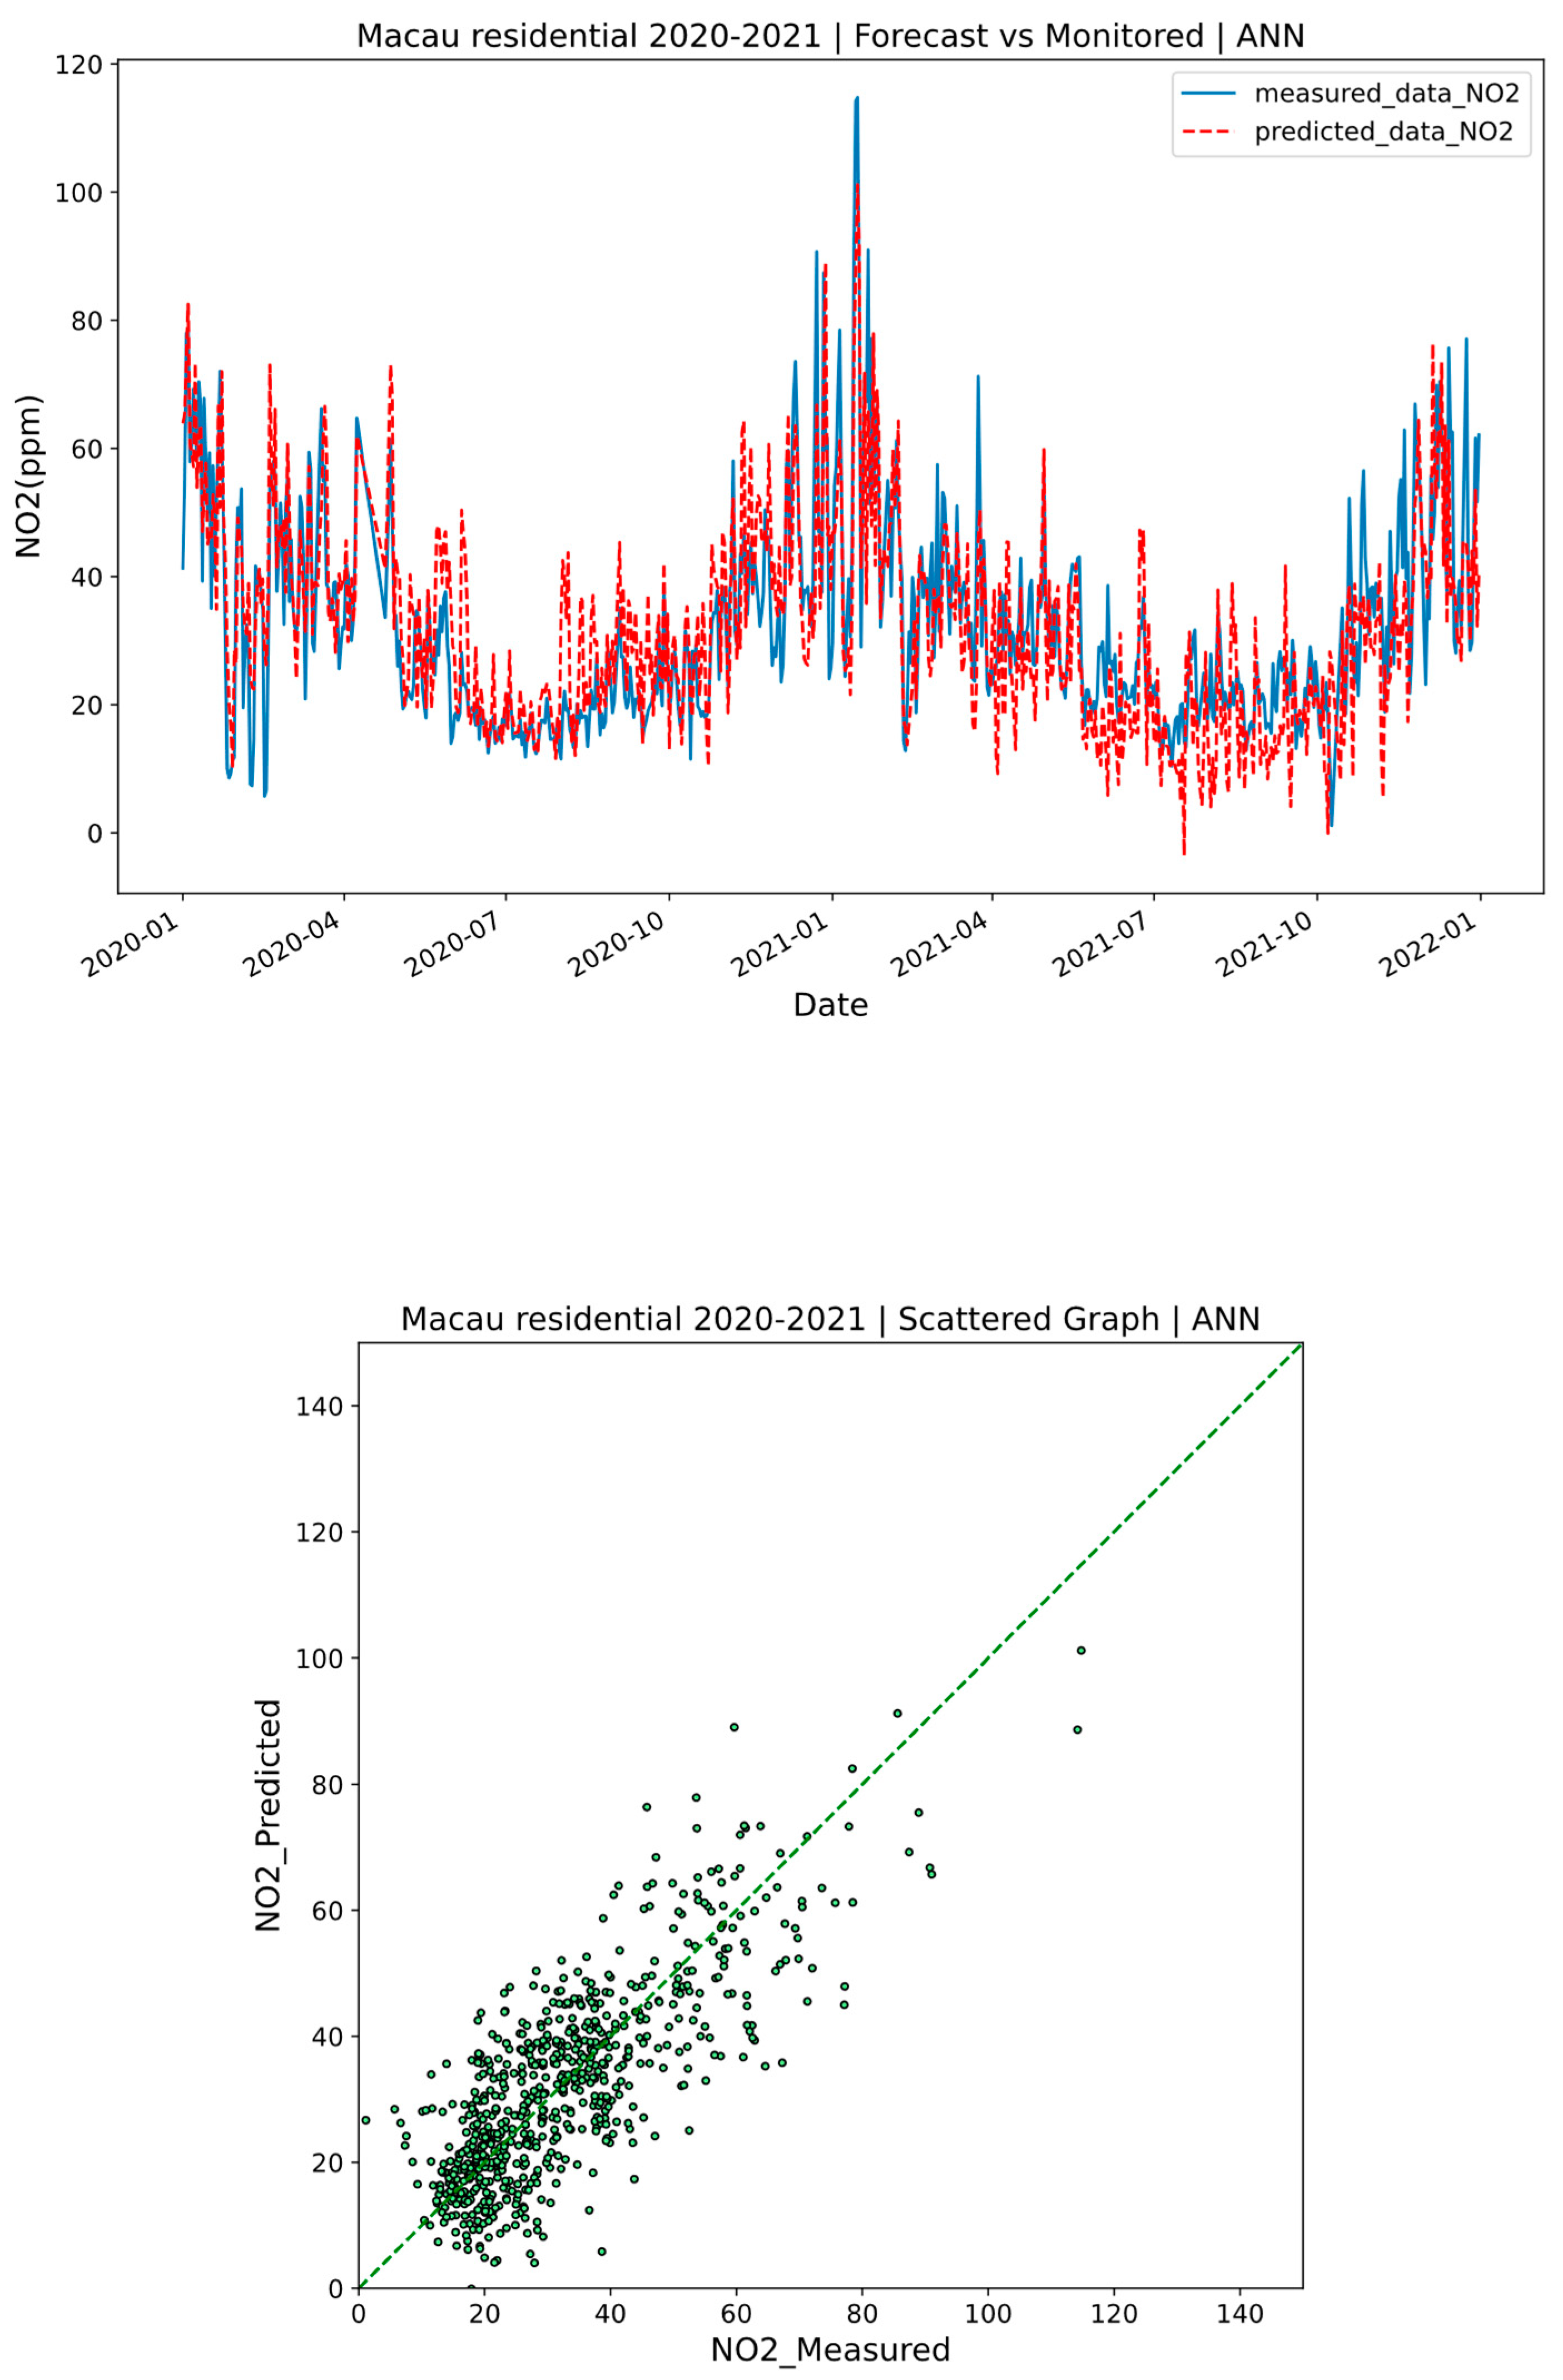
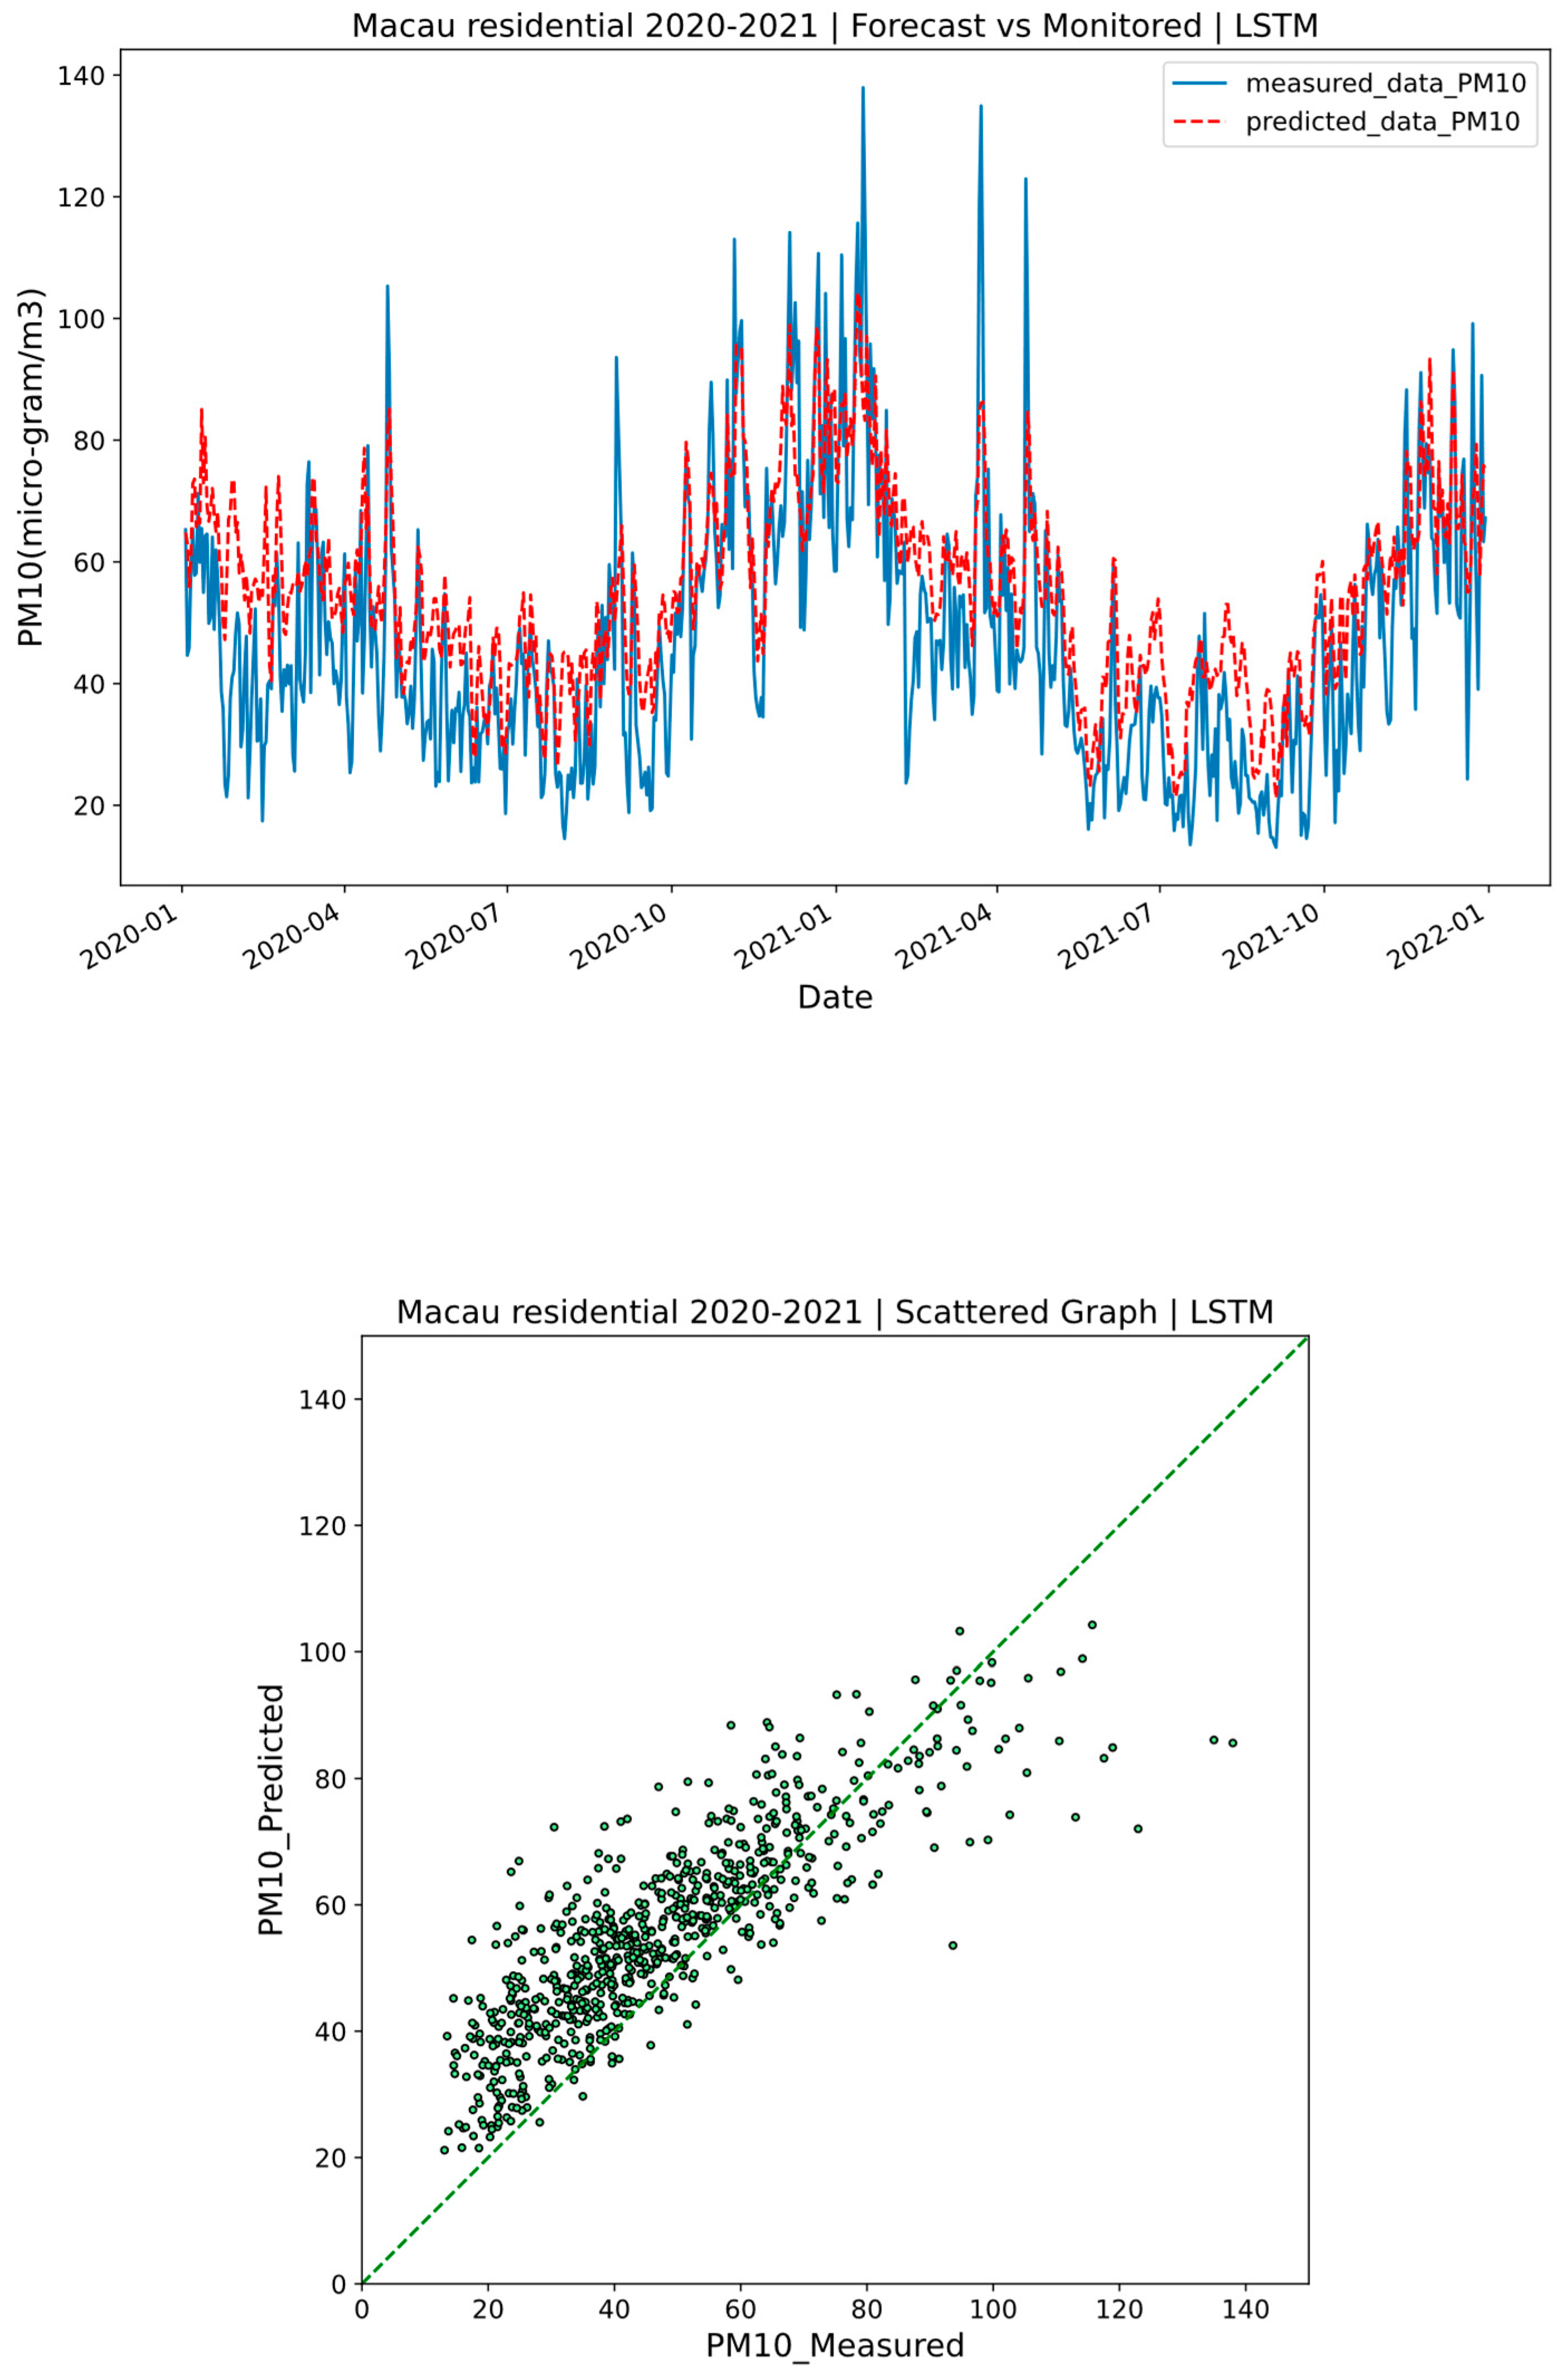
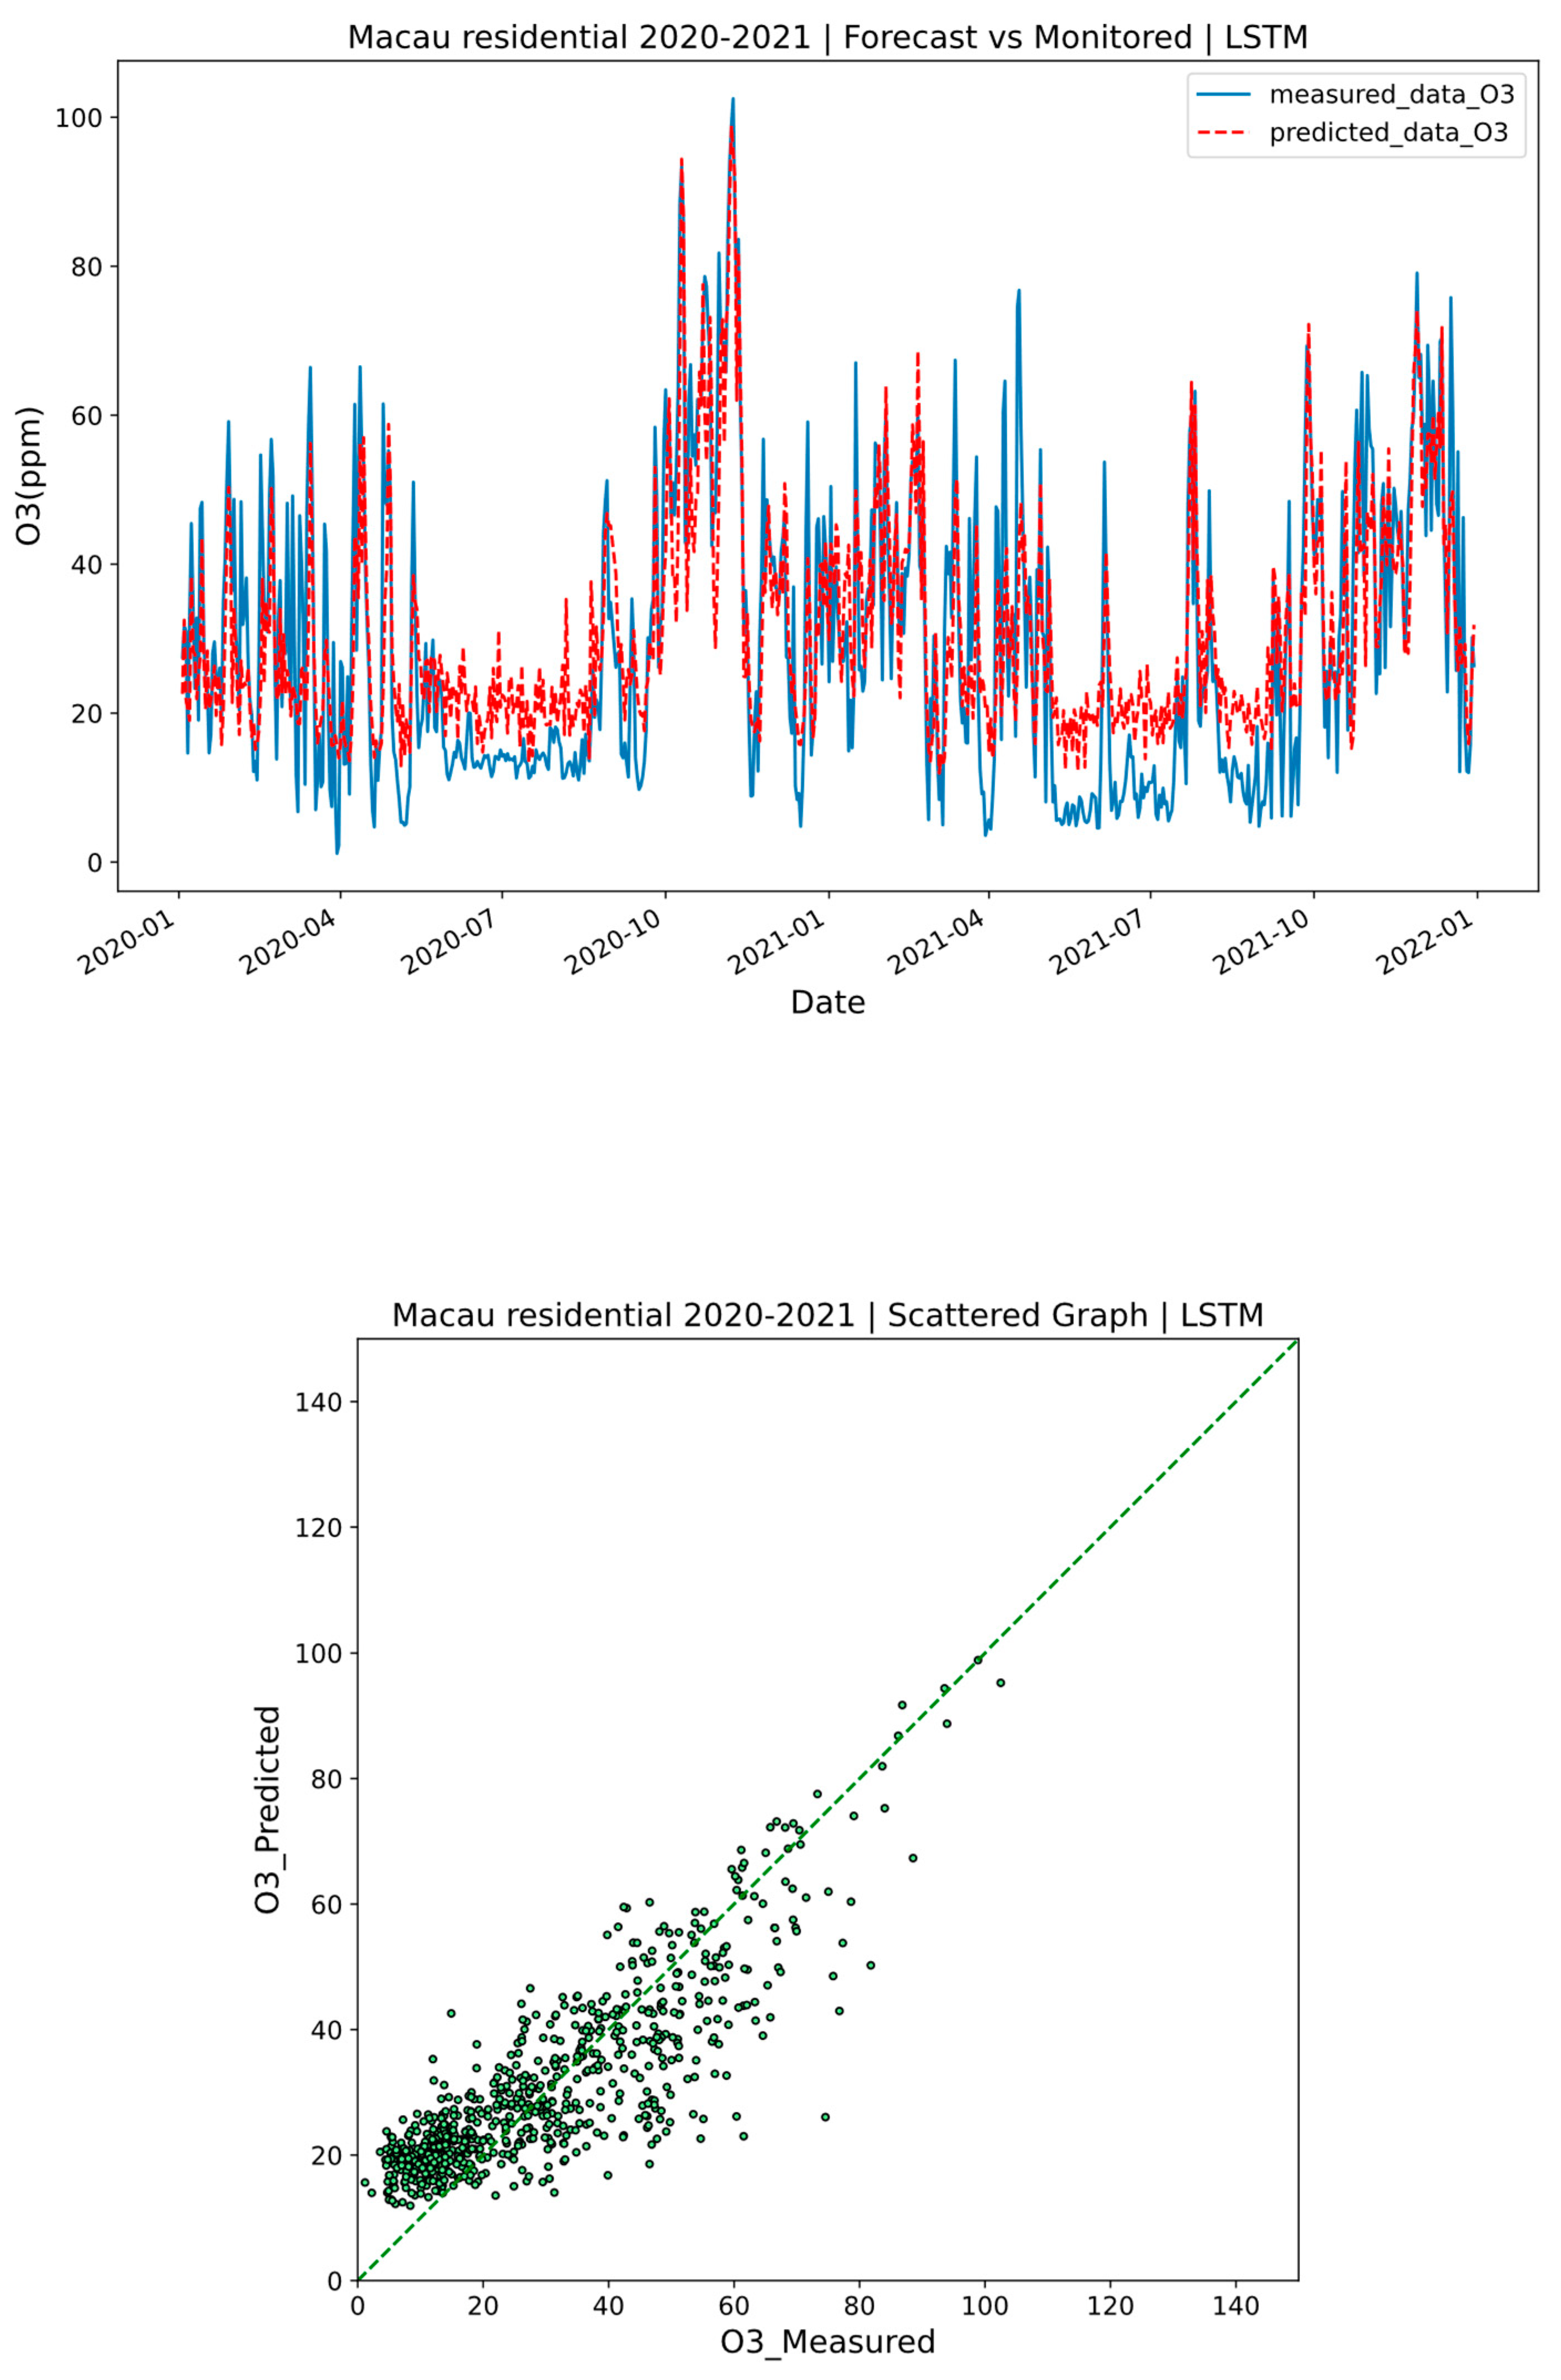
3.1. Performance of the Models

Table 5 summarizes the performance indicators for both ANN and LSTM models in forecasting the six key air pollutants included in the AQI: PM10, PM2.5, NO2, O3, SO2, and CO. The best performance is shown in bold. Figure 3, Figure 4 and Figure 5 illustrate the measured and predicted concentrations of PM10, CO, and NO2 using the ANN model for the years 2020 and 2021 with residual plots. Figure 6, Figure 7 and Figure 8 present the measured and predicted PM10, CO, and O3 concentrations utilizing the LSTM model with residual plots for the same period.
The results indicated that the ANN model predicted PM10 reasonably, achieving a high PCC of 0.84, a KTC of 0.66, and a low MFB of 0.11. It also performed well for CO, with an RMSE of 0.21, an MAE of 0.17, and a low MB of 0.10. On the other hand, the LSTM model demonstrated superior performance for PM10, with an even higher PCC of 0.87 and a KTC of 0.70. It also excelled in predicting O3, with a PCC of 0.85, and SO2, which had a KTC of 0.66. For CO, LSTM achieved lower error metrics, with an RMSE of 0.14, an MAE of 0.11, a low MB of 0.06, and a low MFB of 0.09. Overall, LSTM outperformed ANN across most performance indicators for all pollutants analyzed.

3.2. Standard Deviation of the Models

Additionally, the ANN model recorded the lowest SD in MB and MFB at 0.04, RMSE at 0.09, MAE at 0.06, PCC at 0.05, and KTC at 0.03 for CO. In contrast, the LSTM model achieved even lower SD values, with MB of 0.01, MFB of 0.02, RMSE of 0.02, MAE of 0.02, PCC of 0.02 for CO, and a KTC of 0.02 for PM10. Table 6 presents the SD values obtained after five model runs for both the ANN and LSTM models. Notably, the SD values for the LSTM model are significantly lower than those for the ANN model, demonstrating superior consistency and robustness in performance across all metrics. This indicates that the LSTM model exhibits a more reliable and stable predictive capability. The low SD values also indicate consistency among the 5 model runs, which is crucial to ensure the reproducibility and robustness of this work.

3.3. Comparison to Previous Works

A study investigated the levels of PM2.5 concentration and high pollution episode prediction in the Western and Eastern parts of the USA using the ANN model, and their results showed an r2 of 0.80, RMSE of 4.80, and MAE of 2.42 [29]. Another study applied the ANN model for the prediction of air pollutants, including CO, NO2, PM2.5, and PM10, at BKK International Airport, showing the PCC (r) of 0.70, 0.57, 0.69, and 0.75; MSE of 83.74, 149.86, 70.62, and 124.25; and MAE of 2.64, 9.31, 6.57, and 8.36, respectively [30]. In contrast, a study applied an LSTM model to predict the hourly AQI in Montenegro, showing an r2 of 0.91, MSE of 58.80, and MAE of 4.67 [31]. Another study applied an LSTM model to forecast PM2.5 hourly levels in Libya, and the results showed an r2 of 0.98, RMSE of 0.01, and MAE of 0.01 [32].
Previous research has demonstrated the effectiveness of the LSTM model in predicting key air pollutants such as PM2.5, PM10, CO, O3, NO2, and SO2 in New Delhi, India [33]. The LSTM model has also been utilized to forecast the next-day CO, NO2, O3, PM10, SO2 concentrations, and airborne pollen in Madrid, Spain [34]. In Seoul, South Korea, the LSTM model successfully predicted PM10 and PM2.5 concentration levels, outperforming other proposed models [35]. As a deep learning approach adept at processing time series data, LSTM has yielded superior AQI predictions compared to other machine learning models in Tianjin, China [36]. These findings align with the results of this study, further underscoring the robustness and consistency of the LSTM model in air quality forecasting.
The results of this work closely align with the findings from literature. In particular, the PCC (r) for CO, NO2, PM2.5, and PM10 based on the LSTM model of this study is 0.82, 0.83, 0.84, and 0.87, respectively, exceeding those observed in the BKK International Airport. Nevertheless, no direct performance comparison between ANN and LSTM models in air quality forecasting has been documented, partially because of computational costs to construct both models. A novel comparison between the two models in this study may inform researchers of choosing LSTM over ANN models for similar studies in other regions.

3.4. Limitations and Mitigation Strategies

The study presents valuable insights into air quality prediction using advanced ML techniques. However, several limitations may affect the robustness and generalizability of the findings. One notable limitation of this work is the focus on only two algorithms—ANN and LSTM. While both models are powerful on their own, this narrow scope overlooks the potential benefits of other ML techniques, such as Support Vector Machines (SVM), Random Forests (RF), or Gradient Boosting (GB) [36]. Future research should consider a broader range of algorithms to compare their effectiveness in predicting air quality indices [37]. Incorporating ensemble methods, which combine multiple models, could also enhance prediction accuracy and robustness [38].
Additionally, this study relies on data from specific meteorological and air quality monitoring stations, which may not capture the full spatial and temporal variability of pollutants across the region. The dataset’s gaps or uncertainties could lead to biased results. To mitigate this limitation, future studies could integrate additional data sources, such as satellite observations or mobile sensor networks, to provide a more comprehensive view of air quality [39]. Implementing data validation techniques, such as cross-validation and outlier detection, can also improve the reliability of the dataset used for modeling [40].
The findings are specific to the coastal region of Macau SAR, which may limit their applicability to other geographic areas with different environmental and socioeconomic contexts. To enhance generalizability, subsequent research should test the models in various urban settings with diverse pollution sources and meteorological conditions. Conducting comparative studies across different regions could also provide insights into the adaptability of the models to other air quality scenarios.
The models in this study also focus on short-term predictions and might not adequately account for long-term trends or seasonal variations in air quality. This limitation could hinder the ability to understand and address chronic air pollution issues. Future research should explore incorporating long-term forecasting models that consider historical trends and seasonal patterns, allowing for more informed decision-making regarding air quality management.
While ANN and LSTM models can yield accurate predictions, they function as “black boxes”, making interpreting the underlying mechanisms that drive the predictions challenging. This lack of transparency can complicate policy recommendations based on model outcomes. To mitigate this, researchers could employ explainable AI techniques that enhance model interpretability, such as SHAP (SHapley Additive exPlanations) values or LIME (Local Interpretable Model-agnostic Explanations), helping stakeholders understand factors influencing air quality predictions [41,42].

3.5. Implications for Air Quality Management and Public Health Protection

The study has significant implications for air quality management and public health protection in different urban areas worldwide [43]. Accurate forecasting of air quality indicators, such as PM10, PM2.5, CO, O3, NO2, and SO2, is crucial for effective air quality management. Utilizing models like ANN and LSTM, local authorities can anticipate pollution episodes and implement timely interventions, such as traffic regulation or industrial emission controls. This proactive approach can help reduce air pollution, which is linked to climate change through its contribution to greenhouse gases (e.g., O3 and NO2) and other pollutants (e.g., black carbon) that exhibit warming potentials [44]. The emission of carbon dioxide (CO2) has been considered an important source of air pollution, leading to further concern due to its climatic effects as a key greenhouse gas [45].
The study underscores the importance of integrating environmental considerations into urban planning by offering detailed air quality predictions in densely populated areas. Enhanced forecasting capabilities can inform the design of green spaces, sustainable transportation systems, and pollution control measures. This integration supports urban resilience to climate impacts, ultimately contributing to the sustainable development of cities worldwide. Such data-driven programs and policy decisions align with global goals like the United Nations Sustainable Development Goals (UN SDGs), in particular SDG3 (Good Health and Well-Being), SDG11 (Sustainable Cities and Communities), SDG13 (Climate Action), and SDG15 (Life on Land) [46,47].
The research highlights the potential for machine learning models to serve as educational tools for the public and stakeholders. Local authorities can raise awareness about pollution sources and their health impacts by disseminating information about predicted air quality levels. Increased public engagement can foster community support for climate initiatives and motivate individuals to adopt environmentally friendly practices, thus contributing to broader air pollution mitigation efforts [48,49].

4. Conclusions

The ANN and LSTM models have proven effective in predicting concentrations of AQI pollutants, including PM10, PM2.5, NO2, O3, SO2, and CO. This study is particularly significant due to the large number of residents utilizing the nearby border-crossing facilities adjacent to the Macau High-Density Residential AQMS. This research represents the first comprehensive assessment and prediction of air quality near these critical border-crossing points in Macau.
The results indicate that LSTM models consistently outperformed ANN models in predicting the six key AQI pollutants, as evidenced by higher PCC and KTC values and lower RMSE and MAE. Furthermore, the LSTM model exhibited better reproducibility than the ANN model, highlighting its consistency and robustness in air quality forecasting. The LSTM model achieved the best performance in predicting PM10, followed closely by O3, showcasing the model’s capability to predict both particulate and gaseous pollutants.
The findings may serve as valuable guidance for local authorities in formulating policies to mitigate air pollution issues in high-traffic areas that adversely affect public health. Future research could expand upon this work by incorporating additional ML algorithms and consider building a forecasting model for persistent organic pollutants (POPs) and heavy metals found in PM2.5 [50,51]. A prediction model for a traffic-restricted zone in cities and urban areas with IoT sensors may also be considered in future works [52,53].

Author Contributions

Conceptualization, T.M.T.L. and J.C.; methodology, J.C.; software, J.C.; validation, A.H.M., T.A.K. and M.S.M.N.; formal analysis, S.S.-K.K. and L.-W.A.C.; investigation, T.M.T.L.; resources, T.M.T.L. and W.-H.C.; data curation, T.M.T.L. and J.C.; writing—original draft preparation, T.M.T.L. and T.A.K.; writing—review and editing, T.M.T.L., A.H.M., T.A.K., M.S.M.N., S.S.-K.K. and L.-W.A.C.; visualization, J.C.; supervision, T.M.T.L.; project administration, L.-W.A.C.; funding acquisition, T.M.T.L. and W.-H.C. All authors have read and agreed to the published version of the manuscript.

Funding

The APC was partially funded by INTI International University and an IOAP discount by the University of Nevada, Las Vegas (UNLV).

Data Availability Statement

This study used third-party data. Restrictions apply to the availability of these data.

Acknowledgments

The developed work was supported by the Macao Meteorological and Geophysical Bureau (SMG) and the Hong Kong Observatory (HKO).

Conflicts of Interest

The authors declare no conflicts of interest.

References

  1. SMG. Definition of Air Quality Index; SMG: Macao, China, 2021. [Google Scholar]
  2. Statistics and Census Service (DSEC). Tourism Statistics: Whole Year and 4th Quarter of 2024. 2024. Available online: https://www.dsec.gov.mo/getAttachment/6dc2a848-1201-4d87-99ea-3ee4a18c90ba/E_TUR_FR_2024_Q4.aspx (accessed on 1 January 2025).
  3. Statistics and Census Service (DSEC). Transport and Communication Statistics. Number of Licensed Motor Vehicles. 2024. Available online: https://www.dsec.gov.mo/getAttachment/1553b21c-97cb-4ea1-985c-83a972a85d9f/E_ETC_FR_2024_M12.aspx (accessed on 1 January 2025).
  4. Statistics and Census Service (DSEC). Gross Domestic Product: 4th Quarter of 2024. 2024. Available online: https://www.dsec.gov.mo/getAttachment/1dbae334-44e8-4699-b672-4ec7667282b2/E_PIB_FR_2024_Q4.aspx (accessed on 1 January 2025).
  5. World Health Organization (WHO). WHO Global Air Quality Guidelines. 2021. Available online: https://iris.who.int/bitstream/handle/10665/345329/9789240034228-eng.pdf?sequence=1 (accessed on 1 January 2025).
  6. Macau Meteorological and Geophysical Bureau (SMG). Macau Air Quality Monitoring Statistics Annual Report 2024. 2024. Available online: https://cms.smg.gov.mo/uploads/sync/pdf/AIR_report/c_IQA_annual_report/IQA_2024.pdf (accessed on 1 January 2025).
  7. Anggraini, T.S.; Irie, H.; Sakti, A.D.; Wikantika, K. Machine learning-based global air quality index development using remote sensing and ground-based stations. Environ. Adv. 2024, 15, 100456. [Google Scholar] [CrossRef]
  8. Glencross, D.A.; Ho, T.R.; Camiña, N.; Hawrylowicz, C.M.; Pfeffer, P.E. Air pollution and its effects on the immune system. Free Radic. Biol. Med. 2020, 151, 56–68. [Google Scholar] [CrossRef] [PubMed]
  9. Conibear, L.; Reddington, C.L.; Silver, B.J.; Arnold, S.R.; Turnock, S.T.; Klimont, Z.; Spracklen, D.V. The contribution of emission sources to the future air pollution disease burden in China. Environ. Res. Lett. 2022, 17, 064027. [Google Scholar] [CrossRef]
  10. Cusworth, D.H.; Mickley, L.J.; Sulprizio, M.P.; Liu, T.; Marlier, M.E.; Defries, R.S.; Guttikunda, S.K.; Gupta, P. Quantifying the influence of agricultural fires in northwest India on urban air pollution in Delhi, India. Environ. Res. Lett. 2018, 13, 044018. [Google Scholar] [CrossRef]
  11. Goyal, P.; Gulia, S.; Goyal, S.K. Review of land use specific source contributions in PM 2.5 concentration in urban areas in India. Air Qual. Atmos. Health 2021, 14, 691–704. [Google Scholar] [CrossRef]
  12. Tian, M.; Gao, J.; Zhang, L.; Zhang, H.; Feng, C.; Jia, X. Effects of dust emissions from wind erosion of soil on ambient air quality. Atmos. Pollut. Res. 2021, 12, 101108. [Google Scholar] [CrossRef]
  13. Murthy, B.S.; Latha, R.; Tiwari, A.; Rathod, A.; Singh, S.; Beig, G. Impact of mixing layer height on air quality in winter. J. Atmos. Sol.-Terr. Phys. 2020, 197, 105157. [Google Scholar] [CrossRef]
  14. Vardoulakis, S.; Giagloglou, E.; Steinle, S.; Davis, A.; Sleeuwenhoek, A.; Galea, K.S.; Dixon, K.; Crawford, J.O. Indoor exposure to selected air pollutants in the home environment: A systematic review. Int. J. Environ. Res. Public Health 2020, 17, 8972. [Google Scholar] [CrossRef]
  15. Wood, D.A. Local integrated air quality predictions from meteorology (2015 to 2020) with machine and deep learning assisted by data mining. Sustain. Anal. Model. 2022, 2, 100002. [Google Scholar] [CrossRef]
  16. Varotsos, C.A.; Mazei, Y.; Saldaev, D.; Efstathiou, M.; Voronova, T.; Xue, Y. Nowcasting of air pollution episodes in megacities: A case study for Athens, Greece. Atmos. Pollut. Res. 2021, 12, 101099. [Google Scholar] [CrossRef]
  17. Almetwally, A.A.; Bin-Jumah, M.; Allam, A.A. Ambient air pollution and its influence on human health and welfare: An overview. Environ. Sci. Pollut. Res. 2020, 27, 24815–24830. [Google Scholar] [CrossRef] [PubMed]
  18. Lei, T.M.T.; Siu, S.W.I.; Monjardino, J.; Mendes, L.; Ferreira, F. Using Machine Learning Methods to Forecast Air Quality: A Case Study in Macao. Atmosphere 2022, 13, 1412. [Google Scholar] [CrossRef]
  19. Shahrabadi, S.; Adão, T.; Peres, E.; Morais, R.; Magalhães, L.G.; Alves, V. Automatic Optimization of Deep Learning Training through Feature-Aware-Based Dataset Splitting. Algorithms 2024, 17, 106. [Google Scholar] [CrossRef]
  20. Shumailov, I.; Shumaylov, Z.; Zhao, Y.; Papernot, N.; Anderson, R.; Gal, Y. AI models collapse when trained on recursively generated data. Nature 2024, 631, 755–759. [Google Scholar] [CrossRef]
  21. Gu, J.; Yang, B.; Brauer, M.; Zhang, K.M. Enhancing the evaluation and interpretability of data-driven air quality models. Atmos. Environ. 2021, 246, 118125. [Google Scholar] [CrossRef]
  22. Lei, T.M.T.; Cai, J.; Molla, A.H.; Kurniawan, T.A.; Kong, S.S.-K. Evaluation of Machine Learning Models in Air Pollution Prediction for a Case Study of Macau as an Effort to Comply with UN Sustainable Development Goals. Sustainability 2024, 16, 7477. [Google Scholar] [CrossRef]
  23. Yang, G.; Lee, H.M.; Lee, G. A hybrid deep learning model to forecast particulate matter concentration levels in Seoul, South Korea. Atmosphere 2020, 11, 348. [Google Scholar] [CrossRef]
  24. Shams, S.R.; Jahani, A.; Kalantary, S.; Moeinaddini, M.; Khorasani, N. The evaluation on artificial neural networks (ANN) and multiple linear regressions (MLR) models for predicting SO2 concentration. Urban Clim. 2021, 37, 100837. [Google Scholar] [CrossRef]
  25. Ma, J.; Li, Z.; Cheng, J.C.P.; Ding, Y.; Lin, C.; Xu, Z. Air quality prediction at new stations using spatially transferred bi-directional long short-term memory network. Sci. Total Environ. 2020, 705, 135771. [Google Scholar] [CrossRef]
  26. Athira, V.; Geetha, P.; Vinayakumar, R.; Soman, K.P. DeepAirNet: Applying Recurrent Networks for Air Quality Prediction. Procedia Comput. Sci. 2018, 132, 1394–1403. [Google Scholar] [CrossRef]
  27. Wang, J.; Song, G. A Deep Spatial-Temporal Ensemble Model for Air Quality Prediction. Neurocomputing 2018, 314, 198–206. [Google Scholar] [CrossRef]
  28. Raheja, S.; Malik, S. Prediction of Air Quality Using LSTM Recurrent Neural Network. Int. J. Softw. Innov. 2022, 10, 1–6. [Google Scholar] [CrossRef]
  29. Wei, S.; Shores, K.; Xu, Y. A Comparison of Machine Learning-Based Approaches in Estimating Surface PM2.5 Concentrations Focusing on Artificial Neural Networks and High Pollution Events. Atmosphere 2025, 16, 48. [Google Scholar] [CrossRef]
  30. Kamsing, P.; Cao, C.; Boonpook, W.; Boonprong, S.; Xu, M.; Boonsrimuang, P. Artificial Neural Network for Air Pollutant Concentration Predictions Based on Aircraft Trajectories over Suvarnabhumi International Airport. Atmosphere 2025, 16, 366. [Google Scholar] [CrossRef]
  31. Ratković, K.; Kovač, N.; Simeunović, M. Hybrid LSTM Model to Predict the Level of Air Pollution in Montenegro. Appl. Sci. 2023, 13, 10152. [Google Scholar] [CrossRef]
  32. Esager, M.W.M.; Ünlü, K.D. Forecasting Air Quality in Tripoli: An Evaluation of Deep Learning Models for Hourly PM2.5 Surface Mass Concentrations. Atmosphere 2023, 14, 478. [Google Scholar] [CrossRef]
  33. Navares, R.; Aznarte, J.L. Predicting air quality with deep learning LSTM: Towards comprehensive models. Ecol. Inform. 2020, 55. [Google Scholar] [CrossRef]
  34. Xayasouk, T.; Lee, H.M.; Lee, G. Air pollution prediction using long short-term memory (LSTM) and deep autoencoder (DAE) models. Sustainability 2020, 12, 2570. [Google Scholar] [CrossRef]
  35. Chen, W.; Bingchun, L.; Jiali, C.; Xiaogang, Y. Air Quality Index Prediction Based on a Long Short-Term Memory Artificial Neural Network Model. J. Comput. 2023, 34, 69–79. [Google Scholar] [CrossRef]
  36. Tang, D.; Zhan, Y.; Yang, F. A review of machine learning for modeling air quality: Overlooked but important issues. Atmos. Res. 2024, 300, 107261. [Google Scholar] [CrossRef]
  37. Samad, A.; Garuda, S.; Vogt, U.; Yang, B. Air pollution prediction using machine learning techniques—An approach to replace existing monitoring stations with virtual monitoring stations. Atmos. Environ. 2023, 310, 119987. [Google Scholar] [CrossRef]
  38. Rowley, A.; Karakuş, O. Predicting air quality via multimodal AI and satellite imagery. Remote Sens. Environ. 2023, 293, 113609. [Google Scholar] [CrossRef]
  39. Ahmad, M.; Cheng, W.; Xu, Z.; Kalam, A. Outlier Detection of Air Quality for Two Indian Urban Cities Using Functional Data Analysis. Open J. Air Pollut. 2023, 12, 79–91. [Google Scholar] [CrossRef]
  40. Lei, T.M.T.; Ng, S.C.W.; Siu, S.W.I. Application of ANN, XGBoost, and Other ML Methods to Forecast Air Quality in Macau. Sustainability 2023, 15, 5341. [Google Scholar] [CrossRef]
  41. Houdou, A.; El Badisy, I.; Khomsi, K.; Abdala, S.A.; Abdulla, F.; Najmi, H.; Obtel, M.; Belyamani, L.; Ibrahimi, A.; Khalis, M. Interpretable Machine Learning Approaches for Forecasting and Predicting Air Pollution: A Systematic Review. Aerosol Air Qual. Res. 2024, 24, 230151. [Google Scholar] [CrossRef]
  42. Kurniawan, T.A.; Khan, S.; Mohyuddin, A.; Haider, A.; Lei, T.M.T.; Othman, M.H.D.; Goh, H.H.; Zhang, D.; Anouzla, A.; Aziz, F.; et al. Technological solutions for air pollution control to mitigate climate change: An approach to facilitate global transition toward blue sky and net-zero emission. Chem. Pap. 2024, 78, 6843–6871. [Google Scholar] [CrossRef]
  43. Maione, M.; Fowler, D.; Monks, P.S.; Reis, S.; Rudich, Y.; Williams, M.L.; Fuzzi, S. Air quality and climate change: Designing new win-win policies for Europe. Environ. Sci. Policy 2016, 65, 48–57. [Google Scholar] [CrossRef]
  44. Hadipoor, M.; Keivanimehr, F.; Baghban, A.; Ganjali, M.R.; Habibzadeh, S. Carbon dioxide as a main source of air pollution: Prospective and current trends to control. In Sorbents Materials for Controlling Environmental Pollution; Elsevier: Amsterdam, The Netherlands, 2021; pp. 623–688. [Google Scholar]
  45. Afifa Arshad, K.; Hussain, N.; Ashraf, M.H.; Saleem, M.Z. Air pollution and climate change as grand challenges to sustainability. Sci. Total Environ. 2024, 928, 172370. [Google Scholar] [CrossRef]
  46. Ofremu, G.O.; Raimi, B.Y.; Yusuf, S.O.; Dziwornu, B.A.; Nnabuife, S.G.; Eze, A.M.; Nnajiofor, C.A. Exploring the Relationship between Climate Change, Air Pollutants and Human Health: Impacts, Adaptation, and Mitigation Strategies. Green Energy Resour. 2024; in press. [Google Scholar] [CrossRef]
  47. Zhu, S.; Yu, H.; Zhang, Y.; Zhang, Y.; Kinnon, M.M. Editorial: Air pollution and climate change: Interactions and co-mitigation. Front. Environ. Sci. 2022, 10, 1105656. [Google Scholar] [CrossRef]
  48. Khan, M.M.H.; Kurniawan, T.A.; Chandra, I.; Lei, T.M.T. Modeling PM10 Emissions in Quarry and Mining Operations: Insights from AERMOD Applications in Malaysia. Atmosphere 2025, 16, 369. [Google Scholar] [CrossRef]
  49. Mykhailenko, V.; Nitsenko, V.S.; Gerasymchuk, N.; Sambulov, A.; Demchuk, V. Air pollution by persistent organic pollutants from organic fuel combustion by stationary sources: The case of the Odesa agglomeration. Environ. Syst. Res. 2024, 13, 51. [Google Scholar] [CrossRef]
  50. Bakar Attiq, A.; Nawaz, R.; Atif Irshad, M.; Nasim, I.; Nasim, M.; Latif, M.; Hussain Shah, S.I.; Fatima, A. Urban Air Quality Nexus: PM2.5 Bound-Heavy Metals and their Alarming Implication for Incremental Lifetime Cancer Risk. Pollution 2024, 10, 580–594. [Google Scholar]
  51. Pastor-Fernández, A.; Lama-Ruiz, J.-R.; Otero-Mateo, M.; Narváez, A.C.; Ramírez-Peña, M.; Alzola, A.S. Air Quality Assessment During the Initial Implementation Phase of a Traffic-Restricted Zone in an Urban Area: A Case Study Based on NO2 Levels in Seville, Spain. Processes 2025, 13, 645. [Google Scholar] [CrossRef]
  52. Banciu, C.; Florea, A.; Bogdan, R. Monitoring and Predicting Air Quality with IoT Devices. Processes 2024, 12, 1961. [Google Scholar] [CrossRef]
  53. Bodić, M.; Rajs, V.; Vasiljević Toskić, M.; Bajić, J.; Batinić, B.; Arbanas, M. Methods of Measuring Air Pollution in Cities and Correlation of Air Pollutant Concentrations. Processes 2023, 11, 2984. [Google Scholar] [CrossRef]
Figure 1. Locations of the AQMS in Macau SAR (adapted from SMG). The Macau High Density Residential Area AQMS is marked by a red dotted circle.
Processes 13 01507 g001
Figure 2. Study workflow for air pollution prediction.
Processes 13 01507 g002
Figure 3. Observed and predicted concentrations of PM10 using the ANN model for the years 2020 and 2021 (with residual plot).
Processes 13 01507 g003
Figure 4. Observed and predicted concentrations of CO using the ANN model for the years 2020 and 2021 (with residual plot).
Processes 13 01507 g004
Figure 5. Observed and predicted concentrations of NO2 using the ANN model for the years 2020 and 2021 (with residual plot).
Processes 13 01507 g005
Figure 6. Observed and predicted concentrations of PM10 using the LSTM model for the years 2020 and 2021 (with residual plot).
Processes 13 01507 g006
Figure 7. Observed and predicted concentrations of CO using the LSTM model for the years 2020 and 2021 (with residual plot).
Processes 13 01507 g007
Figure 8. Observed and predicted concentration of O3 using the LSTM model for the years 2020 and 2021 (with residual plot).
Processes 13 01507 g008
Table 1. WHO Annual AQG vs. MAQI.
Air PollutantsWHO AQG 2021 (in µg/m3)MAQI 2024 (in µg/m3)
PM1015.042.4
PM2.55.020.2
SO240.04.8
NO210.043.2
O360.066.5
CO4.00.9
Table 2. Data Summary Used in This Study.
PollutantNumber of Instances of the Training Set (Entries of Daily Concentrations)Number of Instances of the Test Set (Entries of Daily Concentrations)Total
(Entries of Daily Concentrations)
PM1015007262226
PM2.514867262212
NO215027262228
O315467262272
SO214897262215
CO15637262289
Table 3. Variables used in the ANN and LSTM models.
Categories of DataParametersDescription of Parameters
Air VariablesPM10, PM2.5, NO2, O3, SO2, COHourly mean concentration readings (micrograms per cubic meter)
16D1, 23D0, 23D1, 23D2, 23D316D1: The average 24 h concentration period from 4:00 pm of D1 to 3:00 pm of D0
23D0: The average 24 h concentration period between 12:00 am and 11:59 pm of D0
23D1: The average 24 h concentration period between 12:00 am and 11:59 pm of D1
23D2: The average 24 h concentration period between 12:00 am and 11:59 pm of D2
23D3: The average 24 h concentration period between 12:00 am and 11:59 pm of D3
D0, D1, D2, D3D0: Day of Prediction; D1: One Day Before Day of Prediction; D2: Two Days Before Day of Prediction; D3: Three Days Before Day of Prediction
Weather VariablesH1000, H850, H700, H500Geopotential height at 1000, 850, 700, and 500 hectopascals (in meters)
TAR925, TAR850, TAR700Temperature of Air at 925, 850, and 700 Hectopascals (in Celsius)
HR925, HR850, HR700Relative humidity at 925, 850, and 700 hectopascal (in percentage)
TD925, TD850, TD700Temperature of Dew point at 925, 850, and 700 (in Celsius)
THI850, THI700, THI500Thickness of Air at 850, 700, and 500 Hectopascals (in meters)
STB925, STB850, STB700Stability of Air at 925, 850, and 700 hectopascal (in Celsius)
T_AIR_MX, T_AIR_MD, T_AIR_MNTemperature of Air (max, average, and min) (in Celsius)
HRMX, HRMD, HRMNRelative Humidity (max, average, and min) (in percentage)
TD_MDAverage Temperature of Dew Point (in Celsius)
RRTTWet Deposition (in mm)
VMEDAverage Speed of Wind (in m/s)
PREV_WDIRPrevailing direction of wind (in degree)
Other VariablesDDHours of Sunshine in a day (in hour)
FFWeekday or Weekend: weekday = 0 and weekend = 1
Table 4. Model Parameters and Hyperparameters applied in the ANN and LSTM models.
ModelsModel Parameters and Hyperparameters
ANNlearning rate0.0005
epochs100
batch_size32
validation split0.3
LSTMoptimizeradam
epochs20
batch size64
Table 5. Model performance indicator of the ANN and LSTM model in forecasting the six air pollutants found in AQI.
ModelPollutantModel Performance Indicator
MB (µg/m3)MFB (µg/m3)RMSE (µg/m3)MAE (µg/m3)PCC (r)KTC
ANNPM104.590.1115.4211.830.840.66
PM2.53.910.2611.058.780.760.56
NO26.050.1310.347.710.830.61
O3−8.020.4316.7013.050.760.56
SO20.04−0.052.361.890.700.50
CO0.100.120.210.170.770.58
LSTMPM106.620.1813.4410.890.870.70
PM2.58.250.5410.028.720.840.65
NO27.040.2611.529.620.830.59
O34.900.2911.609.710.850.63
SO20.440.191.441.150.830.66
CO0.060.090.140.110.820.62
The Bold Indicate the Best Performance for Each Catergories.
Table 6. SD after 5 model runs for ANN and LSTM.
ModelPollutantModel Performance Indicator
MB (µg/m3)MFB (µg/m3)RMSE (µg/m3)MAE (µg/m3)PCC (r)KTC
ANNPM104.380.104.353.490.050.07
PM2.50.940.054.643.900.070.07
NO23.070.062.812.150.080.11
O33.761.715.964.560.090.09
SO20.650.200.490.440.070.07
CO0.040.040.090.060.050.03
LSTMPM101.160.021.161.090.020.02
PM2.50.850.031.751.680.020.03
NO22.300.060.880.950.030.09
O31.070.041.291.170.020.04
SO20.170.060.420.350.080.07
CO0.010.020.020.020.020.03
The Bold Indicate the Best Performance for Each Catergories.
Disclaimer/Publisher’s Note: The statements, opinions and data contained in all publications are solely those of the individual author(s) and contributor(s) and not of MDPI and/or the editor(s). MDPI and/or the editor(s) disclaim responsibility for any injury to people or property resulting from any ideas, methods, instructions or products referred to in the content.

