Article

Study of Specific Problems Arising in the Blending Processes of Crude Oils (Based on the Examples of Azerbaijan Oils)

by
Xiuyu Wang
1,
Gafar Ismayilov
2,
Elman Iskandarov
3,
Elnur Alizade
2,* and
Fidan Ismayilova
3
1
College of Petroleum Engineering, China University of Petroleum, Beijing 102249, China
2
Department of Petroleum Engineering, Azerbaijan State Oil and Industry University, Baku AZ1010, Azerbaijan
3
Department of Oil and Gas Transportation and Storage, Azerbaijan State Oil and Industry University, Baku AZ1010, Azerbaijan
*
Author to whom correspondence should be addressed.
Processes 2025, 13(5), 1500; https://doi.org/10.3390/pr13051500
Submission received: 7 March 2025 / Revised: 2 May 2025 / Accepted: 12 May 2025 / Published: 13 May 2025
(This article belongs to the Special Issue Advanced Technology in Unconventional Resource Development)

Abstract

:
Experiences in the production, transportation and preparation of crude oil for transportation have shown that specific problems arise related to their mixing, including water contamination. In recent years, interest in studying these problems has significantly increased, mainly due to the development of extraction technologies for heavy oil samples and bitumen. Along with various difficulties encountered during the pipeline transportation of complex rheological crude oil blended with each other and with light oil, including condensate (such as sedimentation, etc.), imbalances are also observed during storage, as well as in the processes of delivery and reception. During the dehydration of oil mixtures, a synergistic effect is observed in the consumption of demulsifier. The article investigates, in accordance with international standards and based on laboratory tests, how the physico-chemical properties (density, viscosity, freezing point, saturated vapor pressure, chemical composition) of mixtures formed by blending various grades and compositions of Azerbaijani oil examples with each other and with condensate change and how the efficiency of dehydration of oil mixtures is affected by the mixing ratio of the oil involved. It was found that the quality indicators (physico-chemical parameters) of oil mixtures differ non-additively from the initial parameters of the blended products and in some cases, this difference is even observed with anomalies. Moreover, depending on the mixing ratio of the oil, variations in the consumption of demulsifier were also identified.

1. Introduction

In oil and gas production practice, the mixing of various grades of crude oil and petroleum products during storage, preparation and transportation processes is widely observed. The mixing of crude oil occurs during their collection and transportation through manifold-flowline pipelines, as well as in tanks. Scientific research and experimental studies conducted in recent years have shown that, for some oil mixtures, there are frequent cases of abrupt and anomalous changes in parameters of practical importance such as density, viscosity, freezing point, volume and others. Proper management of transportation parameters and energy characteristics is of great importance for increasing the efficiency and reliability of crude oil and petroleum product transportation through pipelines [1,2,3,4,5,6].
At all stages of collection, preparation, transportation and storage, one of the most significant factors influencing the quality indicators and changes in the physico-chemical and rheological properties of oil is their blending. The mixing of different types of crude oil samples and oil products also occurs during sequential transportation through pipelines. Specifically, in the contact zones between two sequentially transported products, a certain volume of a mixed blend typically forms.
In many cases, due to the “incompatibility” of different crude oil types during mixing, the formation of various blockages and deposits can occur in technological gathering and transportation pipelines. Additionally, parameters of practical importance for oil mixtures, such as density, viscosity, freezing point and volume, may undergo anomalous changes. It is even possible that the blending of two individually “good” and stable crude oil samples may result in the formation of a “problematic” mixture characterized by the precipitation of heavy particles (Figure 1). Since such oil pairs can be considered “undesirable combinations”, it is critically important to account for the incompatibility factor during their mixing [7,8,9,10,11].
Analysis shows that during the collection, preparation and transportation of well products with different rheophysical properties, including water-cut crude oils via pipeline systems, the changes in quality parameters of the resulting oil mixtures are almost never considered and in most cases are not even the subject of study [1,3,4,5,6]. It is well known that the quality indicators of commercial crude oil are primarily determined by their density and sulfur content (by mass fraction). An increase in these indicators not only deteriorates the quality of the crude oil but also reduces its market value. It can be assumed that the price of one ton of crude oil is inversely proportional to its density and sulfur content. Heavy crude oil with a high density is not delivered to terminals or general-purpose pipelines. Such types of oil are pre-blended with higher-quality light crude oil or gas condensates to dilute and improve their quality before being delivered. In general, crude oil with a sulfur content exceeding 2% must be pre-treated or blended with higher-quality crude. Thus, during the delivery of crude oil of various qualities, mixing occurs at terminals and within pipelines. As a result, since the quality of the mixture differs from the quality of the individual crude oil being blended, a corresponding difference in their market prices inevitably arises. Regardless of the delivery method to terminals, be it pipeline, railway or marine transport, the key point is that the actual quality indicators and price per ton of all types of incoming and outgoing blended crude oil must be determined in the laboratory at the terminal’s entry and exit points. In practice, due to the blending of oil samples, the price difference per ton of crude oil between the entry and exit of a terminal may reach 10 or even hundreds of U.S. dollars. Such differences are typically managed through the use of a “crude oil quality bank”.
Furthermore, the list of quality indicators for crude oil is much broader, including parameters such as density, mechanical mixtures, chloride salts, paraffin content, resin and asphaltene levels, freezing point, etc. Field experience shows that although blending different grades of crude is often “undesirable”, it inevitably occurs in storage tanks and transportation systems (pipelines). When different types of crude oil are blended in the same storage tank at production sites, their quality parameters and the accuracy of accounting are significantly affected. It is no coincidence that in such cases, substantial discrepancies arise between measured values in crude oil accounting at reception and delivery points.
Obtaining information about the quality parameters of crude oil during blending is essential not only for accounting purposes of petroleum products but also for predicting the operational regimes of blending facilities, storage tanks and processing plants where these mixtures are formed. Global practice shows that the effect of crude oil blending on their physico-chemical and rheological properties can significantly differ from the models and calculation schemes attributed to ideal solutions (mixtures) [1,8,12]. For many years, assessments of “incompatibility” observed during the blending of various fuel mixtures or crude oil with each other or with solvents were mainly associated with the formation of solid precipitates. However, research on natural crude oil mixtures since the 1990s has revealed that this incompatibility problem can manifest not only in the form of sedimentation but also through anomalous changes in practical parameters such as volume, density, viscosity and others [1,2,12,13].
Studies show that if the properties of the blending components differ significantly, the volume of the resulting mixture may be less than the sum of the individual component volumes. This type of volume loss is not related to the physical loss of matter and the mass of the transported load remains unchanged during blending. It is no coincidence that the normative document titled “Volume Loss on Mixing of Light Hydrocarbons with Crude Oils” was published by the American Petroleum Institute in 1996 [14]. According to this document, if the density difference between the blending crude oil samples (or petroleum products) exceeds 40 kg/m3, the investigation of volume loss is considered essential.
Given the significant practical importance of this issue, studying how rheological and physico-chemical parameters, i.e., quality indicators, change in laboratory conditions for mixtures formed by blending various types of crude oil with each other or with light solvents is crucial for transportation, storage and preparation processes. Unfortunately, the majority of such studies belong to private companies and are not published in the open access literature. Among the few published works, a study from 2002 can be noted [14,15], which focused on evaluating the density and viscosity of crude oil mixtures using Iraqi crude oil samples.
In many cases, the phenomenon of non-additivity during crude oil blending was also identified by researchers [1,12,16] when mixing “light” crude oil with a density of 818.3 kg/m3 and “heavy” crude oil with a density of 893.2 kg/m3 in various ratios. The measurements revealed non-monotonic dependencies of density and viscosity on the mass fraction of the light crude oil.
Despite the molecular nature of the problem being understood in terms of quality, there is a very limited number of studies dedicated to the “volume loss during mixing” and other above-mentioned issues of incompatibility. Authors [17,18,19] determined that, for incompatible crude oil pairs, all data points fall within a narrow region in the dependency domain of solubility/insolubility parameters.
The article also presents a new “unified scaling model” that accurately describes the viscosity variation of crude oil over a wide temperature range [20]. This model was applied by analyzing experimental data from twenty crude oil samples collected from various fields in Russia, China, Saudi Arabia, Nigeria, Kuwait and the North Sea region. The new model is proposed as a more reliable method for studying the flow characteristics of complex and high-viscosity crude oil and optimizing technological processes.
The study investigated the transportation technology of emulsions in long-operated crude oil pipelines where low flow velocity problems are encountered and water droplets are entirely dispersed in the oil. The objective was to ensure complete emulsification of oil and water to prevent internal corrosion and improve operational efficiency. The results demonstrated that emulsion transportation reduces heat losses in the pipeline, enhances flowability and significantly decreases corrosion risks. This method is proposed as a technically and economically efficient solution, particularly for mature and declining production oil fields [21,22].

2. Materials and Methods

Considering the aforementioned issues, the objective of this study was to determine the changes in physico-chemical and rheological parameters that occur in crude oil mixtures formed as a result of blending different crude oil. For this purpose, crude oil samples produced from the “Bulla” and “Siyazan” fields of Azerbaijan were used. The initial laboratory analysis results and the test methodologies (GOST standards) for the physical, chemical and rheological properties of the Bulla (BN) and Siyazan (SN) crude oil examples are presented in Table 1.
For instance, crude oil samples extracted from the “Bulla-BN” and “Siyazan-SN” (Azerbaijan) fields were used as the research objects. The results of initial laboratory analyses reflecting the physico-chemical and rheological properties of these oil samples, as well as the methods used for testing (GOST standards), are presented in Table 1. As seen in Table 1, the selected oil samples differ in composition and properties.

3. Results

For the purposes of the research, BN crude oil was blended with SN crude oil in various proportions under laboratory conditions. In accordance with GOST standards, key parameters of the resulting mixtures were determined under standard conditions (20 °C), including density, kinematic viscosity, content of resins, asphaltenes and paraffins, saturated vapor pressure, freezing point and the amount of mechanical mixtures. The variations in these parameters depending on the mixing ratio of SN crude oil with BN crude oil are presented in Table 2 and Figure 2, Figure 3, Figure 4 and Figure 5.
As seen in Figure 2, Figure 3, Figure 4 and Figure 5, the variation in quality indicators during the mixing of Bulla oil (BN) and Siyazan oil (SN), depending on the mass fraction of BN, does not follow the rule of additivity. Specifically, parameters such as density, viscosity, resin content and freezing point increase sharply, while the saturated vapor pressure undergoes significant changes. These changes predominantly occur when the BN content reaches 50%. Although this paradoxical behavior has been confirmed experimentally, its underlying cause remains unclear.
The non-monotonic nature of the dependencies of quality indicators suggests that the resulting mixtures cannot be considered additive. In several cases, anomalous variations in quality parameters have been observed during the mixing of different oil samples, and in some instances, such mixing has been found to be generally “undesirable”.
In addition, laboratory studies were conducted to investigate how the mixing of oil emulsions with different water content levels, as well as their mixing with condensate, affects the quality indicators of the mixtures and the efficiency of the dehydration process of emulsions [32,33,34].
As research objects, two oil examples (oil 1 and oil 2) with differing physico-chemical and rheological properties and water contents of 34% and 75%, respectively, were selected, along with a water-free condensate sample. Condensate, oil 1, oil 2, and mixtures of these types of oil in a 50:50% ratio were studied under laboratory conditions in accordance with the relevant GOST and regulatory standards. Their physico-chemical properties (quality indicators—density, viscosity, freezing point and the content of ballast substances) were determined (Table 3). As shown in Table 3, the oil samples are heavy oil and differ significantly in nearly all parameters. The condensate sample, on the other hand, has a low freezing point (−1.6 °C) and contains no water. It also contains high-molecular-weight compounds such as resins, asphaltenes and paraffins.
The necessity of studying the mixing of rheologically complex oil, including oil emulsions with each other and with condensate, has arisen from practical needs. Specifically, in Azerbaijan’s offshore gas-condensate fields, it is common practice to transport produced condensate by mixing it with oil during collection and transportation.
In practice, it is well known that the addition of condensate to rheologically complex, heavy oil improves their transportability and reduces transportation costs. Laboratory test results also confirmed that, depending on the mass fraction of condensate, the changes in the quality indicators of heavy oil, excluding chloride salts and mechanical mixtures are non-additive. For all three tested samples, anomalies were observed specifically in the change in the oil’s freezing point.
For example, Table 4 presents the variation in quality indicators for various mixtures of condensate with the first oil emulsion (which has a water content of 75%) at 20 °C, depending on the mass fraction of condensate. As shown in Table 4, all parameters except chloride salts and mechanical mixtures deviate from the rule of additivity. Specifically, viscosity decreases monotonically. The variation in density at 20 °C for the oil 1–condensate mixture as a function of condensate mass fraction is shown in Figure 6.
As seen in Figure 6, additive mixing does not occur at condensate concentrations up to 20% and in the range of 40–90%. At the first concentration threshold, the density of the mixture increases compared to the additive mixture, whereas at the second threshold, it decreases. It was also determined that transporting the oil 1–condensate mixture through pipelines is undesirable at low condensate contents (up to 10–15%). This is because, at these concentrations, the freezing point of the oil increases significantly, which complicates pipeline operation and raises the risk of interruption in the transportation process (Figure 7).
As shown in Figure 7, for all tested mixtures, oil 1 + condensate, oil 2 + condensate, and oil 1 (50%) + oil 2 (50%) + condensate, the violation of the additivity rule occurs at nearly the same condensate concentration. At higher concentrations (above 20%), the resulting mixtures become additive.
Interesting results were obtained during the demulsification of various mixtures of “oil 1–oil 2” emulsions using the “Alkan-202” reagent. Specifically, mixtures of oil 1 and oil 2 were selected as research objects in the following mass ratios: (0:1), (0.15:0.85), (0.3:0.7), (0.4:0.6), (0.5:0.5), (0.6:0.4), (0.7:0.3), (0.85:0.15) and (1:0), showed noteworthy dependencies characterizing the variation in reagent consumption at different dehydration levels. These dependencies, corresponding to dehydration degrees of 60%, 70%, 80%, and 90%, are presented in Figure 8.
As shown in Figure 8, the dependencies for the examined dehydration levels of 60%, 70%, 80%, and 90% exhibit almost identical characteristics. The demulsifier consumption required for the individual demulsification of oil 1 and oil 2 is 22.5 and 105 g/t, 40 and 120 g/t, 55 and 137 g/t, and 75 and 152 g/t, respectively. For the 30:70% and 40:60% mixtures, the required demulsifier consumption is even lower compared to oil 2 alone. For example, for an emulsion with a 60% breakdown degree, the reagent consumption for the above-mentioned mixture ratios is 17 and 10 g/t, respectively.
For other mixture ratios, the change in reagent consumption exhibits both increasing and decreasing trends. For instance, at a 50:50% ratio, a positive synergistic effect is observed in the reagent consumption for demulsification, whereas at a 60:40% ratio, a negative synergistic effect is seen.
Thus, it can be concluded that in mixtures where the content of oil 1 does not exceed 40%, the reagent consumption is significantly lower compared to other cases, making the demulsification of such mixtures economically advantageous.

4. Conclusions

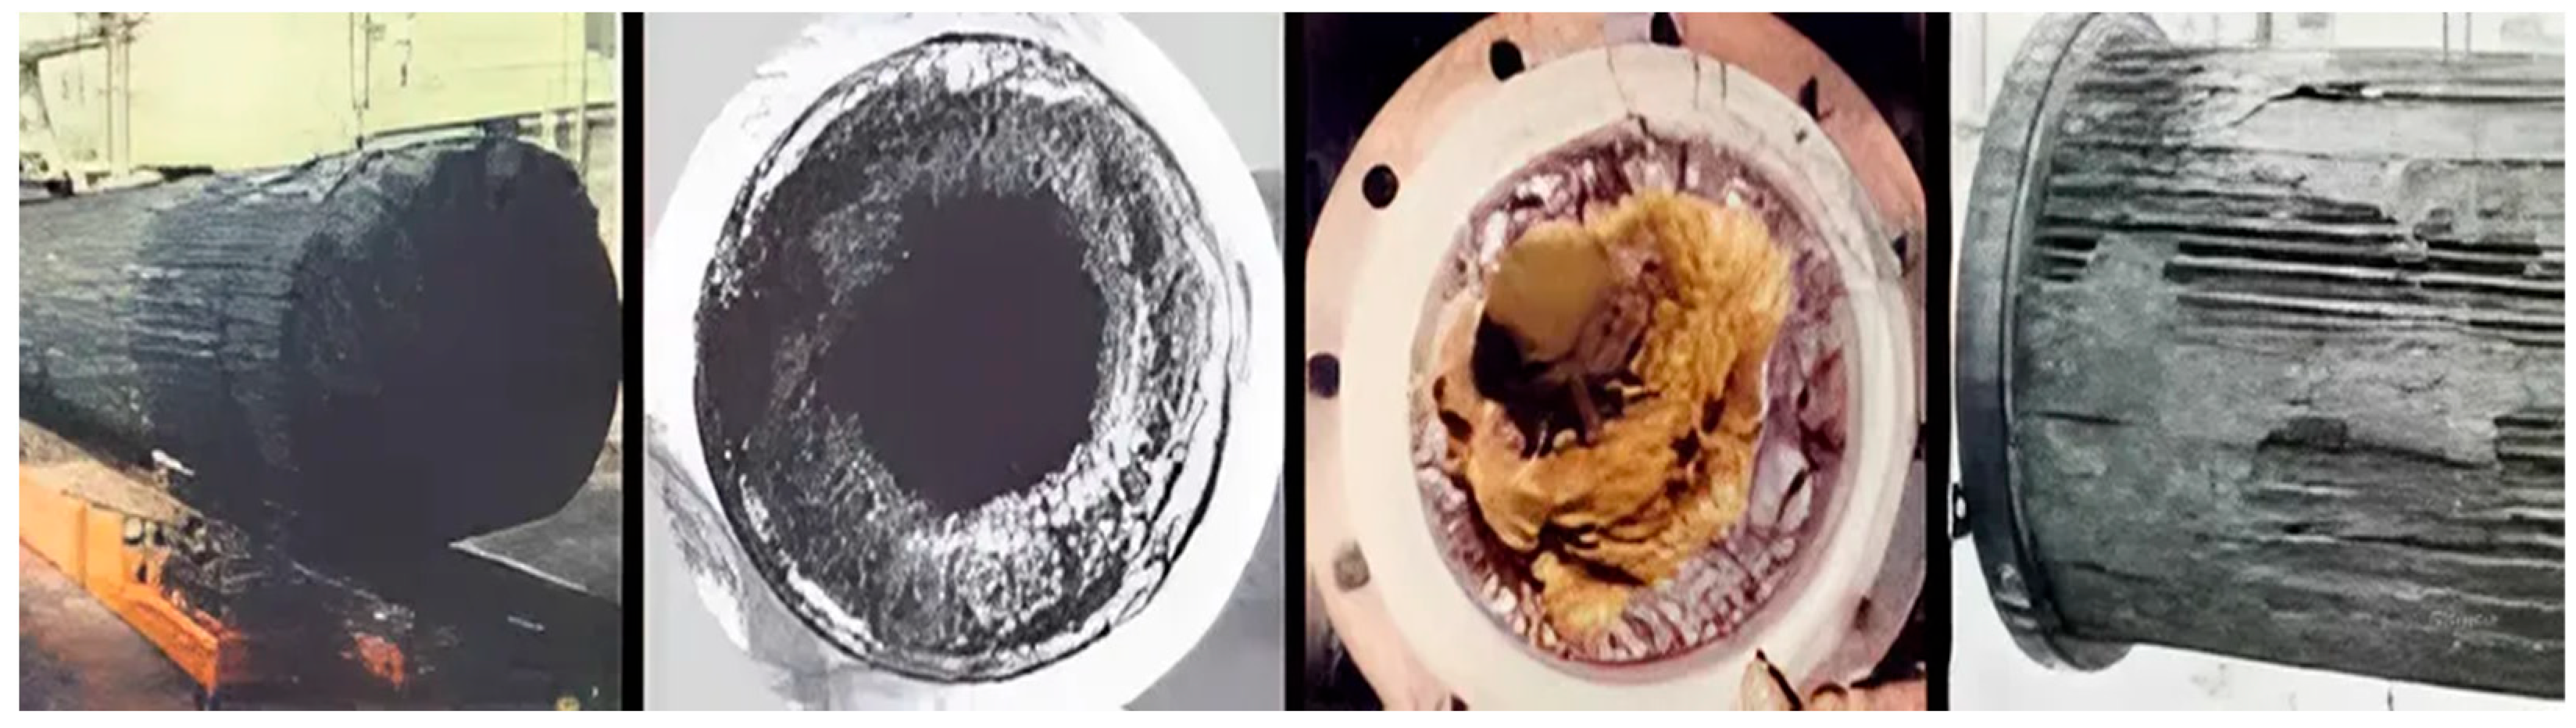
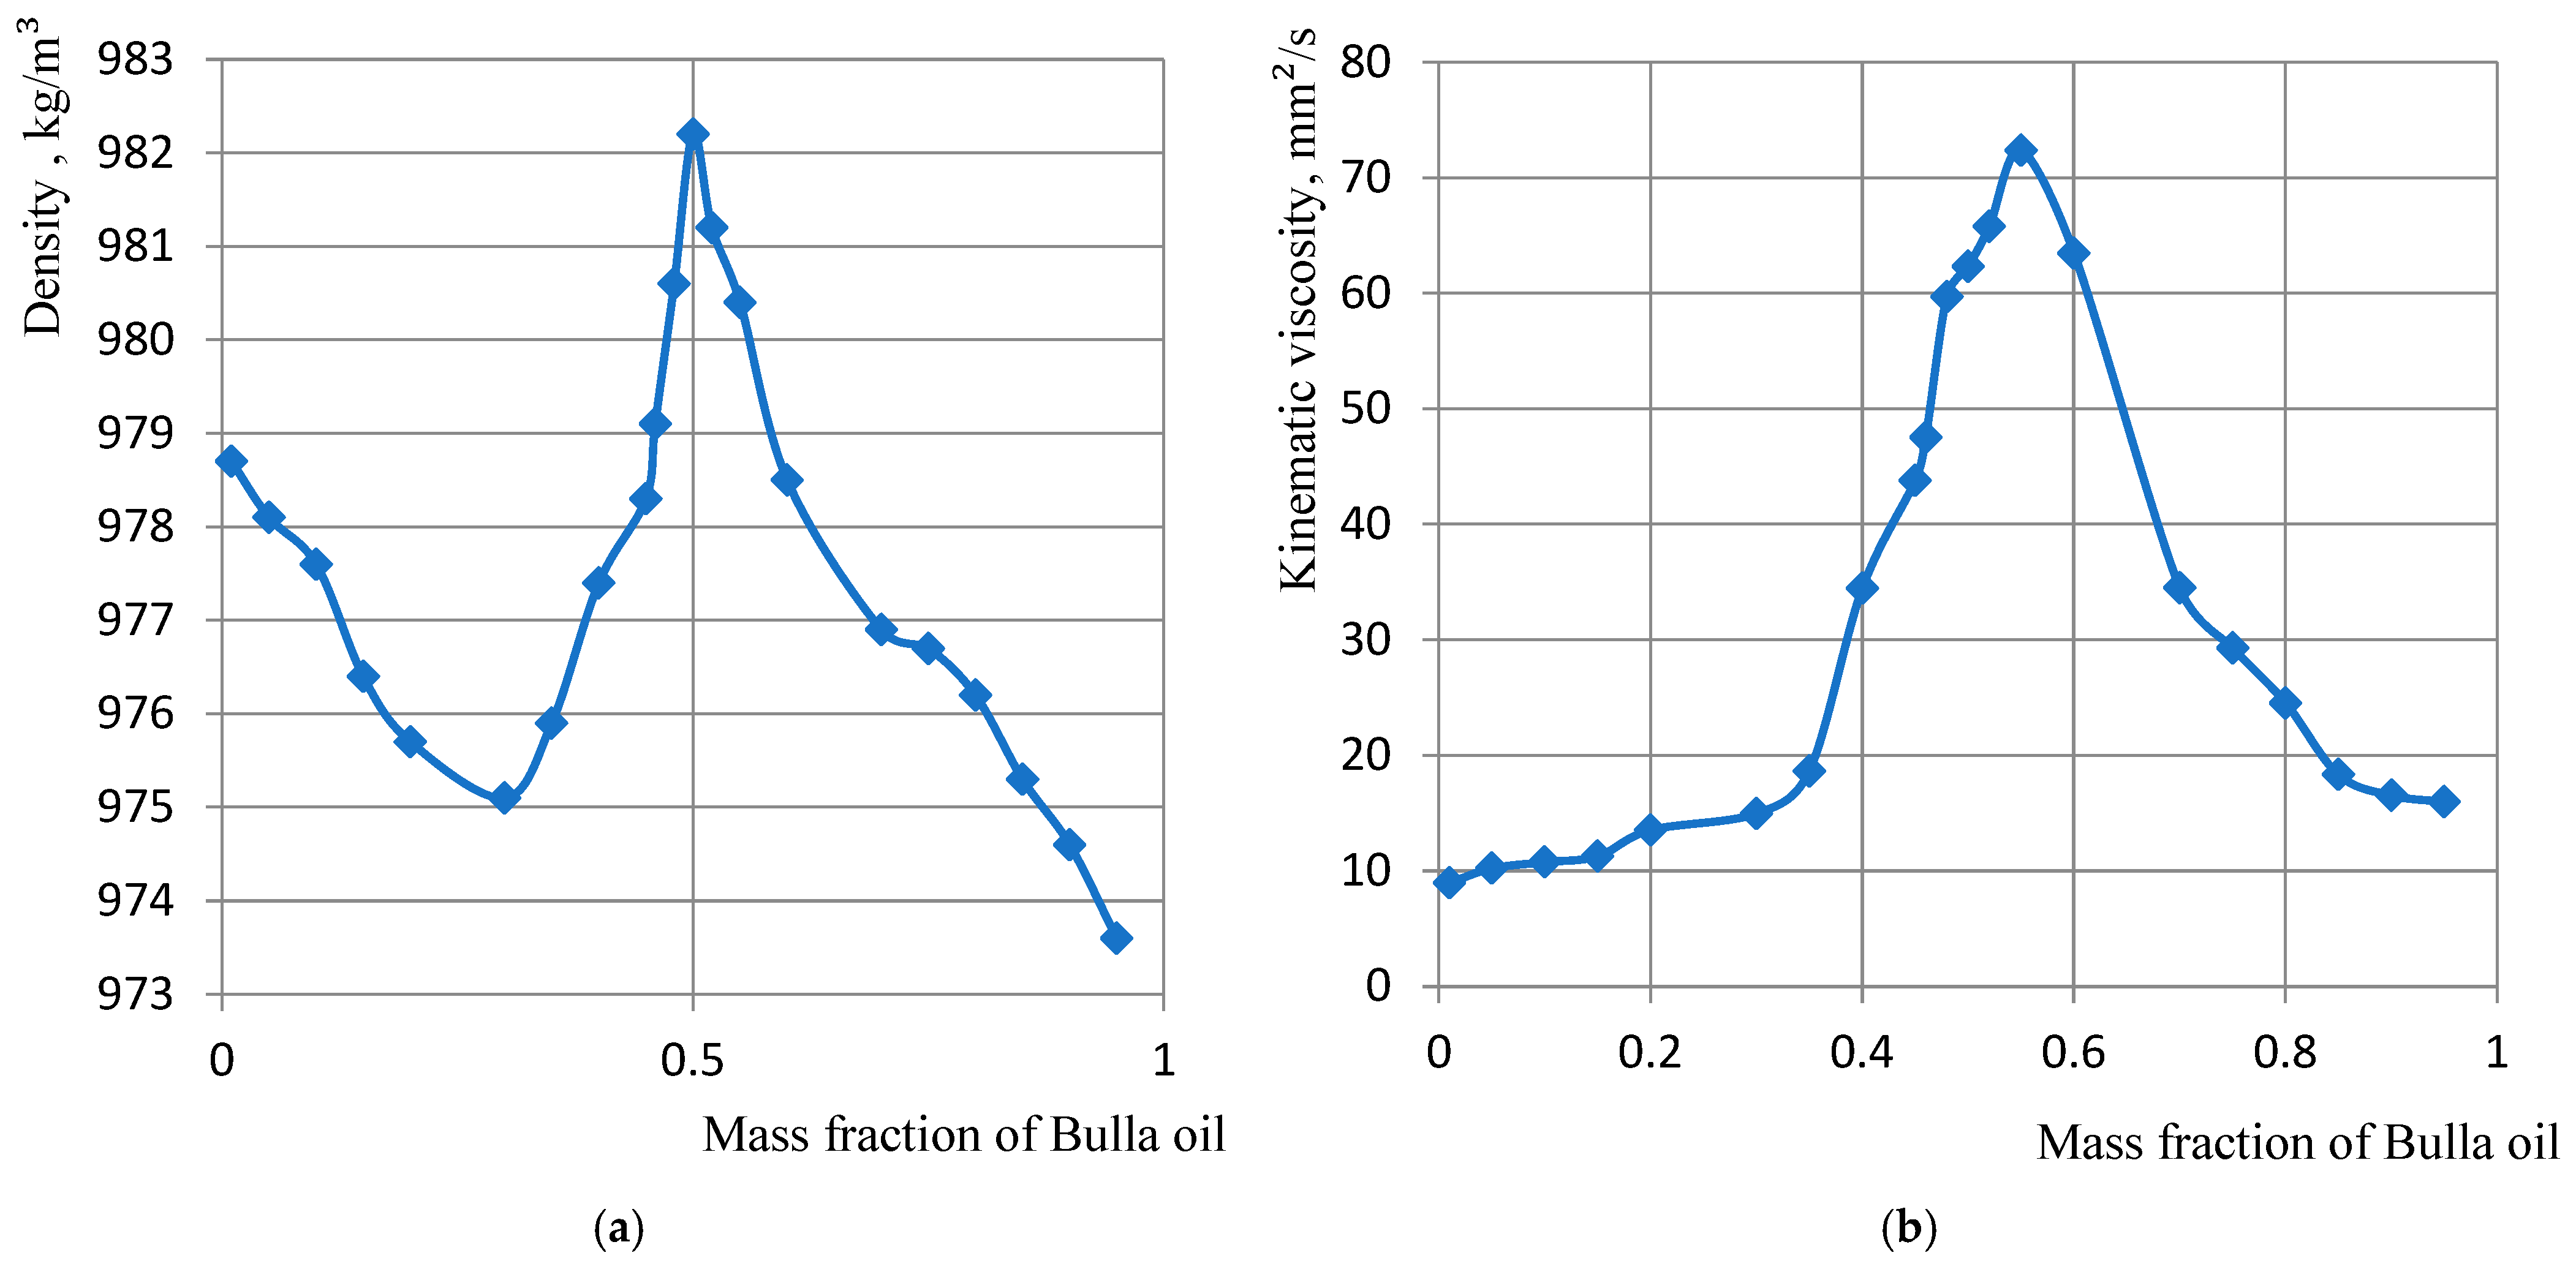
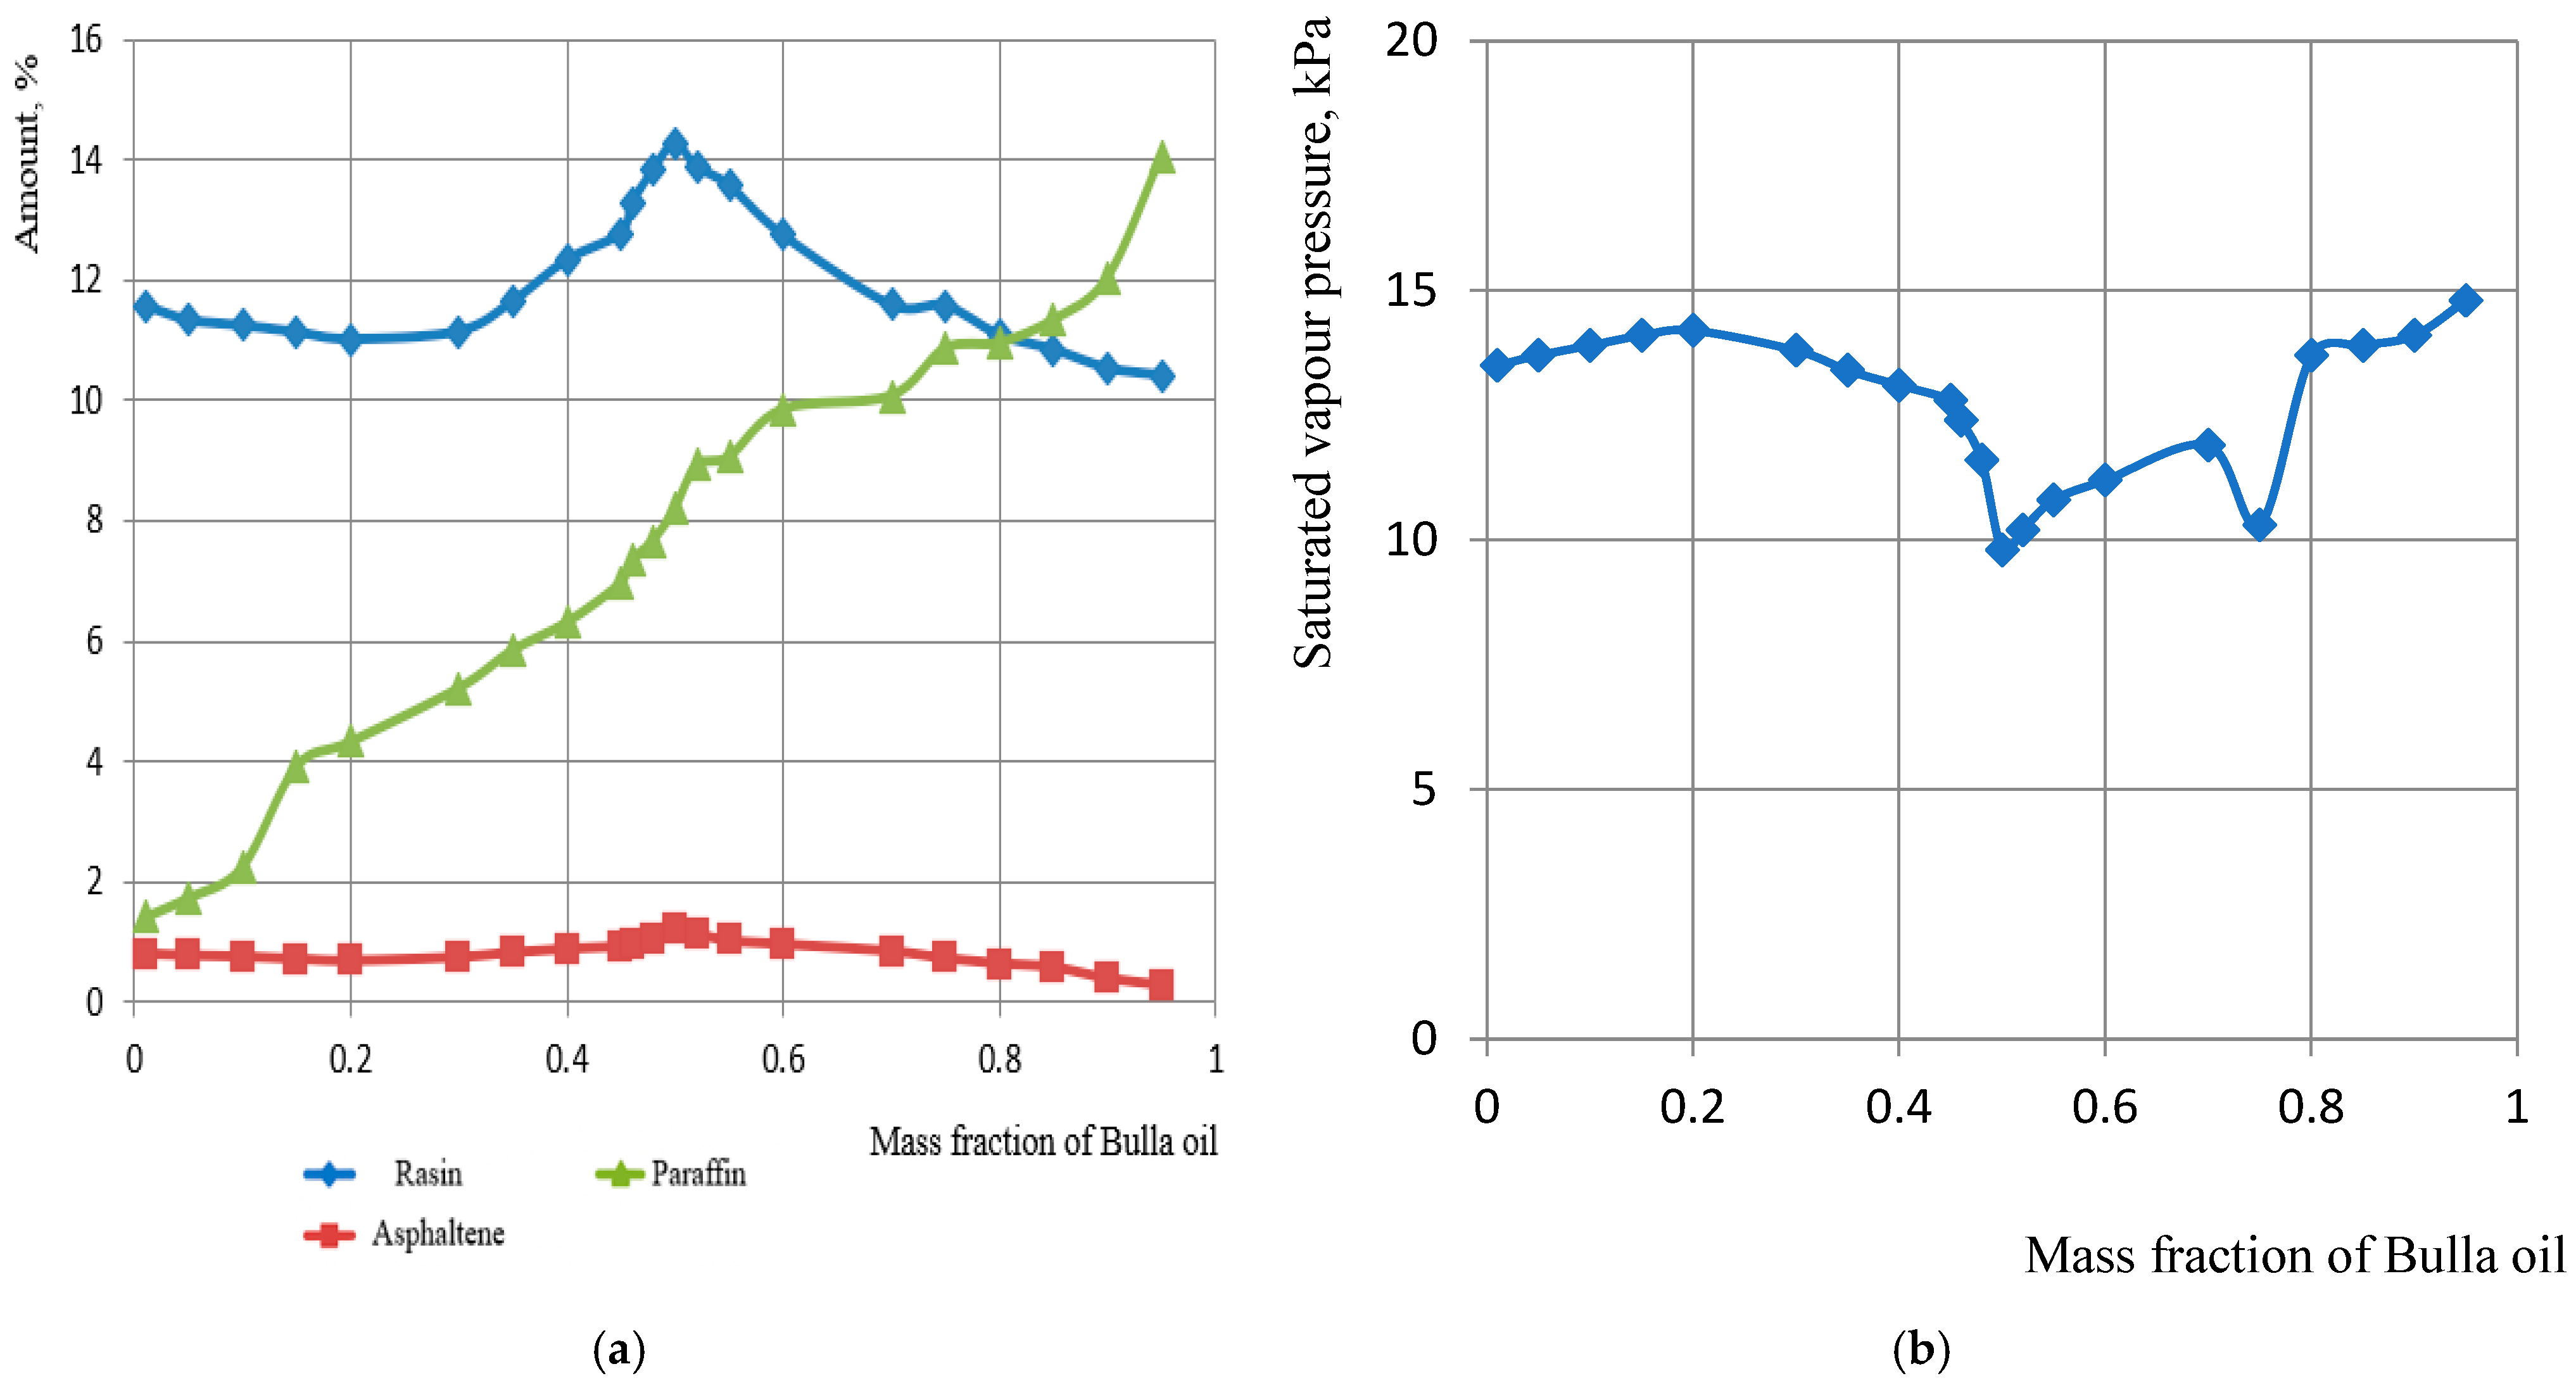
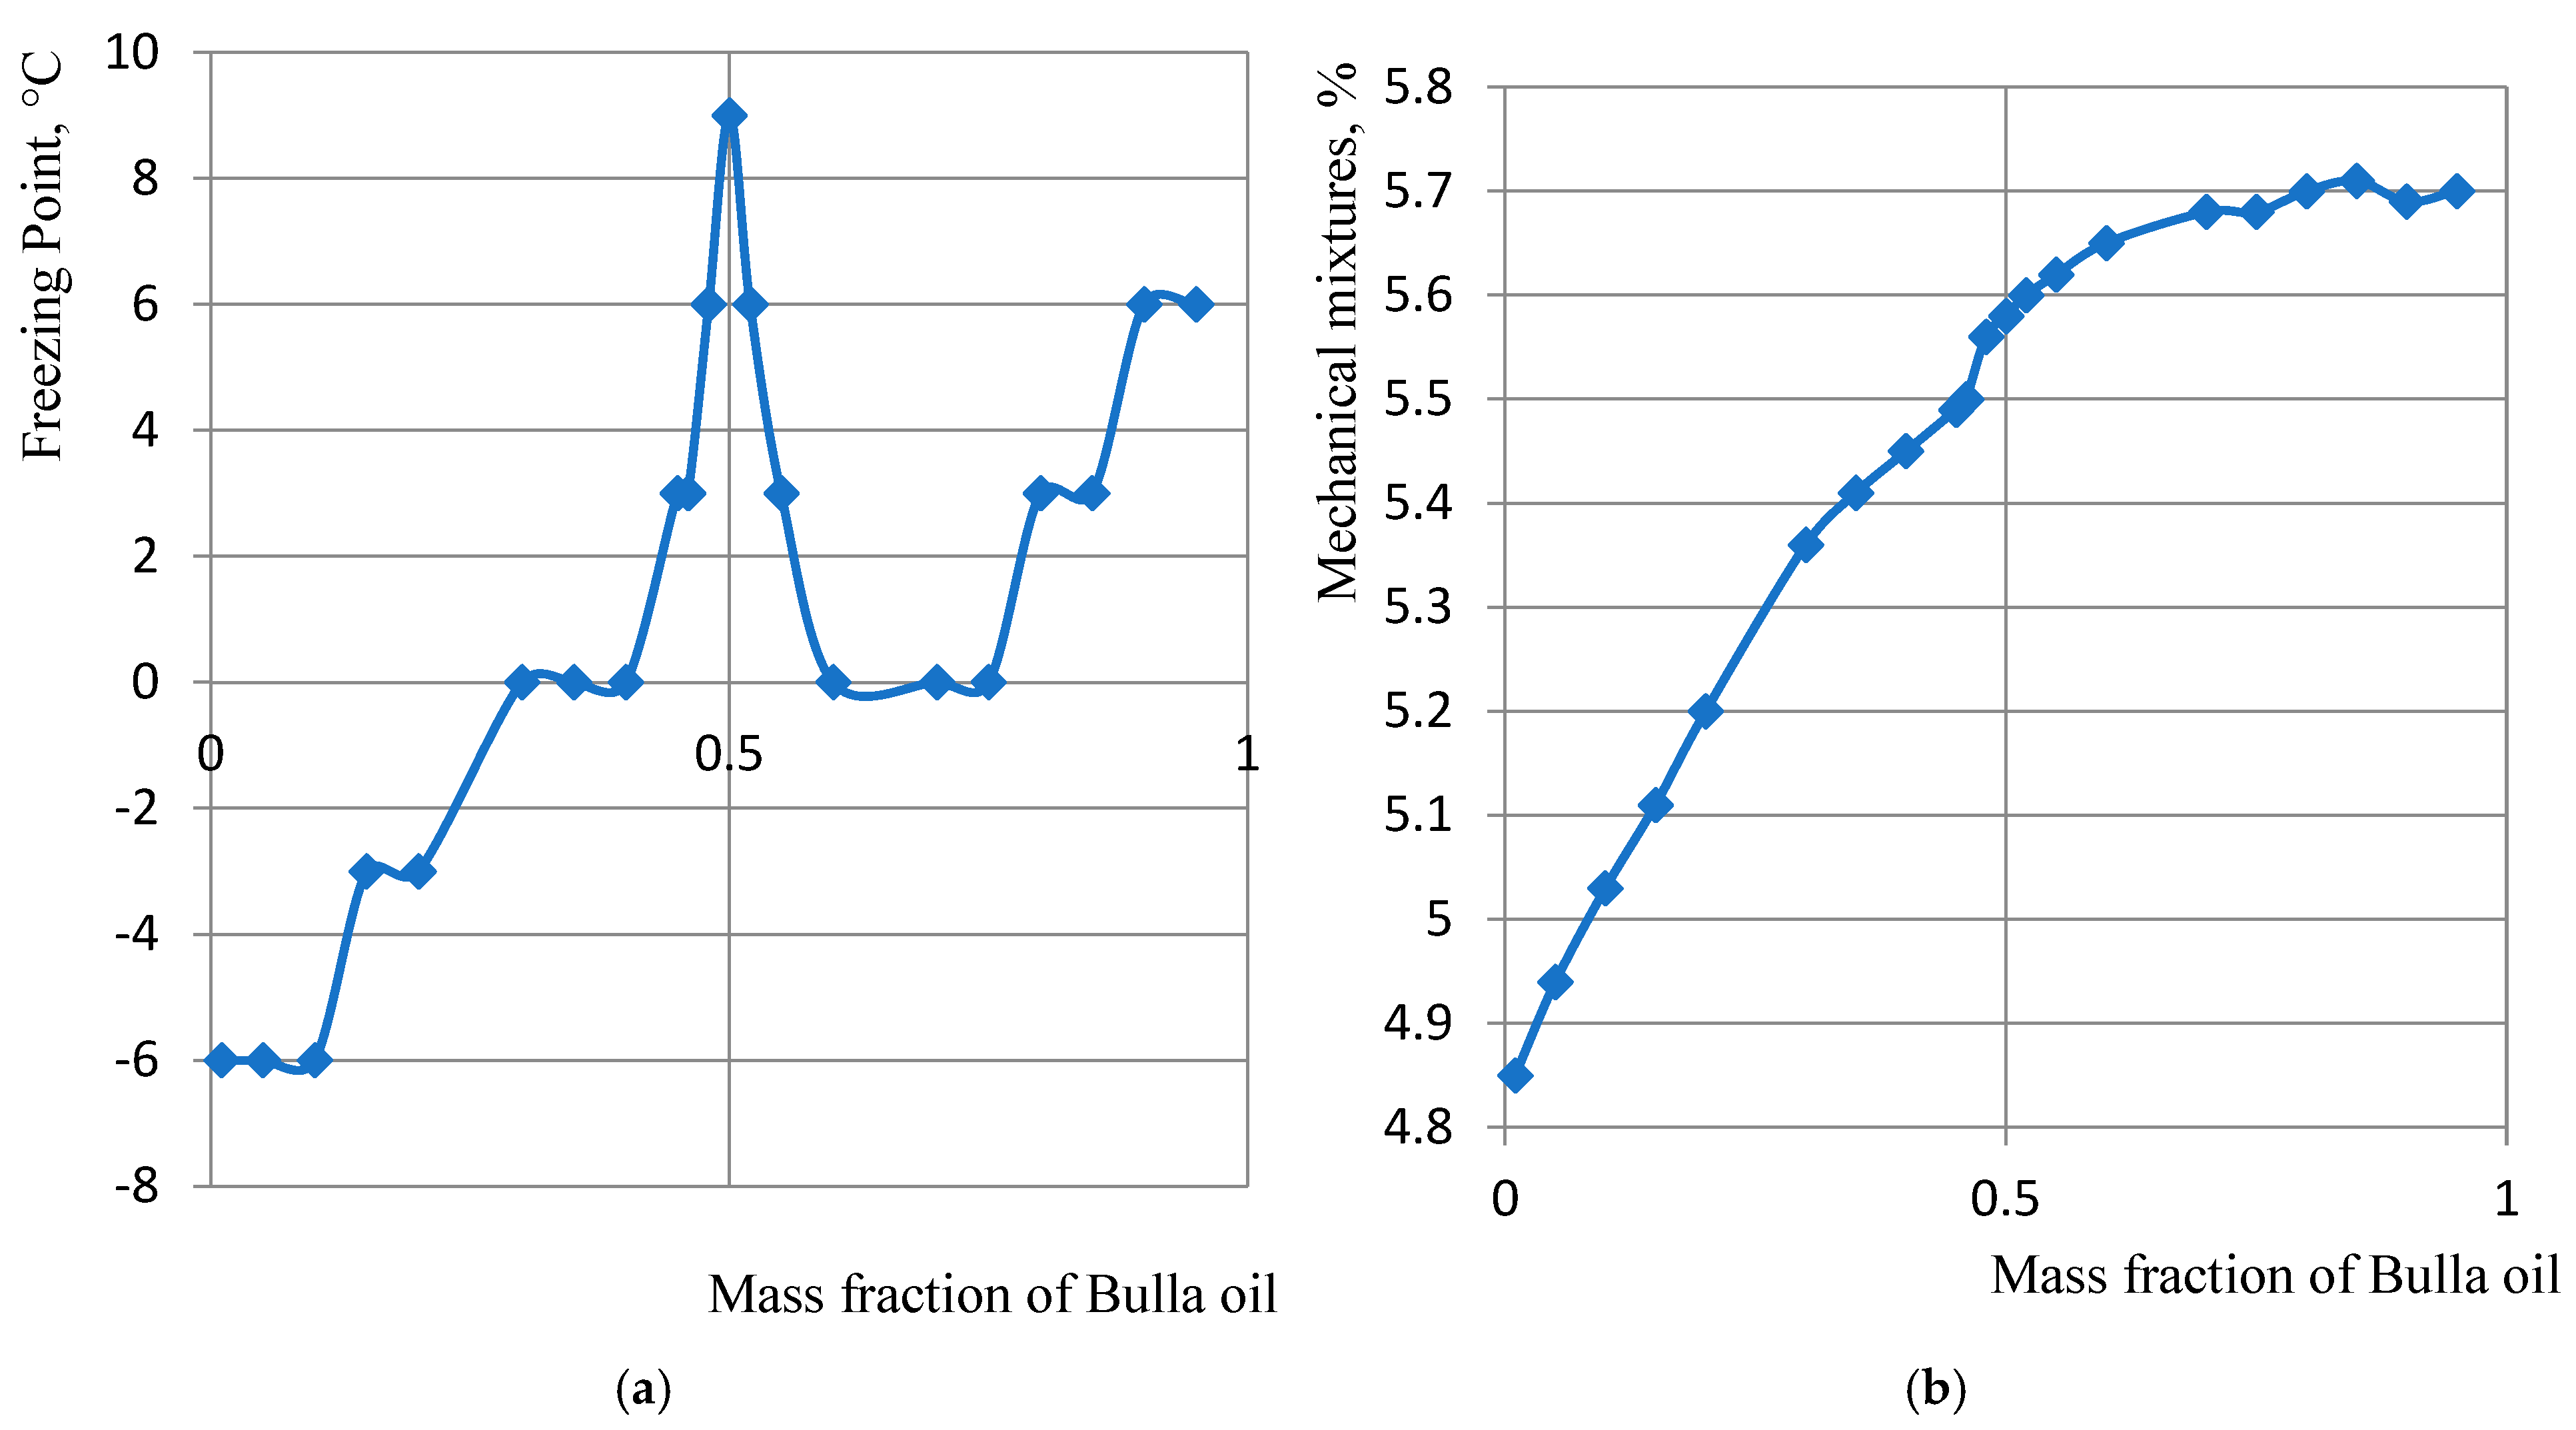
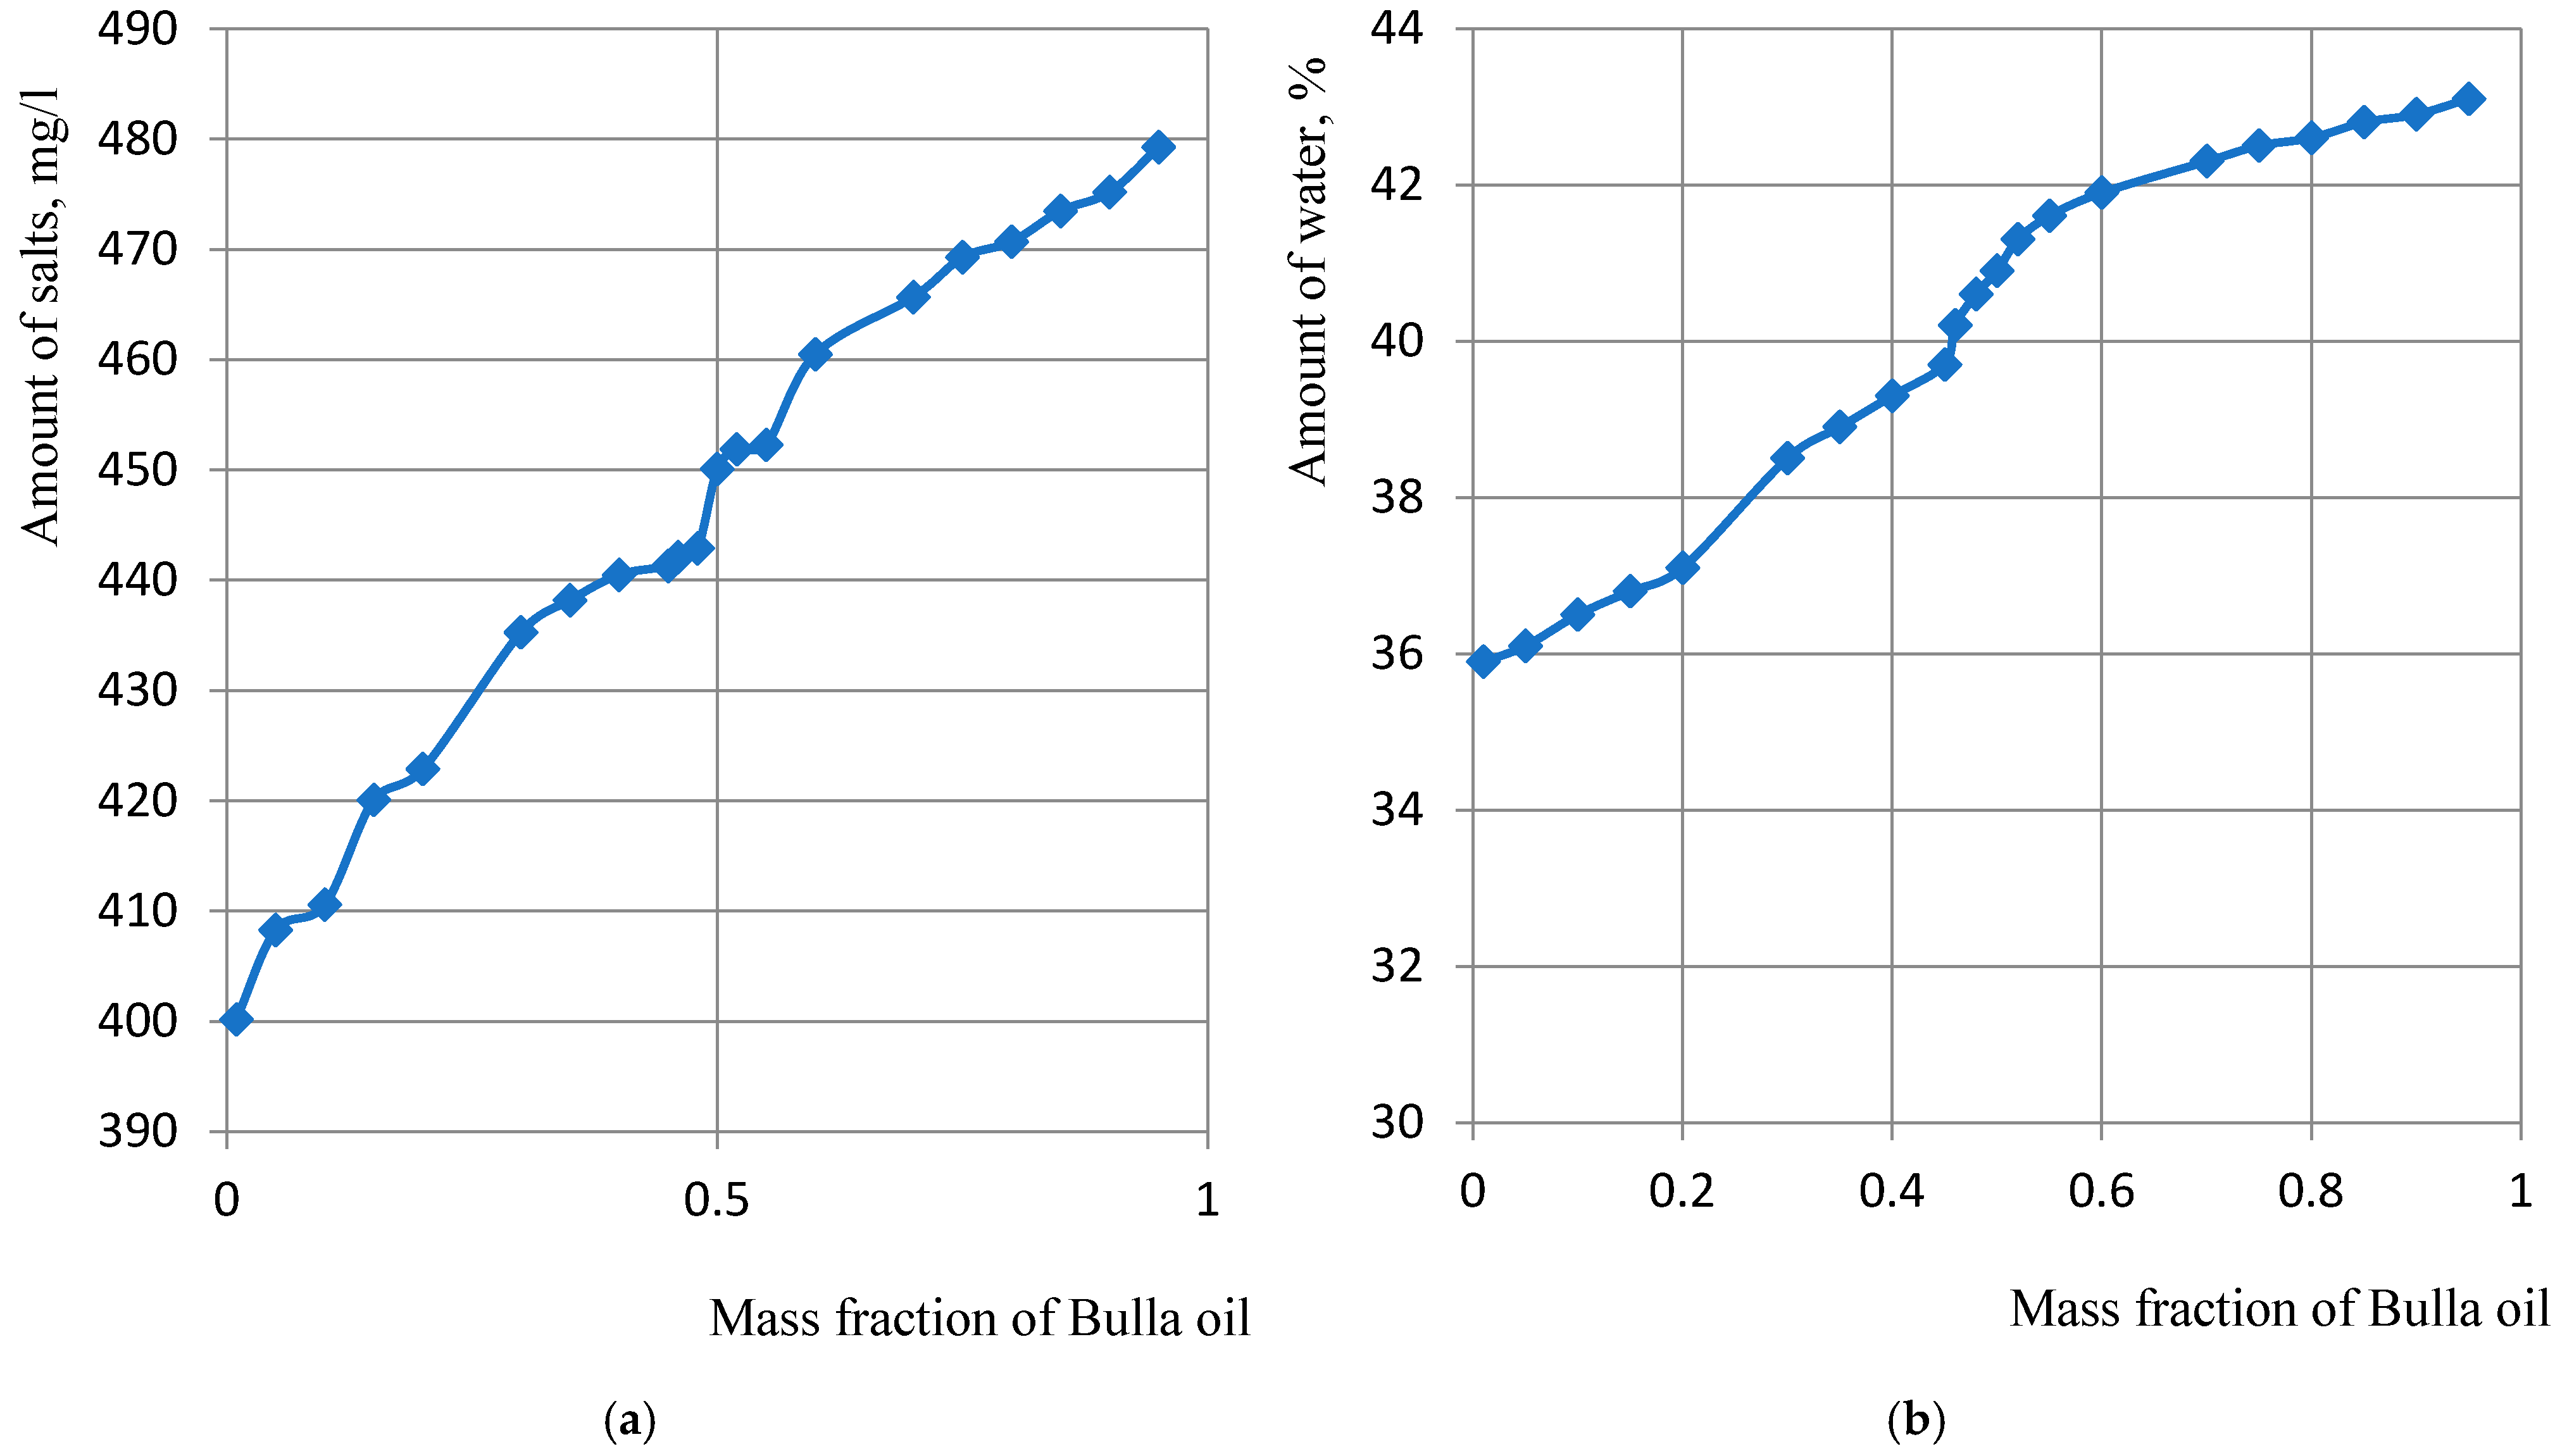
  • Based on the examples of Azerbaijan crude oil, it has been established that mixtures of oil containing high-molecular-weight compounds (resins, paraffins, asphaltenes) do not follow the rule of additivity, and exhibit anomalous changes in quality indicators.
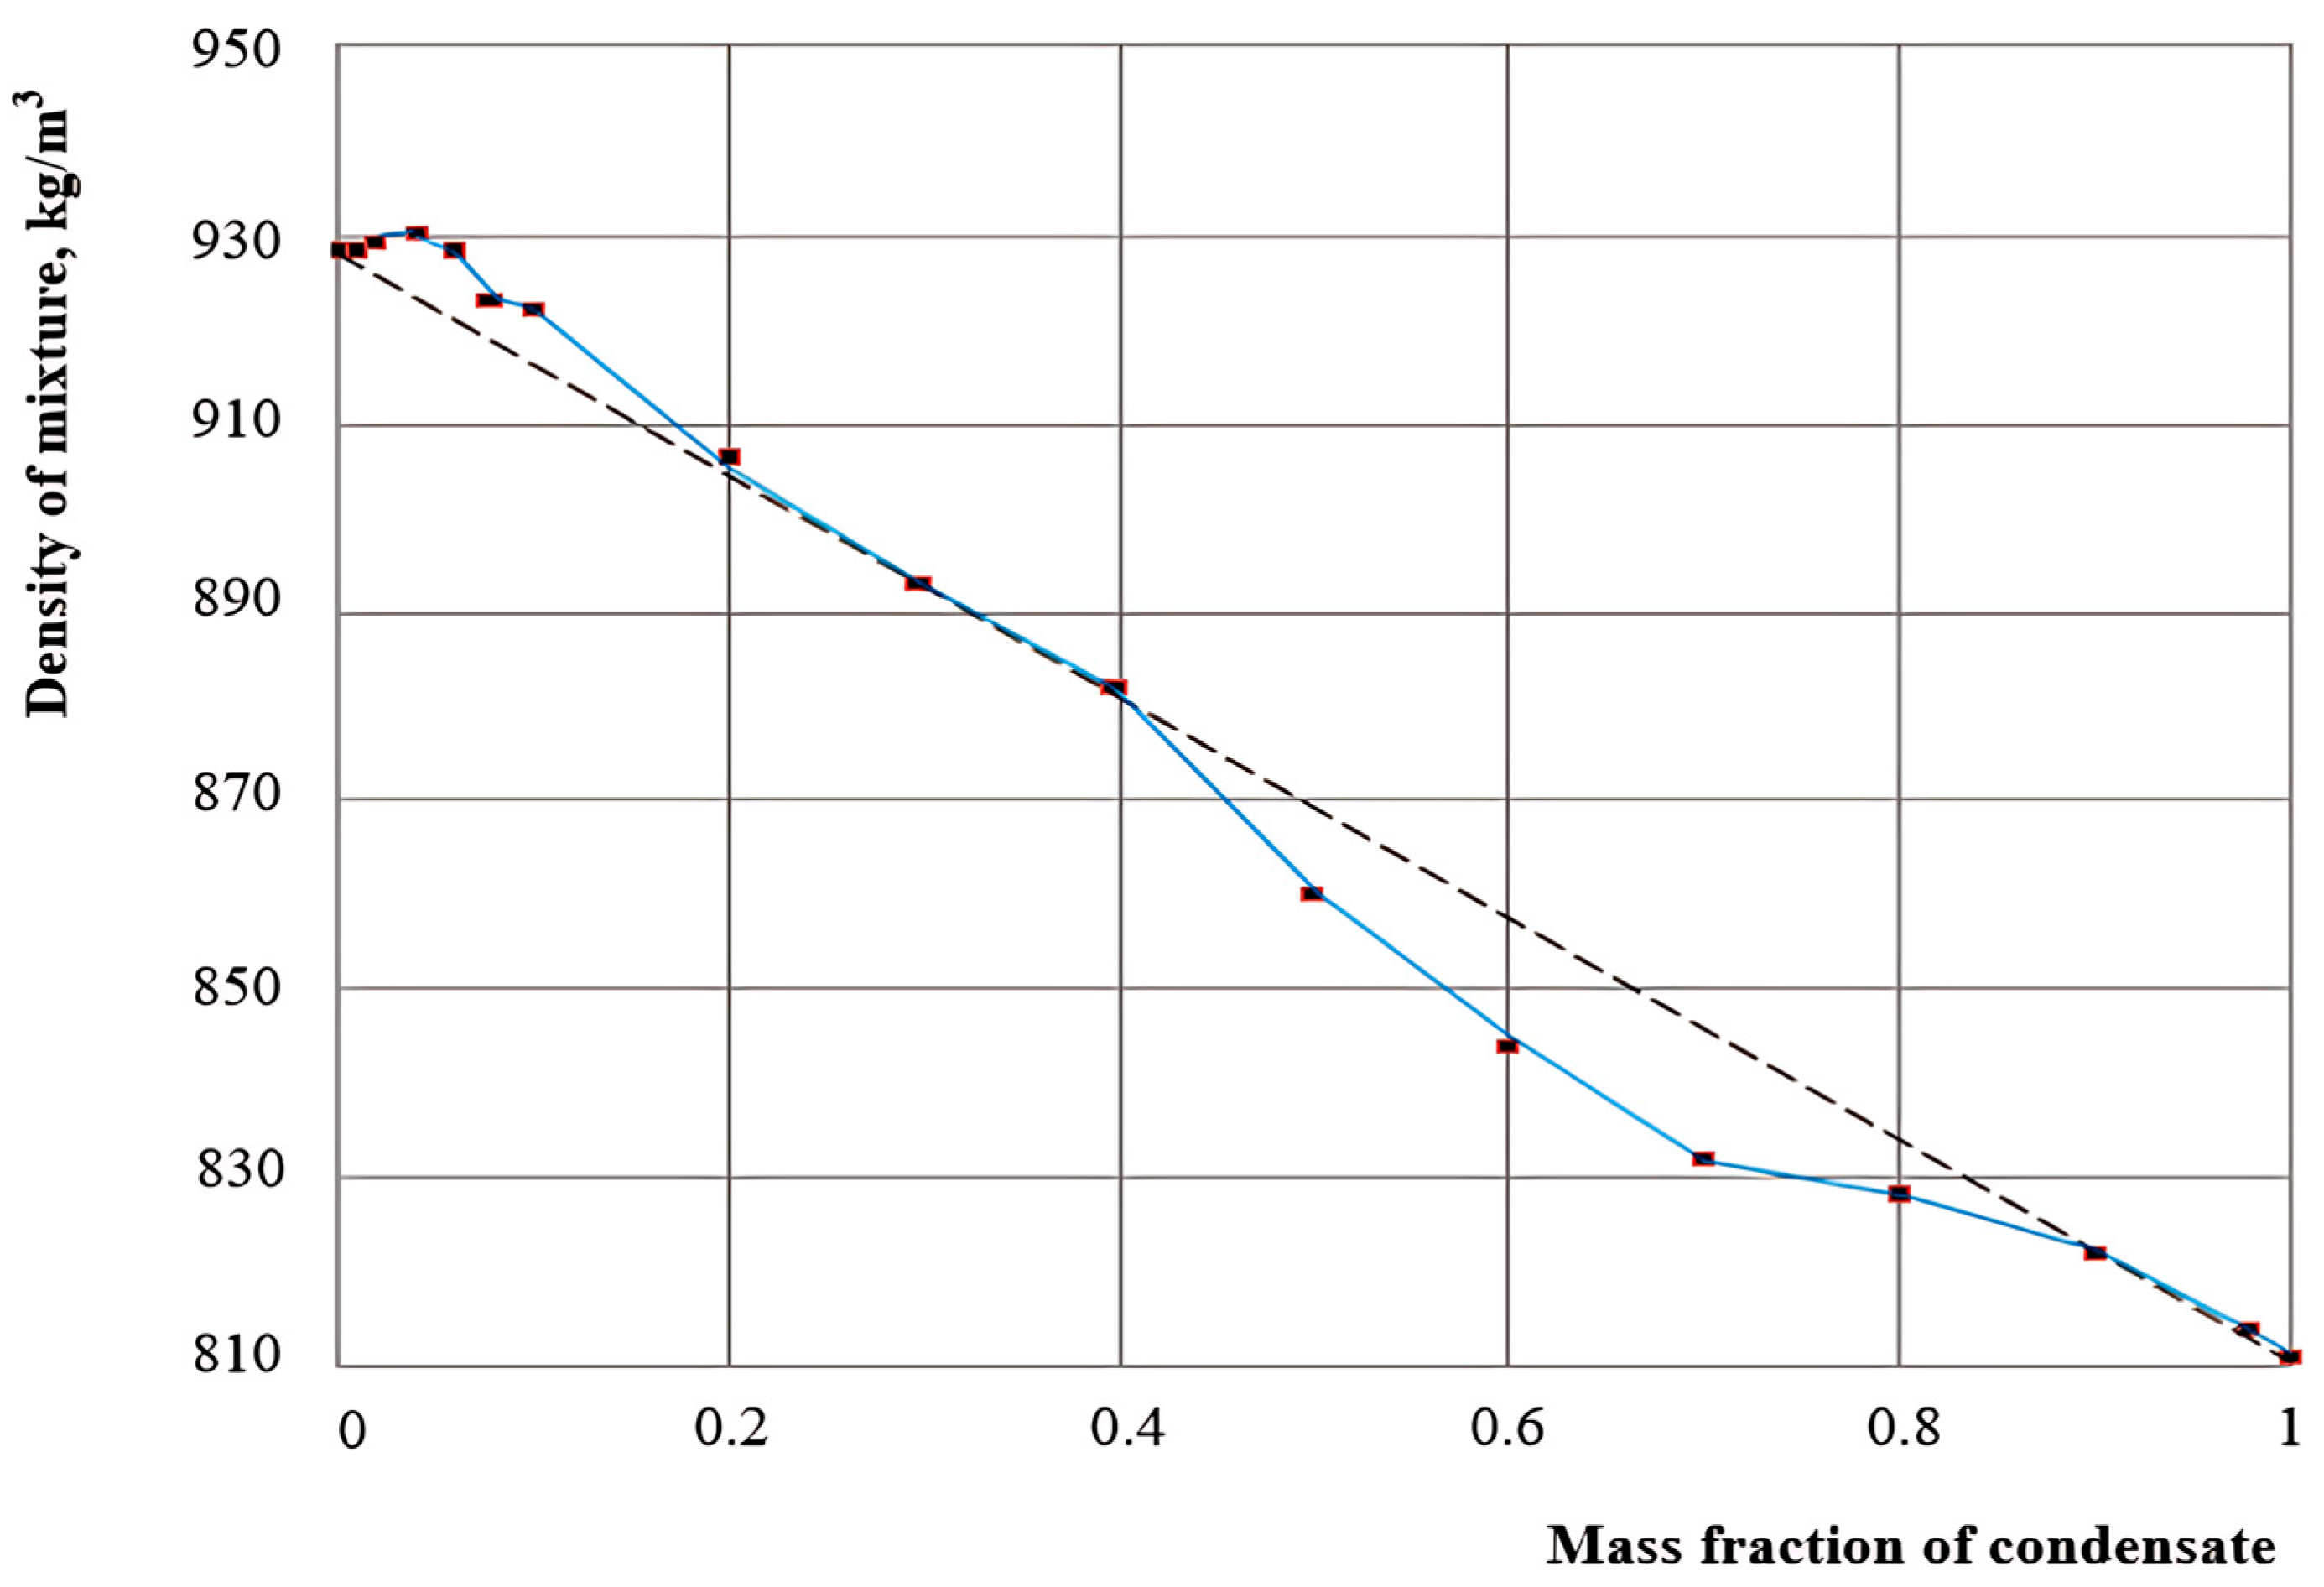
  • It was revealed that mixing rheologically complex, heavy crude oil with condensate is not advisable when the condensate content is less than 20%. Otherwise, due to an increase in the freezing point of the oil, the transportation process may become significantly more difficult or even potentially cease.
  • The importance of considering the significant impact of oil blending on quality indicators was emphasized. Furthermore, the necessity of rational blending to ensure efficient transportation was also highlighted.
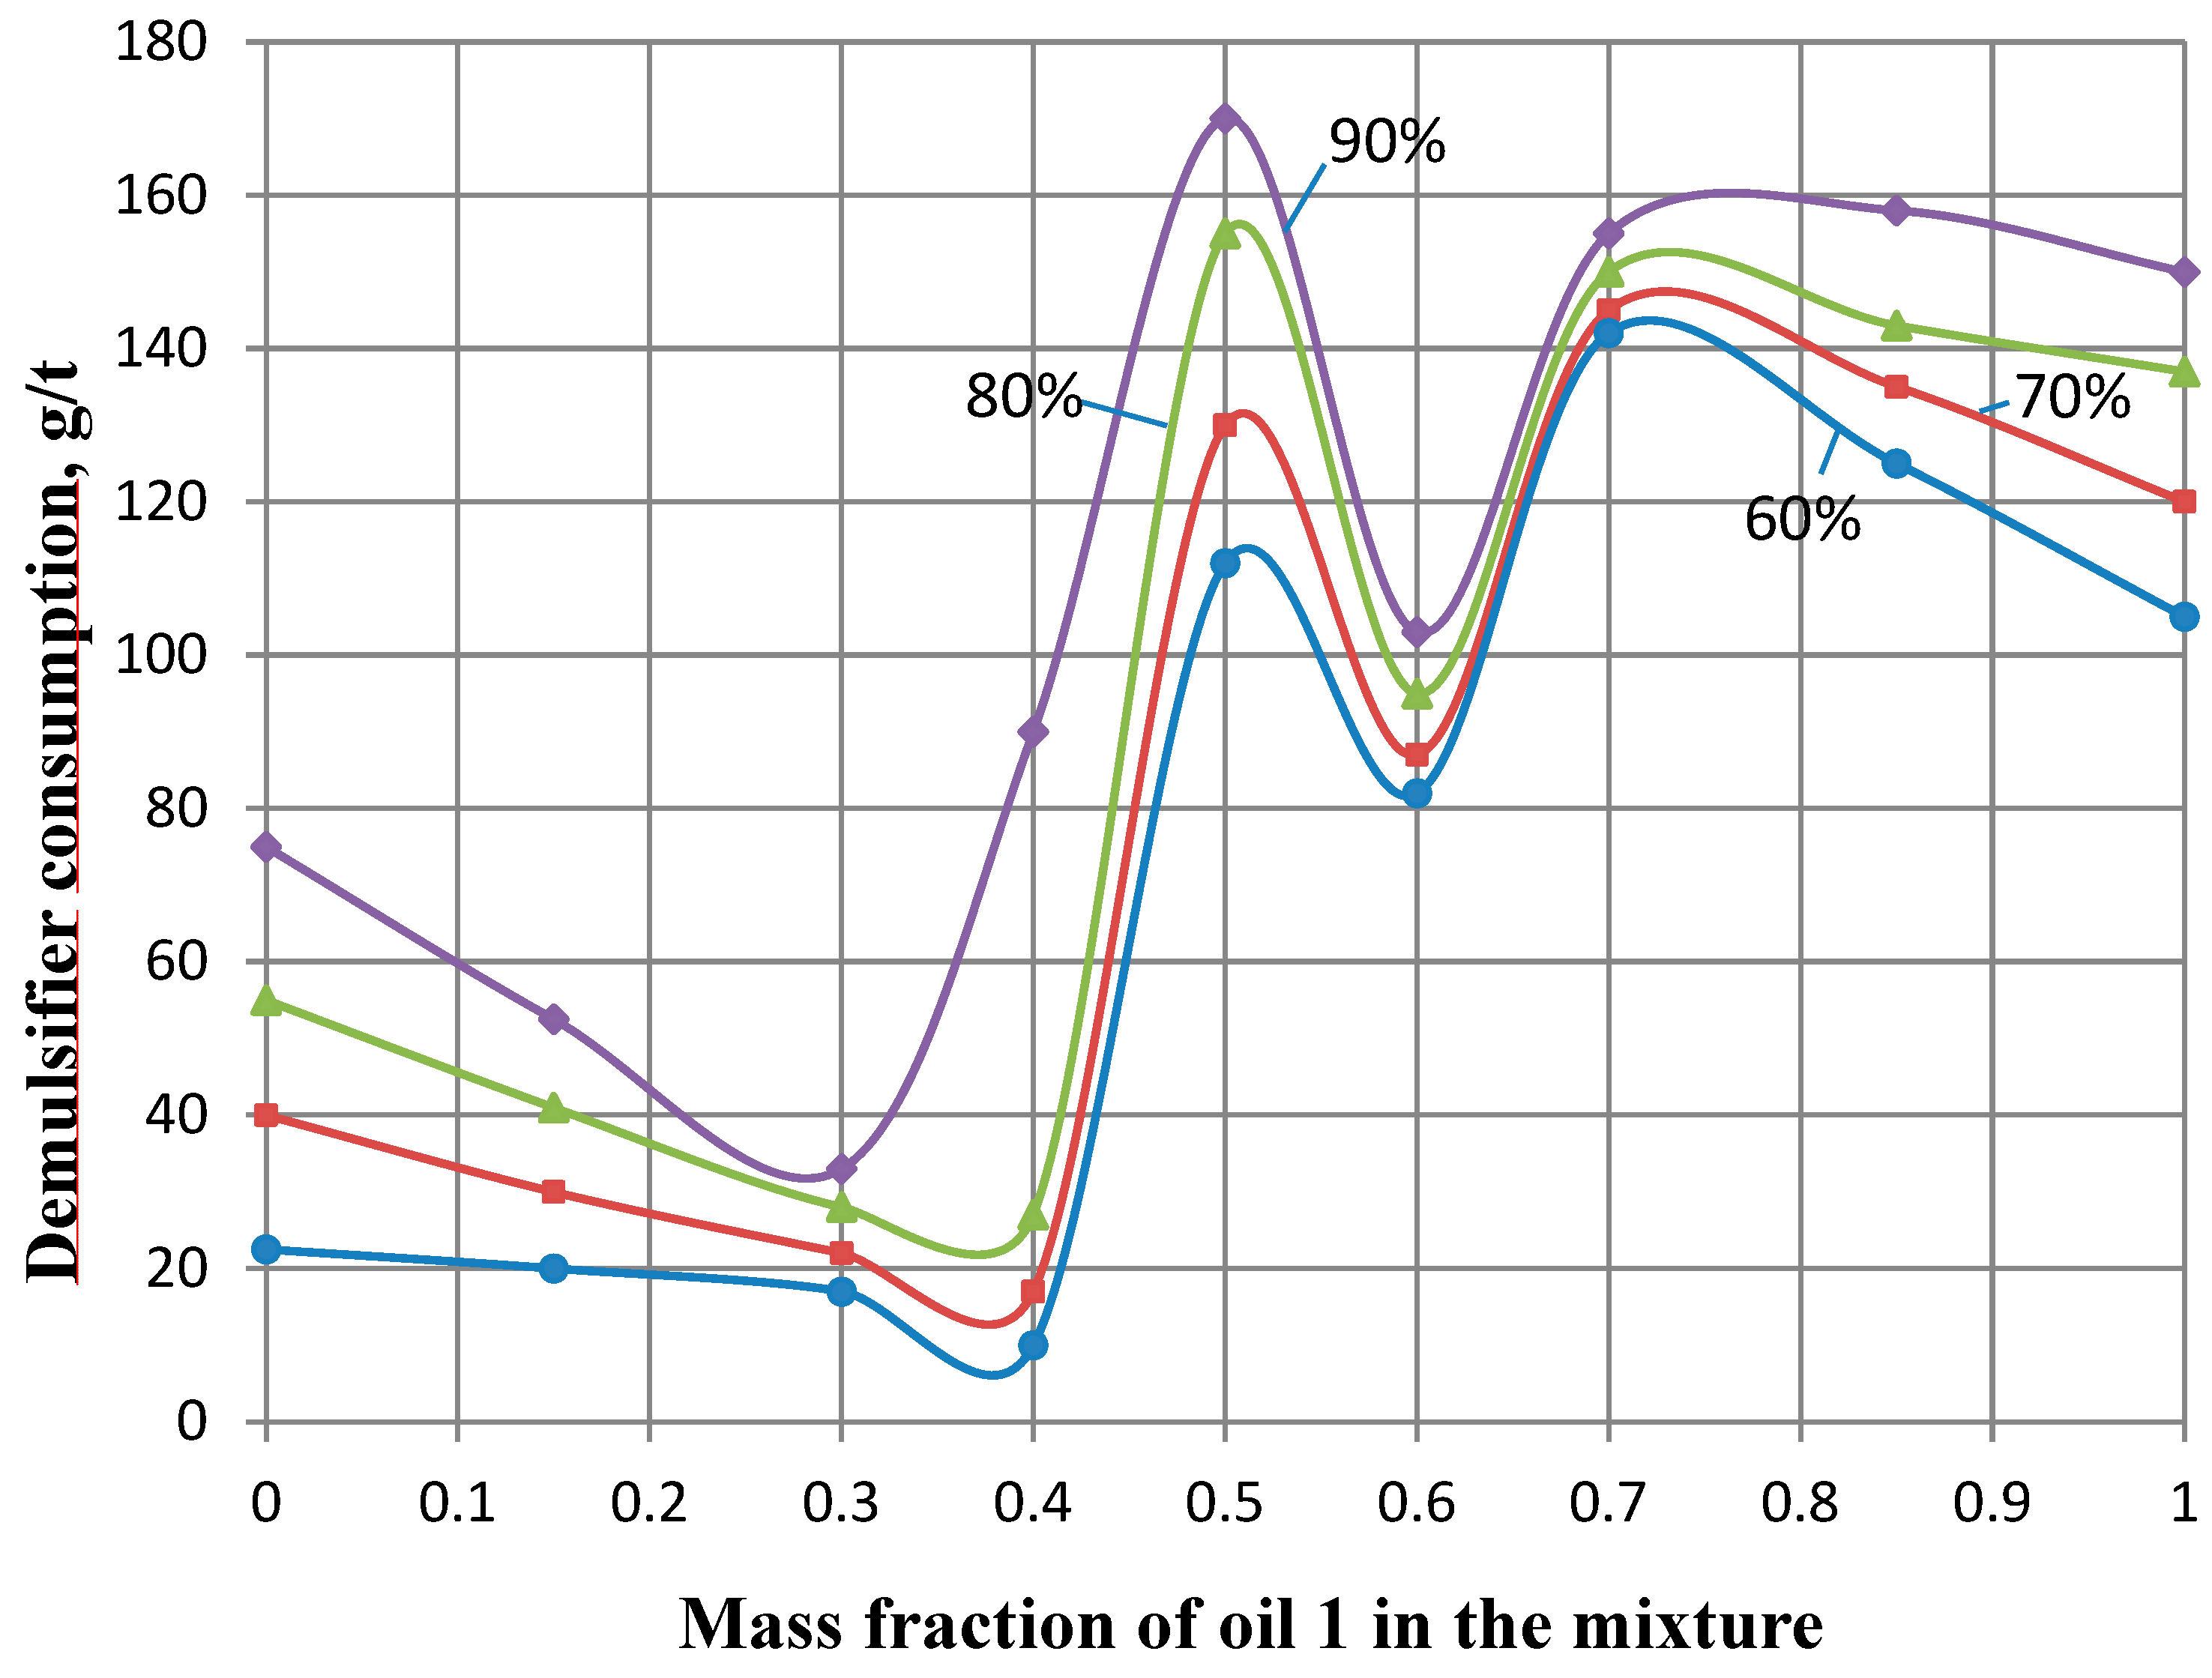
  • Depending on the type of oil and blending ratio, it was found that the demulsifier consumption during demulsification of oil emulsions varies within a wide range. The possibility of determining the optimal demulsifier consumption by considering the resulting synergistic effect was demonstrated.
  • It was determined that certain mixtures of rheologically complex crude oils in specific ratios are “incompatible”. For such mixtures, transportation was found to be significantly complicated or even unfeasible.

Author Contributions

Project administration, outline, structure, guidance, X.W.; supervision, expertise, data curation, visualization and writing—original draft preparation, X.W., G.I., E.I., E.A. and F.I.; experiment, X.W., G.I., E.I., E.A. and F.I. All authors have read and agreed to the published version of the manuscript.

Funding

This research received no external funding.

Data Availability Statement

The original contributions presented in the study are included in the article and further inquiries can be directed to the corresponding author.

Conflicts of Interest

The authors declare no conflicts of interest.

References

  1. Nurullayev, V.; Ismailov, G.; Usubaliyev, B. Increasing the Efficiency of Oil and Petroleum Products by the Application of Nano-Chemical and Cavitation Technologies; Scholars Press: Chico, CA, USA, 2018; p. 124. [Google Scholar]
  2. Bowman, R.W.; Burton, W.D.; Pyor, J.A.; Shell Oil Co. Statistically Designed Oil Dehydration Test. In Proceedings of the SPE California Regional Meeting, Bakersfield, CA, USA, 13–15 April 1977. SPE Paper 6529. [Google Scholar]
  3. Ismayilov, G.G.; Iskanderov, E.K.; Fataliyev, V.M.; Gurbanov, A.G.; Ismayilova, F.B. Some aspects for improving the efficiency of the development of offshore resources in marine conditions. SOCAR Proc. 2023, 4, 99–105. [Google Scholar] [CrossRef]
  4. Iskanderov, E.K.; Ismayilova, F.B.; Shukurlu, M.F.; Ismayilova, P.S. Changes in the energy characteristics of pipeline systems considering hydrodynamic loads. SOCAR Proc. 2024, 2, 105–108. [Google Scholar] [CrossRef]
  5. Poindexter, M.K.; Chuai, S.; Marble, R.A.; Marsh, S.C.; Ondeo Nalco Energy Services. Classifying Crude Oil Emulsions Using Chemical Demulsifiers and Statistical Analyses. In Proceedings of the SPE Annual Technical Conference and Exhibition, Denver, CO, USA, 5–8 October 2013. SPE Paper 84610. [Google Scholar]
  6. Ismayilov, G.; Ismayilova, H.; Babirov, H.; Jabrayilova, R. Assessment of environmental oil spills and economic-environmental risks. Reliab. Theory Appl. 2022, 17, 212–217. [Google Scholar]
  7. Rodriguez-Abreu, C.; Delgado-Linares, J.G.; Bullon, J. Properties of Venezuelan Asphaltenes in the Bulk and Dispersed State. J. Oleo Sci. 2006, 55, 563–571. [Google Scholar] [CrossRef]
  8. Rogel, E. Studies on asphaltene aggregation via computational chemistry. Colloids Surf. A Physicochem. Eng. Asp. 1995, 104, 85–93. [Google Scholar] [CrossRef]
  9. Saniere, A.; Hénaut, I.; Argillier, J.F. Pipeline Transportation of Heavy Oils: A Strategic, Economic and Technological Challenge. Oil Gas Sci. Technol.—Rev. IFP 2004, 59, 455–466. [Google Scholar] [CrossRef]
  10. Serfass, J.P.; Joly, A.; Samanos, J. SBS-modified asphalts for surface dressing in Polymer Modified Asphalt Binders. In Polymer Modified Asphalt Binders; ASTM STP 1108; ASTM International: West Conshohocken, PA, USA, 1992. [Google Scholar]
  11. Wang, X.; Gurbanov, H.; Adygezalova, M.; Alizade, E. Investigation of Removing Asphaltene-Resin-Paraffin Deposits by Chemical Method for Azerbaijan High-Paraffin Oil Production Process. Energies 2024, 17, 3622. [Google Scholar] [CrossRef]
  12. Evdokimov, I.N.; Eliseev, D.Y.; Eliseev, N.Y. Negative viscosity anomaly of liquid petroleum products after thermal treatment. Chem. Technol. Fuels Oils 2006, 3, 26–29. (In Russian) [Google Scholar]
  13. Evdokimov, I.N. T-C Phase Diagram of Asphaltenes in Solutions. Pet. Sci. Technol. 2007, 25, 5–17. [Google Scholar] [CrossRef]
  14. API MPMS 12.3; Manual of Petroleum Measurement Standards; Chapter 12-Calculation of Petroleum Quantities; Section 3—Volumetric Shrinkage Resulting from Blending Light Hydrocarbons with Crude Oils. American Petroleum Institute (API): Washington, DC, USA, 1996.
  15. Shanshool, J.; Talib, E. Fitted Shrinkage Formula of Spiked Crude Oils. Pet. Sci. Technol. 2002, 20, 435–439. [Google Scholar] [CrossRef]
  16. Evdokimov, I.N.; Eliseev, N.Y.; Losev, A.P.; Novikov, M.A. Promising oil and gas nanotechnologies for field development. In Proceedings of the SPE Russian Oil and Gas Technical Conference and Exhibition. World of Technologies for Unique Resources, Moscow, Russia, 3–6 October 2006. CD-ROM edition (In Russian). [Google Scholar]
  17. Wiehe, I.A. Crude Oil Compatibility. In Proceedings of the Crude Oil Quality Group Meeting, Houston, TX, USA, 2 October 2003; Available online: https://www.coqg.org/20031002SolubleSolutions.pdf (accessed on 10 September 2024).
  18. Wong, G.K.; Yen, T.F. An electron spin resonance probe method for the understanding of petroleum asphaltene macrostructure. J. Pet. Sci. Eng. 2000, 28, 55–64. [Google Scholar] [CrossRef]
  19. Wu, J.; Prausnitz, J.M.; Firoozabadi, A. Molecular-Thermodynamic Framework for Asphaltene-Oil Equilibria. AIChE J. 1998, 44, 1188–1199. [Google Scholar] [CrossRef]
  20. Li, S.; Fan, K.; Huang, Q. Evaluation of stability for flowing water-in-oil emulsion in transportation pipeline. J. Pet. Sci. Eng. 2022, 216, 110769. [Google Scholar] [CrossRef]
  21. Galimzyanov, B.N.; Doronina, M.A.; Mokshin, A.V. Unified scaling model for viscosity of crude oil over extended temperature range. Fuel J. 2025, 379, 133018. [Google Scholar] [CrossRef]
  22. Alonso, F.; Castillo, J.A.; Ancheyta, J.; Torres-Mancera, P. Evaluation of the Effect of Addition Order on the Compatibility of Binary Crude Oil Blending. Energy Fuels J. 2024, 38, 23358–23366. [Google Scholar] [CrossRef]
  23. GOST 3900-2022; Petroleum Products. Methods for Determination of Density. Federal Agency for Technical Regulation and Metrology (Rosstandart): Moscow, Russia, 2022.
  24. GOST 33-2016; Petroleum Products. Transparent and Opaque Liquids. Determination of Kinematic Viscosity and Calculation of Dynamic Viscosity. Federal Agency for Technical Regulation and Metrology (Rosstandart): Moscow, Russia, 2016.
  25. GOST 11858-2008; Petroleum Products. Method for the Determination of Asphaltic Resinous Substance Content. Federal Agency for Technical Regulation and Metrology (Rosstandart): Moscow, Russia, 2008.
  26. GOST 11851-2018; Petroleum Products. Methods for Determination of Paraffin Content. Federal Agency for Technical Regulation and Metrology (Rosstandart): Moscow, Russia, 2018.
  27. GOST 1756-2000; Determination of Saturated Vapour Pressure. Federal Agency for Technical Regulation and Metrology (Rosstandart): Moscow, Russia, 2000.
  28. GOST 20287-2023; Petroleum Products. Methods of Test for Freezing Point. Federal Agency for Technical Regulation and Metrology (Rosstandart): Moscow, Russia, 2023.
  29. GOST 6370-2018; Petroleum, Petroleum Products and Additives. Method for Determination of Mechanical Admixtures. Federal Agency for Technical Regulation and Metrology (Rosstandart): Moscow, Russia, 2018.
  30. GOST 21534-2021; Petroleum Products. Methods for Determination of Chlorine Salts. Federal Agency for Technical Regulation and Metrology (Rosstandart): Moscow, Russia, 2021.
  31. GOST 2477-2014; Petroleum and Petroleum Products. Method for Determination of Water Content. Federal Agency for Technical Regulation and Metrology (Rosstandart): Moscow, Russia, 2014.
  32. Mushrush, G.; Speight, J.G. Petroleum Products: Instability and Incompatibility; Applied Energy Technology Series; Taylor & Francis: Bristol, PA, USA, 1995; 390p. [Google Scholar]
  33. Evdokimov, I.N. Bifurcated correlations of the properties of crude oils with their asphaltenes content. Fuel 2005, 84, 13–28. [Google Scholar] [CrossRef]
  34. Ismayilov, Q.Q.; Nurmammadova, R.Q.; Zeynalov, R.L. On the trends of synergism and antagonism during the accumulation and transportation preparation of crude oil blends. Azerbaijan Oil Econ. J. 2014, 4, 31–34. [Google Scholar]
Figure 1. Photo slides illustrating the precipitation of macroscopic solid phases and the formation of blockages in pipelines during the transportation of oil mixtures.
Processes 13 01500 g001
Figure 2. Variation in density (a) and kinematic viscosity (b) for the mixture of Siyazan oil (SN) with Bulla oil (BN) depending on the mass fraction of Bulla oil (BN).
Processes 13 01500 g002
Figure 3. The variation in resin, asphaltene, and paraffin amount (a) and saturated vapor pressure (b) in the mixture of Siyazan oil (SN) with Bulla oil (BN) depending on the mass fraction of Bulla oil.
Processes 13 01500 g003
Figure 4. The variation in freezing point (a) and the amount of mechanical mixtures (b) in the mixture of Siyazan oil (SN) with Bulla oil (BN), depending on the mass fraction of Bulla oil.
Processes 13 01500 g004
Figure 5. The variation in amount of salts (a) and the amount of water (b) in the mixture of Siyazan oil (SN) with Bulla oil (BN), depending on the mass fraction of Bulla oil.
Processes 13 01500 g005
Figure 6. Density dependence on the mass fraction of condensate for a mixture of oil 1 and condensate (t = 5 °C).
Processes 13 01500 g006
Figure 7. Dependence of freezing temperature on mass fraction of condensate for oil–condensate mixtures. 1. Oil 2 + condensate mixture; 2. Oil 1 + condensate mixture; 3. Oil 1 (50%) + oil 2 (50%) + condensate mixture; 4. Additive mixtures.
Processes 13 01500 g007
Figure 8. Variation in the required consumption of demulsifier depending on the mass fraction of oil 1 at different dehydration degrees of the “oil 1–oil 2” mixture.
Processes 13 01500 g008
Table 1. Rheophysical and physico-chemical properties of Bulla (BN) and Siyazan (SN) crude oil samples.
IndicatorsBNSNAnalysis Methods
Density (at 20 °C), kg/m3973.4978.9GOST 3900-2022 [23]
Kinematic Viscosity, mm2/s15.768.23GOST 33-2016 [24]
Resin, %10.2711.12Chromatograph
Asphaltene, %0.230.81GOST 11858-2008 [25]
Paraffin, %13.341.18GOST 11851-2018 [26]
Saturated Vapor Pressure, kPa16.213.9GOST 1756-2000 [27]
Freezing Point, °C+9−6GOST 20287-2023 [28]
Mechanical Mixtures, % by mass5.724.83GOST 6370-2018 [29]
Salts (by mass), mg/L 481.3400.0GOST 21534-2021 [30]
Water Content, % by mass35.143.7GOST 2477-2014 [31]
Table 2. Results of rheophysical and physico-chemical analyses of SN and BN crude oil mixtures depending on the mass fraction of BN (t = 20 °C).
IndicatorsMass Fraction of BN, βBN
0.010.050.100.150.200.300.350.400.450.460.48
Density, kg/m3978.7978.1977.6976.4975.7975.1975.9977.4978.3979.1980.6
Viscosity, mm2/s8.9710.2310.7611.2713.5414.9718.6534.4643.8147.5359.71
Resin, % by mass11.5811.3411.2511.1411.0211.1511.6512.3412.7813.2713.84
Asphaltene, % by mass0.810.780.760.720.690.750.830.890.930.951.06
Paraffin, % by mass1.431.752.263.934.345.235.866.326.987.357.68
Saturated Vapor Pressure, kPa13.513.713.914.114.213.813.413.112.812.411.6
Freezing Point, °C−6−6−6−3−3000+3+3+6
Mechanical Mixtures, % by mass4.854.945.035.115.205.365.415.455.495.505.56
Amount of Salts (by mass), mg/L400.2408.3410.6420.1422.9435.3438.2440.5441.3442.1442.9
Water Content, % by mass35.936.136.536.837.138.538.939.339.740.240.6
IndicatorsMass Fraction of BN, βBN
0.50.520.550.600.700.750.800.850.900.95
Density, kg/m3982.2981.2980.4978.5976.9976.7976.2975.3974.6973.6
Viscosity, mm2/s62.3265.7872.3763.4834.529.3124.5318.3416.5415.98
Resin, % by mass14.2813.8913.5812.7511.5911.5811.0910.8510.5410.42
Asphaltene, % by mass1.231.151.030.970.850.730.640.580.390.28
Paraffin, % by mass8.218.939.079.8610.0810.8710.9611.3412.0414.06
Saturated Vapor Pressure, kPa9.810.210.811.211.910.313.713.914.114.8
Freezing Point, °C+9+6+3000+3+3+6+6
Mechanical Mixtures, % by mass5.585.605.625.655.685.695.705.715.695.70
Amount of Salts (by mass), mg/L450.1451.9452.3460.5465.7469.3470.7473.5475.2479.3
Water Content, % by mass40.941.341.641.942.342.542.642.842.943.1
Table 3. The determined quality indicators for condensate, oil samples, and their various mixtures.
IndicatorsCondensate SampleOil SamplesMixture of 1st and 2nd Oil Emulsions
Oil 1Oil 250%:50%
Density, at 20 °C, kg/m3810.0930.6976.5952.7
Kinematic viscosity, at 20 °C, mm2/s7.60No flowNo flowNo flow
Amount of water, %Traces347554
Chlorine salts, mg/dm37.311300.071214.411304.94
Mechanical mixtures, %0.3350.2000.1680.219
Freezing Point, °C−1.6+28+24+28
Paraffin, %0.065.56.46.0
Resin, %2.292.23.12.7
Asphaltene, %0.127.111.09.0
Table 4. The changes in quality indicators of various blends of the first oil emulsion sample (oil 1) with 75% water content and condensate, depending on the mass fraction of condensate (at t = 20 °C).
IndicatorsMass Fraction of Condensate, βcon
00.020.040.060.080.10.20.40.60.80.91
Density, at 20 °C, kg/m3930930931929923921907882844829822810
Freezing point, °C192021232217.51612.510754
Mechanical mixtures, %0.3680.3670.3660.3650.3640.3630.3610.3550.3480.3420.3340.335
Chlorine salts, mg/dm31133.671097.11053.221038.591031.271015.16886.476667.24378.84195.737.887.31
Kinematic viscosity, at 20 °C, mm2/sNo flowNo flow347.16325.17207.41151.71122.540.418.910.37.67.6
Disclaimer/Publisher’s Note: The statements, opinions and data contained in all publications are solely those of the individual author(s) and contributor(s) and not of MDPI and/or the editor(s). MDPI and/or the editor(s) disclaim responsibility for any injury to people or property resulting from any ideas, methods, instructions or products referred to in the content.

