Article

Combined Removal of NOx and SO2 in Circulating Fluidized Beds with Post-Combustion

1
School of Engineering Science, University of Science & Technology of China, Hefei 230026, China
2
Institute of Engineering Thermophysics, Chinese Academy of Sciences, Beijing 100190, China
3
University of Chinese Academy of Sciences, Beijing 100049, China
*
Author to whom correspondence should be addressed.
Processes 2025, 13(5), 1496; https://doi.org/10.3390/pr13051496
Submission received: 15 April 2025 / Revised: 8 May 2025 / Accepted: 12 May 2025 / Published: 13 May 2025
(This article belongs to the Special Issue Development and Utilization of Biomass, Coal and Organic Solid Wastes)

Abstract

:
The post-combustion technology of circulating fluidized beds (CFBs) can largely reduce the emission of nitrogen oxides (NOx) in the process of combustion, significantly reducing the removal cost of NOx. To explore the potential of the combined removal of NOx and SO2 emissions under post-combustion technology, experiments were conducted on a 0.1 MWth circulating fluidized bed test platform. This paper focuses on the effect of temperature in CFB with limestone addition on NOx and SO2 emissions under post-combustion technology combined with sorbent injection into the furnace. The low-cost combined removal of NOx and SO2 can be realized by denitrification in the furnace and through secondary desulfurization in the furnace and post-combustion chamber. In the optimized experimental condition, with combustion temperatures at 845 °C and sorbent addition in the furnace under post-combustion, the emission of NOx can be reduced to 47.10 mg/Nm3(@6%O2), and meanwhile, the emission of SO2 can be reduced to 92.09 mg/Nm3. Sulfur removal efficiency is higher under lower temperatures in a weakly reducing atmosphere. The reaction of sulfur fixation occurred in the post-combustion chamber and caused the particle size of fly ashes at the tail flue to become bigger and the sulfur content in the fly ash at the tail flue to increase. At 845–905 °C, the combustion temperature had a bigger effect on the SO2 emission than the NOx with sorbent addition in the furnace under post-combustion.

1. Introduction

In China, the NOx and SO2 emissions totaled 554.3 thousand tons and 338.6 thousand tons in 2022 [1], of which the emissions from coal combustion accounted for 70–80%. Consequently, reducing the NOx and SO2 emissions from coal combustion for environmental protection is still a major demand. Circulating fluidized bed boilers are an essential way to deal with coal because of low pollution emissions, fuel flexibility, and so on [2,3,4]. Under the ultra-low NOx emission standard [5], CFB boilers apply low NOx combustion technology [6,7] and use selective non-catalytic reduction technology (SNCR) [8,9,10]. Likewise, CFB boilers apply the furnace sorbent injection [11] and flue gas desulfurization technology [12,13,14] under ultra-low SO2 emission standards. Current methods for the CFB boiler can achieve the combined removal of NOx and SO2 emissions [15,16,17], but the methods result in very high costs and secondary pollution due to the application of flue gas removal technology.
To reduce the removal cost of NOx emissions and secondary pollution, the post-combustion technology of CFBs [18] was developed by the Institute of Engineering Thermophysics of the Chinese Academy of Sciences. For post-combustion technology, coal is mainly combusted in a CFB combustor under a weakly reducing atmosphere and then burnt out in a post-combustion chamber under oxidizing conditions with the air staging method. Zhou et al. [19] found that NOx emissions can meet the ultra-low NOx emission standard when the air stoichiometric ratio is 0.96 under post-combustion technology. Song et al. [20,21] found that NOx emissions for many fuels can reach ultra-low standards under post-combustion. In addition, the NOx emission of coal slime could be reduced to 38 mg/Nm3 when post-combustion technology was used with a 75 t/h CFB boiler, and ultra-low NOx emissions could be reached [22]. Post-combustion technology has succeeded in meeting the ultra-low NOx standard in the process of combustion, reducing the cost of NOx removal dramatically. However, the question of how to reduce the removal cost of SO2 emissions and achieve the combined removal of NOx and SO2 emissions under post-combustion technology needs further study.
The sorbent injection in the furnace is very economical. Post-combustion technology combined with the sorbent injection in the furnace has the potential to achieve the combined removal of NOx and SO2 emissions at low costs for CFB boilers. Combustion temperature and air supply [23,24] are the most important parameters influencing desulfurizing efficiency. Under post-combustion technology combined with the sorbent injection in the furnace, this paper studies the effect of temperature in CFB with limestone addition on NOx and SO2 emissions on a 0.1 MWth CFB test platform.

2. Methods

2.1. Fuel Characteristics

The fuel used was Shenmu coal, which was obtained from Shaanxi Province. The proximate and ultimate analyses of the coal are shown in Table 1. For Shenmu coal, the volatile matter is very high, and the sulfur content is relatively low. Figure 1 shows the particle size distribution of Shenmu coal. It can be seen from Figure 1 that the diameter of particles of Shenmu coal with the biggest content is 500 μm, and the 90%, 50%, and 10% cut mean diameters (d90, d50, and d10) are 603.07 μm, 293.04 μm, and 29.44 μm, respectively.
The bed material used was quartz sand. The sorbent for SO2 removal was hydrated lime. Table 2 shows its composition analysis. The CaO content in hydrated lime was 74.10%. Its particle size was 75 μm. Hydrated lime at a Ca/S ratio of 2.5 was mixed with coal in the experiment.

2.2. Test Platform

Figure 2 shows a 0.1 MWth CFB test platform made of stainless steel. It mainly includes a CFB combustor and a post-combustion chamber. The height of the CFB furnace is 5500 mm, and its internal diameter is 150 mm. The total length of the post-combustion chamber is 3500 mm, including a horizontal section with a length of 1000 mm and a vertical section with a length of 2500 mm. The inner diameter of the post-combustion chamber is 80 mm. Coal is fed from the bottom of the furnace. Air is introduced into the experiment system supplied via an air compressor and mainly includes primary air and post-combustion air. The primary air passes through the air preheater and is injected into the furnace. Also, post-combustion air is preheated and divided into three partial flows before entering into the post-combustion chamber. The arrangement of post-combustion air is conducive to the burning of combustible materials and reduces NOx emissions.

2.3. Measurements

Combustion temperature is the most important parameter influencing NOx and SO2 emissions. There are five thermocouples in the furnace, monitoring the temperature at different points. The measurement accuracy of temperature is ±0.5%. The Fodisch MCA14m analyzer can measure the flue gas in Sample 2 in Figure 2, and its measurement error is less than 1%. The analyzer can continuously monitor O2, CO, SO2, NO, and NO2 in cold and dry gases. In addition, nitrogen-containing gaseous products such as NH3, HCN, and sulfur-containing gaseous products such as H2S, COS, CS2, and SO2 at the cyclone outlet (Sample 1 in Figure 2) are analyzed with the KOMYO vapor detector tube.
Fly ash at Sample 1 and Sample 2 was collected by a vacuum pump, and the sampling time was 20 min in each experiment. The samples of fly ash were taken to the professional testing unit for analysis according to conventional standards. The ash composition of fly ash was analyzed using X-ray fluorescence (XRF) analysis. Sulfur functionalities present in fly ash were identified and quantified by the X-ray photoelectron spectroscopy (XPS) analysis.

2.4. Experimental Conditions

The conditions of the experiments are shown in Table 3. Temperature is the main reference in the experiments, and the ambient temperature change should not exceed 3 degrees; these are considered stable working conditions. λCFB is the air stoichiometric ratio in the CFB furnace; λPCC is the air stoichiometric ratio in the post-combustion chamber; and λ is the total excess air coefficient; the formula is as follows:
λ C F B = A P r + A R e + A C a A S t o i c
λ P C C = A P o A S t o i c
λ = λ C F B + λ P C C
λ = 21 21 o 2
where AStoic is the gas flow rate with stoichiometric complete burnout, m3/h. APr is the airflow rate of the primary air; ARe, ACa, and APo are the airflow rates of returning air, carrying coal air, and post-combustion air, m3/h, respectively. O2 is the actual value measured by the Fodisch MCA14m portable flue gas analyzer.

3. Results and Discussion

3.1. NOx and SO2 Emissions with Sorbent Addition: Conventional vs. Post-Combustion

3.1.1. Temperature Profile in the CFB Furnace

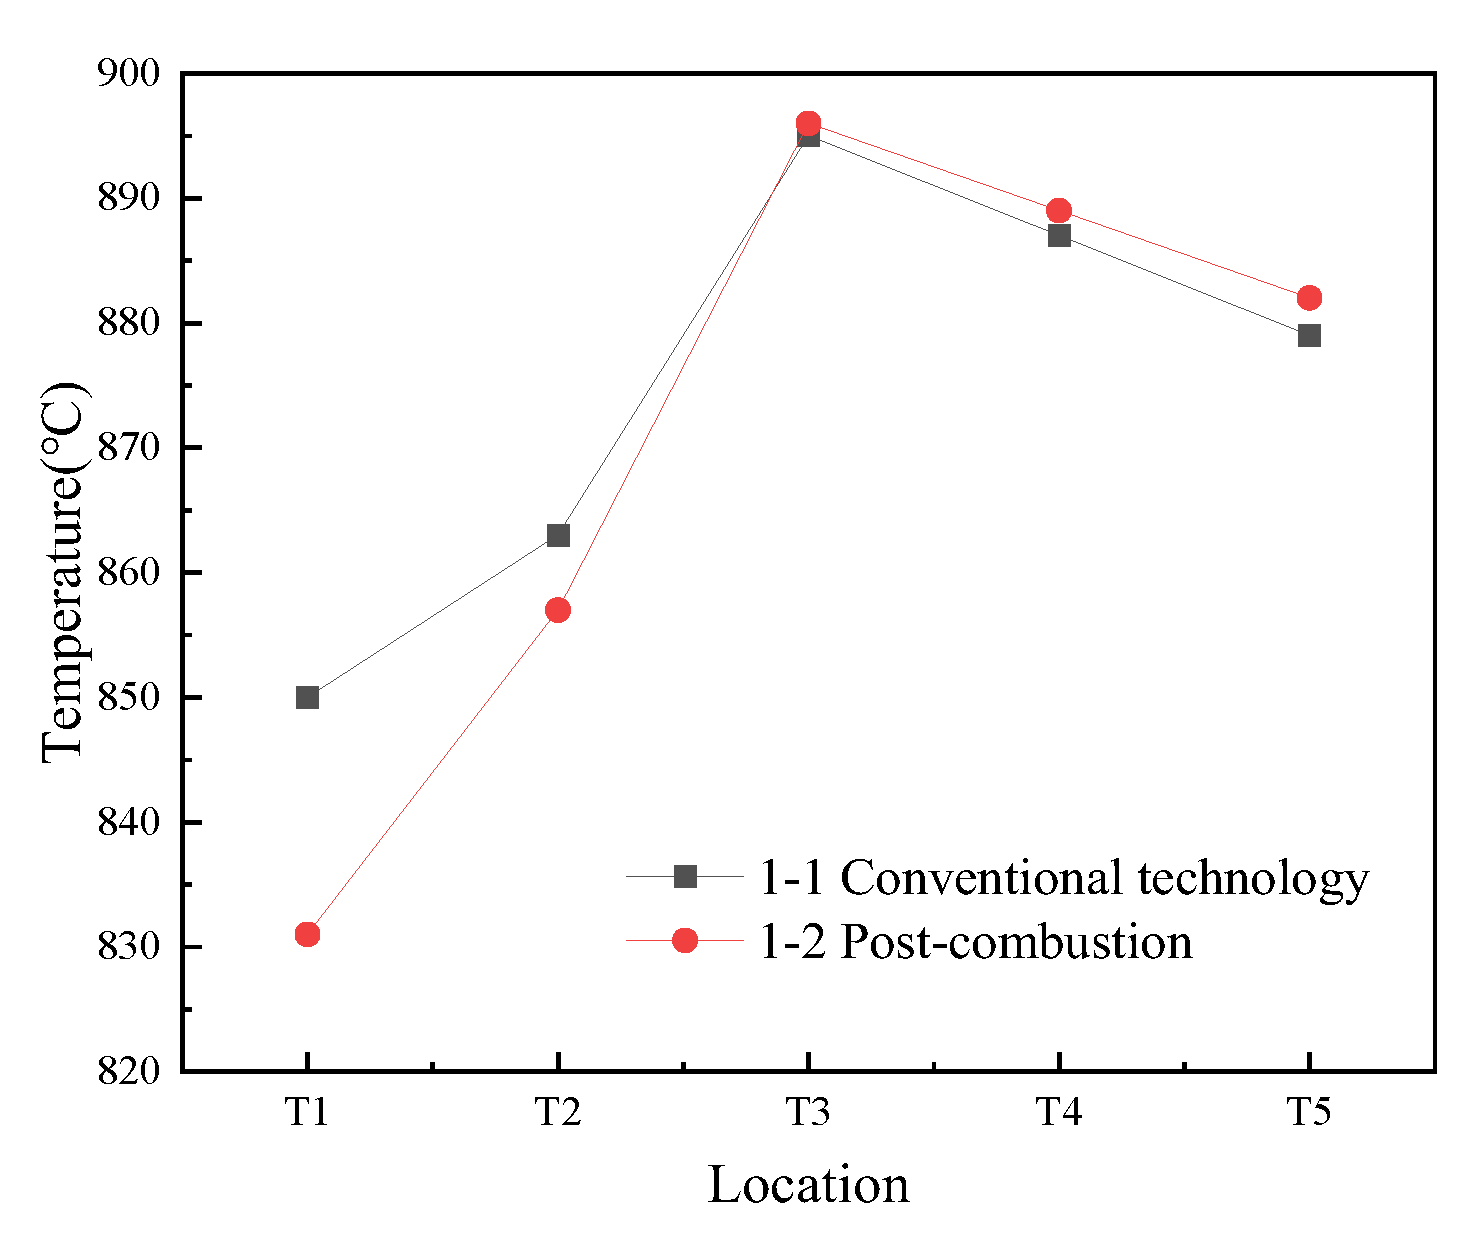
Figure 3 shows the temperature distributions in the furnace with sorbent addition for both post-combustion and conventional CFB combustion. The temperature first sharply increased, reached a maximum at T3, and then slowly decreased in the direction of the flue gas flow. The temperature at the bottom of the furnace was lower mostly because the primary air enters the furnace at lower temperatures [25]. The air absorbs a lot of heat, making the temperature lower. The temperature at T3 is highest due to the combustion of volatile matter of coal at this point. After T3, the temperature slowly declined. In addition, before the highest temperature point T3, the corresponding temperature under conventional combustion was higher, and after the highest temperature point, the temperature was higher under post-combustion conditions. The oxygen concentration at the bottom of the furnace under conventional combustion was higher, and the combustion was more complete, thus leading to greater heat release. Therefore, the temperature of conventional combustion below T3 was higher. Under post-combustion conditions, the opposite was true. Due to insufficient combustion, a large number of combustible components moved upward along the airflow direction. Therefore, after T3, the temperature was higher under post-combustion conditions.

3.1.2. NOx and SO2 Emissions with Sorbent Addition Under Both Combustion Methods

Figure 4 presents the NOx and SO2 emissions with sorbent addition for both conventional combustion and post-combustion. From Figure 4, the NOx emission under sorbent addition for conventional combustion is up to 241 mg/Nm3. For the traditional circulating fluidized bed boiler, injecting the sorbent into the furnace can lead to an increase in NOx emissions in most investigations because of the heterogeneous catalysis at the active particle surface of the sorbent, which can enhance NH3 and HCN conversion to NO [26].
NH3 + O2NO + N2
HCN + O2 NO + N2
NOx emissions under sorbent addition at conventional combustion are higher. Compared with conventional combustion, NOx emissions under sorbent addition at post-combustion is significantly lower. This is because the coal is combusted in a circulating fluidized bed combustor under a weakly reducing atmosphere. First, it can both inhibit and minimize the generation of NOx emissions. Second, injecting the sorbent into the furnace under a weakly reducing atmosphere has almost no adverse effect on the NOx emission.
It can be seen from Figure 4 that the SO2 emission under sorbent addition at conventional combustion is 193 mg/Nm3, while the SO2 emission at post-combustion is 386 mg/Nm3. Sulfur removal under conventional combustion can be carried out by the in situ injection of the sorbent through the following reaction:
CaO + SO2 + 1/2O2 → CaSO4
A circulating fluidized bed combustor at post-combustion contains a weakly reducing atmosphere, while the condition of a post-combustion chamber at post-combustion is oxidizing. When the sorbent is injected into the furnace, desulfurization reactions occur; when it enters into the post-combustion chamber, desulfurization reactions also take place. Sulfur removal under post-combustion can be carried out by the in situ injection of the sorbent during the following reactions:
CFB main combustor: CaO + H2S → CaS + H2O
Post-combustion Chamber: CaO + SO2 + 1/2O2 → CaSO4

3.2. NOx and SO2 Emissions with Sorbent Addition: Conventional vs. Post-Combustion

3.2.1. Temperature Profile in the CFB Furnace

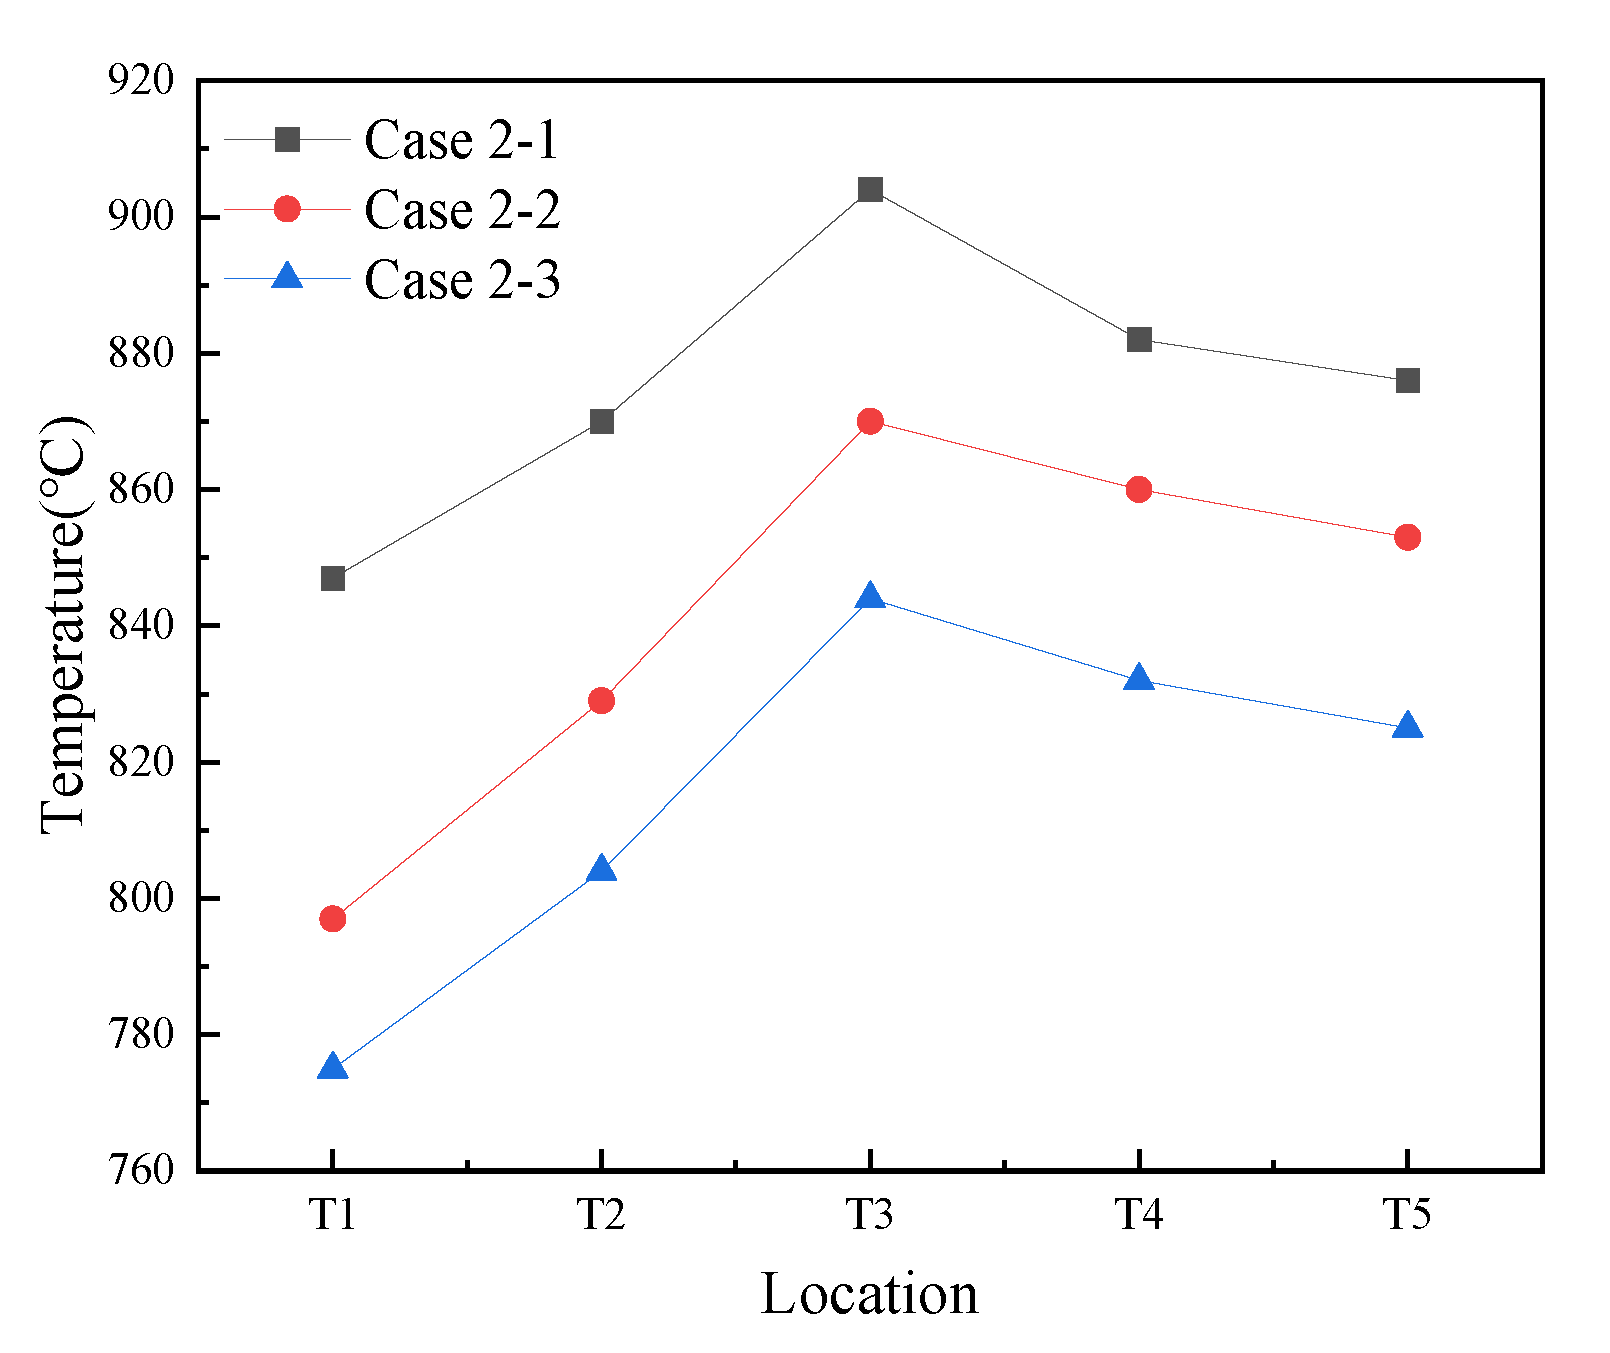
Figure 5 presents the temperature distributions in the CFB furnace for different cases. Regardless of the experimental condition, the trend of temperature distributions in the CFB furnace in different cases is similar. In the direction of the flue gas flow, the temperature of the five locations in the CFB furnace first increased sharply, reached a maximum at the point of T3, and then decreased slowly.

3.2.2. Effects of Temperature on NOx and SO2 Emissions with Sorbent Addition Under Post-Combustion

Figure 6 presents the NOx and SO2 emissions at different combustion temperatures with sorbent addition under post-combustion. As is shown in Figure 6, both NOx and SO2 emissions increased nearly linearly with rising combustion temperatures under post-combustion when the sorbent was added into the furnace. Specifically, when the temperature increased from 845 °C to 870 °C, NOx emission rose from 47.10 mg/Nm3 to 58.50 mg/Nm3, and the extent of the increase was 24.20%. When the temperature increased further from 870 °C to 905 °C, NOx emissions increased from 58.50 mg/Nm3 to 74.10 mg/Nm3, and the extent of the increase was 26.67%. As far as SO2 emissions are concerned, when the temperature rises from 845 °C to 870 °C, SO2 emissions increase dramatically from 92.87 mg/Nm3 to 252.75 mg/Nm3, and the extent of the increase is 172.15%. When the temperature increases from 870 °C to 905 °C, SO2 emissions rise from 252.75 mg/Nm3 to 452.88 mg/Nm3, and the extent of the increase is 79.18%.
This trend shows that under post-combustion and the addition of the sorbent for sulfur removal, both NOx and SO2 emissions increase as the combustion temperature rises. It is essential to lower the combustion temperature in order to reduce NOx and SO2 emissions under post-combustion. Notably, NOx emissions at 845 °C were 47.10 mg/Nm3, which is below 50 mg/Nm3, thus achieving ultra-low NOx emissions under in-furnace desulfurization conditions, while SO2 emissions are only 92.8 mg/Nm3. Therefore, the simultaneous removal of both NOx and SO2 can be realized under post-combustion. Ultra-low SO2 emissions (21.93 mg/Nm3) and low NOx emissions are achieved by sorbent injection into the furnace at 75t/h for pure coal slime circulating fluidized bed boilers with post-combustion technology [27], showing that the collaborative removal of NOx and SO2 emissions can be realized under post-combustion conditions. The removal efficiency of NOx and SO2 is especially effective at lower temperatures under post-combustion. SO2 emissions can decrease further and are expected to realize ultra-low SO2 emissions when calcined lime is injected into the post-combustion chamber. It is also noteworthy that, within the temperature range of 845 °C to 905 °C, the increase in SO2 emissions is more pronounced than that of NOx emissions, indicating that SO2 emissions and desulfurization efficiency are more sensitive to temperature changes. Given the stringent environmental standards, controlling SO2 emissions requires particular attention being given to the impact of temperature.

3.2.3. Characteristics of Fly Ash at Cyclone Outlet and at Tail Flue

Particle Size Distribution of Fly Ash at Cyclone Outlet and at Tail Flue

The particle size distributions of fly ash at the cyclone outlet and at the tail flue are shown in Figure 7. With respect to fly ash at the cyclone outlet, no large difference was found in the particle size distributions under different temperatures, while the difference in the particle size distributions of fly ash at the tail flue under different temperatures is obvious. The results of the granularity analysis of fly ash are listed in Table 4. It was obvious that the characteristic particle sizes (i.e., D10, D50, and D90) of the fly ash at the tail flue under different temperatures were relatively larger (Table 5) than those of fly ash at the cyclone outlet under corresponding temperatures. Taking median particle sizes (D50) for example, as shown in Table 5, the D50 of fly ash at the cyclone outlet at 905 °C, 870 °C and 845 °C were 33.12 μm, 27.57 μm and 28.05 μm, respectively, which were relatively smaller than those of the fly ash at the tail flue under corresponding temperatures (55.15 μm, 52.52 μm, and 34.78 μm). This was mainly due to the fact that the reaction of sulfur fixation occurred when fly ash at the cyclone outlet entered the post-combustion chamber.
To illustrate the reaction of sulfur fixation that occurred in the post-combustion chamber, the composition of fly ash at the cyclone outlet and tail flue was analyzed using XRF analysis. The results of the chemical composition of all ashes observed are shown in Table 6. It can be seen from Table 5 that compared with the fly ash at the cyclone outlet, the sulfur content in the fly ash at the tail flue increased at 905 °C, 870 °C, and 845 °C, which shows that the reaction of sulfur fixation occurred in the post-combustion chamber, resulting in more sulfur being solidified and stored in the fly ash at the tail flue. In addition, the lower the temperature, the higher the sulfur content in the fly ash at the tail flue, and the higher the efficiency of sulfur fixation.

Structural Characteristics of Organic Sulfur in Fly Ash

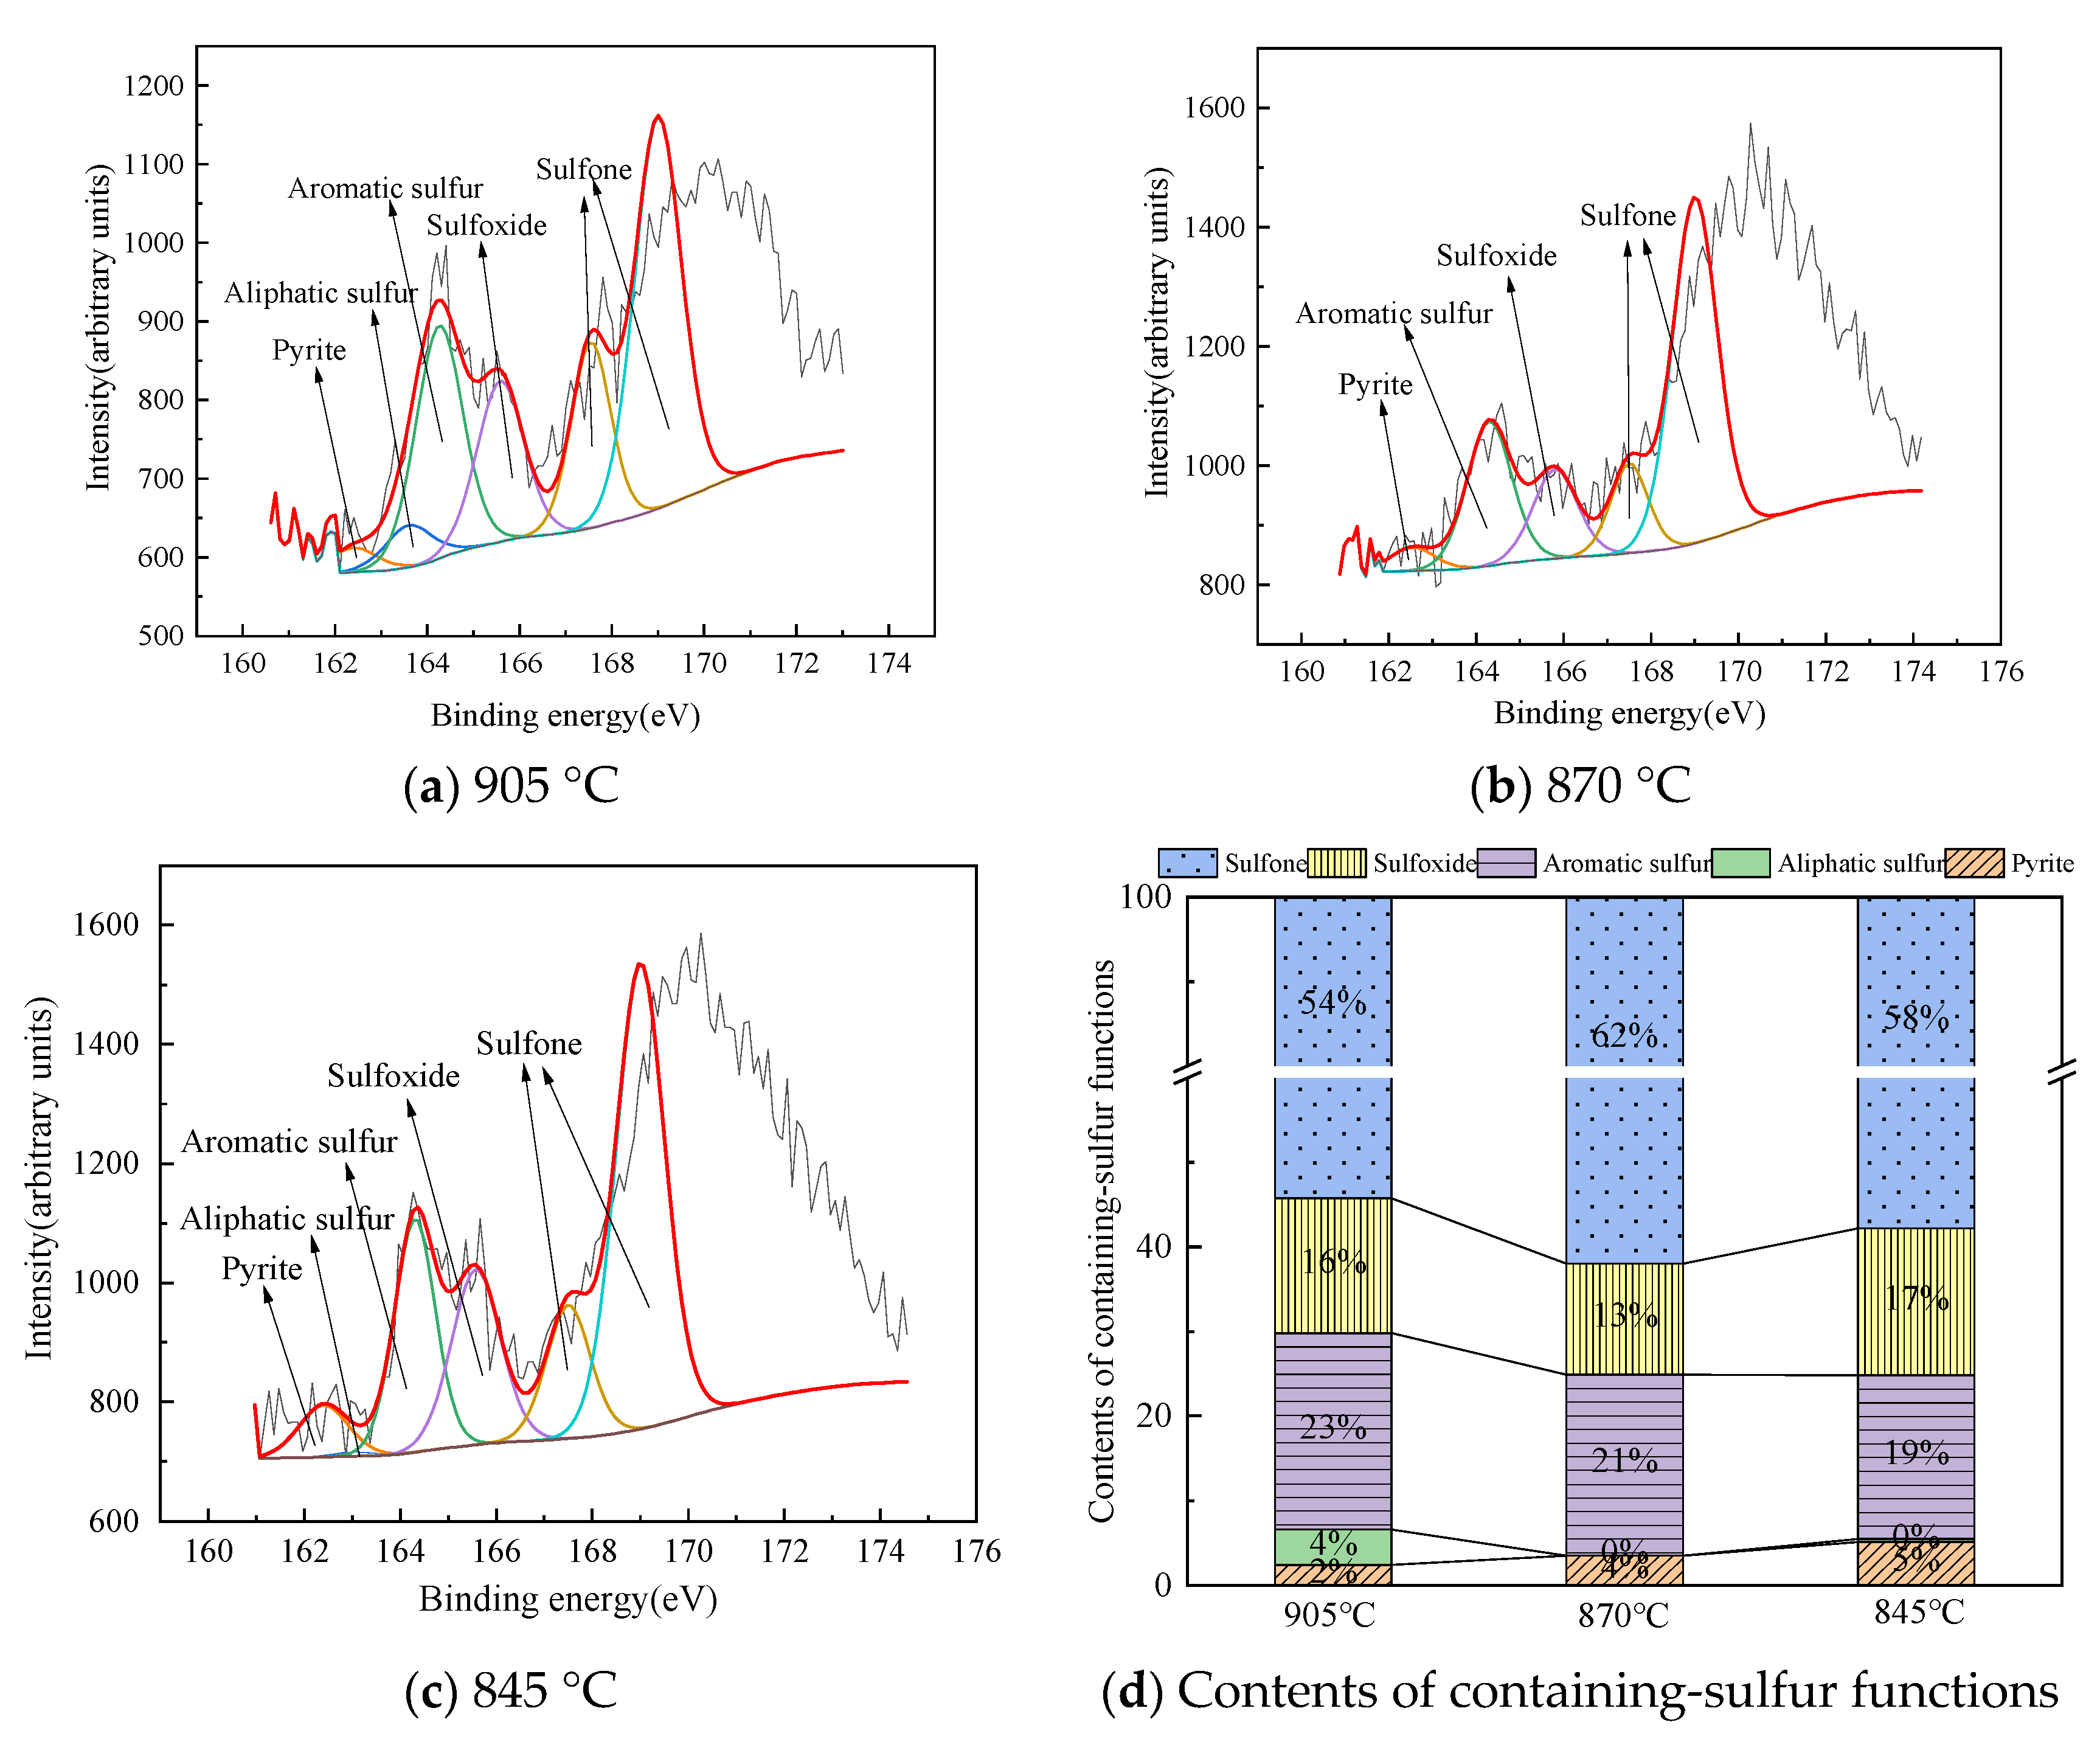
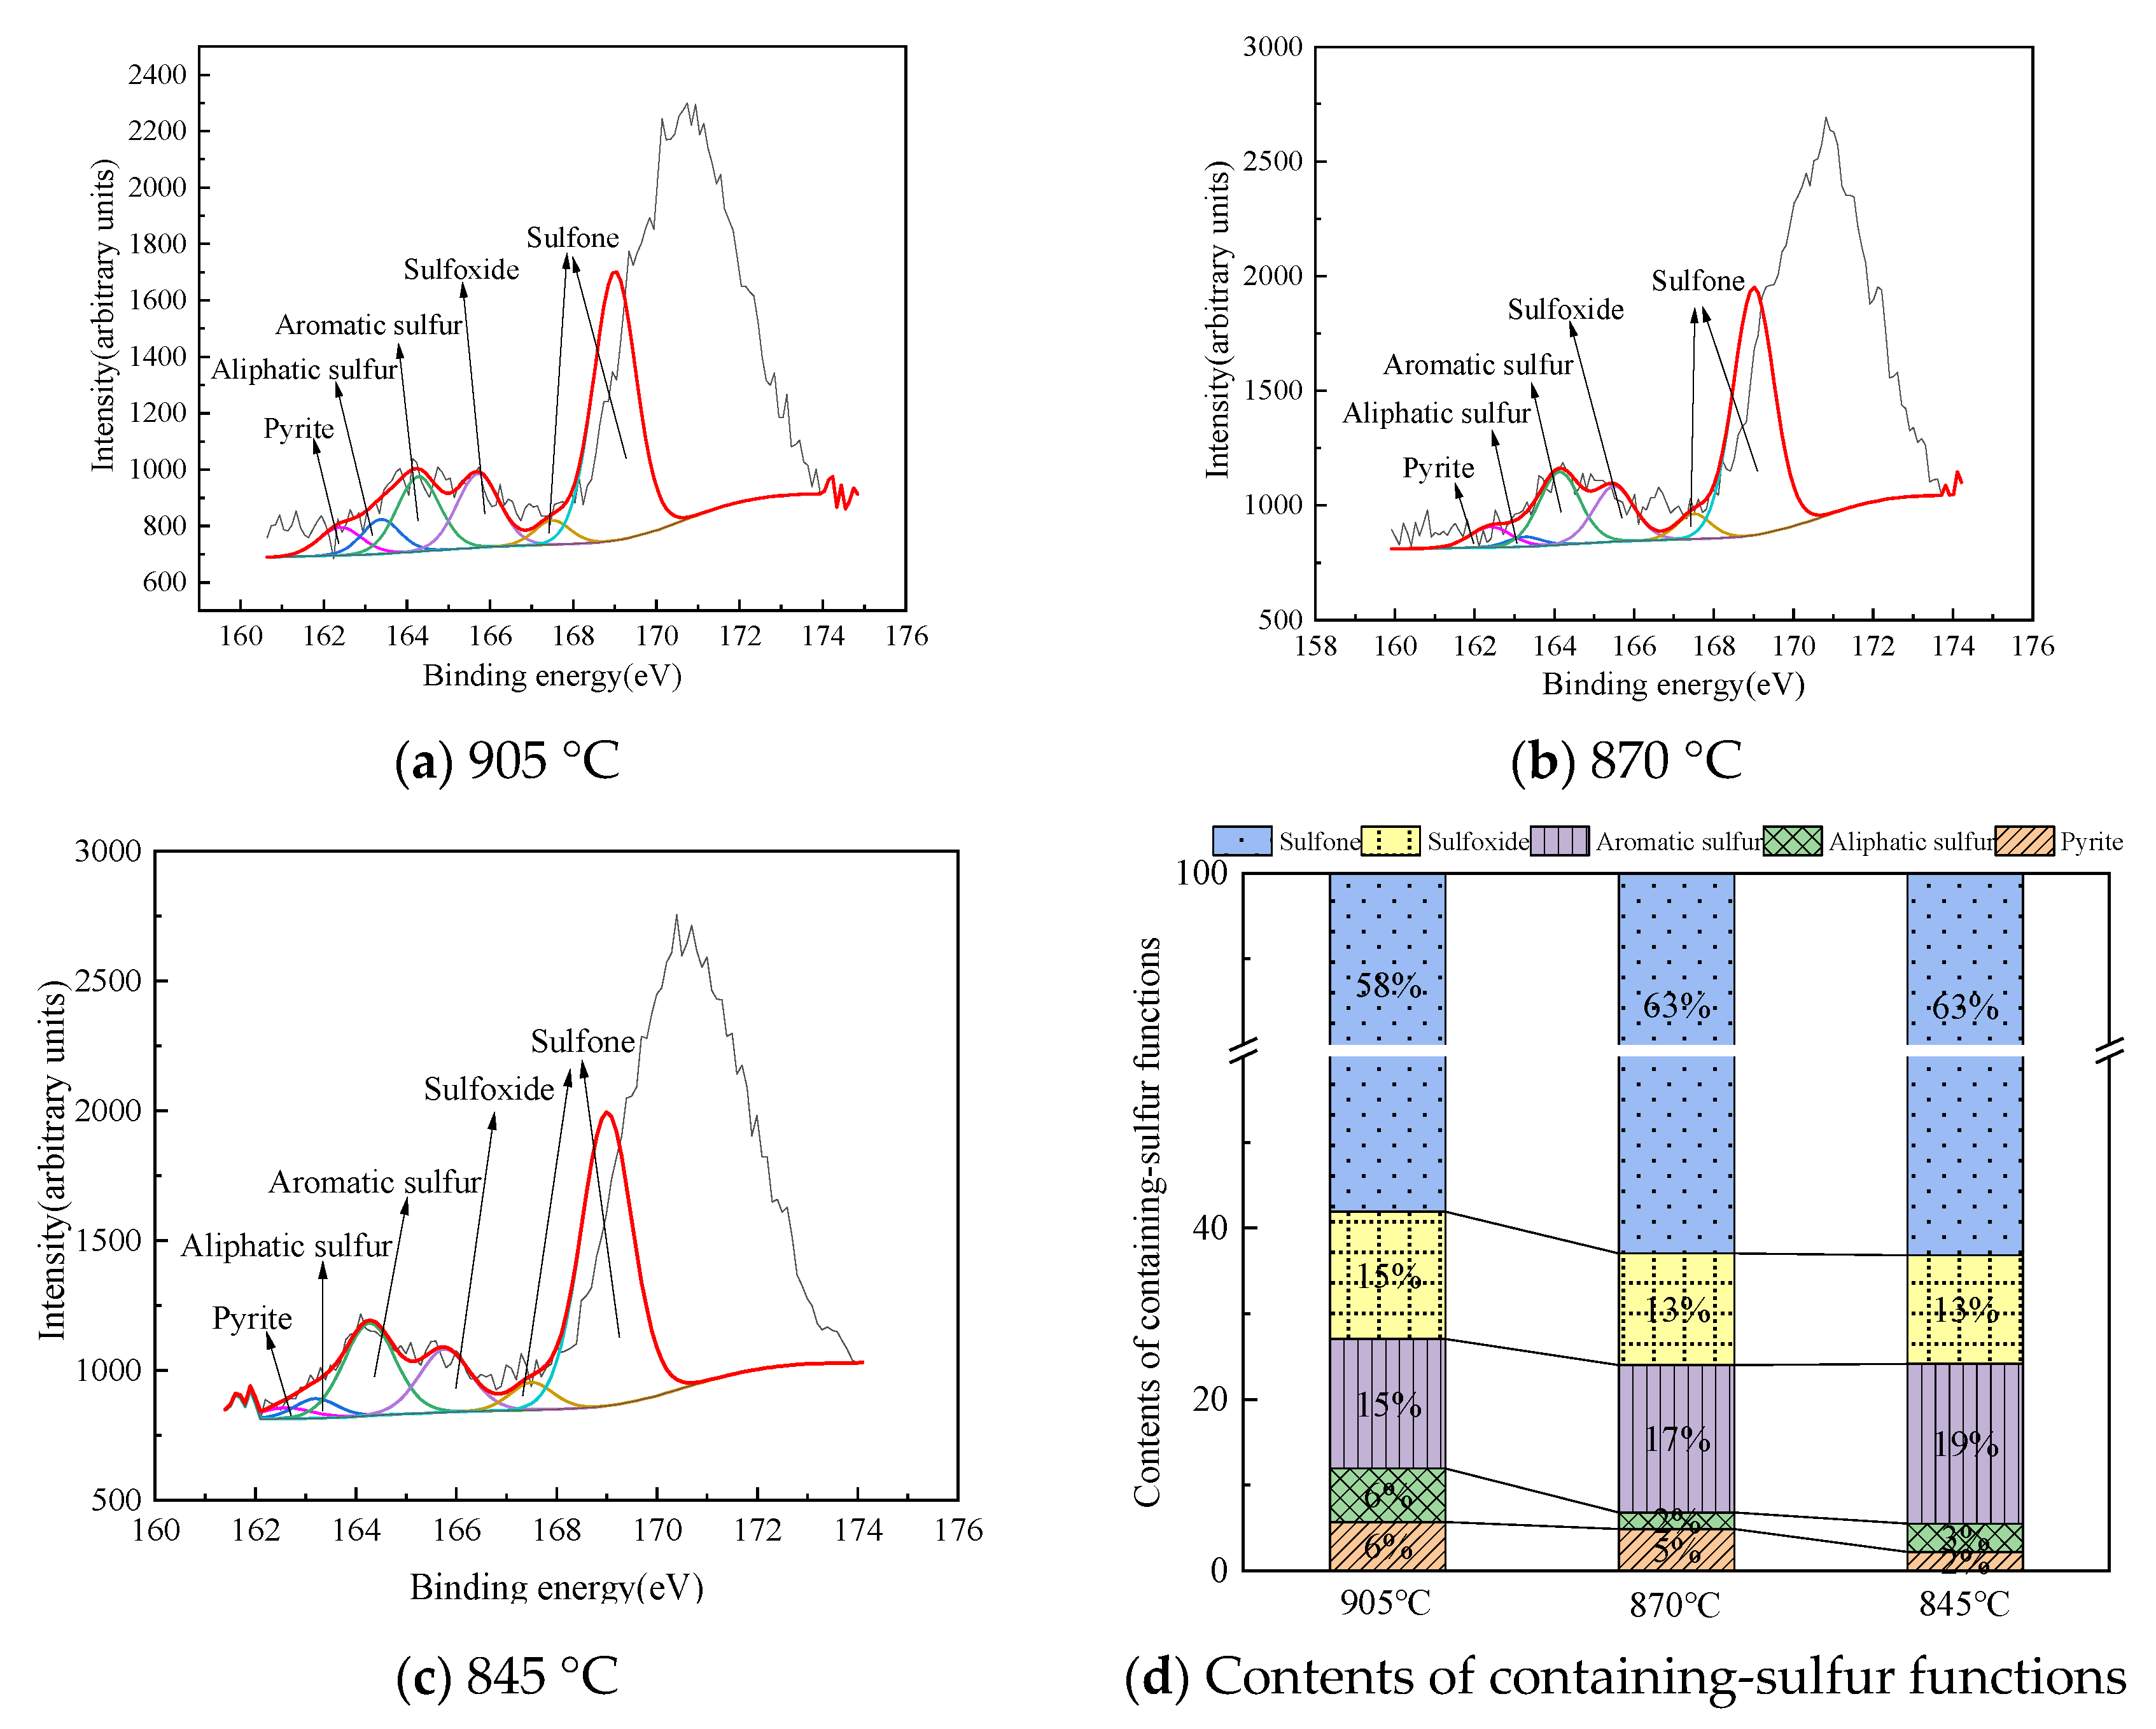
As shown in Figure 8 and Figure 9, XPS sulfur(2p) spectra are fitted by using a pair of spin–orbit splitting peaks: 2p3/2 and 2p1/2 [28]. To obtain an acceptable fit, six pairs of splitting peaks at different energy positions are used to fit the XPS sulfur(2p) spectra of the fly ash. As shown in Table 6, four pairs of splitting peaks are assigned to pyrite, aliphatic sulfur, aromatic sulfur, and sulfoxide, respectively; two pairs of splitting peaks at 168 (±0.5) and 168.5 (±0.5) eV are assigned to sulfone. The integral area in Figure 8 and Figure 9 represents the relative amount of each substance.
As listed in Table 7, it is clear that aromatic sulfur and sulfone are the predominant forms of organic sulfur on the surfaces of fly ash, and the proportions of the two forms are over 70%. Moreover, a small amount of sulfoxide sulfur (13–17%) was also present on the surfaces of fly ash, but the amount of aliphatic sulfur was lower (0–6%). Pyrite is quite small in all forms of fly ash. Sulfone is the sum of the relative amounts of two pairs of splitting peaks at 168 (±0.5) and 168.5 (±0.5) eV. This is expected to arise predominantly from sulfate, but contributions from sulfite and sulfone cannot be entirely dismissed [29]. Therefore, it is thought appropriate to consider that sulfone can include sulfate, sulfite, and sulfone. Gorbatyetal [30] found that aliphatic sulfur in coal was easily oxidized in the environment, with the formation of oxidation products such as sulfoxide and sulfone, whereas aromatic sulfur was more stable.
There is no H2S, COS, or CS2 at the cyclone outlet, and a very small amount of SO2 is observed. Therefore, the great majority of S released in coal remains in the fly ash due to a lack of oxygen in the furnace. Sulfone includes sulfate, sulfite, and sulfone, so it is closely related to SO2 emissions. As Figure 8d shows, the relative amount of sulfone in fly ash at the cyclone outlet experiences the trend of first increasing and then decreasing with a decreasing amount of temperature. Specifically, when temperatures are 845 °C and 870 °C, the relative amount of sulfone in fly ash at the cyclone outlet is higher than that at 905 °C, which shows that sulfur removal efficiency is higher under lower temperatures in a weekly reducing atmosphere. As Figure 9d shows, the relative amount of sulfone in fly ash at the tail flue increases with a decreasing temperature. The lower the temperature, the higher the sulfur content in the fly ash at the tail flue, and the higher the efficiency of sulfur fixation. In addition, it can be seen from Table 7 that compared with the fly ash at the cyclone outlet, sulfone in the fly ash at the tail flue increased at 905 °C, 870 °C and 845 °C, which shows that the reaction of sulfur fixation occurred in the post-combustion chamber, resulting in more sulfur being solidified and stored in the fly ash at the tail flue.

4. Conclusions

In summary, this study proposes a novel method of the combined removal of NOx and SO2 emissions under post-combustion technology combined with the injection of a sorbent into the furnace, exploring the potential of combined removal of the NOx and SO2 emissions under post-combustion technology. According to the experiment results, the following conclusions can be drawn:
The low-cost combined removal of NOx and SO2 can be realized by denitrification in the furnace and through secondary desulfurization in the furnace and post-combustion chamber. In the optimized experimental condition, with the combustion temperature at 845 °C and sorbent addition in the furnace under post-combustion, NOx emissions can be reduced to 47.10 mg/Nm3(@6%O2), and meanwhile, SO2 emissions can be reduced to 92.09 mg/Nm3. Sulfur removal efficiency is higher under lower temperatures in a weakly reducing atmosphere. The reaction of sulfur fixation that occurred in the post-combustion chamber caused the particle size of fly ash at the tail flue to become bigger and the sulfur content in the fly ash at the tail flue to increase. At 845–905 °C, combustion temperatures had a bigger effect on SO2 emissions than the NOx with sorbent addition in the furnace under post-combustion.

Author Contributions

Formal analysis, C.W.; Investigation, C.W.; Data curation, C.W.; Writing—original draft, C.W.; Writing—review & editing, C.W.; Supervision, Q.L. All authors have read and agreed to the published version of the manuscript.

Funding

This research received no external funding.

Data Availability Statement

The original contributions presented in this study are included in the article. Further inquiries can be directed to the corresponding author.

Conflicts of Interest

The authors declare no conflict of interest.

References

  1. CSY. China Statistical Yearbook; China Statistical Publishing House: Beijing, China, 2023.
  2. Yang, H.; Guangxi, Y.; Lu, J.; Zhang, H. An update of circulating fluidised bed combustion (CFB) technology in China. VGB Power Tech. 2012, 92, 75–79. [Google Scholar]
  3. Yue, G.; Cai, R.; Lu, J.; Zhang, H. From a CFB reactor to a CFB boiler—The review of R&D progress of CFB coal combustion technology in China. Powder Technol. 2017, 316, 18–28. [Google Scholar]
  4. Koornneef, J.; Junginger, M.; Faaij, A. Development of fluidized bed combustion—An overview of trends, performance, and cost. Prog. Energy Combust. Sci. 2007, 33, 19–55. [Google Scholar] [CrossRef]
  5. Shuangchen, M.; Jin, C.; Kunling, J.; Lan, M.; Sijie, Z.; Kai, W. Environmental influence and countermeasures for high humidity flue gas discharging from power plants. Renew. Sustain. Energy Rev. 2017, 73, 225–235. [Google Scholar] [CrossRef]
  6. Lyngfelt, A.; Amand, L.E.; Bo, L. Low N2O, NO and SO2 emissions from circulating fluidized bed boilers. In Proceedings of the International Conference on Fluidized Bed Combustion, Orlando, FL, USA, 7–10 May 1995. [Google Scholar]
  7. Lyngfelt, A.; Aamand, L.E.; Leckner, B. Obtaining low N2O, NO, and SO2 emissions from circulating fluidized bed boilers by reversing the air staging conditions. Energy Fuels 1995, 9, 386–387. [Google Scholar] [CrossRef]
  8. Emis. Selective Non-Catalytic Reduction. 2018. Available online: https://emis.vito.be/en/techniekfiche/selective-non-catalytic-reduction (accessed on 11 April 2024).
  9. Emis. Selective Catalytic Reduction. 2018. Available online: https://emis.vito.be/en/techniekfiche/selective-catalytic-reduction (accessed on 11 April 2024).
  10. Li, Z.; Liu, X.M.; Yang, D.H.; Qin, W.J. Research of the SNCR Process and its Application. Adv. Mater. Res. 2014, 953, 1307–1314. [Google Scholar] [CrossRef]
  11. Kohl, A.L.; Nielsen, R.B. Gas Purification, 5th ed.; Gulf Professional Publishing: Houston, TX, USA, 1997; pp. 466–669. [Google Scholar]
  12. IEA. Flue Gas Desulfurization (FGD) for SO2 Control. 2006. Available online: http://www.iea-coal.org.uk/ (accessed on 11 April 2024).
  13. Warych, J.; Szymanowski, M. Optimum values of process parameters of the “wet limestone flue gas desulfurization system”. Chem. Eng. Technol. 2015, 25, 427–432. [Google Scholar] [CrossRef]
  14. Li, X.; Han, J.; Liu, Y.; Dou, Z.; Zhang, T.-A. Summary of research progress on industrial flue gas desulfurization technology. Sep. Purif. Technol. 2022, 281, 119849. [Google Scholar] [CrossRef]
  15. Chen, R.; Zhang, T.; Guo, Y.; Wang, J.; Wei, J.; Yu, Q. Recent advances in simultaneous removal of SO2 and NOx from exhaust gases: Removal process, mechanism and kinetics. Chem. Eng. J. 2021, 420, 127588. [Google Scholar] [CrossRef]
  16. Liu, Y.; Li, B.; Lei, X.; Liu, S.; Zhu, H.; Ding, E.; Ning, P. Novel method for high-performance simultaneous removal of NOx and SO2 by coupling yellow phosphorus emulsion with red mud. Chem. Eng. J. 2022, 428, 131991. [Google Scholar] [CrossRef]
  17. Kang, M.S.; Shin, J.; Tae, U.Y.; Hwang, J. Simultaneous removal of gaseous NOx and SO2 by gas-phase oxidation with ozone and wet scrubbing with sodium hydroxide. Chem. Eng. J. 2020, 381, 122601. [Google Scholar] [CrossRef]
  18. Wang, C.; Song, G.; Chen, R.; Jiang, Y.; Lyu, Q. Influence of operating parameters on NOx and SO2 emissions in circulating fluidized bed with post-combustion. J. Therm. Sci. 2023, 32, 1858–1867. [Google Scholar] [CrossRef]
  19. Zhou, T.; Lu, Q.; Cao, Y.; Wu, G.; Li, S. Study on the combustion and NOx emission characteristics of low rank coal in a circulating fluidized bed with post-combustion. Can. J. Chem. Eng. 2017, 95, 2333–2340. [Google Scholar] [CrossRef]
  20. Song, G.; Yang, X.; Yang, Z.; Xiao, Y. Experimental study on ultra-low initial NOx emission characteristics of Shenmu coal and char in a high temperature CFB with post-combustion. J. Energy Inst. 2021, 94, 310–318. [Google Scholar] [CrossRef]
  21. Song, G.; Xiao, Y.; Yang, Z.; Yang, X.; Lyu, Q. A comparative experimental study on characteristics of ultra-low NOx emission and fly ash between Fugu bituminous and its semi-coke with post-combustion. Fuel Process. Technol. 2021, 211, 106618. [Google Scholar] [CrossRef]
  22. Song, G.; Xiao, Y.; Yang, Z.; Yang, X.; Lyu, Q.; Zhang, X.; Pan, Q. Operating characteristics and ultra-low NOx emission of 75 t/h coal slime circulating fluidized bed boiler with post-combustion technology. Fuel 2021, 292, 120276. [Google Scholar] [CrossRef]
  23. Mereb, J.B.; Wendt, J.O.L. Air staging and reburning mechanisms for NOx abatement in a laboratory coal combustor. Fuel 1994, 73, 1020–1026. [Google Scholar] [CrossRef]
  24. Åmand, L.E.; Leckner, B.; Dam-Johansen, K. Influence of SO2 on the NO/N2O chemistry in fluidized bed combustion: 1. Full-scale experiments. Fuel 1993, 72, 557–564. [Google Scholar] [CrossRef]
  25. Basu, P.; Fraser, S.A. Circulating Fluidized Bed Boilers; Elsevier Science: Amsterdam, The Netherlands, 1991. [Google Scholar]
  26. Jensen, A.; Johnsson, J.E.; Dam-Johansen, K. Nitrogen chemistry in FBC with limestone addition. Symp. Combust. 1997, 26, 3335–3342. [Google Scholar] [CrossRef]
  27. Wang, C.; Song, G.; Yang, Z.; Xiao, Y.; Yang, X.; Ji, Z.; Lyu, Q. Influence of limestone addition on combustion and emission characteristics of coal slime in the 75 t/h CFB boiler with post-combustion chamber. J. Therm. Sci. 2023, 32, 1849–1857. [Google Scholar] [CrossRef]
  28. Wang, Q.; Liu, Q.; Wang, Z.C.; Liu, H.-P.; Bai, J.-R.; Ye, J.-B. Characterization of organic nitrogen and sulfur in the oil shale kerogens. Fuel Process. Technol. 2017, 160, 170–177. [Google Scholar] [CrossRef]
  29. Kelemen, S.R.; Afeworki, M.; Gorbaty, M.L.; Sansone, M.; Kwiatek, P.J.; Walters, C.C.; Freund, H.; Siskin, M.; Bence, A.E.; Curry, D.J.; et al. Direct characterization of kerogen by X-ray and solid-state 13C nuclear magnetic resonance methods. Energy Fuels 2007, 21, 1548–1561. [Google Scholar] [CrossRef]
  30. Gorbaty, M.L.; Kelemen, S.R.; George, G.N.; Kwiatek, P.J. Characterization and thermal reactivity of oxidized organic sulphur forms in coals. Fuel 1992, 71, 1255–1264. [Google Scholar] [CrossRef]
Figure 1. Particle size distribution of coal.
Processes 13 01496 g001
Figure 2. 0.1 MWth CFB test platform. 1. Furnace of CFB; 2. cyclone; 3. Seal loop; 4. post-combustion chamber; 5. post-combustion air preheater; 6. primary air preheater; 7. bag-type dust collector.
Processes 13 01496 g002
Figure 3. Temperature in CFB furnace under conventional combustion and post-combustion.
Processes 13 01496 g003
Figure 4. NOx and SO2 emissions with sorbent addition under conventional and post-combustion methods.
Processes 13 01496 g004
Figure 5. Temperature in CFB furnace.
Processes 13 01496 g005
Figure 6. Effects of temperature on NOx and SO2 with sorbent addition under post-combustion conditions.
Processes 13 01496 g006
Figure 7. Particle size distribution of fly ash at cyclone outlet and at tail flue.
Processes 13 01496 g007
Figure 8. XPS sulfur spectrograms of fly ash at the cyclone outlet.
Processes 13 01496 g008
Figure 9. XPS sulfur spectrograms of fly ash at tail flue.
Processes 13 01496 g009
Table 1. Proximate analysis and ultimate analysis. Reproduced with permission from [Chao Wang], [Journal of Thermal Science]; published by [Springer Nature], [2023] [18].
ItemProximate Analysis (wt %, ad)Ultimate Analysis (wt %, ad)Low Heating Value (MJ/kg)
MoistureAshVolatile
Matter
Fixed
Carbon
CarbonHydrogenNitrogenOxygenSulfur
Shenmu coal11.809.8239.0147.8062.943.880.9810.180.4024.52
The “ad” indicates the abbreviation of “air dry basis”.
Table 2. Hydrated lime composition.
CompositionCaOMgOFe2O3SiO2Al2O3SO3K2OMnOClP2O5ZnO
Content (wt, %)74.100.960.390.380.190.060.040.030.020.010.01
Table 3. Experimental condition.
CaseT (°C)Ca/SλλCFBPrimary Air (m3/h)Post-Combustion Air (m3/h)Other Air
(m3/h)
Feeding Coal (kg/h)
1-19002.51.151.1527065.94
1-29002.51.150.9279.1265.94
2-19052.51.150.9279.1265.94
2-28702.51.150.9279.1265.94
2-38452.51.150.9279.1265.94
Notes: “T” is represented by the highest temperature in the furnace for each case; other types of air include returning air and carrying coal air.
Table 4. Particle size distributions of fly ash at tail flue and cyclone outlet.
T (°C)Fly AshD10 (μm)D50 (μm)D90 (μm)
905a4.1033.12139.97
b7.4255.15269.14
870a5.3027.57149.62
b8.2352.52452.55
845a4.5328.05119.98
b6.6134.78239.18
Notes: “a and b” represent fly ash at the cyclone outlet and fly ash at the tail flue; “D10”, “D50”, and “D90” represent the particle diameters, below which the accumulated percentages are 10%, 50%, and 90%.
Table 5. Element contents of fly ash at tail flue and cyclone outlet.
T (°C)Fly Ash12345678
905aCa (%)O (%)Si (%)Fe (%)Al (%)S (%)Na (%)Others (%)
41.2536.478.874.383.702.500.632.19
bCaOSiFeAlSNaothers
36.2138.7611.114.283.513.910.501.72
870aCaOSiFeAlSNaothers
39.4036.939.085.363.932.700.741.87
bCaOSiFeAlSNaothers
36.3038.6610.414.493.754.170.611.63
845aCaOSiFeAlSNaothers
38.4837.588.934.744.323.460.771.71
bCaOSiFe AlSNaothers
36.3338.8010.004.493.834.520.561.48
Notes: “a and b” represent fly ash at the cyclone outlet and fly ash at the tail flue.
Table 6. Binding energies and forms of S (2p) functional groups.
Sulfur FunctionalityBinding Energy/eVFunctional Form
Pyrite162.5 ± 0.1FeS2
Aliphatic sulfur163.3 ± 0.3Processes 13 01496 i001
Aromatic sulfur164.1 ± 0.2Processes 13 01496 i002
Sulfoxide165.7 ± 0.3Processes 13 01496 i003
Sulfone168.0 ± 0.5
168.5 ± 0.5
Processes 13 01496 i004
Table 7. Contents of containing-sulfur functions in fly ash under different temperatures.
T (°C)Fly AshPyrite (%)Aliphatic Sulfur (%)Aromatic Sulfur (%)Sulfoxide (%)Sulfone (%)
905a2.434.1823.1815.9954.22
b5.76.2215.1214.8758.09
870a3.5021.3813.1661.96
b4.871.9417.1913.0362.97
845a5.140.3319.3217.457.8
b2.223.2818.6512.6663.18
Notes: “a and b” represent fly ash at the cyclone outlet and fly ash at the tail flue.
Disclaimer/Publisher’s Note: The statements, opinions and data contained in all publications are solely those of the individual author(s) and contributor(s) and not of MDPI and/or the editor(s). MDPI and/or the editor(s) disclaim responsibility for any injury to people or property resulting from any ideas, methods, instructions or products referred to in the content.