1. Introduction
As a crucial alternative energy source in China’s “Carbon Peak and Carbon Neutrality” strategy, the exploration and development of deep and ultra-deep natural gas resources have become a primary focus of the petroleum industry [
1,
2]. The completion string serves as the conduit for transporting formation fluids (oil, gas, water) to the surface and injecting working fluids into reservoirs, playing a vital role in hydrocarbon production. However, during service, tubing strings are subjected to high-speed transient gas impacts, inducing fluid–structure interaction (FSI) vibrations that expose them to dynamic alternating loads. This leads to buckling at the bottom of the tubing, causing friction and collisions with the casing, thereby accelerating damage and failure. Consequently, there is an urgent need to investigate the dynamic behavior of tubing strings in ultra-deep gas wells during service. Recent years have seen growing research on tubing string buckling in ultra-deep wells.
In theoretical studies, Lian ZH. established mathematical models for the effective axial force of horizontal well completion strings, additional friction between strings and wellbore walls, fluid-induced friction, and axial forces related to build-up section curvature radii [
3]. He T. addressed the challenges of high temperatures, extreme pressures, and complex loads in ultra-deep horizontal fracturing strings, developed a mechanical analysis model for staged fracturing strings and proposed corresponding analysis methods for different fracturing phases [
4]. Hua Y. solved the deflection curve differential equation, demonstrating that surface-applied loads have a limited influence on string lateral displacement and bending moment [
5]. Lucas P. successfully determined the relationship between variable fluid pressure and string displacement, along with modal vibration characteristics between stress and displacement, by establishing a coupled structural-fluid motion model for individual pipe segments [
6]. Zhang Z. conducted case studies on a western gas well, revealing significant Poisson coupling effects between the tubing and internal gas, with axial stresses exhibiting unstable pulsating alternating states that gradually attenuate to stability [
7]. Sun P. performed mechanical analysis of injection-production strings under multi-cycle alternating loads through pressure and temperature field analyses, validating their theory with field data [
8]. Kang ZL. investigated transverse-longitudinal coupling vibrations in completion strings induced by gas flow, providing preliminary analysis of FSI responses [
9]. Wang JJ. analyzed casing string design limitations under frequent well cycling, steam injection, and intensive production, proposing a strain-based controllable deformation concept for lifecycle development [
10]. Yu Y. demonstrated through elastic rod vibration equations that dynamic loads from fluid pressure/flow variations significantly affect connection performance [
11]. Zhang Y. developed coupled discrete fluid-flow and stress–strain models using finite volume and finite element methods with fully implicit numerical solutions [
12]. Cao YP. established vibration control equations with/without FSI effects, confirming its critical importance through comparative analysis [
13].
Research on string integrity and lifespan remains pivotal in petroleum engineering [
14,
15,
16]. Early studies by Liu SW. on sucker rods showed increased fracture probability with greater deviations from standard configurations [
17]. Subsequent work included the following: Tang LQ. conducted fracture mechanics analysis of microcrack propagation mechanisms [
18]; Cui ZD. examined fracture criteria and critical effective compressive stress theory [
19]; Lv QG. conducted material heterogeneity studies on L80-grade pipe failures [
20]; and Ravindranath K. studied L80 tubing longitudinal cracking from localized stress-corrosion thinning [
21]. Stress acceleration of corrosion electrochemical processes was confirmed by Bao MY., showing stress corrosion cracking can occur below yield strength [
22]. Recent advancements include the following: Wu SC’s innovative fatigue crack growth model (iLAPS) for various stress ratios [
23]; Chen Z’s reliability analysis combining a modified S-N curve and fracture mechanics methods [
24]; Feng C.’s vortex-induced vibration mitigation strategies for deepwater risers [
25]; Cheng BL.’s high-cycle corrosion fatigue model for API X65 steel [
26]; Gao YQ.’s probabilistic crack growth analysis for gas storage wells [
27]; Tang QY.’s multivariate curve-fitting for coiled tubing fatigue life prediction [
28]; and Ma Y.’s rainflow counting-Miner rule integration for ultra-deep well fatigue assessment [
29,
30]. Wang H.’s failure analysis further linked crack locations and orientations to structural design and alternating pressure loads [
31].
While existing FSI vibration research primarily focuses on natural frequency impacts, studies on dynamic characteristics for full-wellbore fatigue life prediction in ultra-deep wells remain limited. Current fracture analyses often neglect synergistic effects between material fatigue strength degradation and alternating loads. Therefore, comprehensive investigation of string failure mechanisms is imperative to ensure safe field operations.
3. Theoretical Model for Flow-Induced Vibration Analysis of Tubing Strings
For the problem of tubing string vibration caused by the vibration mechanism, existing models cannot consider the vibration situation of the production string under complex working conditions. This section analyzes the process of establishing the fluid structure coupling equation by considering parameters such as axial and radial velocity, density, and pressure of the fluid.
Deduction of Fluid Solid Coupling Vibration Equation for Tubing String
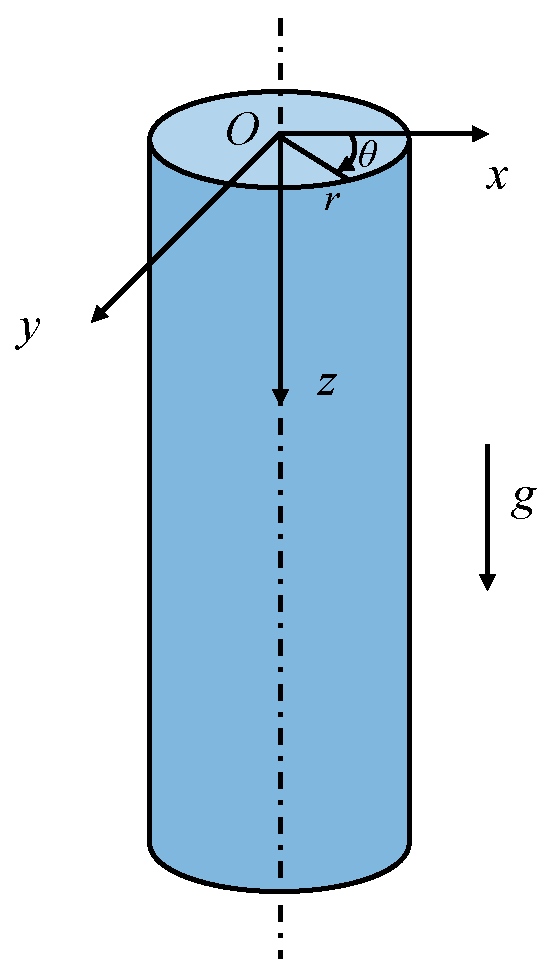
In high-pressure and high-production gas wells, the coupling effect between the fluid and the tubing string will change the spectral characteristics of water hammer waves. The coordinate system of the axial vibration model of the straight wellbore tubing string is shown in
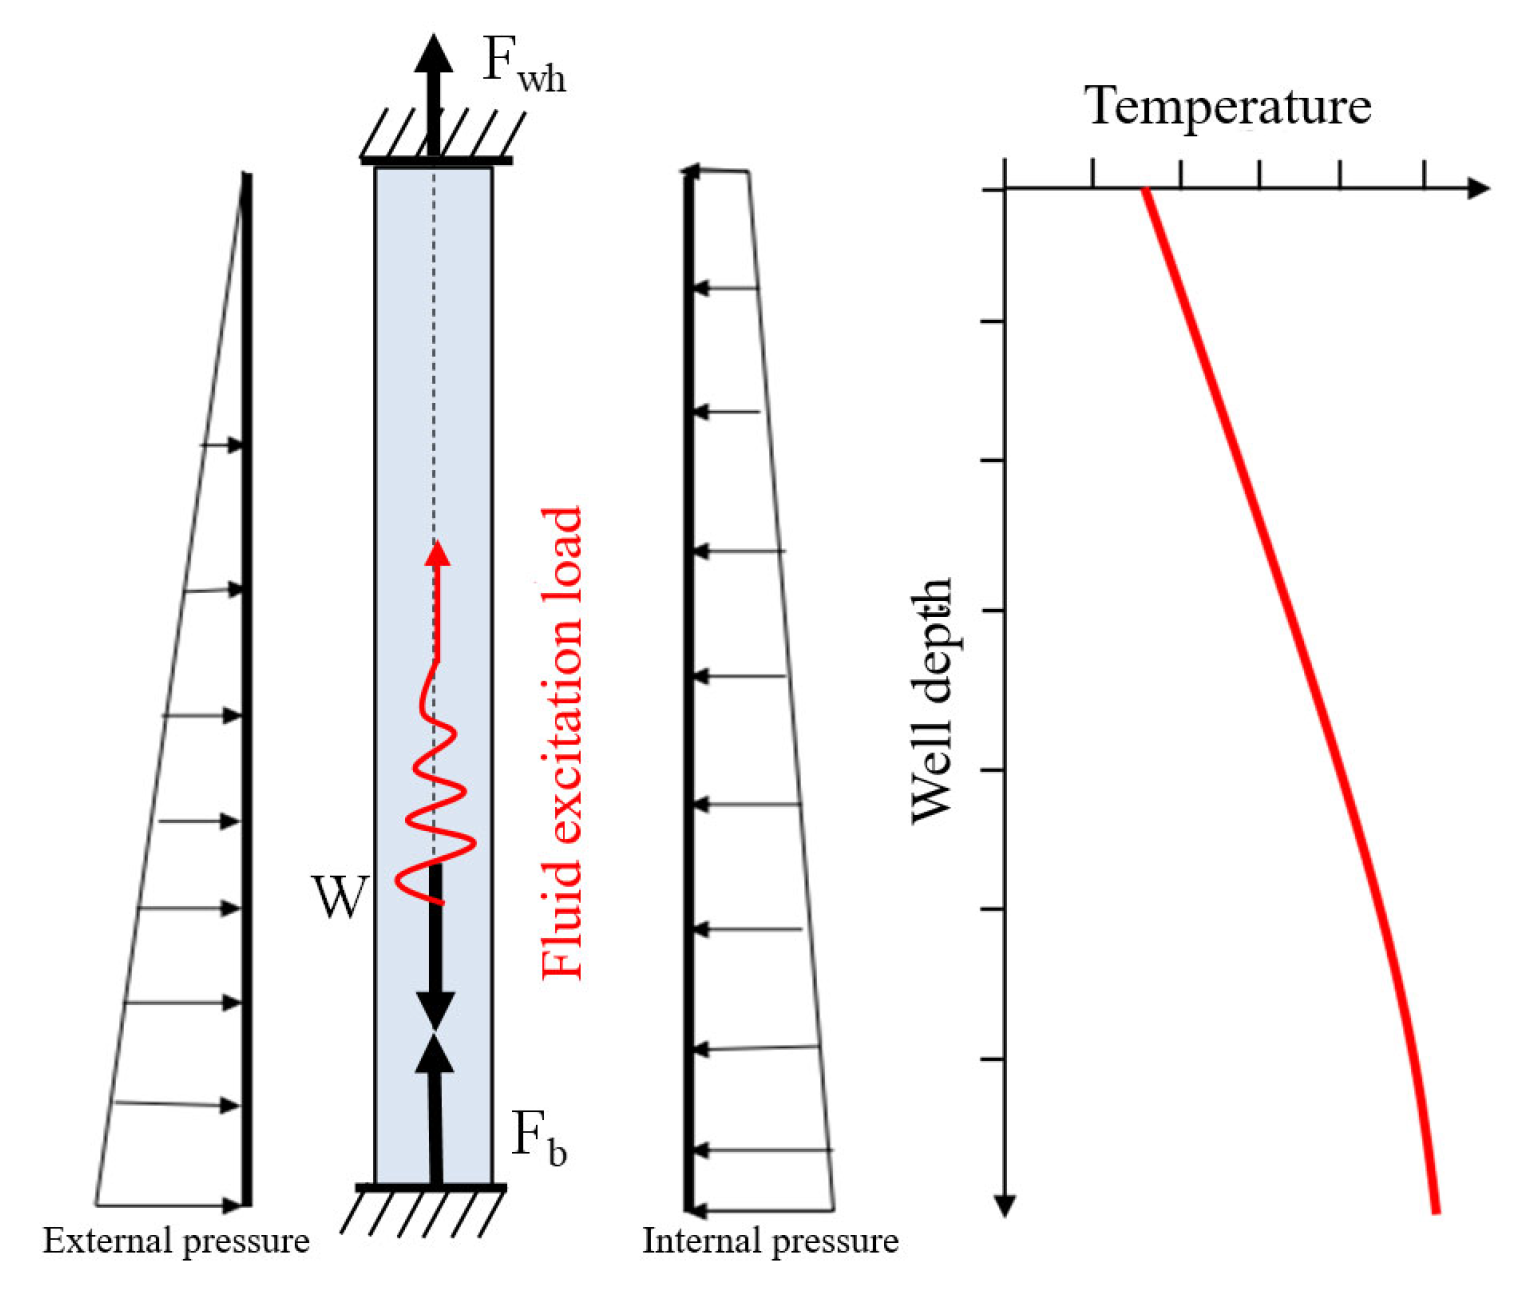
Figure 2, where in the adopted Cartesian coordinate system, the distribution of the x, y, and z axes follows the right-hand rule. In the local coordinate system, the x-z plane is the gravitational plane (the plane containing the gravity vector), and the z-axis direction coincides with the pipeline axis. All units are in the International System of Units (SI). Flow-induced vibration model of tubing string as schematically shown in
Figure 3, the proposed model describes the vibration of a homogeneous, elastic, and isotropic circular tubing string under internal gas flow, with the following key features: it is a homogeneous, elastic, and isotropic circular tube; radial fluid motion is caused by radial deformation of the tubing and rotational motion of the fluid around the tubing axis; the frictional coupling between the tubing string and the fluid can be ignored; the natural gas inside the tubing string is a single-phase gas; the force and flow velocity are constant values at the same section of the tubing string; and the velocity of the body and tubing string is much lower than the wave velocity, so the convective term in the control equation can be ignored.
The fluid continuity equation is:
The fluid axial motion equation is:
The fluid radial motion equation is:
According to the continuous flow and Navier–Stokes equations of motion, a cylindrical coordinate system is used to describe fluid motion, with axial coordinate z, radial coordinate r, and time coordinate t. The fluid control equation is obtained as follows:
where vz and vr represent the axial and radial velocities of the fluid, m/s; respectively; ρf is the fluid density, kg/m3; Fz and Fr are the axial and radial forces, N, generated by fluid gravity. For a vertical well, Fz = ρfg, Fr = 0; κ is the volume viscosity coefficient of the fluid; μ is the fluid dynamic viscosity coefficient; p is the fluid pressure, MPa; z is the axial length of the tubing string, m; r is the radial thickness of the tubing string, m; t is time. The fluid parameters vz, vr, ρf, and p are all functions of the coordinates z, r, and t.
By substituting the fluid structure coupling conditions into the equation and undergoing a series of formula transformations, a four-equation model of the axial vibration of the tubing string fluid structure coupling is finally obtained:
The fluid axial motion equation is:
The fluid continuity equation is:
The axial motion equation of tubing string is:
The axial stress velocity relationship equation of the tubing string is:
where
λf is the friction coefficient of natural gas;
λw is the friction coefficient of the completion fluid filled in the tubing-casing annulus.
and
are the axial velocity and radial velocity of the pipe string, respectively.
4. Tubing String Experimental Study on High Cycle Fatigue Performance of P110 Steel
In the fluid structure coupling four-equation model with random vibration excitation, some parameters need to be obtained through experimental data and fatigue tests of tubing string material specimens need to be designed for research.
4.1. Sample Preparation and Experimental Methods
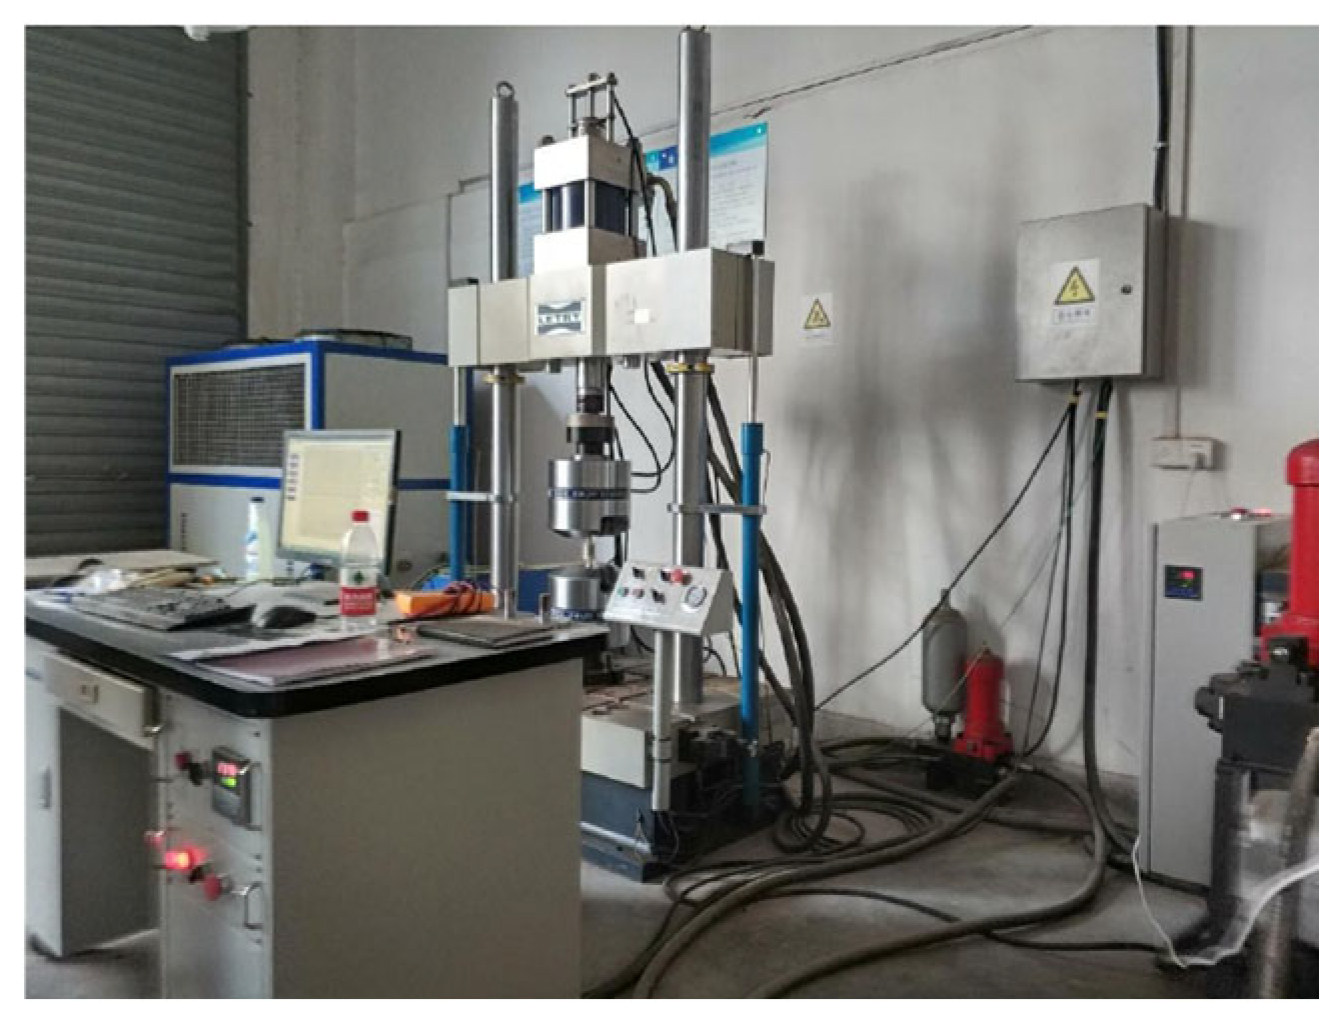
The sample material is P110 steel, and high cycle fatigue tests are conducted at room temperature using axial tension compression symmetric cyclic loading with a stress ratio of R = −1. The experimental equipment is shown in
Figure 4. The cyclic waveform is a triangular wave with a cyclic frequency of 10 Hz. The loading and unloading time of cyclic stress is 1/30 s. At this time, the stress amplitudes are 0.6σ
s, 0.8σ
s, and 0.95σ
s. In the experiment, the strain amplitude
εa and the number of cycles N are recorded. When the loading stress drops to 75% of the maximum stress, the specimen is considered unstable and the experiment ends. The number of cycles at this time is the fatigue life of the specimen.
The fatigue test is based on GBT 3075 “Axial Force Control Method for Fatigue Testing of Metallic Materials”, with a gauge length of 28 mm and a diameter of 5 mm. The size of the corrosion fatigue specimen material is shown in
Figure 5.
4.2. Life Characteristics of Wellbore Materials
When fitting the S-N curve of the sample in atmospheric environment, the Basquin empirical formula widely applicable in the field of high cycle fatigue can be selected [
32]:
where
N represents the number of cycles and
σs is the stress value, MPa;
The constants a and b can be obtained by fitting experimental data. Parameter b, to some extent, reflects the inherent characteristics of the material, while the value range of constant a is usually between −0.12 and −0.05. Specifically, there is an approximate mathematical correlation between a and the work hardening index
of the material’s cyclic stress–strain curve, i.e.,
. The work hardening index
of the metallic material discussed herein typically ranges from 0.1 to 0.2. A rapid-calculation model was developed based on experimental results, as illustrated in
Figure 6.
Under vibration load conditions, during the fatigue loading process, P110 tubing material exhibits a ratchet effect under different stress amplitudes. The ratcheting strain and its rate increase with rising mean stress [
33], as shown in
Figure 7, where the stress amplitude load remains constant and the displacement increases with the increase in fatigue cycles. This indicates that the stiffness and elastic modulus of the material decrease after fatigue damage.
4.3. Analysis of Material Softening Characteristics
When considering materials using residual strength calculation models, the following basic assumptions should be met: the yield strength of the material remains constant throughout its entire service life, while the elastic modulus changes. For most steels, their fatigue process belongs to the softening process, that is, as the number of fatigue load cycles increases, the elastic modulus of the material shows a decreasing trend.
For the analysis of fatigue life of tubing strings under vibration conditions, the first step is to determine the load of the tubing string under static load conditions and the dynamic load of the tubing string under vibration conditions, and obtain the load spectrum characteristics under vibration conditions. By calculating the average fatigue stress and stress amplitude through its load spectrum characteristics, the key parameters for fatigue analysis are obtained. Then, based on the Miner linear damage accumulation model, the cumulative fatigue damage at different well depths is analyzed. According to the damage amount and residual strength model, the residual yield strength of the tubing material after fatigue damage is analyzed to obtain the key parameters for safety factor verification. The service life is obtained by verifying the safety factor that changes over time.
Assuming the loading stress amplitude is
σ, under high cycle fatigue constant stress loading conditions, the strain
ε and fatigue cycle
N satisfy the following relationship (softening model):
where
ε0 is the strain amplitude correction coefficient,
σf is the stress correlation coefficient, and b is the stress correlation index.
In Equation (10), the formula for calculating the elastic modulus after obtaining high cycle fatigue damage is derived as follows:
where
σs is the yield strength/MPa,
εs is the yield elastic limit, and
N is the total fatigue loading cycle.
The remaining yield strength is:
For the 110 ksi casing material, the elastic modulus is 206 GPa and the yield strength is 850 MPa. The softening model of the material is:
The softening model parameters are as follows: ε0 is 0.02974, σf is 8.70816 × 10⁻⁴, and b is 0.12442.
Based on the softening data of P110 tubing, a softening characteristic model is established, as shown in
Figure 8. The stress value shows a gradual decrease with the increase in fatigue cycles. After high cycle fatigue, the material softens more severely, the cumulative amount of fatigue damage increases, and the stress value decreases significantly compared to the initial stress value of the material.
5. Fatigue Hotspots and Life Analysis of the Entire Wellbore
Based on the theoretical calculation analysis and experimental analysis in the previous text, a method for analyzing the fatigue hotspots and life of the entire wellbore under different working conditions of the production string is established, and an analysis is conducted on a certain well under actual working conditions. This section explains the analysis process through the specific situation of a certain well.
5.1. Calculation Results of Dynamic Load Under Random Vibration
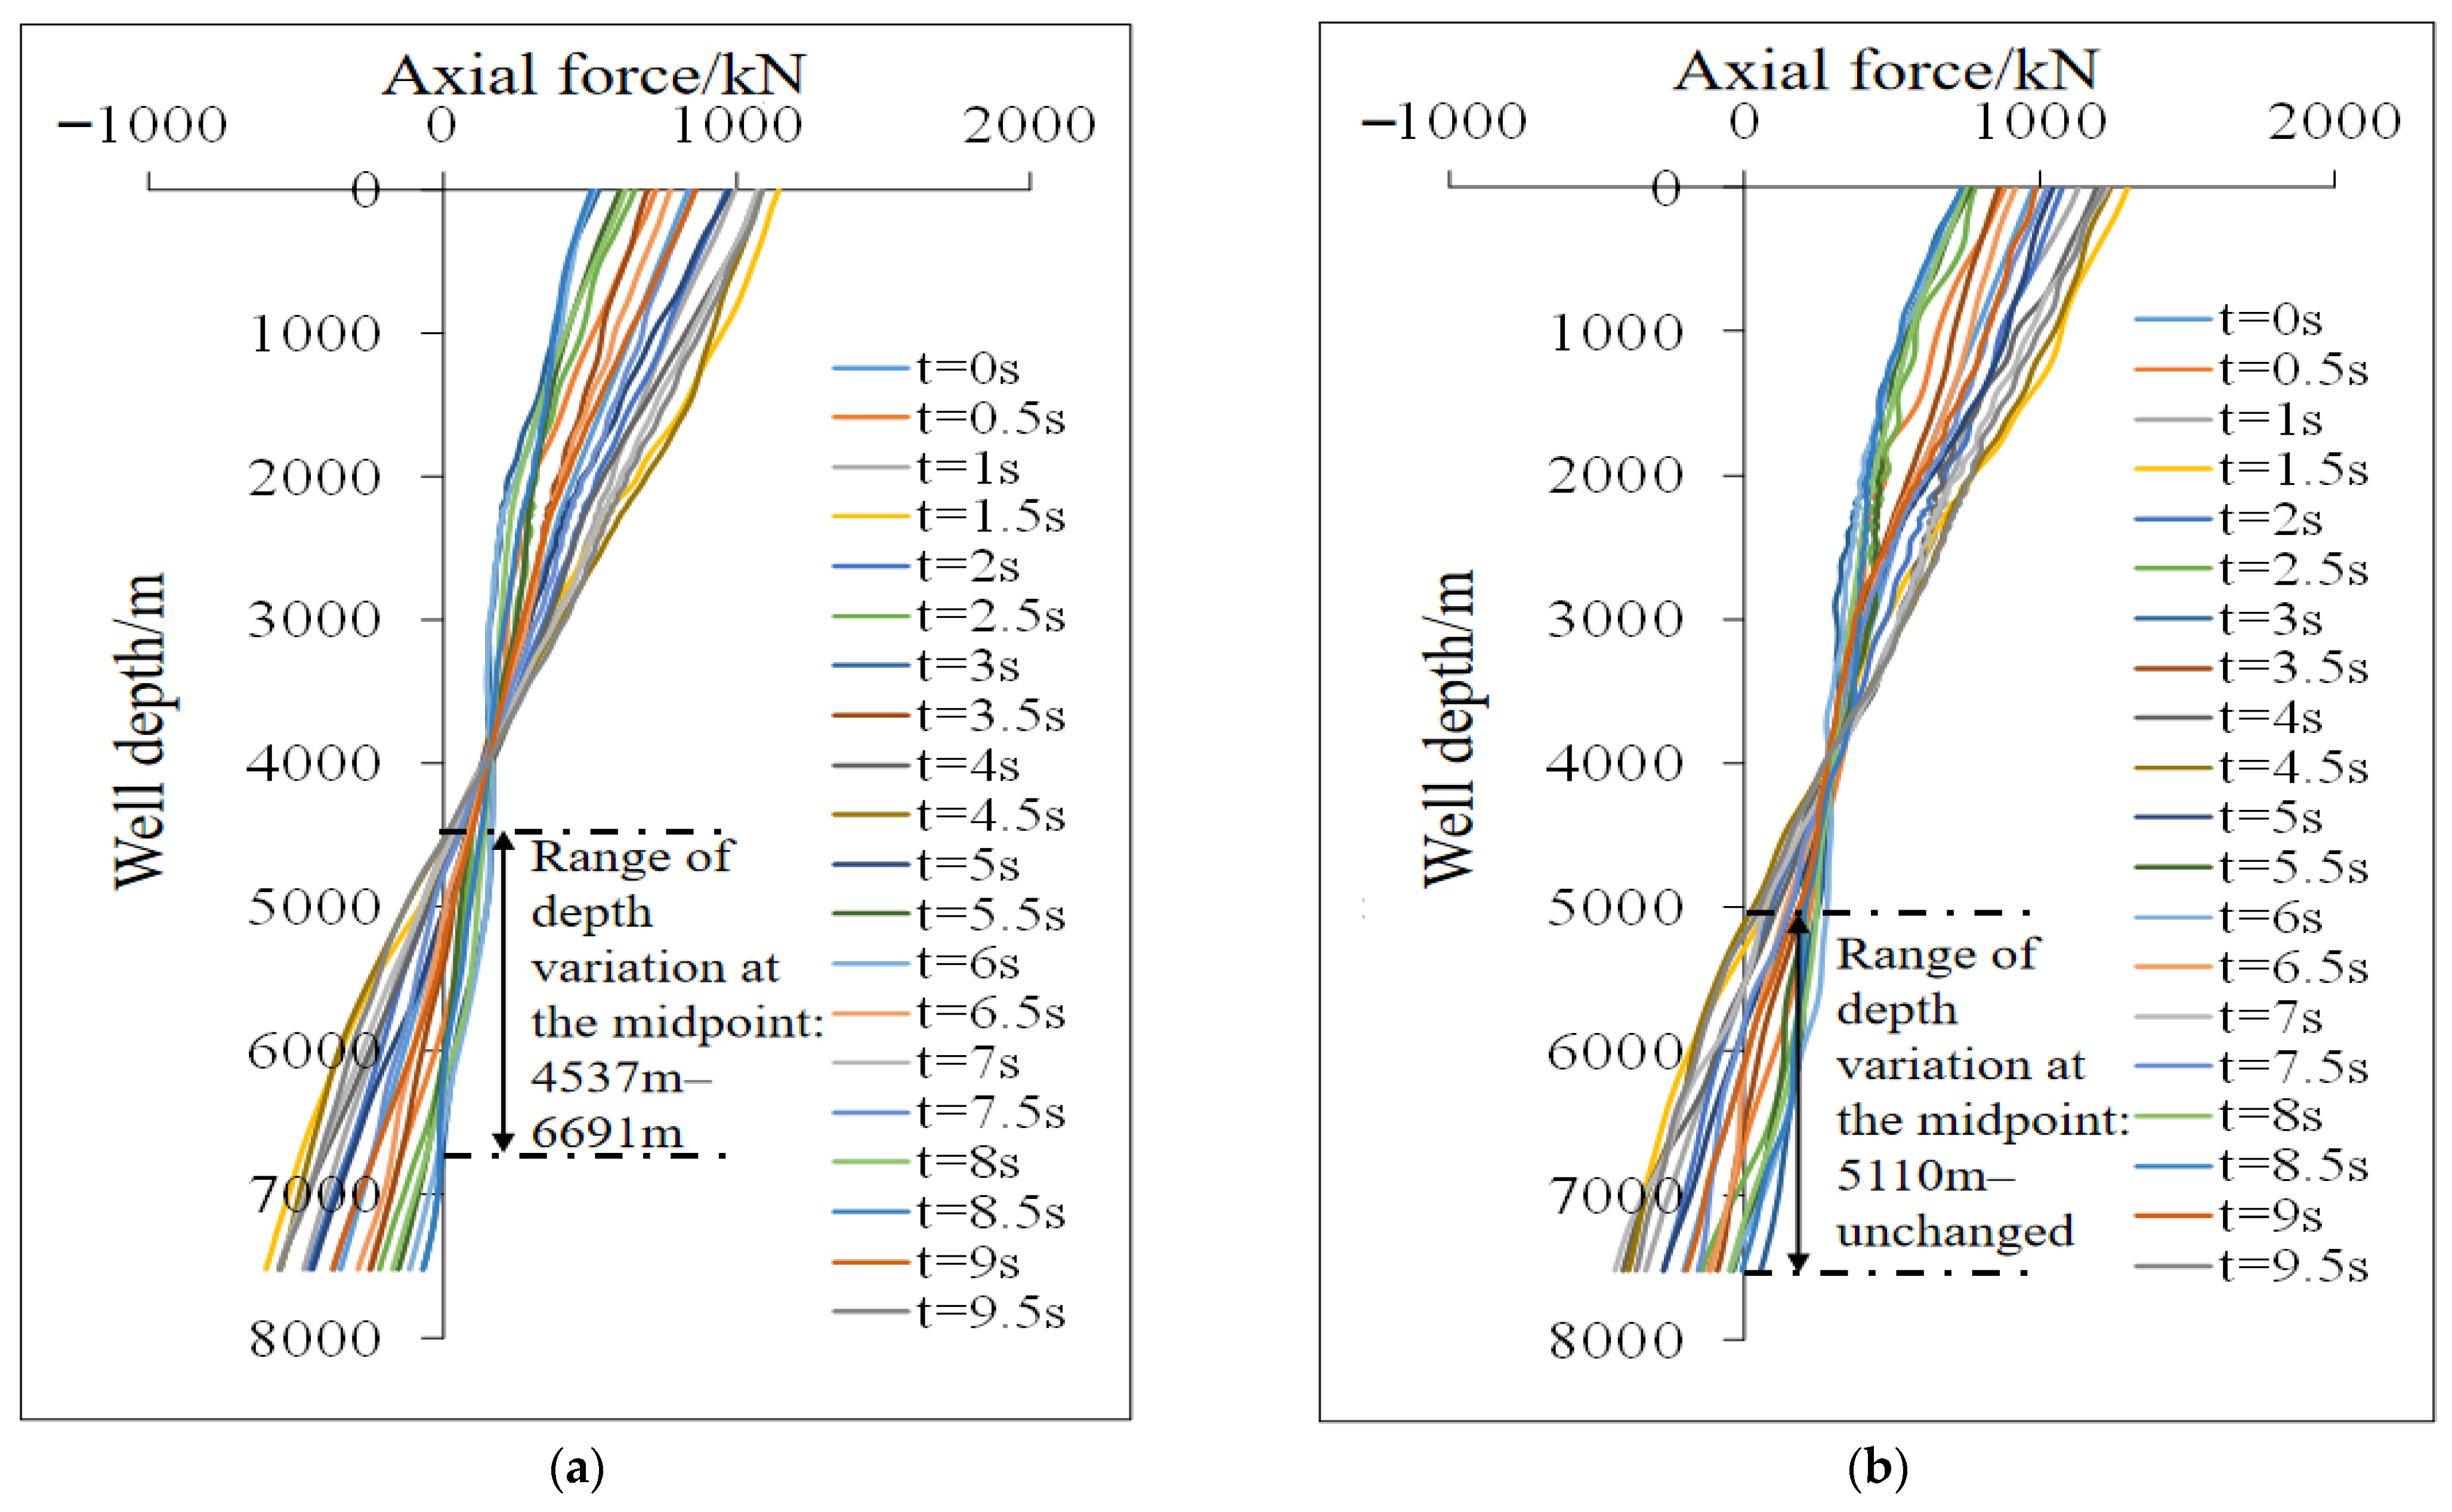
The position of the packer in this well is 7523 m. The axial force analysis and calculation results of the tubing string structure under the impact load of fluid in high- and low-production conditions are shown in
Figure 9. The vibration of the tubing string causes a change in the axial force distribution of the tubing string, and the position of the neutralization point also changes. Under high-production conditions, the depth of the neutralization point varies from 4537 m to 6691 m, while under low-production conditions, the depth of the neutralization point ranges from 5110 m to the bottom of the well.
The relationship between Mises stress and the safety factor of the tubing string under fluid impact load in a certain well is shown in
Figure 10. The minimum safety factor and corresponding well depth positions for high-production and low-production conditions are 1.60/wellhead and 1.45/wellhead, respectively.
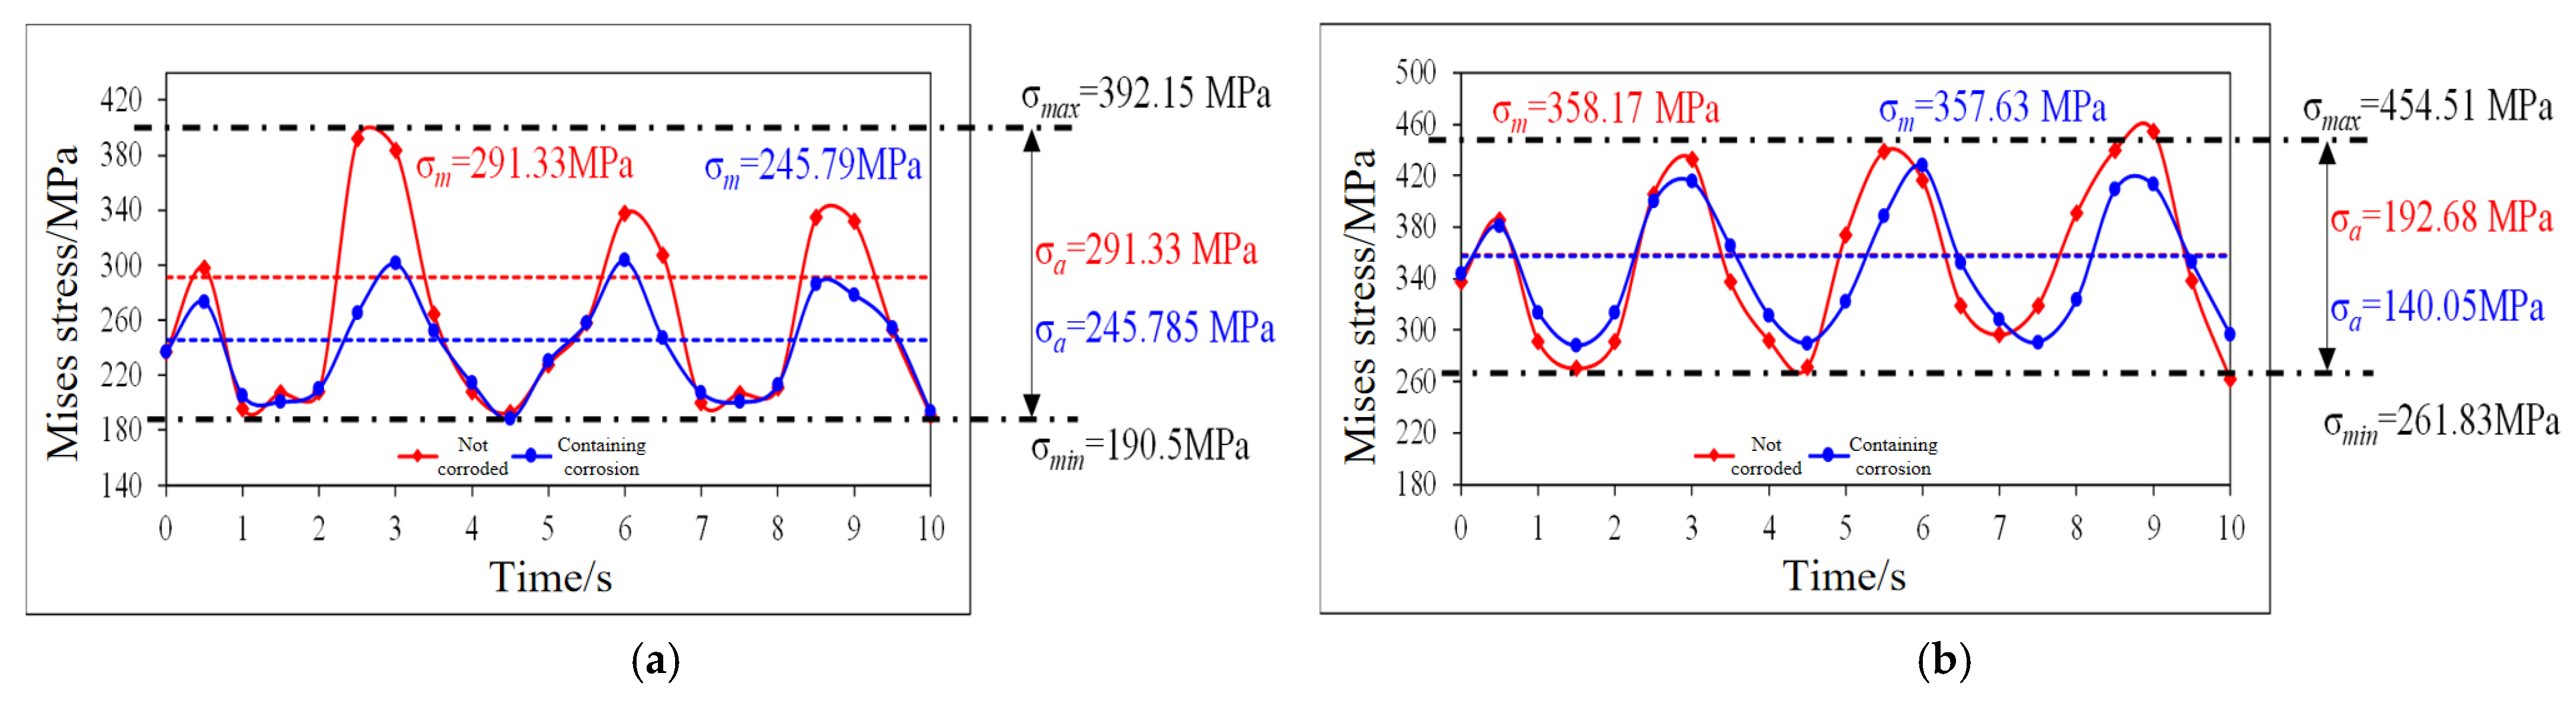
The tubing string is subjected to alternating stress at the midpoint, where the stress amplitude is maximum. The stress amplitude changes near the midpoint of the tubing string are calculated under different operating conditions, as shown in
Figure 11.
An analysis was conducted on the stress amplitude changes of non-corroded and corroded production tubing string in a certain well under different operating conditions near the neutral point. Near the neutralization point, uncorroded material surfaces are generally smoother and defect-free, providing a larger effective load-bearing area that promotes more uniform local stress distribution. However, under identical external loads, the intact material integrity enables superior elastic deformation capacity, resulting in higher macroscopic stress levels. Following corrosion, the material surface develops localized defects such as pitting and cracking, reducing the actual load-bearing area. While stress concentration may occur at these defect sites, the average von Mises stress of the overall structure decreases proportionally with the diminished effective cross-sectional area. Therefore, the Mises stress in the uncorroded region is higher.
It can be seen that the tubing string is subjected to alternating stress near the neutral point, and the amplitude of alternating stress is the highest near the neutral point. This provides the load spectrum and basis for fatigue strength analysis and fatigue hotspots of tubing strings.
5.2. Analysis of Fatigue Hotspots and Service Life of the Entire Wellbore Under Different Operating Conditions of the Production String
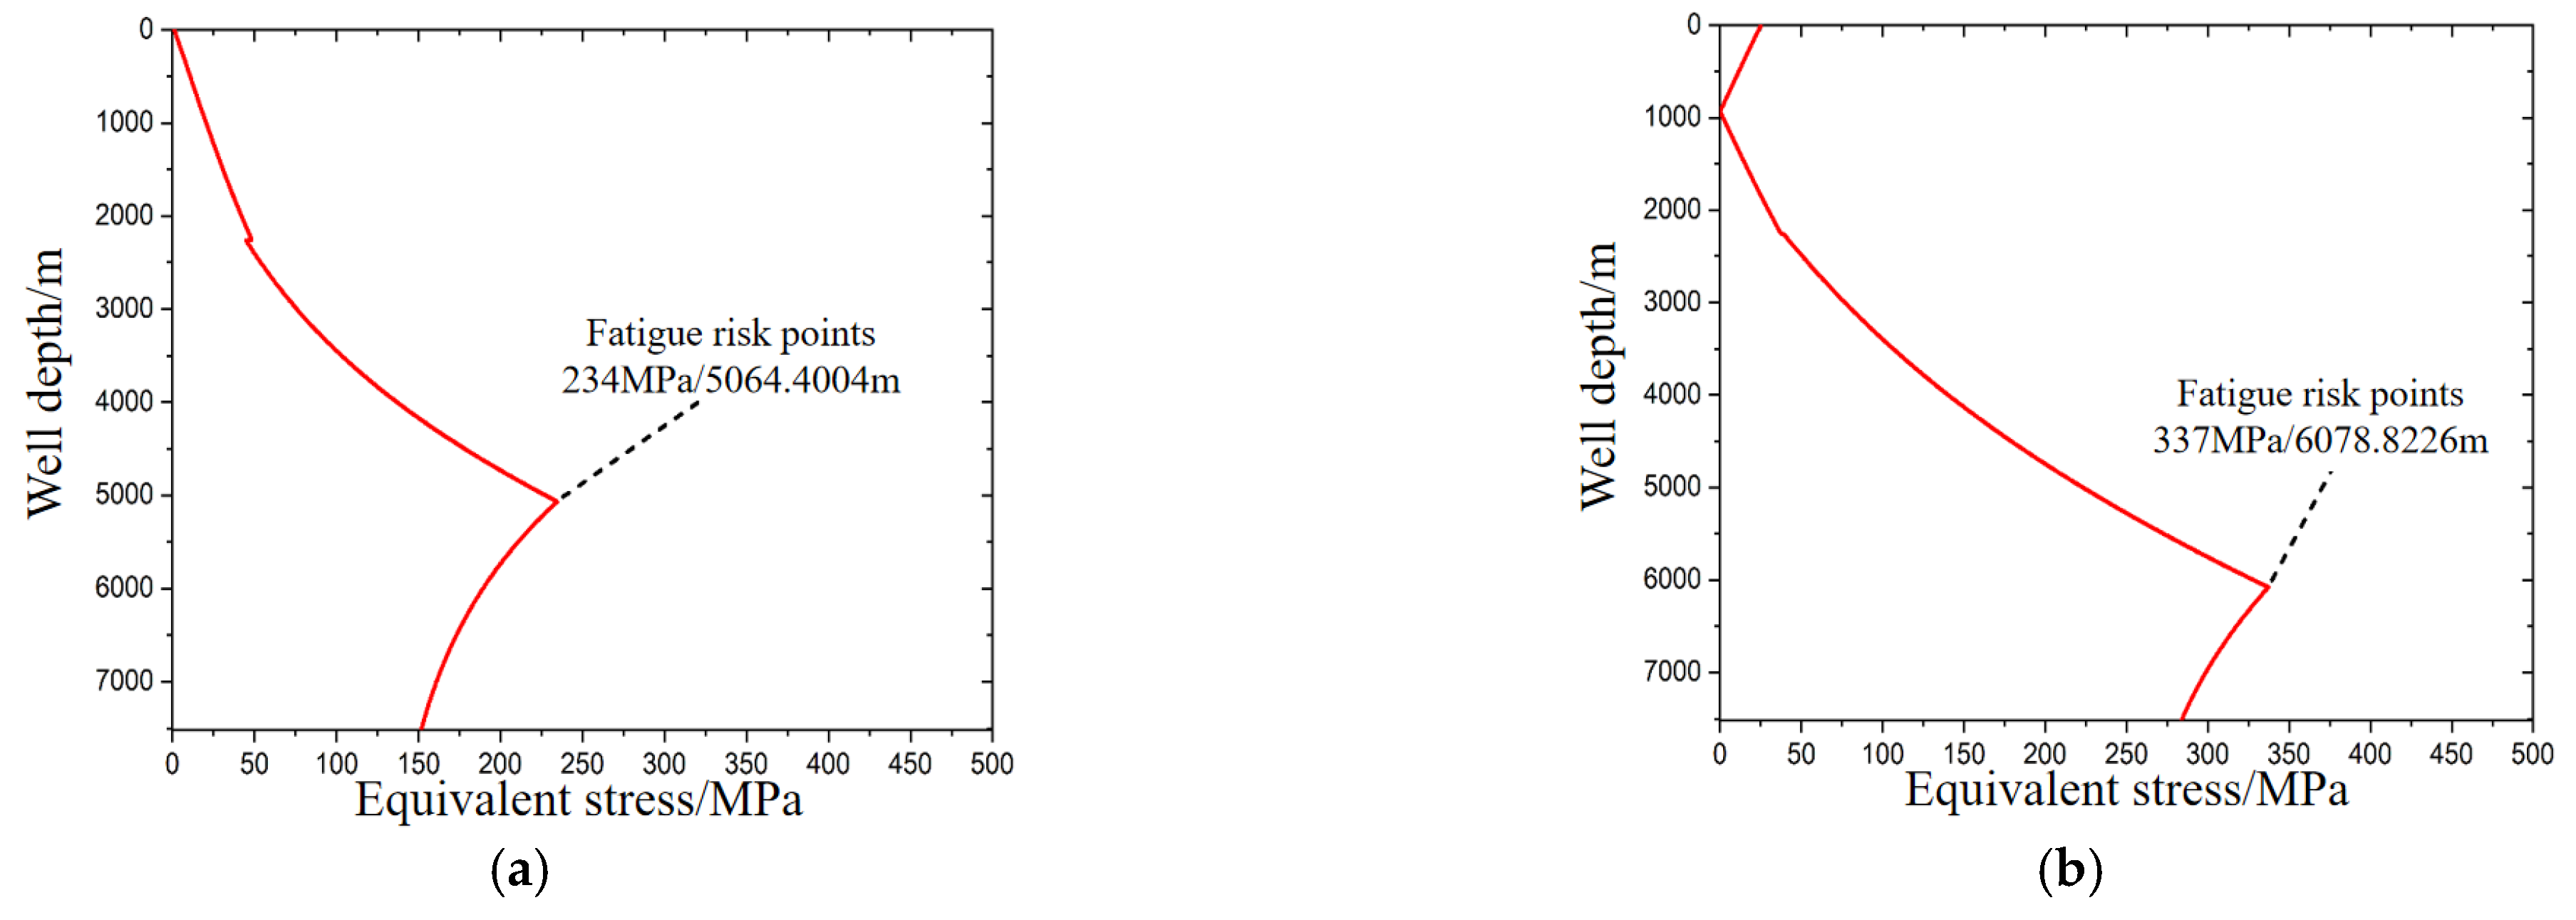
Based on the results of the dynamic load calculation and the uniaxial mechanical behavior of crack propagation [
23], the average fatigue stress and stress amplitude of the tubing string along the well depth were obtained under high-production conditions, and then converted into equivalent stress. The maximum value of the calculated equivalent stress was 234 MPa at a well depth of 5064 m. As shown in
Figure 12, under low-production conditions, the average fatigue stress and stress amplitude of the tubing string were obtained along the well depth, and then converted into equivalent stress. The maximum value of the calculated equivalent stress was 337 MPa at a well depth of 6078 m.
Considering the surface damage of the tubing string caused by corrosion/erosion, when the tubing string is subjected to vibration loads, stress concentration forms at the location of the damage defect, exacerbating the fatigue damage of the material. Therefore, based on the equivalent stress, a stress concentration factor of 2 is taken to analyze the fatigue life of the entire wellbore after stress concentration, as shown in
Figure 13. The red line represents the critical number of days for fatigue life occurring at a certain depth of the well.
Based on vibration analysis results, the minimum fatigue life of the full-string tubing under high-production conditions is 2.38 × 10⁶ cycles. With 1546 daily vibration cycles under high-production mode, the calculated minimum service life reaches 1166 days. For low-production conditions, the minimum fatigue life of the full-string tubing is 1.53 × 10⁵ cycles. Given 318 daily vibration cycles under low-production mode, the derived minimum service life is 481 days.
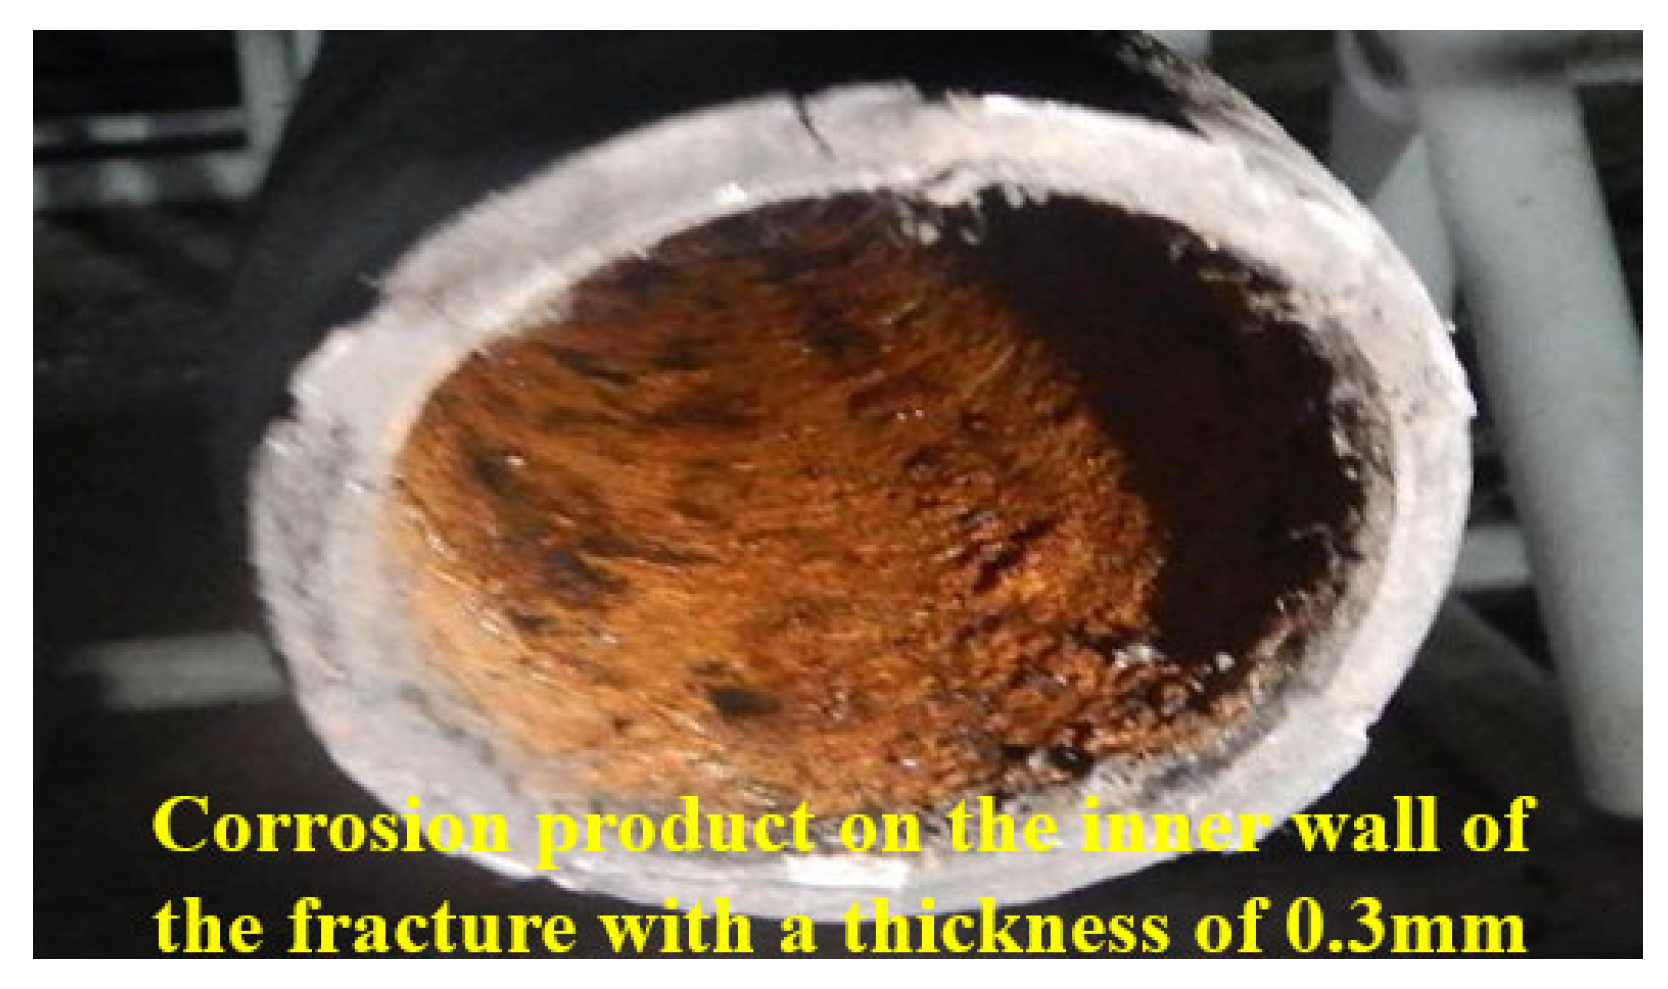
Based on the fracture location of the production string in a well (at the 5th and 236th), it is determined that the fracture location is in the area with a lifespan exceeding 10 years. In theory, the vibration fatigue of the string caused by high-production and low-production conditions will not lead to the fracture of the string at this location. Therefore, fatigue is not the main cause of string fracture.
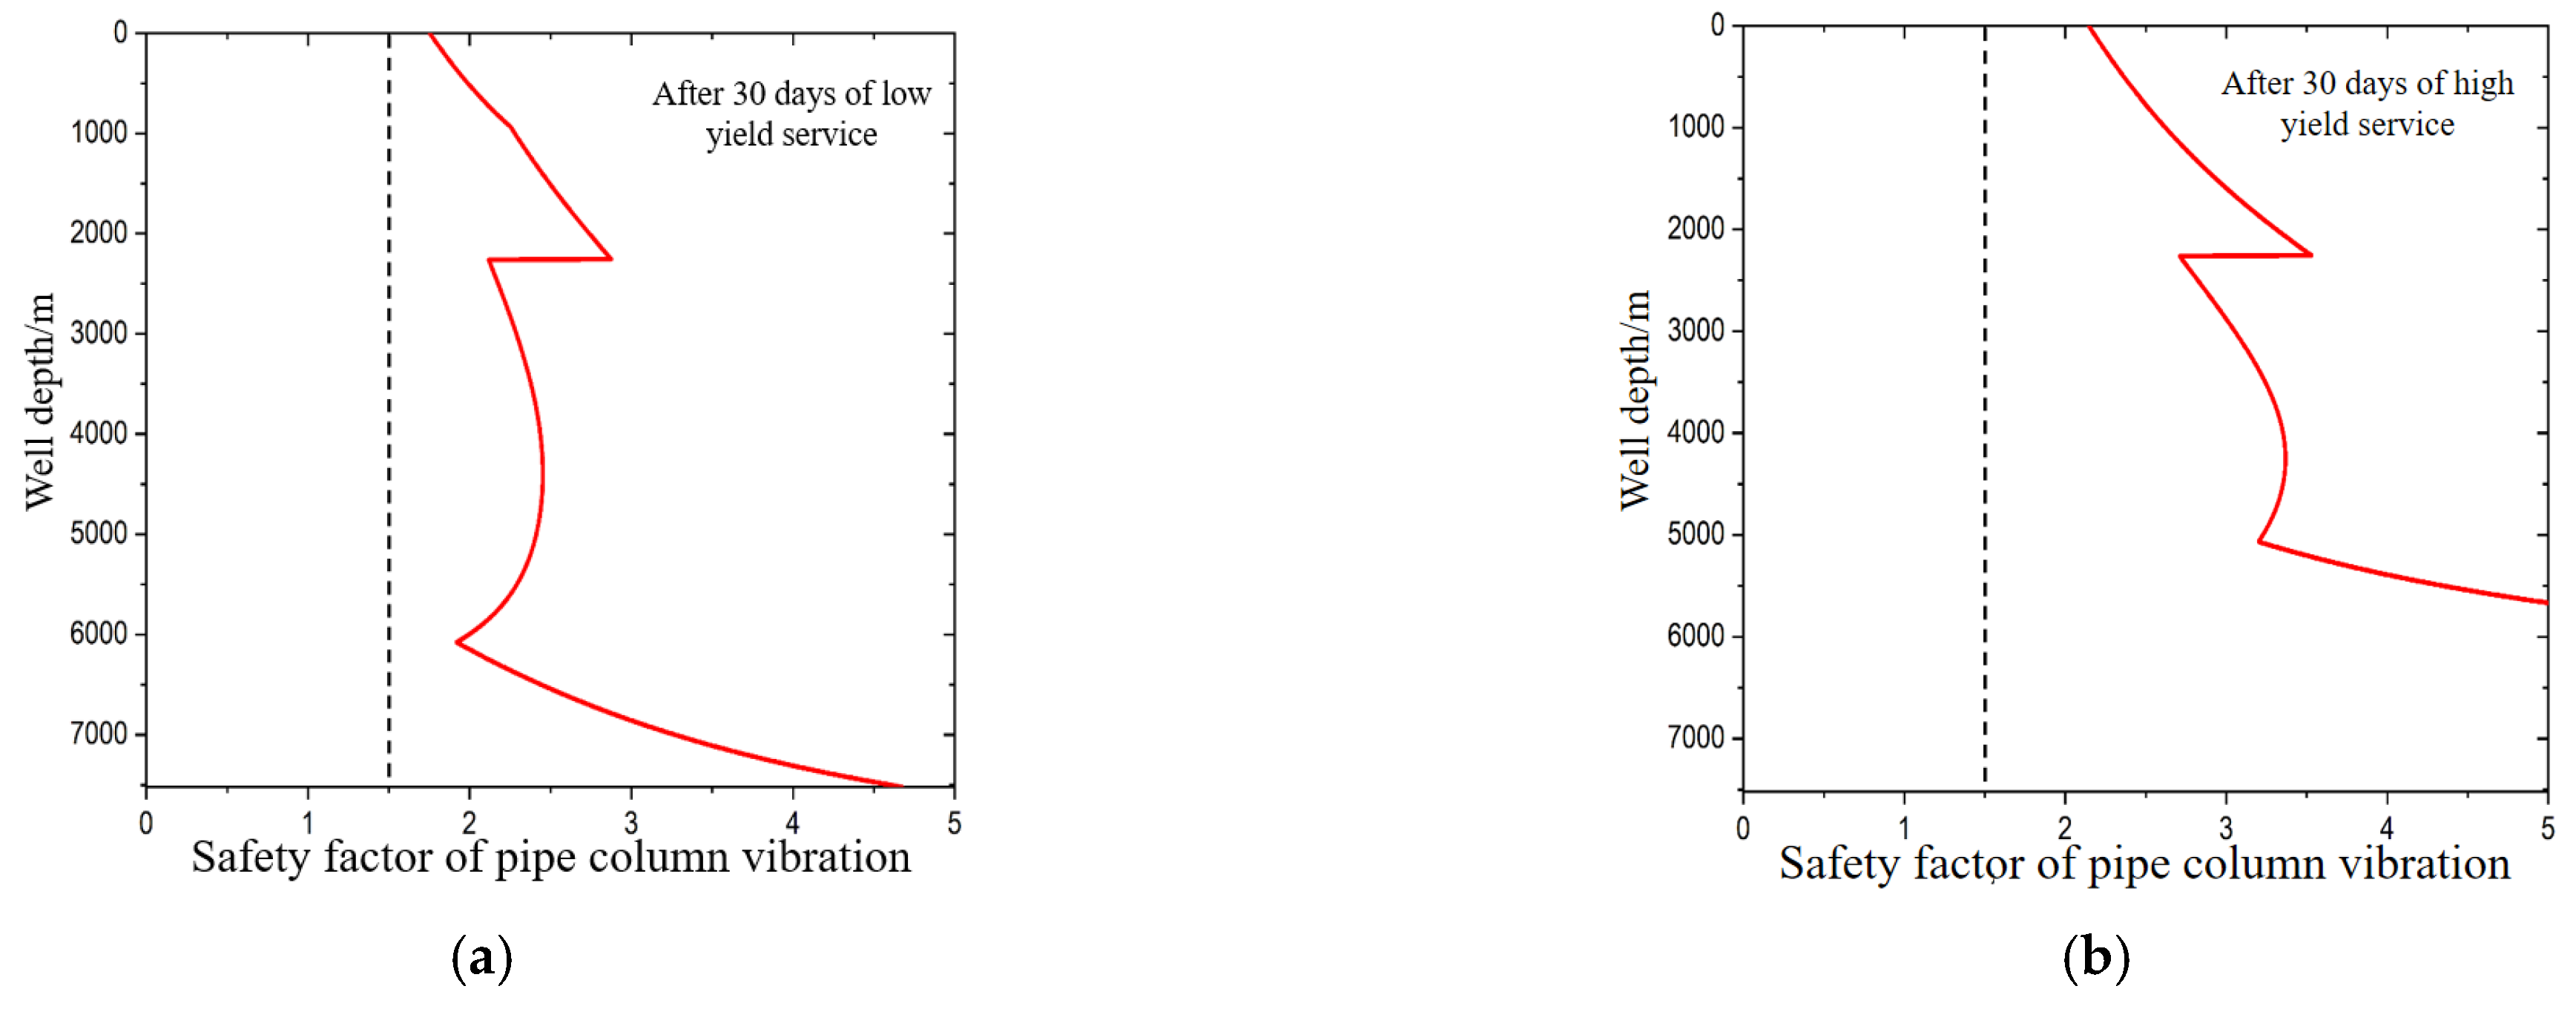
The fatigue load caused a decrease in the performance of the tubing string material. After continuous service for 30 days under high production and low production, the entire wellbore section experienced a softening effect, and the yield strength began to decrease below 4349 m and 4324 m well depths, respectively. After the tubing string softened, the safety factor of the entire wellbore section decreased. Under the vibration condition of the tubing string, the safety factor analysis results of the entire wellbore are shown in
Figure 14. The minimum safety factor at the wellhead under high-production conditions is 2.15, and the minimum safety factor at the wellhead under low-production conditions is 1.75.
5.3. Fatigue Analysis of Production Tubing String Throughout the Entire Production Cycle
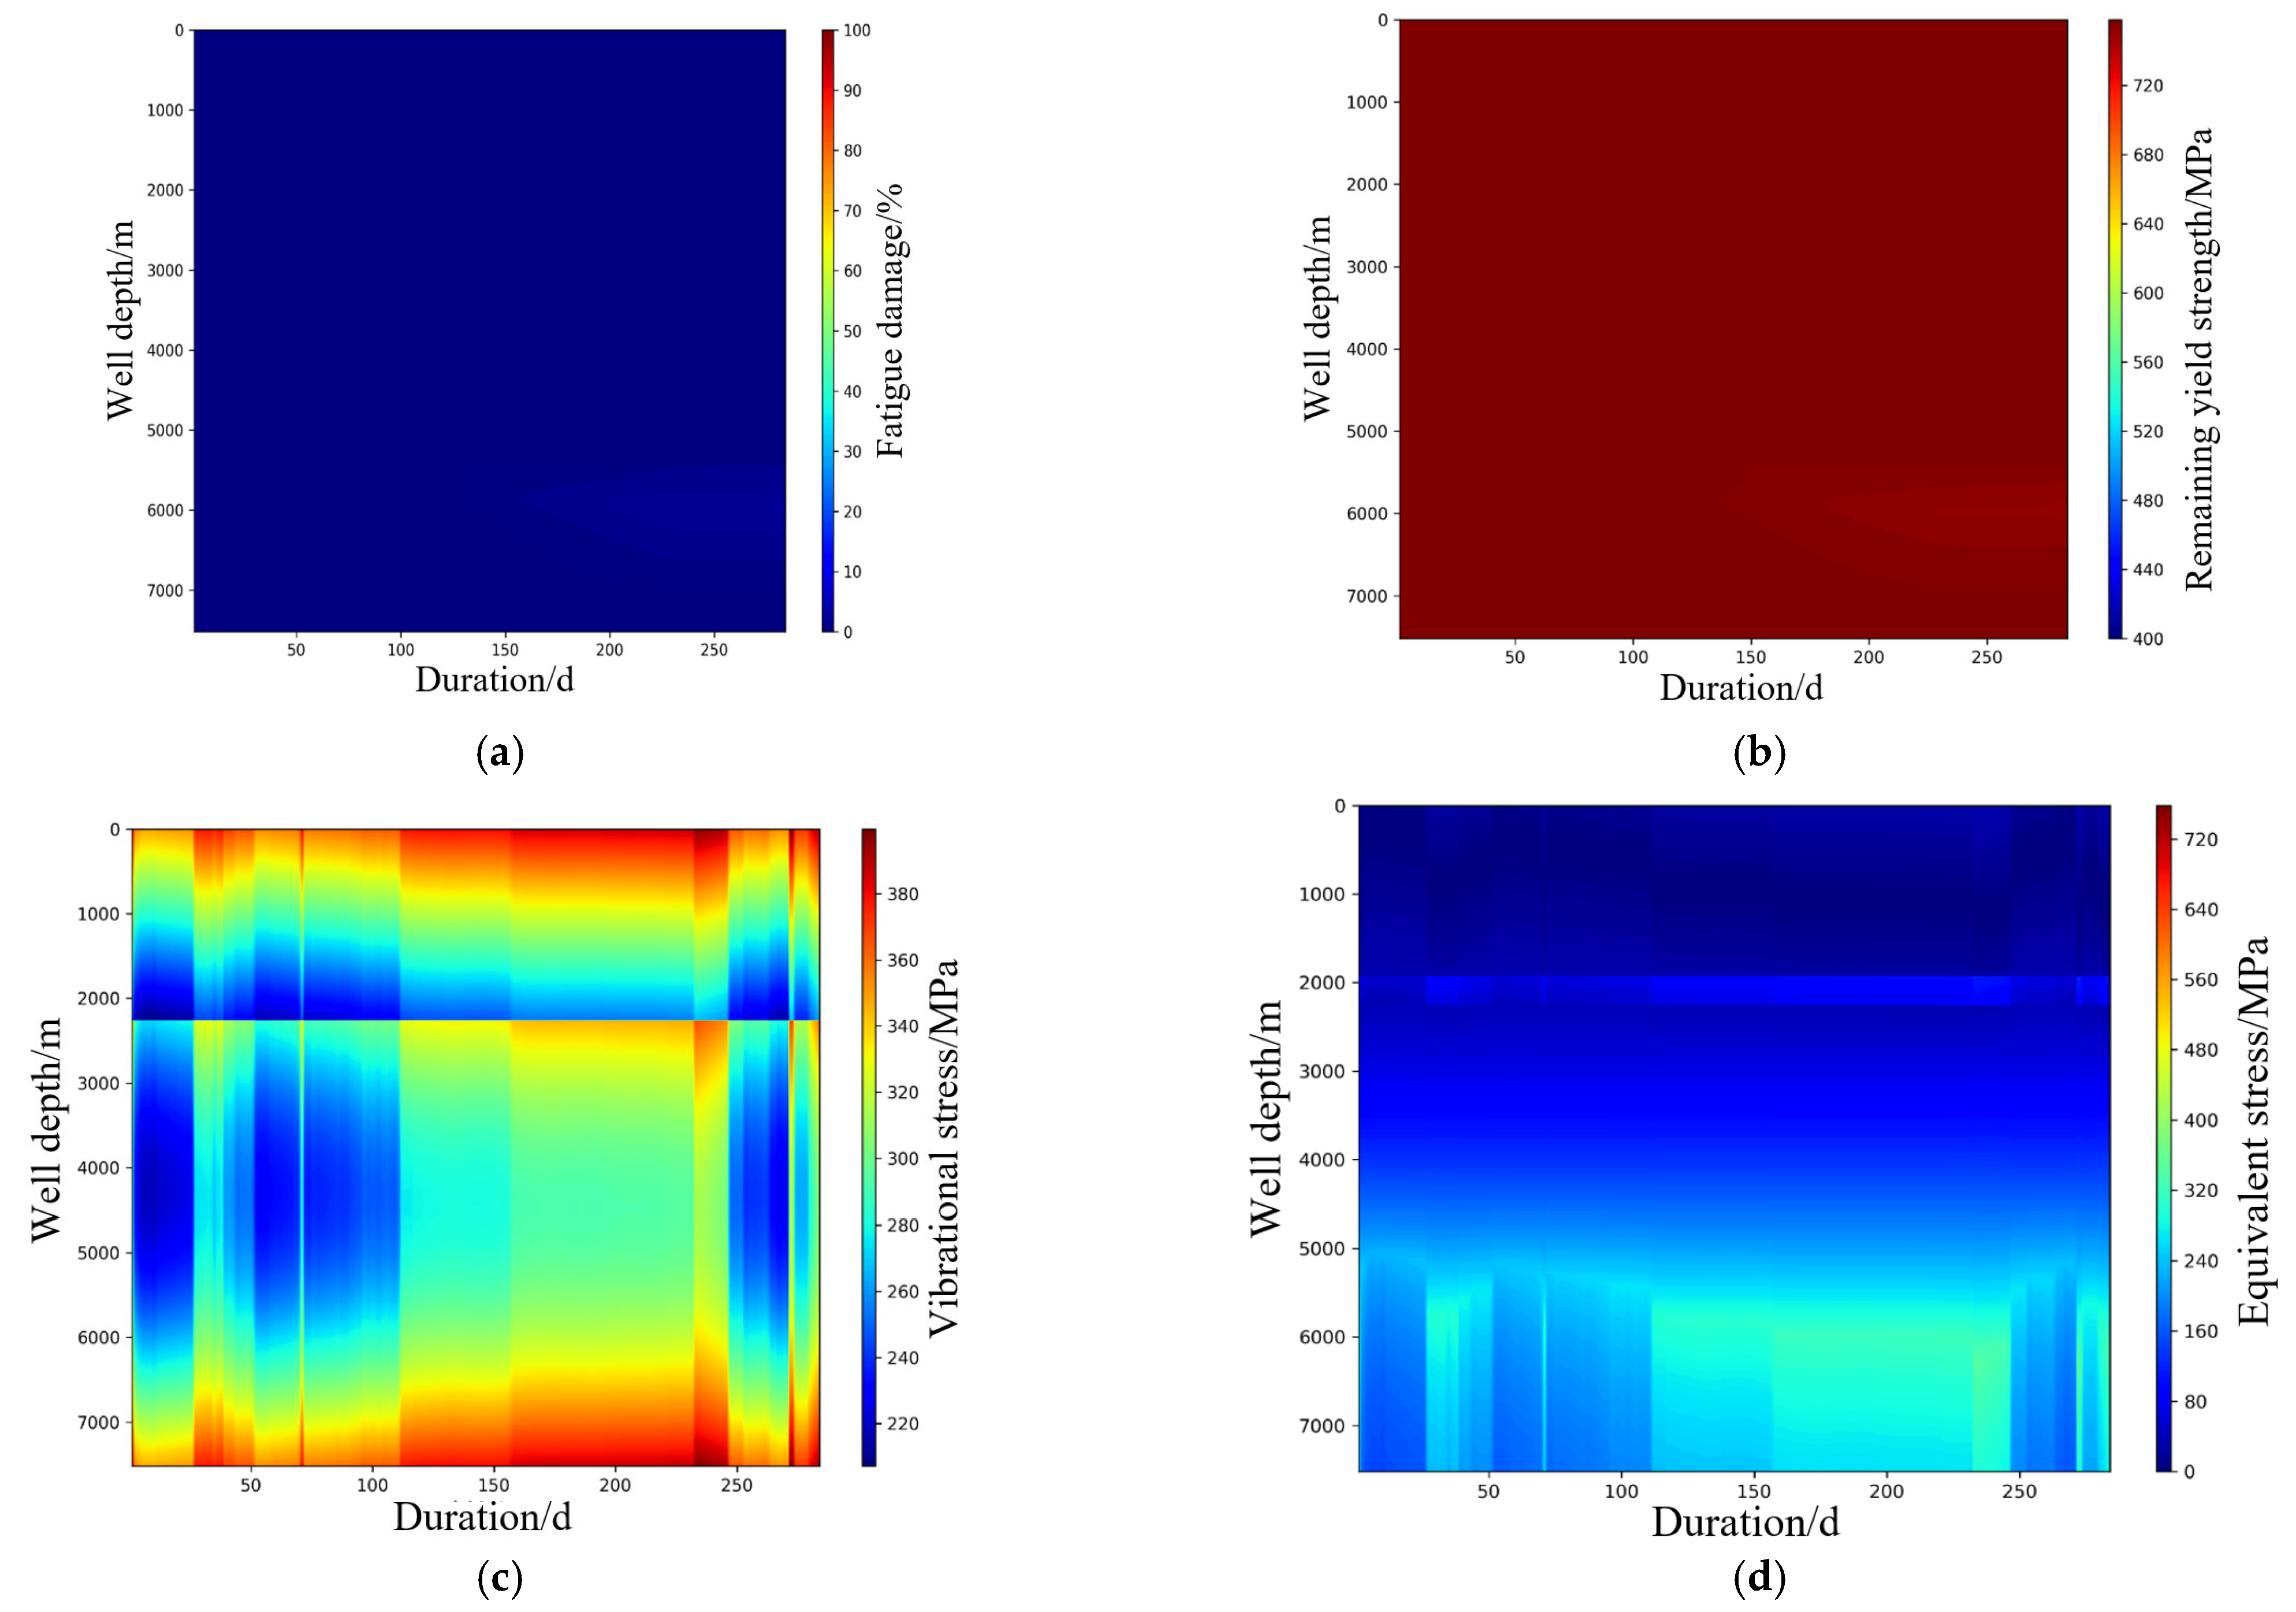
The total production cycle of a certain well is 284 days. Based on the production log, the dynamic load status of the entire well string was analyzed daily, and the stress concentration factor was taken as 1.5. According to the analysis process of the entire production cycle, the fatigue damage accumulation process analysis of the entire production cycle was completed. The obtained results are shown in
Figure 15, where the horizontal axis represents the production days, the vertical axis represents the well depth, and the cloud axis represents the corresponding data results. For the cumulative fatigue damage, the change is generally within 3%. When the production time exceeds 150 days and the depth is at 6000 m, the fatigue damage slightly intensifies, but does not exceed 5%, and there is no significant local damage. The material has good fatigue resistance, and the residual yield strength of the tubing string material is the lowest at 751 MPa (initial yield strength 758 MPa) throughout the entire life cycle of the wellbore. The softening of the tubing string material can be ignored.
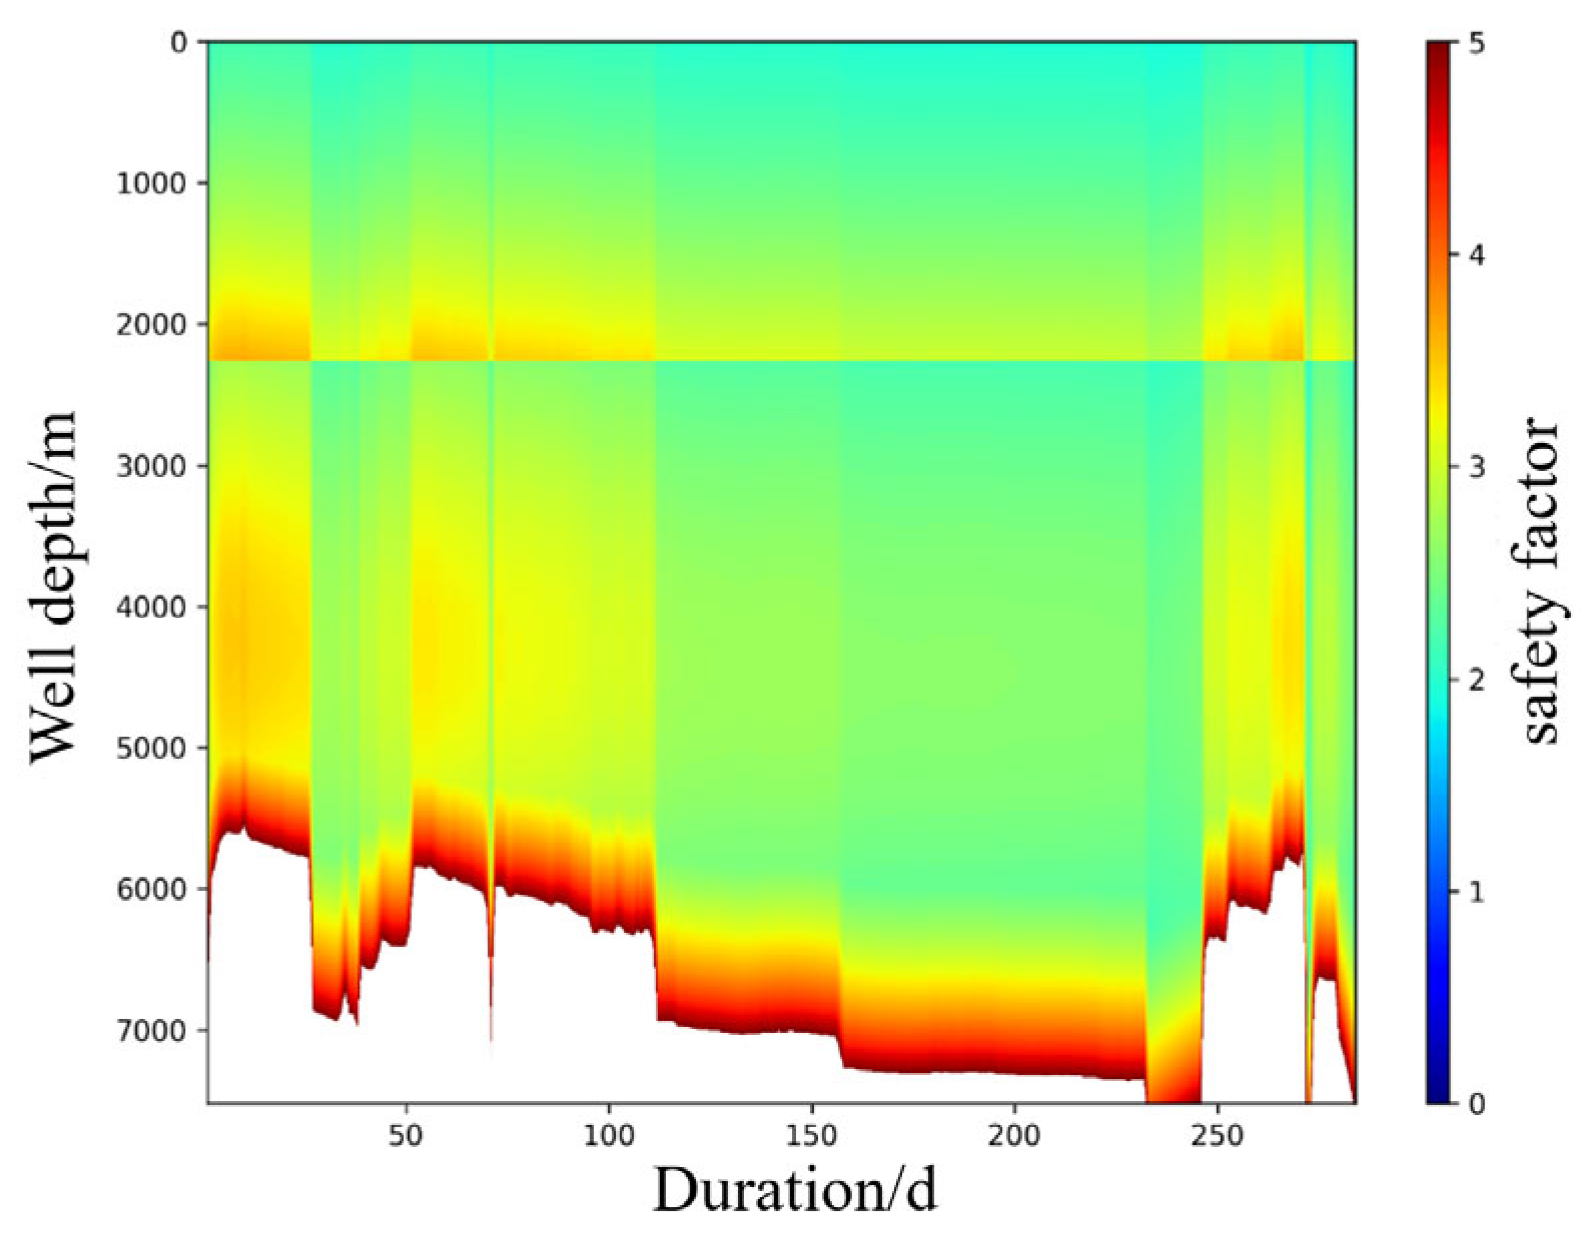
The minimum safety factor for the wellhead position is 1.9, which meets the strength requirements under working conditions. However, the full life cycle analysis data show that its safety factor exhibits severe fluctuations, as shown in
Figure 16. This non-steady-state fluctuation amplitude exceeds the expected design value. Dynamic load analysis shows that the high-frequency impact load borne by the tubing string accelerates the accumulated plastic strain rate of the material, forming a stress fragile zone. These microcracks gradually coalesce to form surface cracks, which then propagate continuously until the remaining cross-section can no longer withstand the cyclic loading, ultimately leading to fatigue failure [
34]. The high-frequency impact load is the main factor in the fracture.
6. Conclusions
A fluid solid coupling four-equation model was established to address the problem of flow-induced vibration in production strings, and the influence of fluid tubing string interaction on water hammer wave characteristics in high-pressure and high-production gas wells was analyzed. The ratchet effect of P110 tubing material under different stress amplitudes was revealed through fatigue testing and softening characteristic analysis. The analysis of full wellbore fatigue cases shows that under high-production and low-production conditions, the fatigue hotspot of the tubing string is located near the midpoint, and the fatigue life is significantly affected by stress concentration.
(1) Based on the continuous flow and Navier–Stokes equations of motion, four fluid structure coupling equations are established for production string operations.
(2) By conducting fatigue characteristic experiments on the specimens, the softening characteristics under different stress amplitudes were obtained, providing a basis for the analysis of fatigue life of the entire wellbore.
(3) In the case analysis of a well in the west, it was found that the safety factor of the well fluctuated greatly throughout its entire life cycle, proving that the main factor causing the fracture of the well was the impact load.
(4) Fatigue tests were conducted only on P110 material without comparative analysis of softening characteristics for other common tubular grades (e.g., S135, Q125). Future work should include fatigue testing of different steel-grade pipes to establish a more comprehensive softening characteristics database.
(5) The case analysis was based on a single well example, and geological conditions in different blocks may lead to variations in safety factor fluctuation patterns. Future studies should incorporate well cases with different production parameters to develop a statistical prediction model for safety factor fluctuations.


