

A Study of the Kinetics, Structure, and Morphology of the Effect of Organic Additives on Barium Sulfate Precipitation Reactions in Propan-1-ol–Water and Ethanol–Water Mixture Solutions

 , , and
Abstract
1. Introduction
2. Experimental Section
2.1. Experimental Unit
2.2. Chemical Reagents
2.3. Experimental Procedure
2.4. Theoretical Background
2.5. Analysis Techniques
3. Results and Discussions
3.1. Solution Study
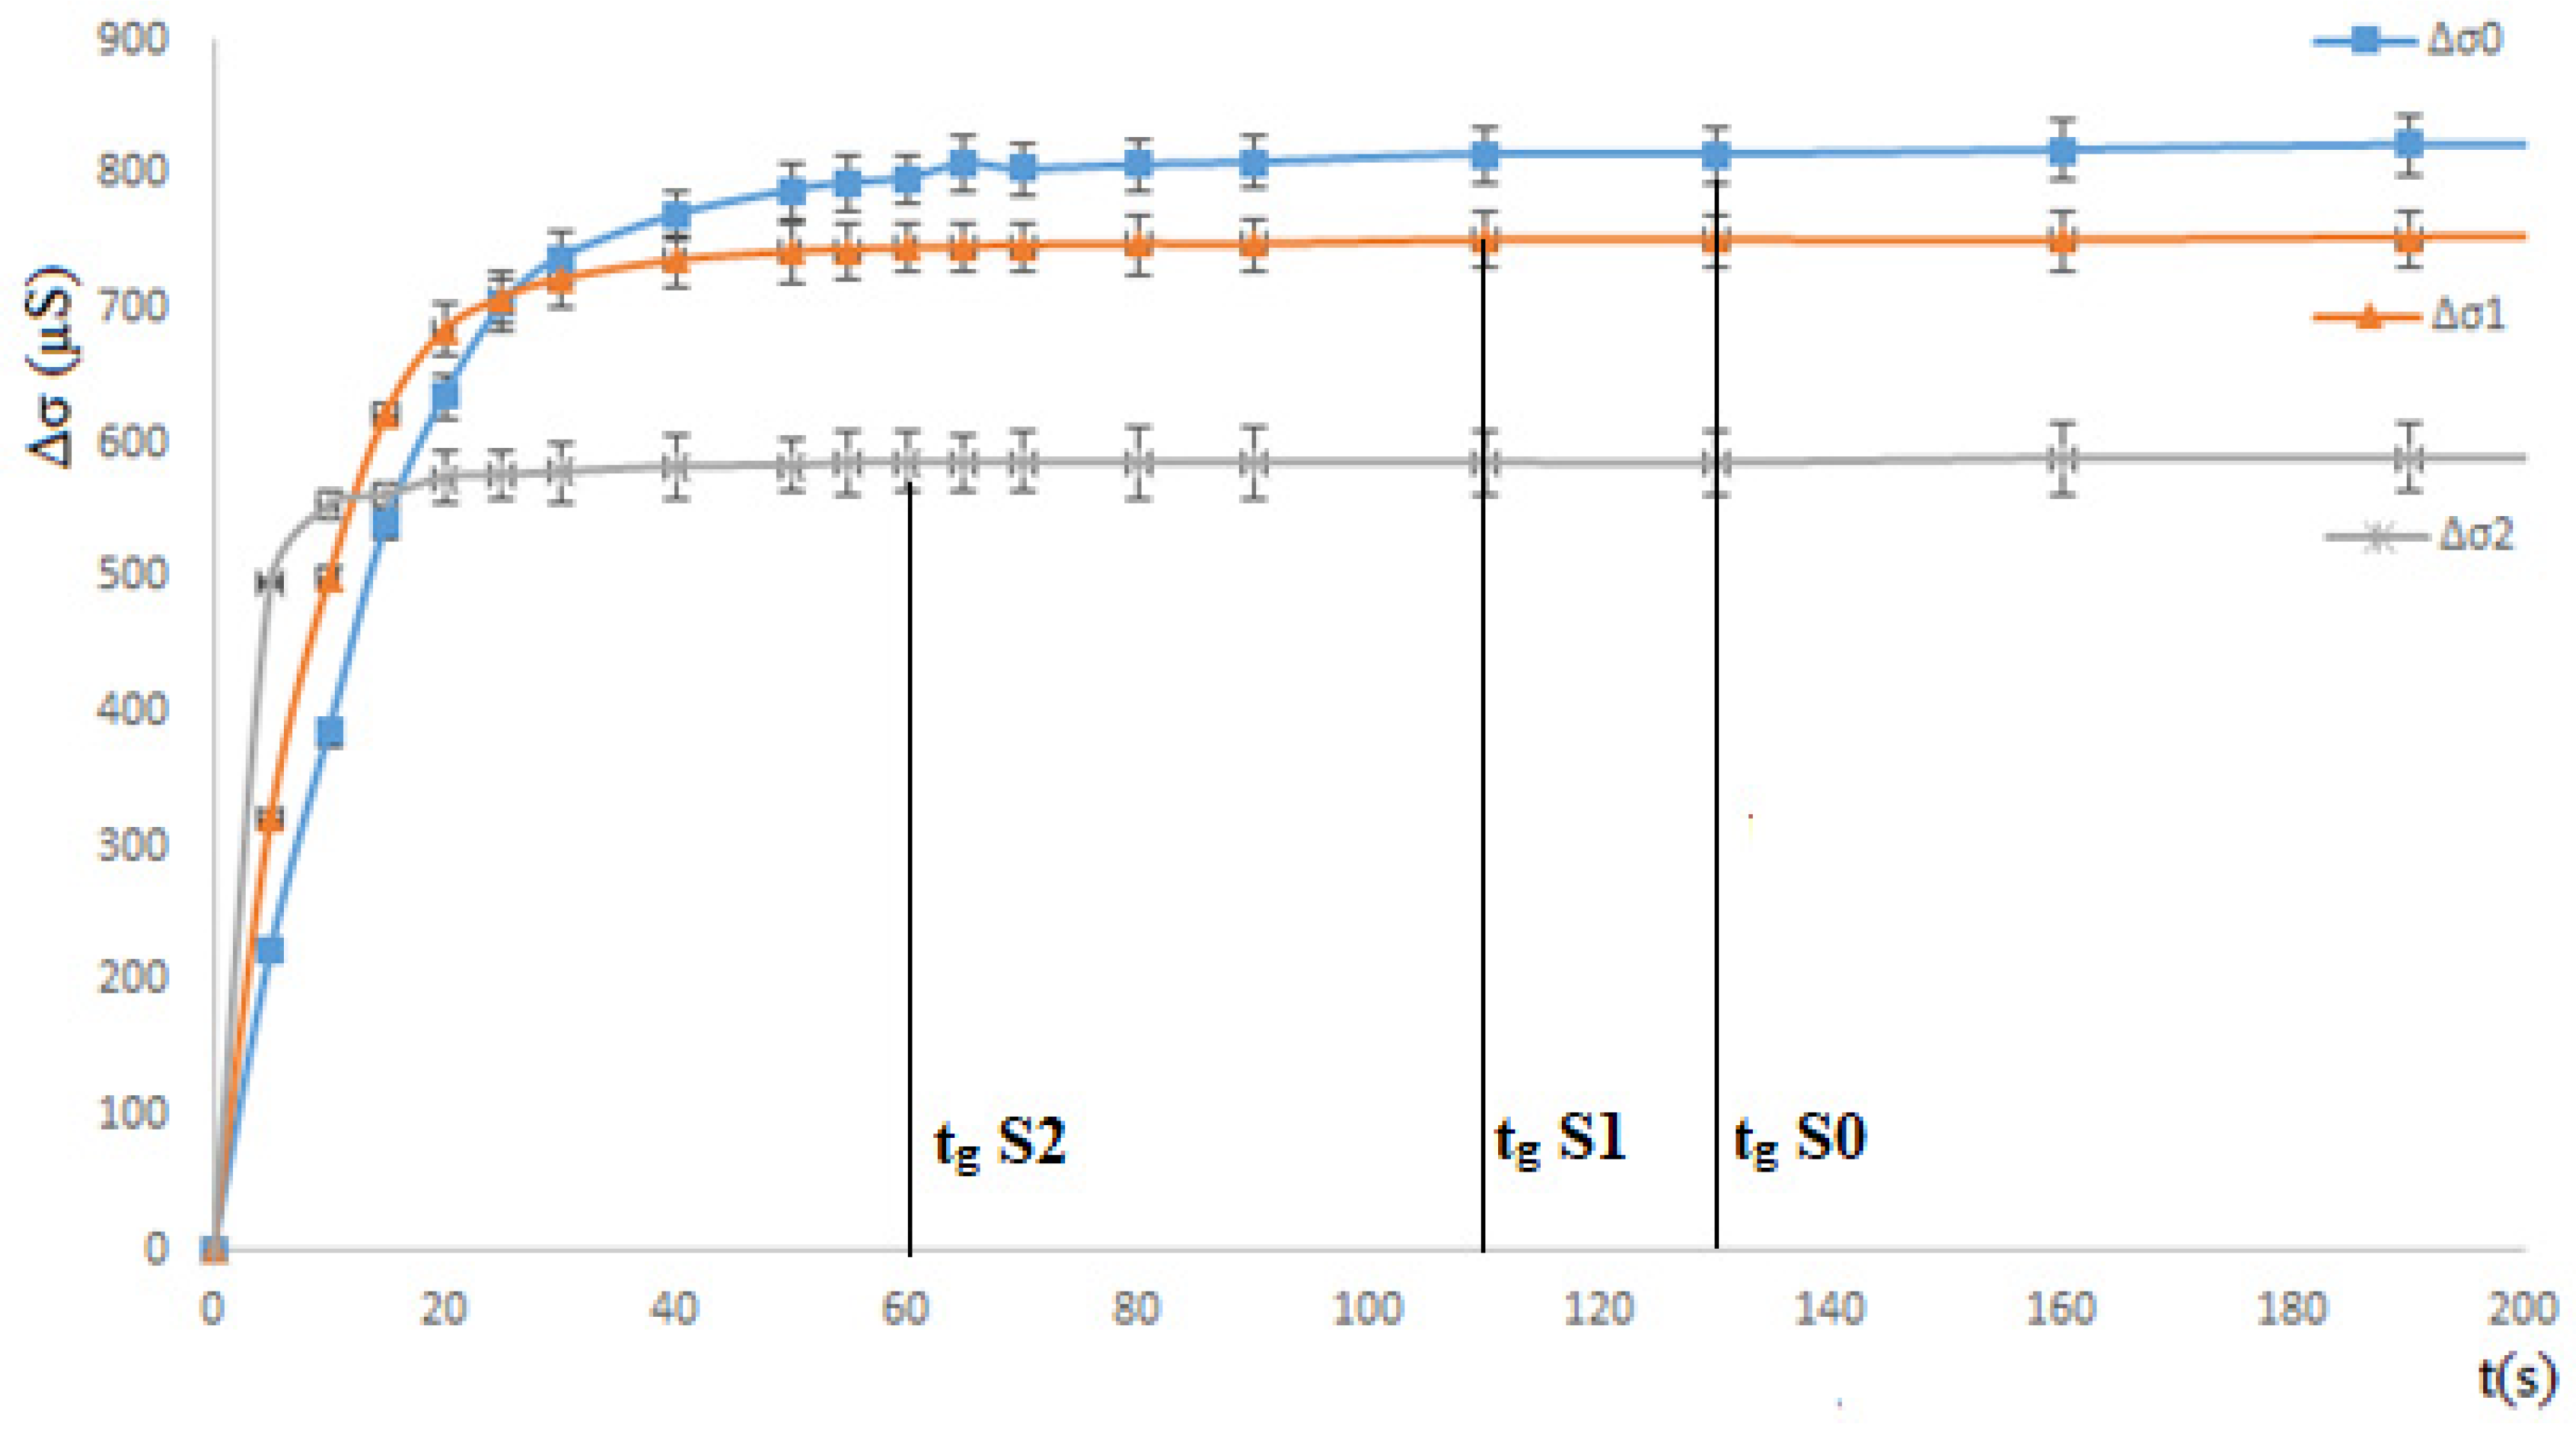
3.1.1. Ethanol Effect: Total Miscibility
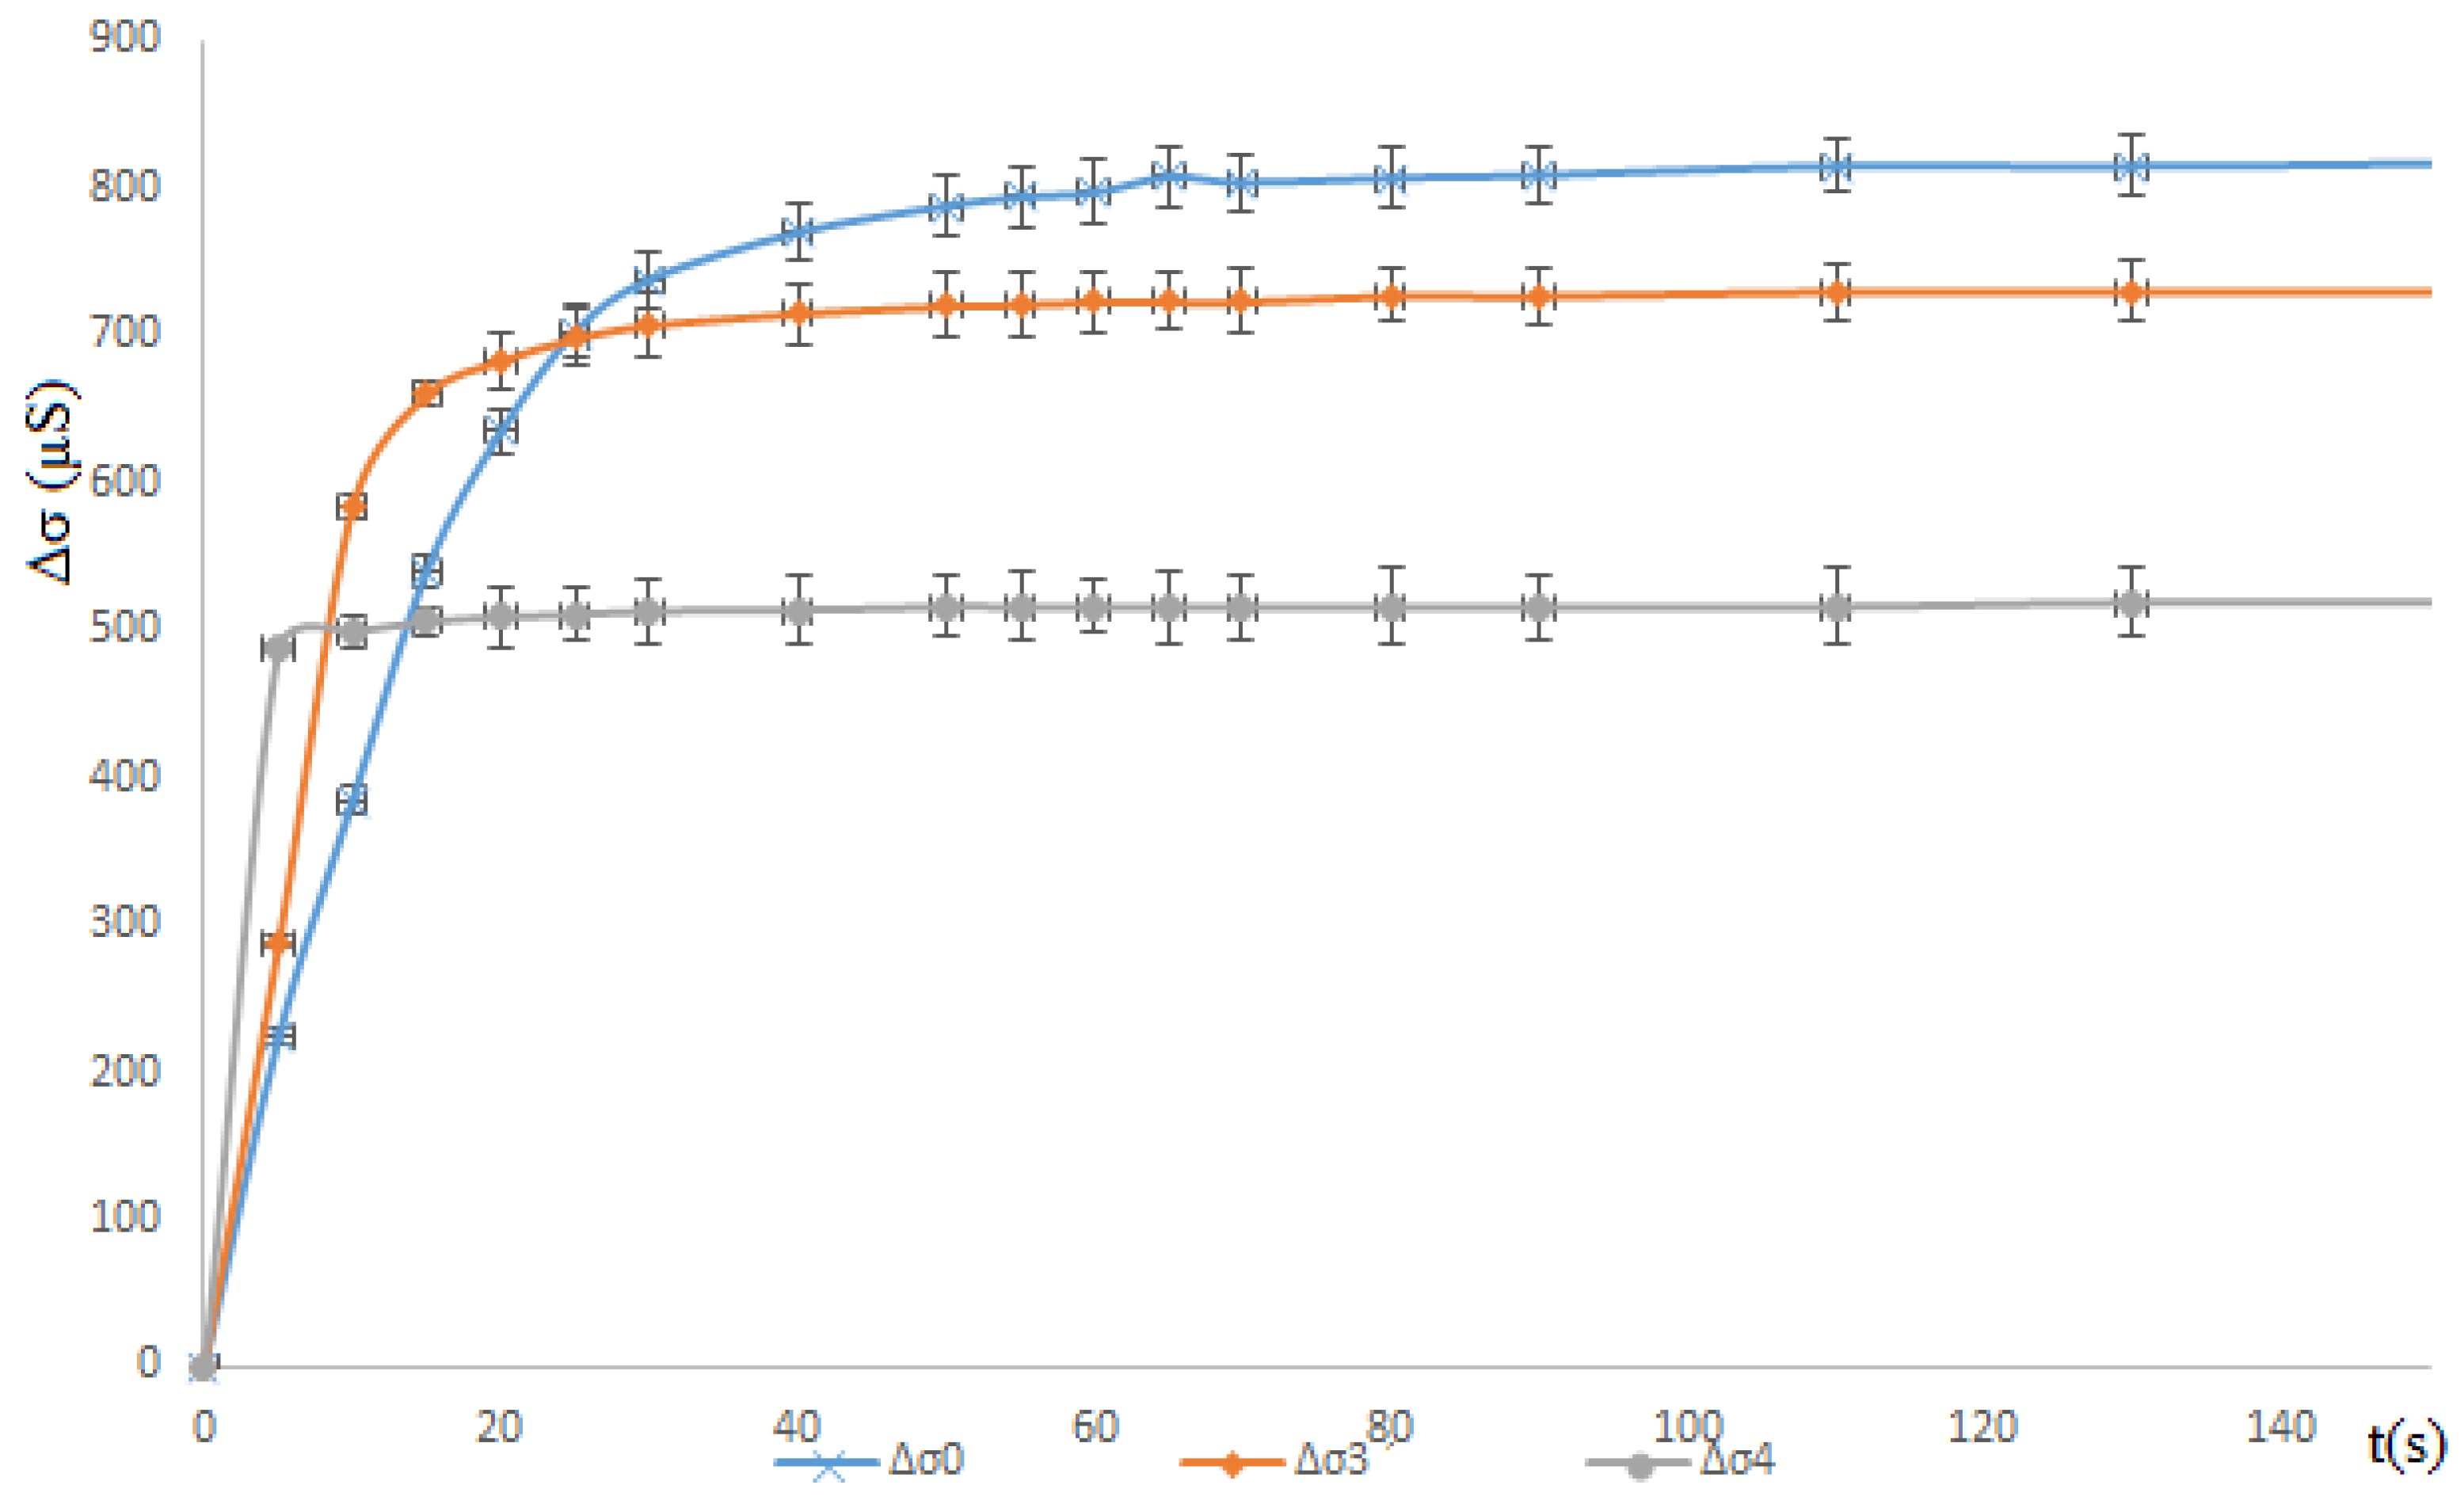
3.1.2. Propan-1-ol Effect: Partial Miscible
3.2. Solid Study
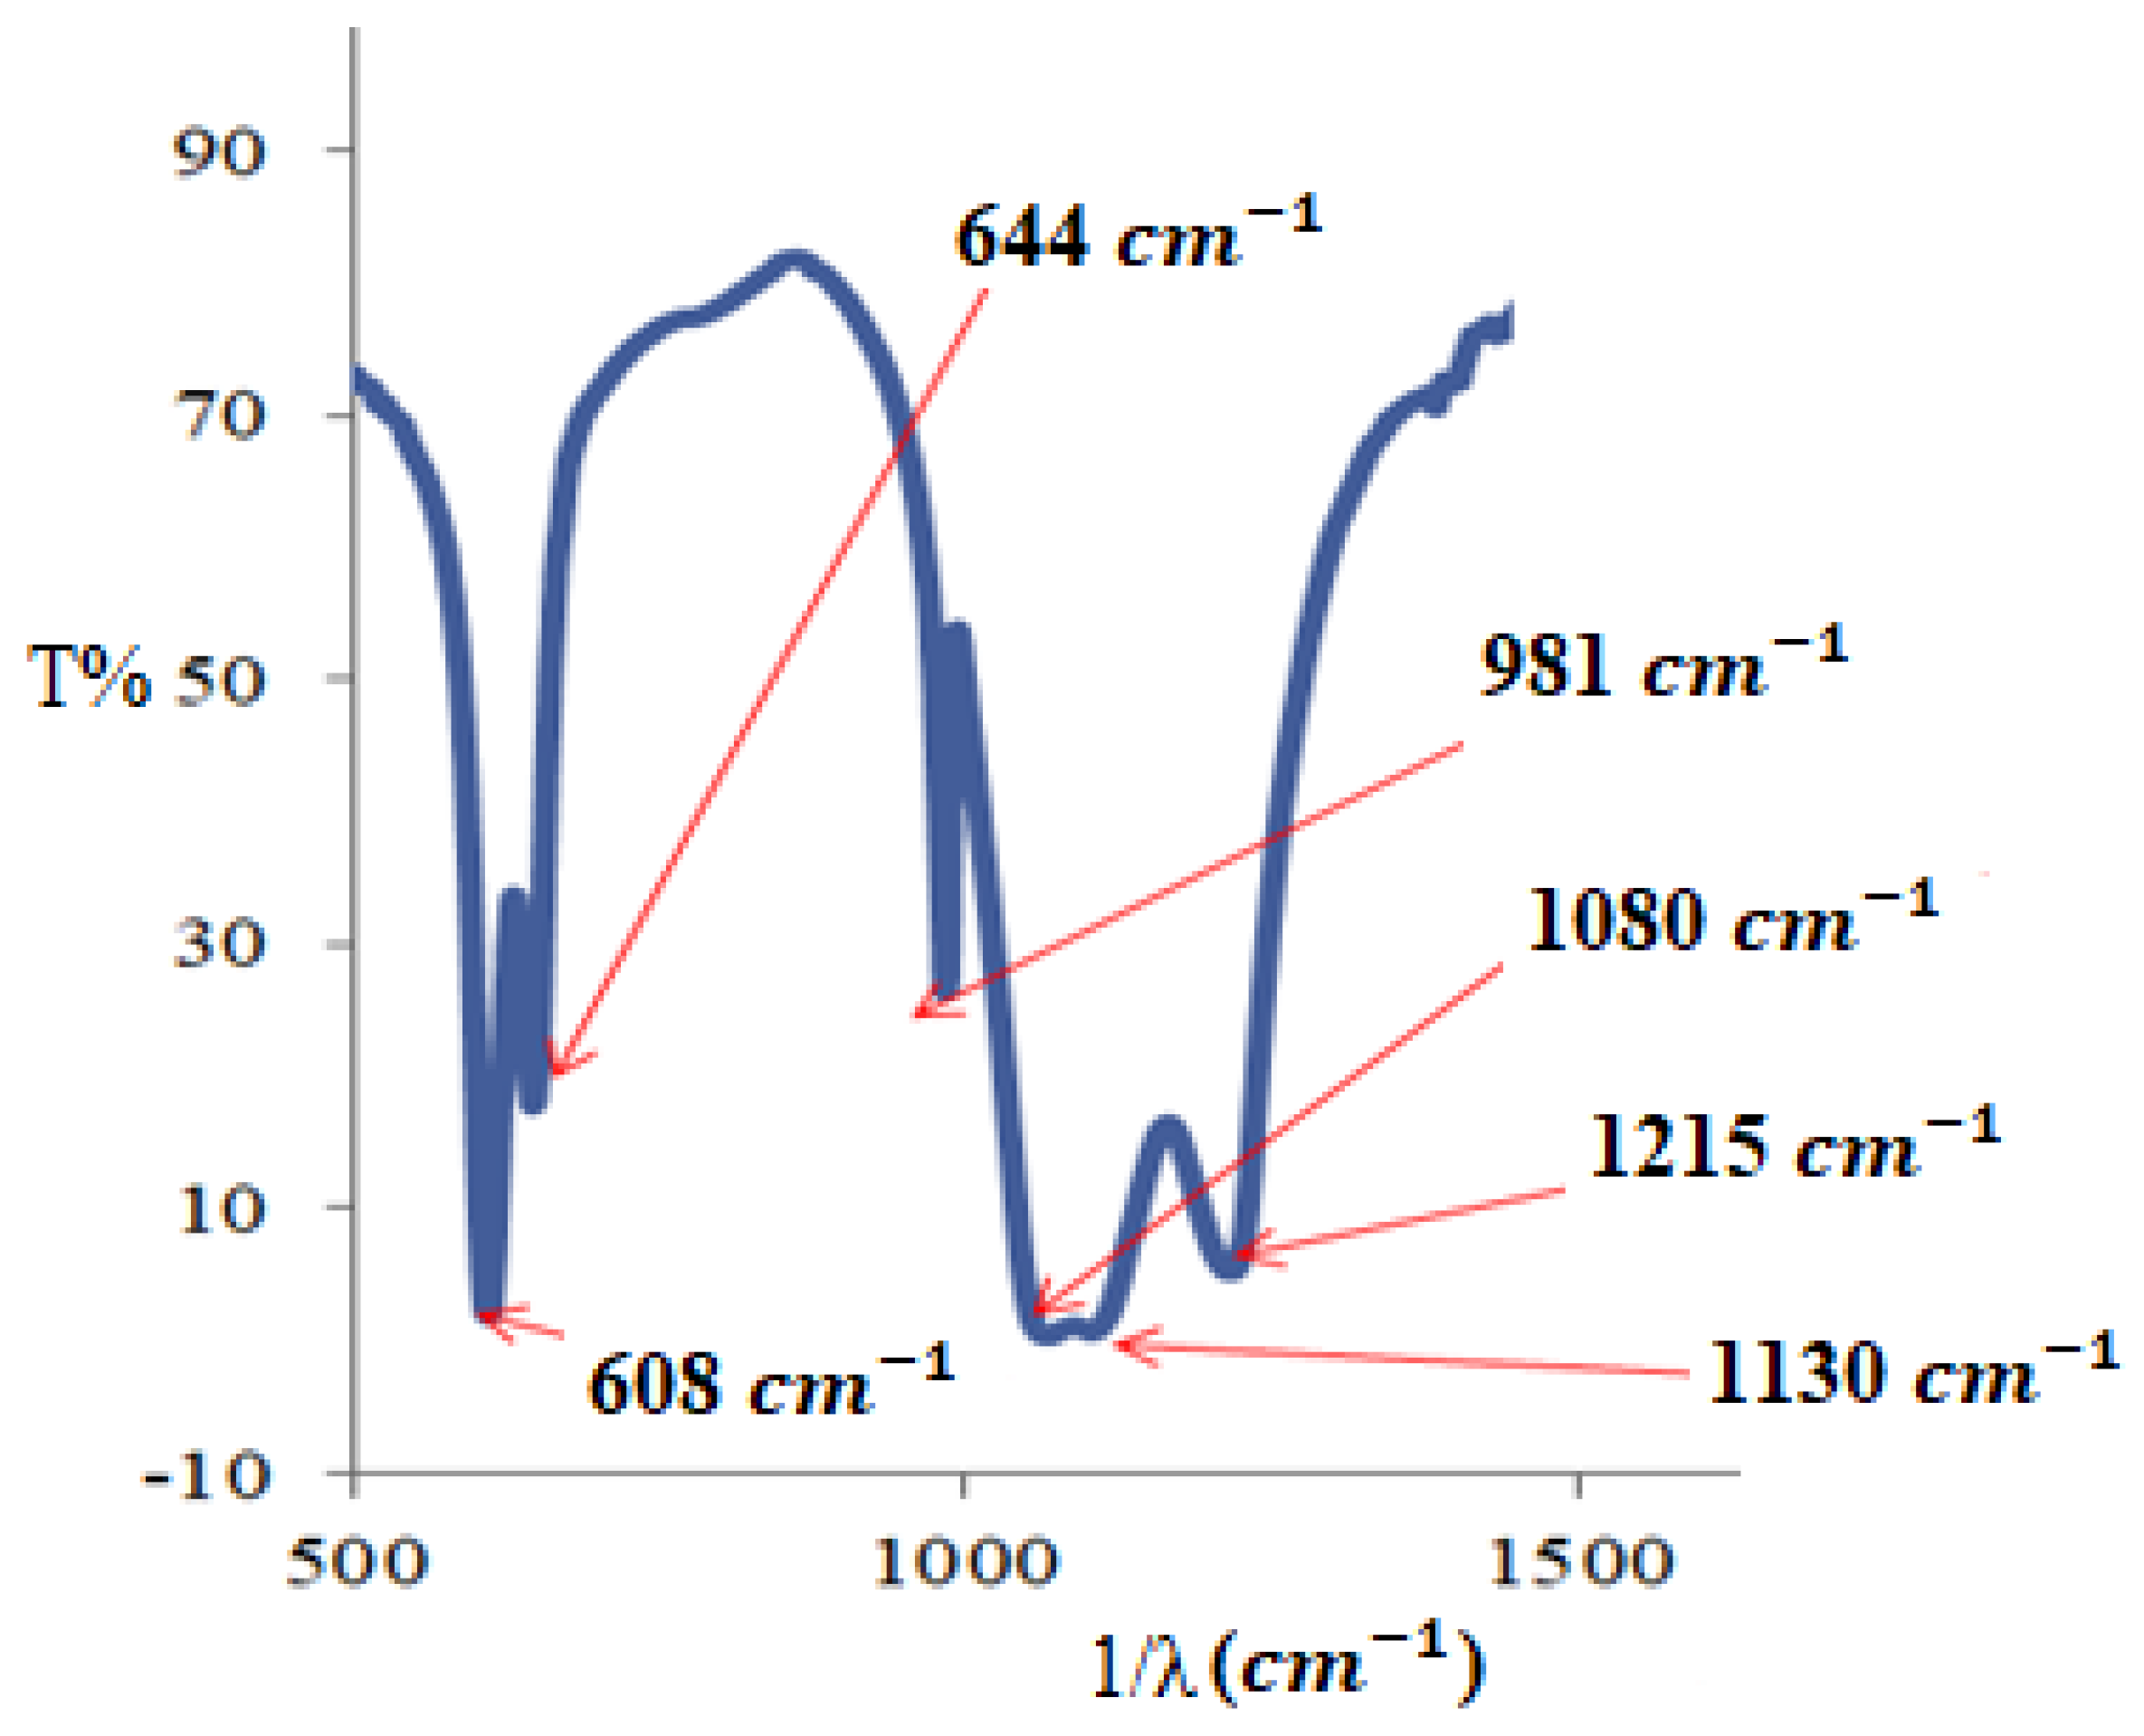
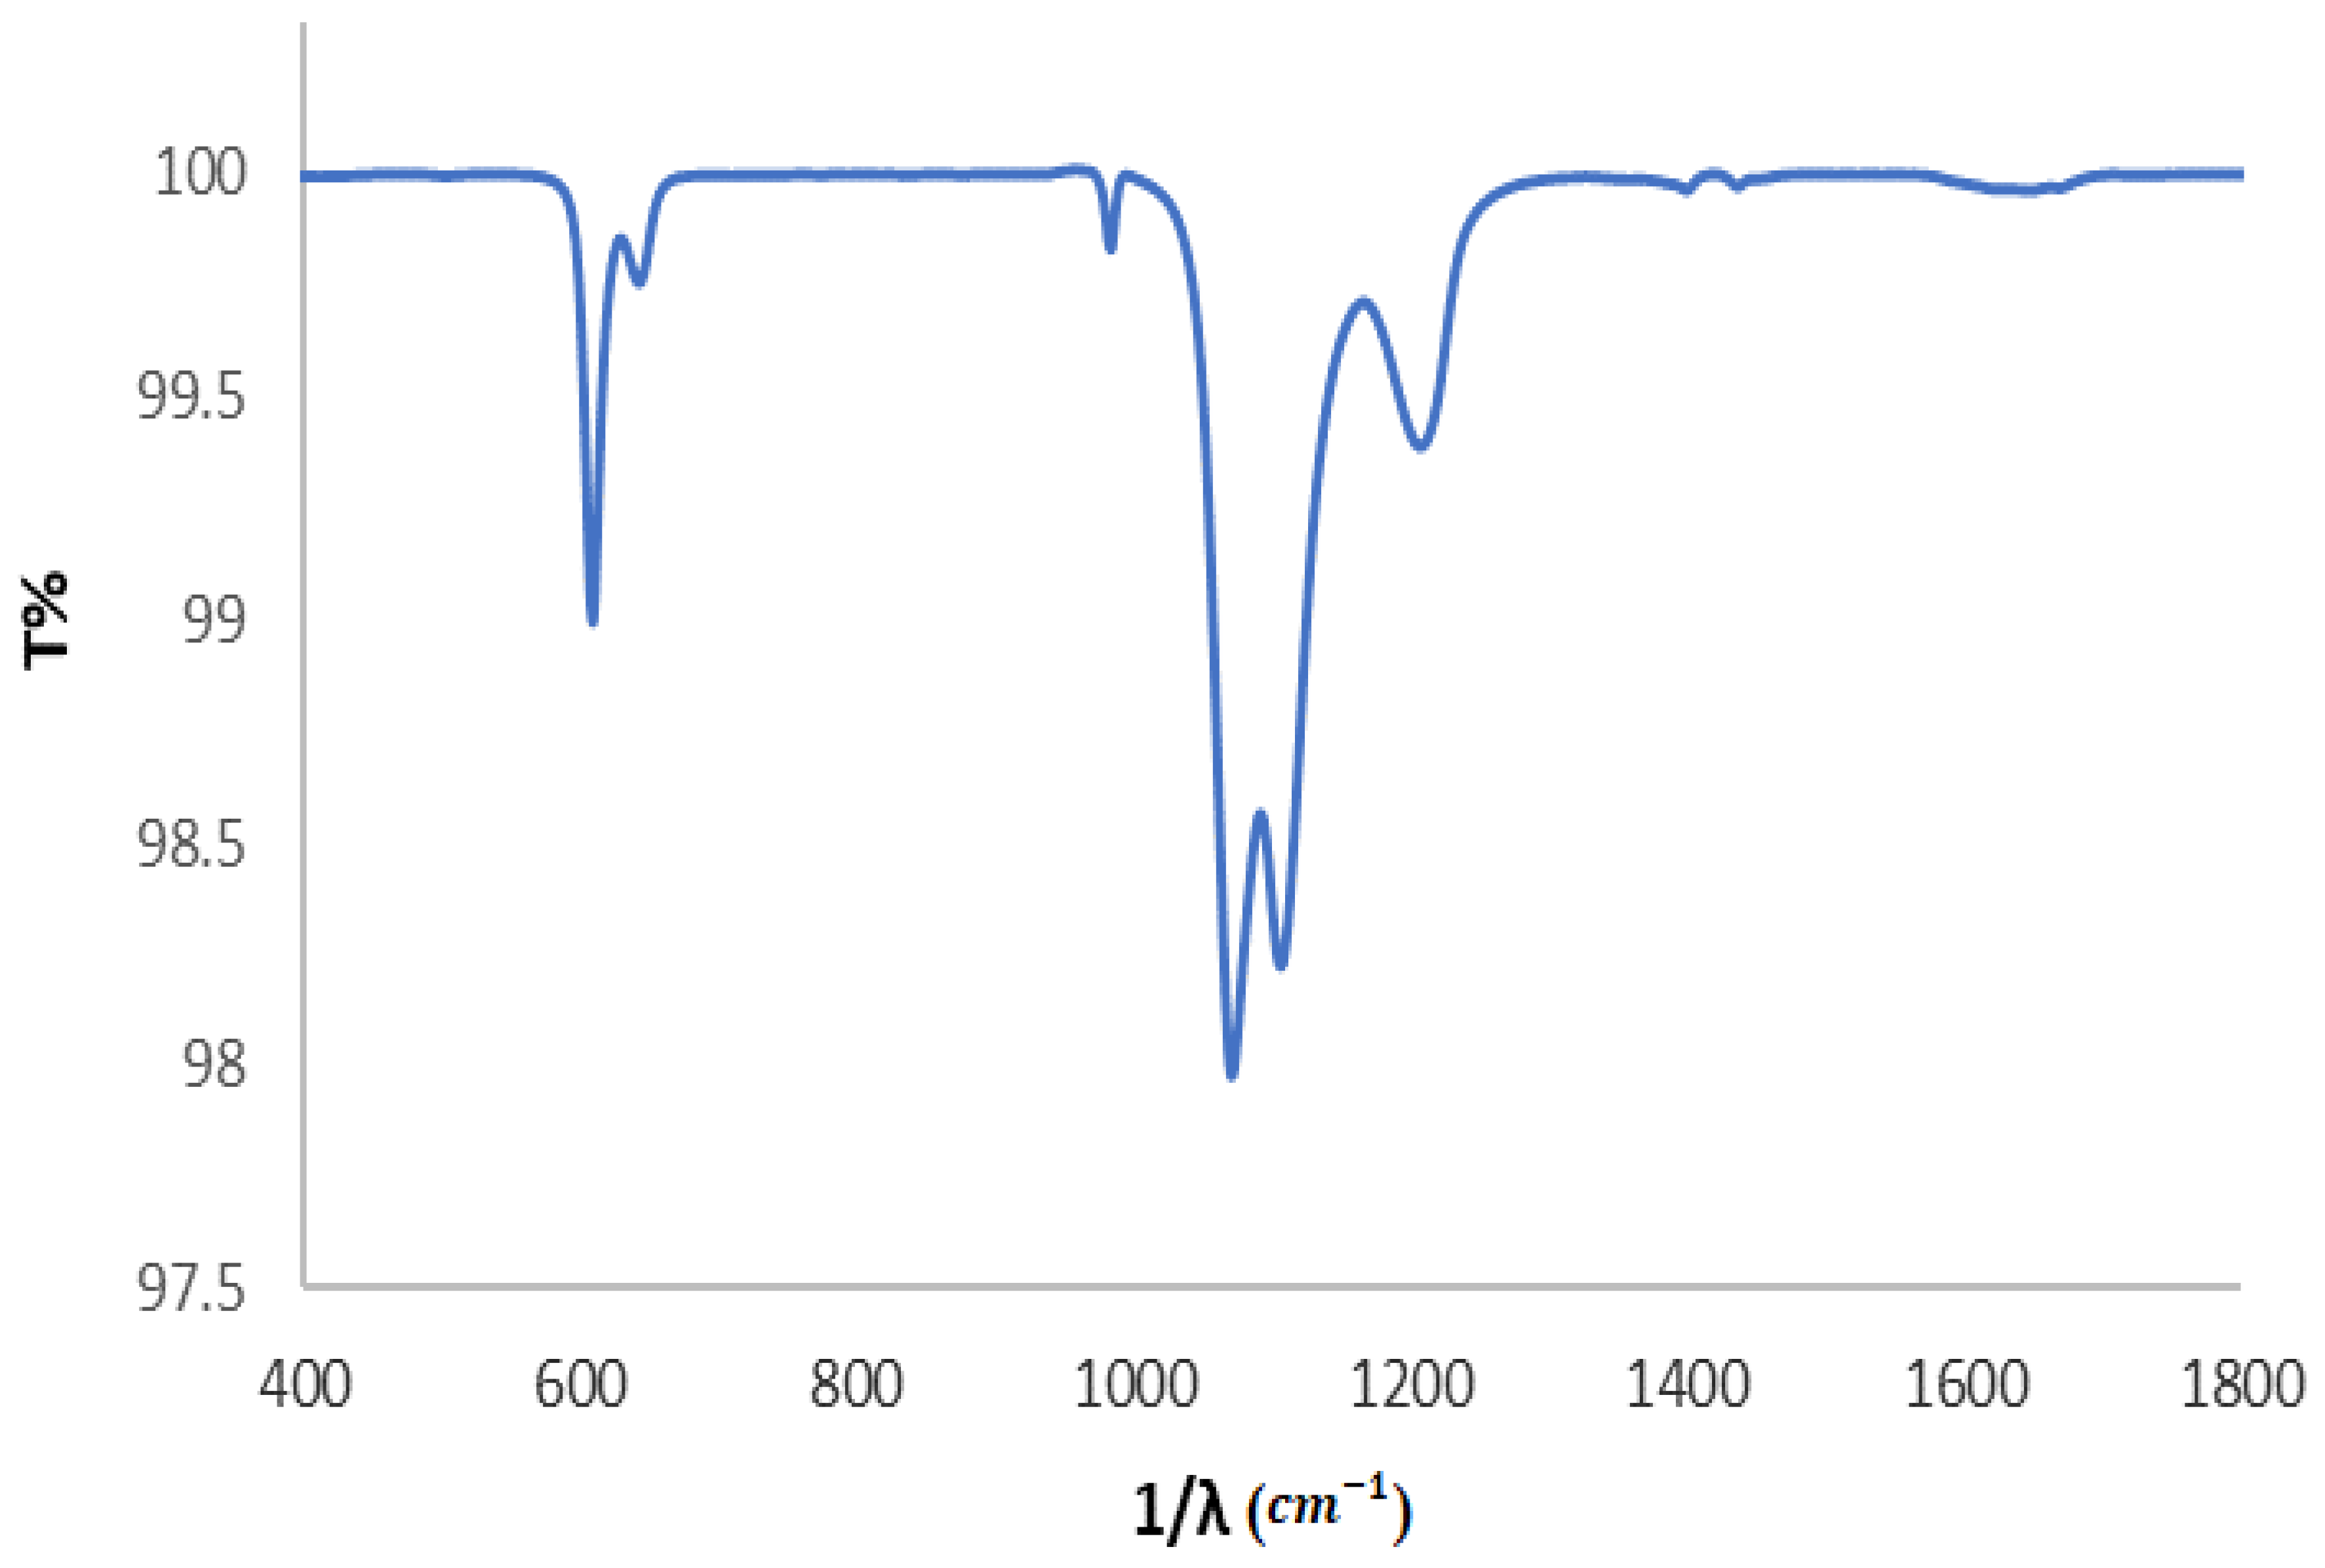
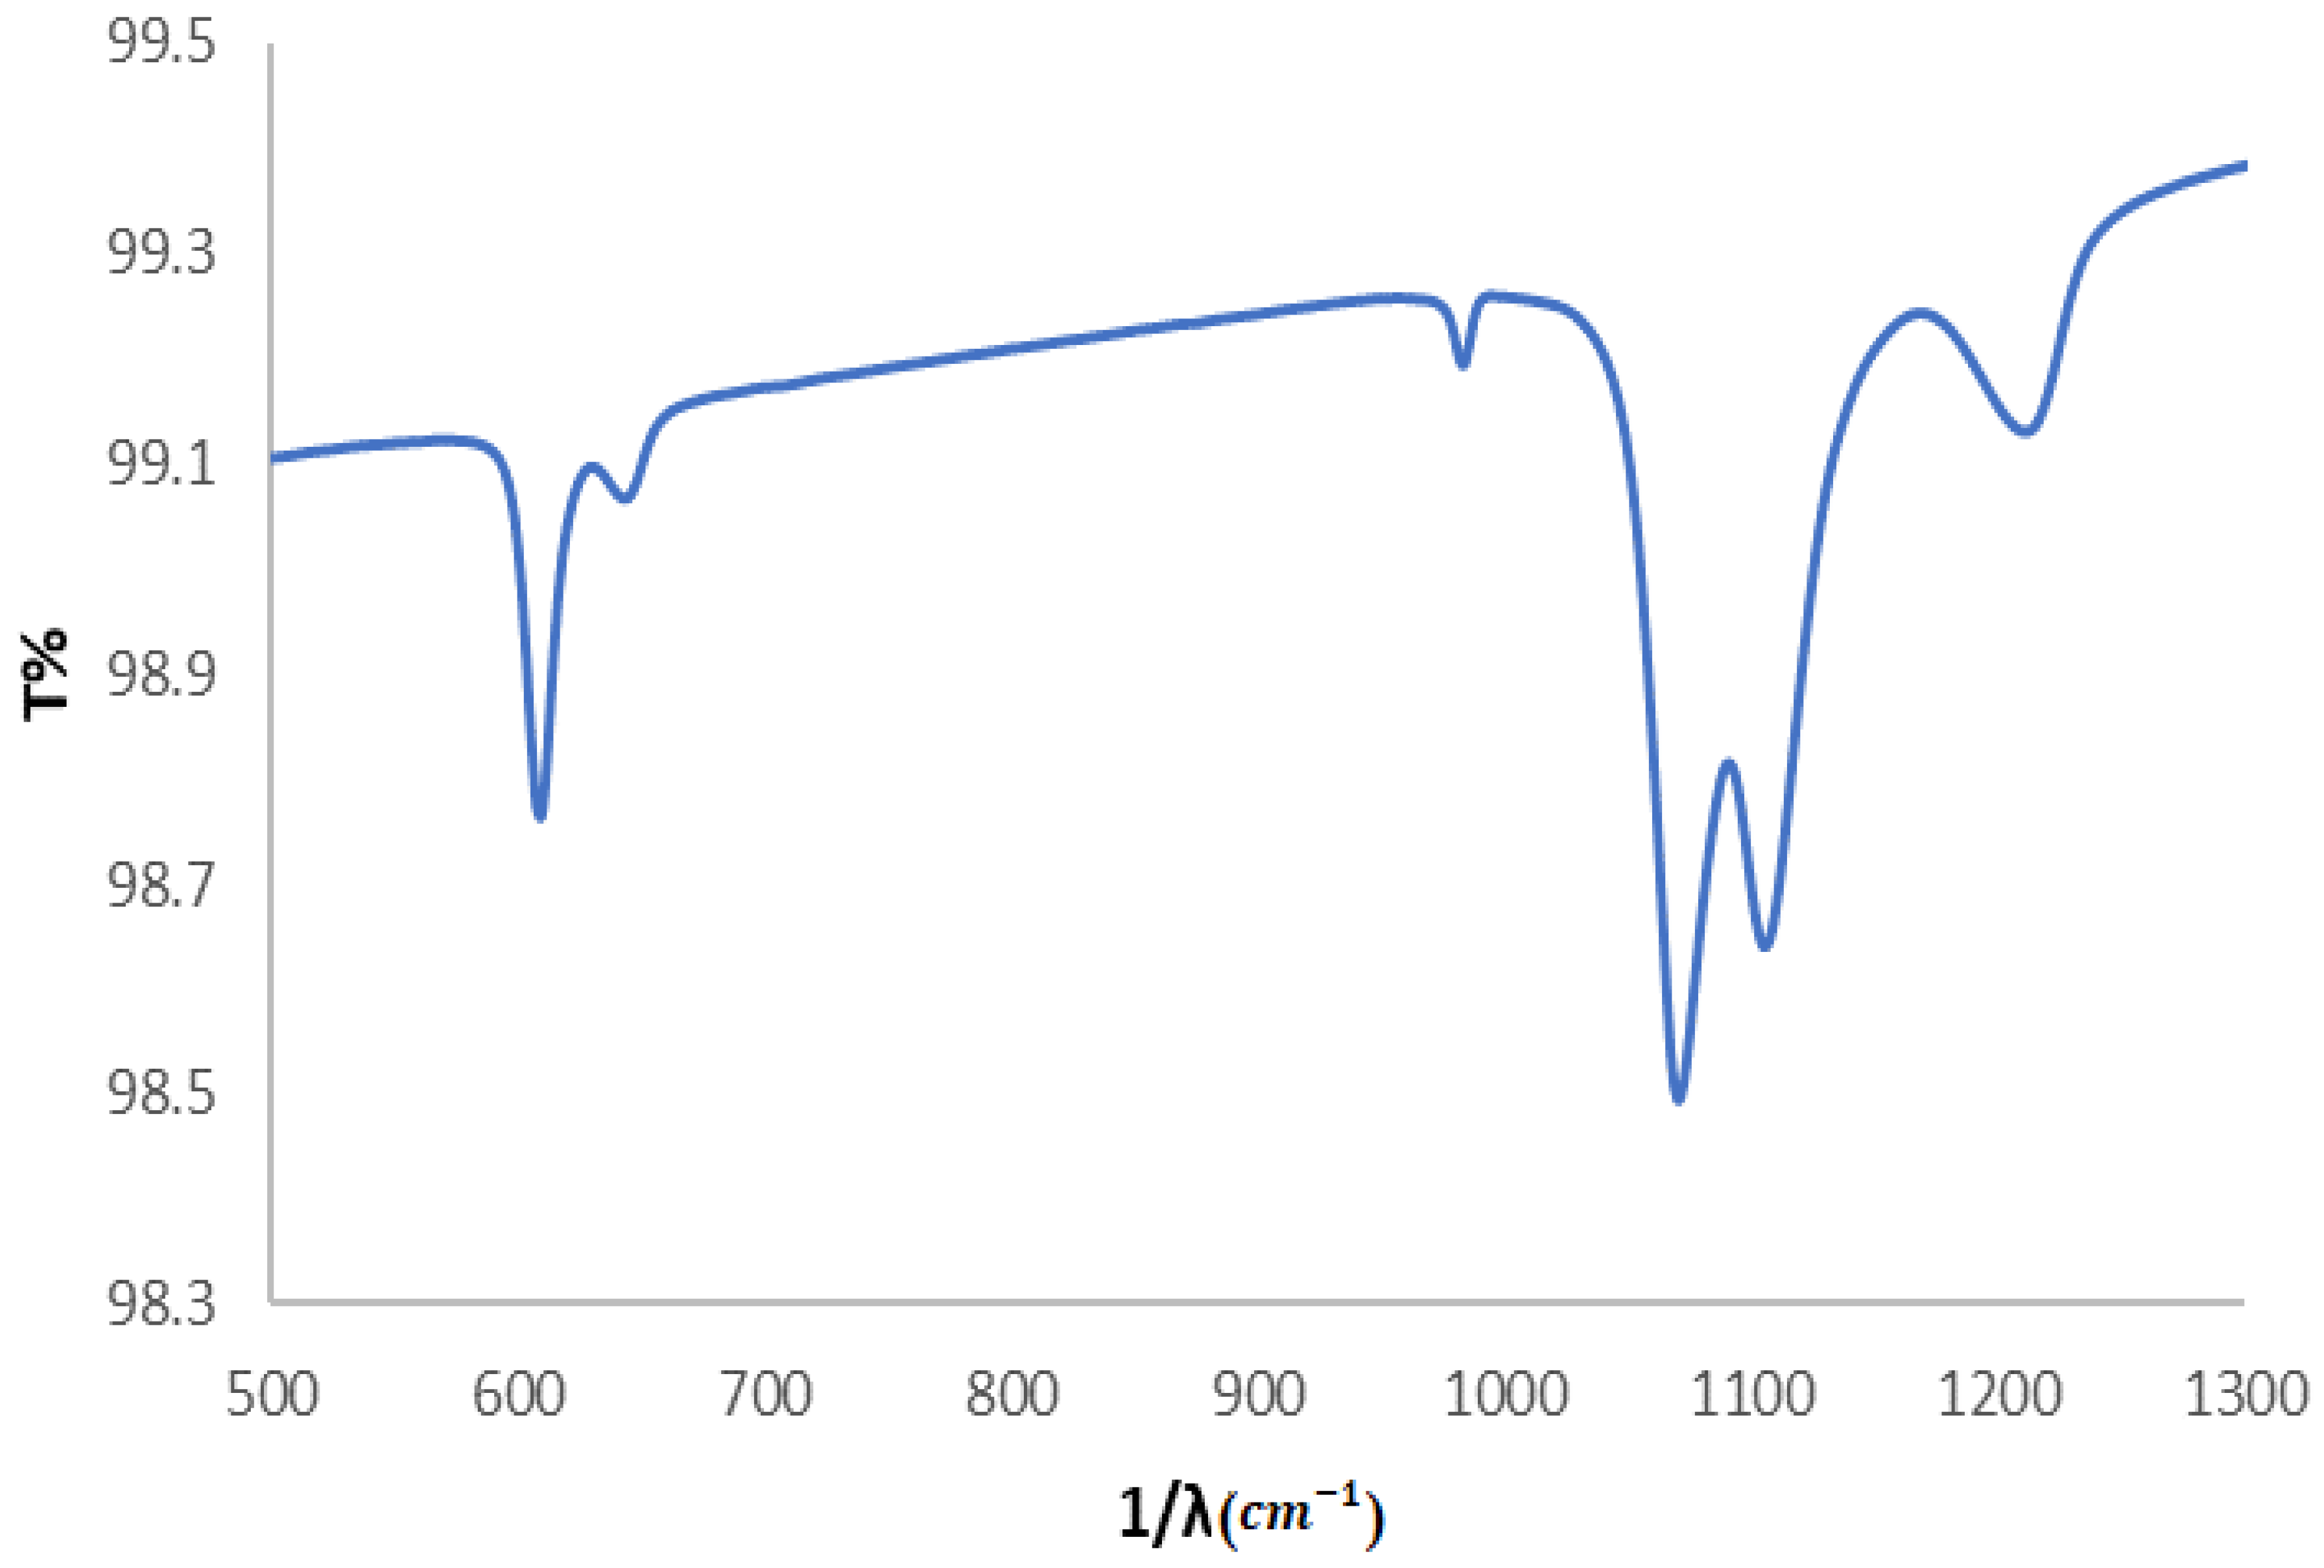
3.2.1. FTIR
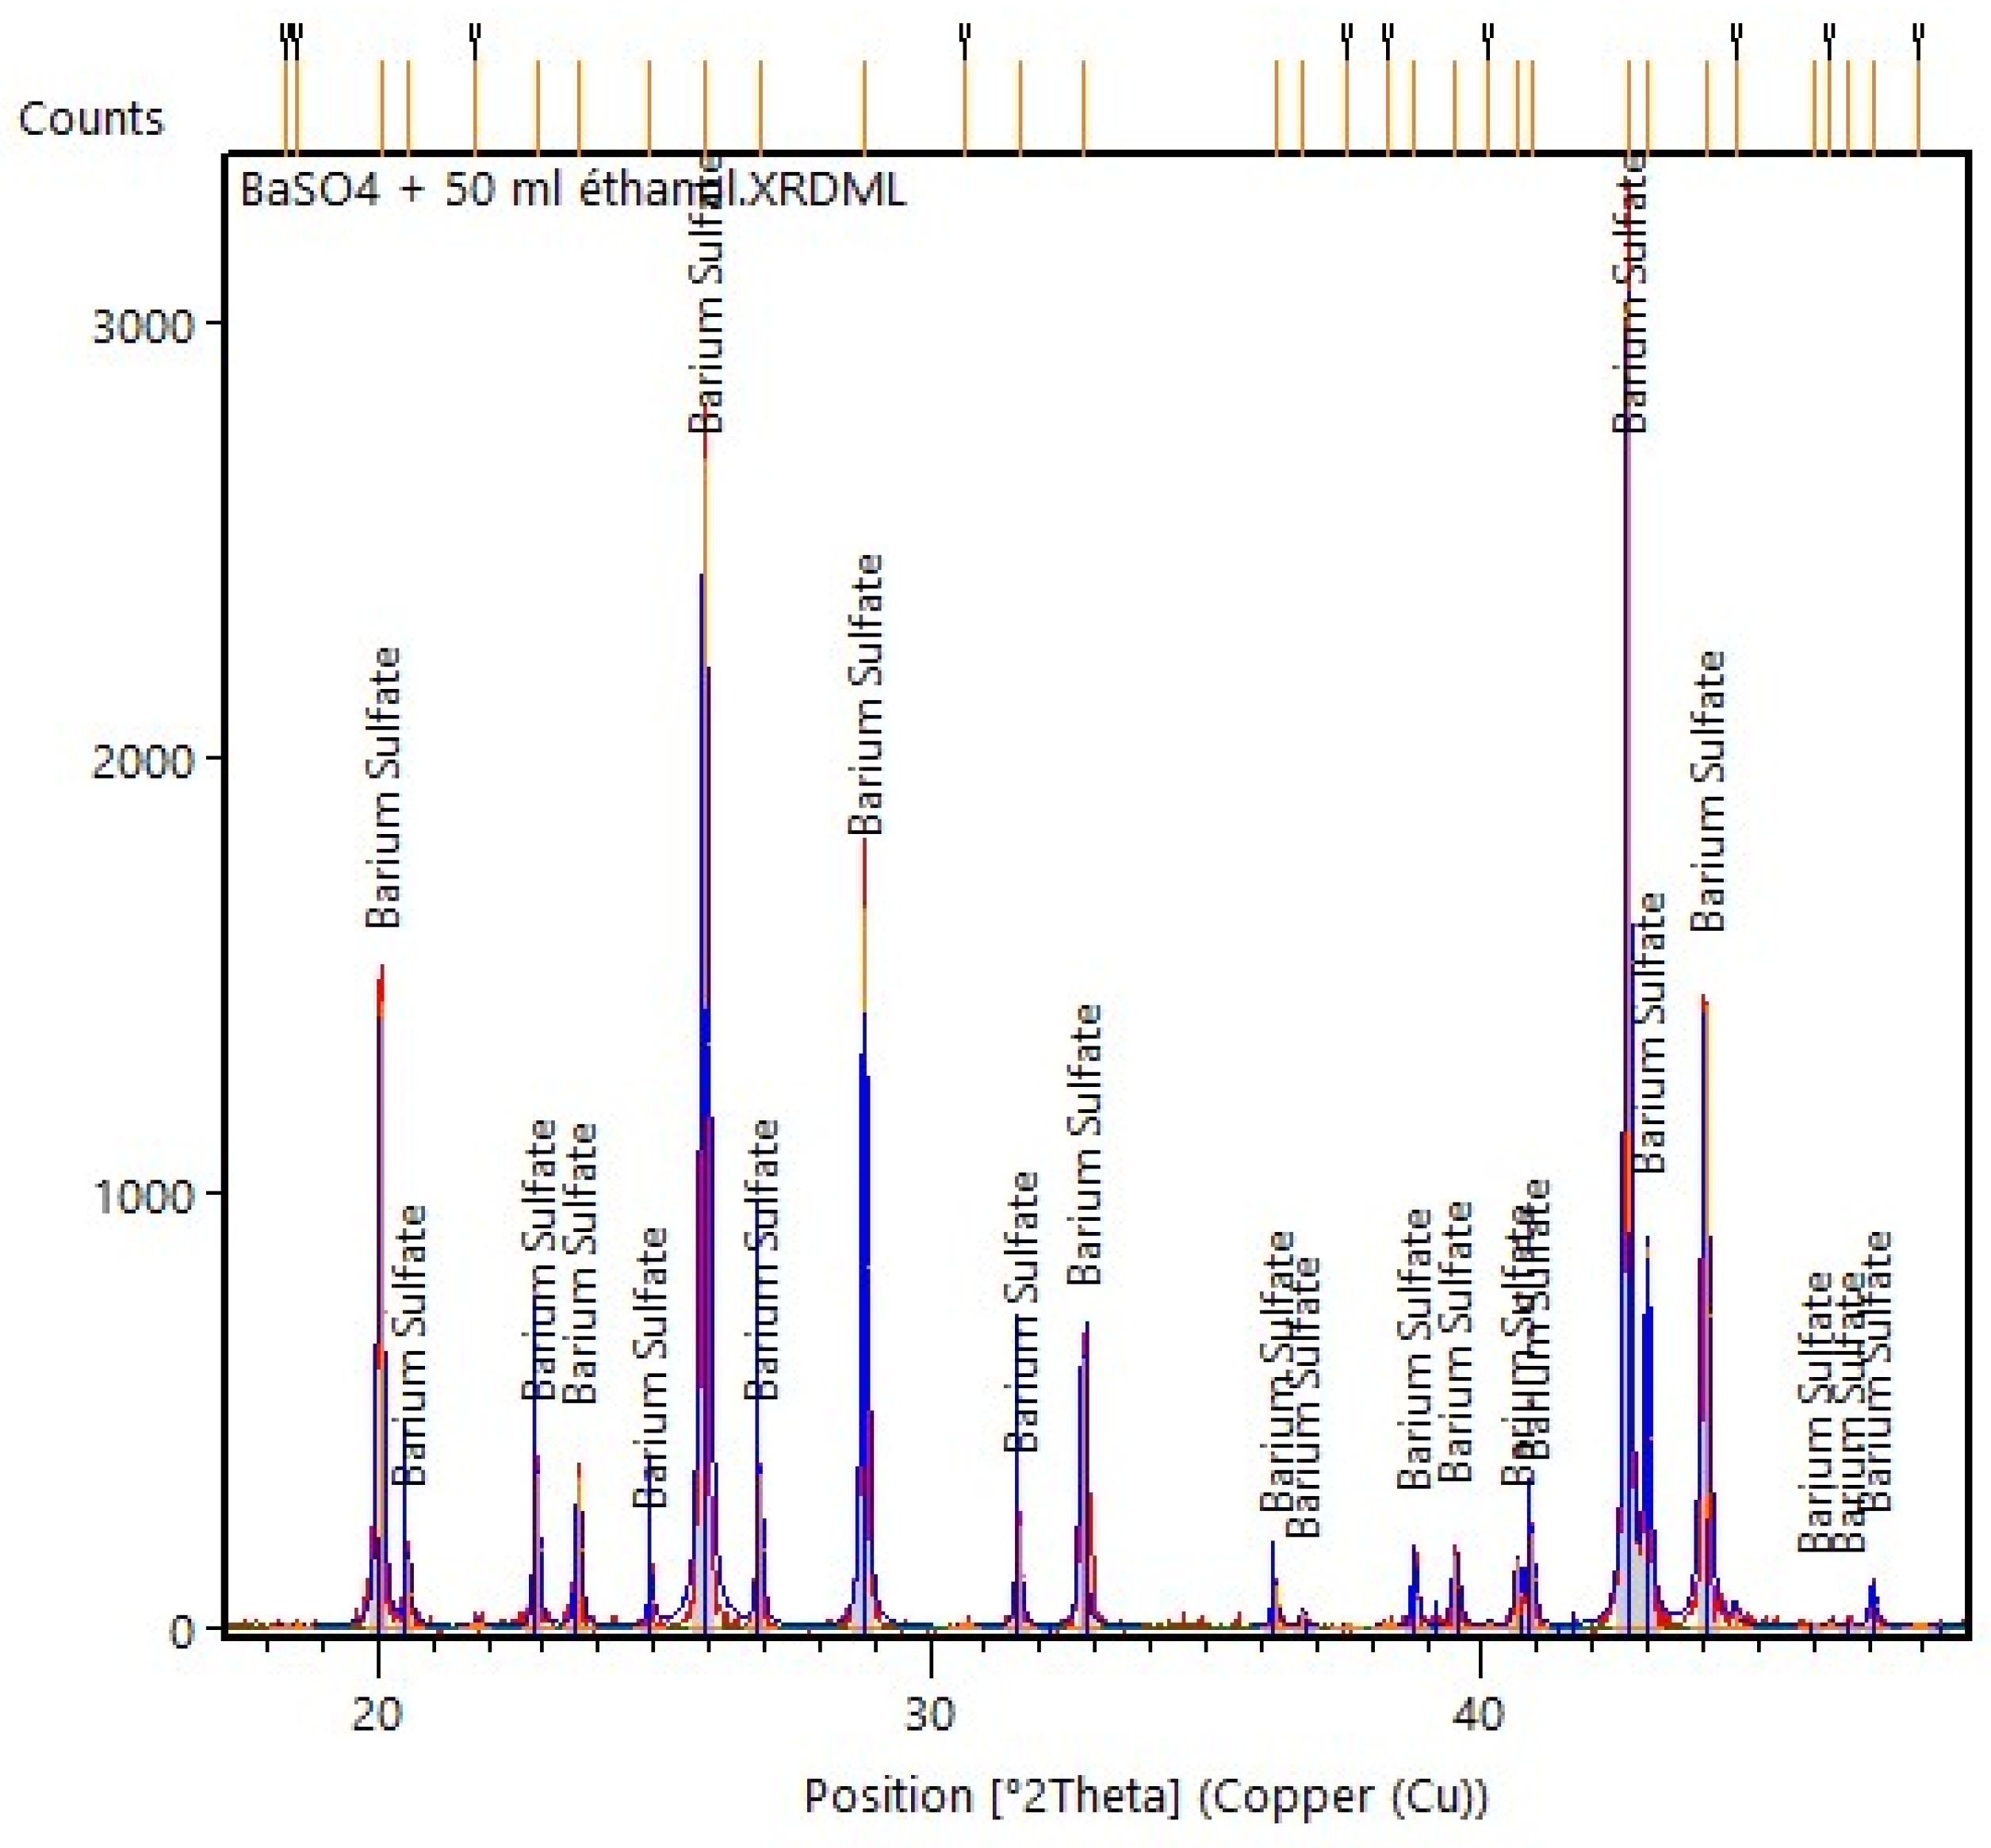
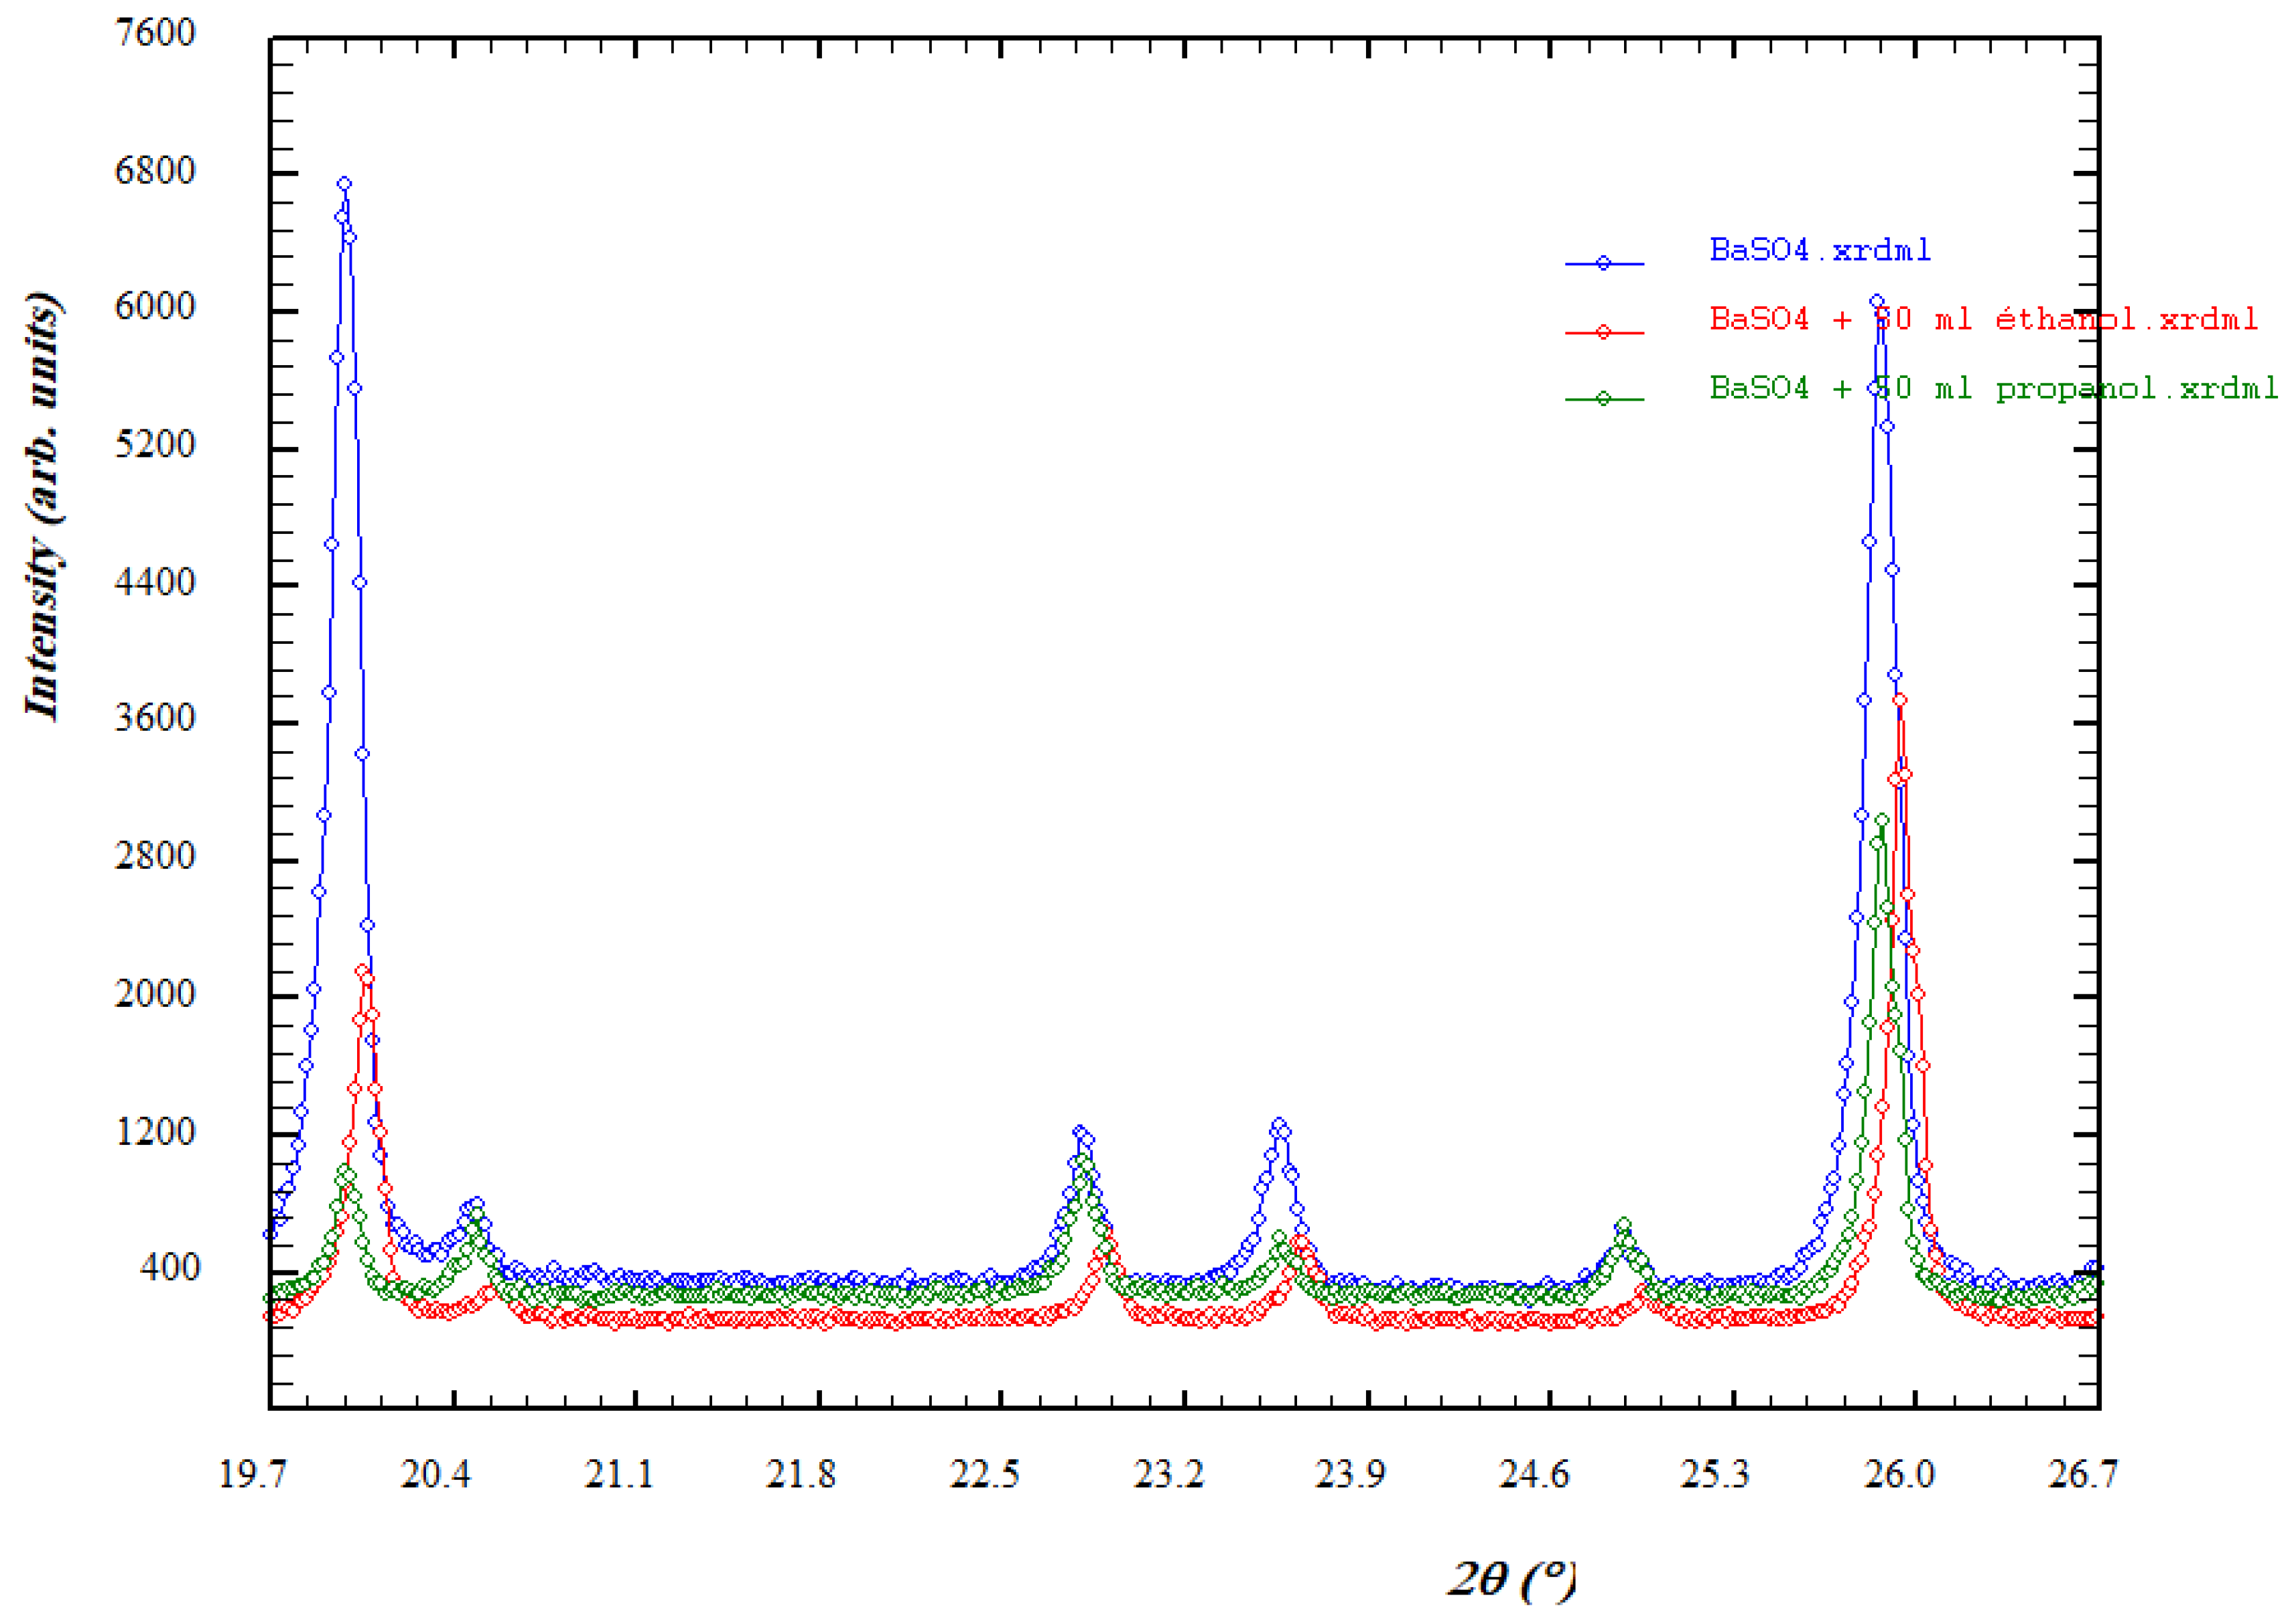
3.2.2. XRD
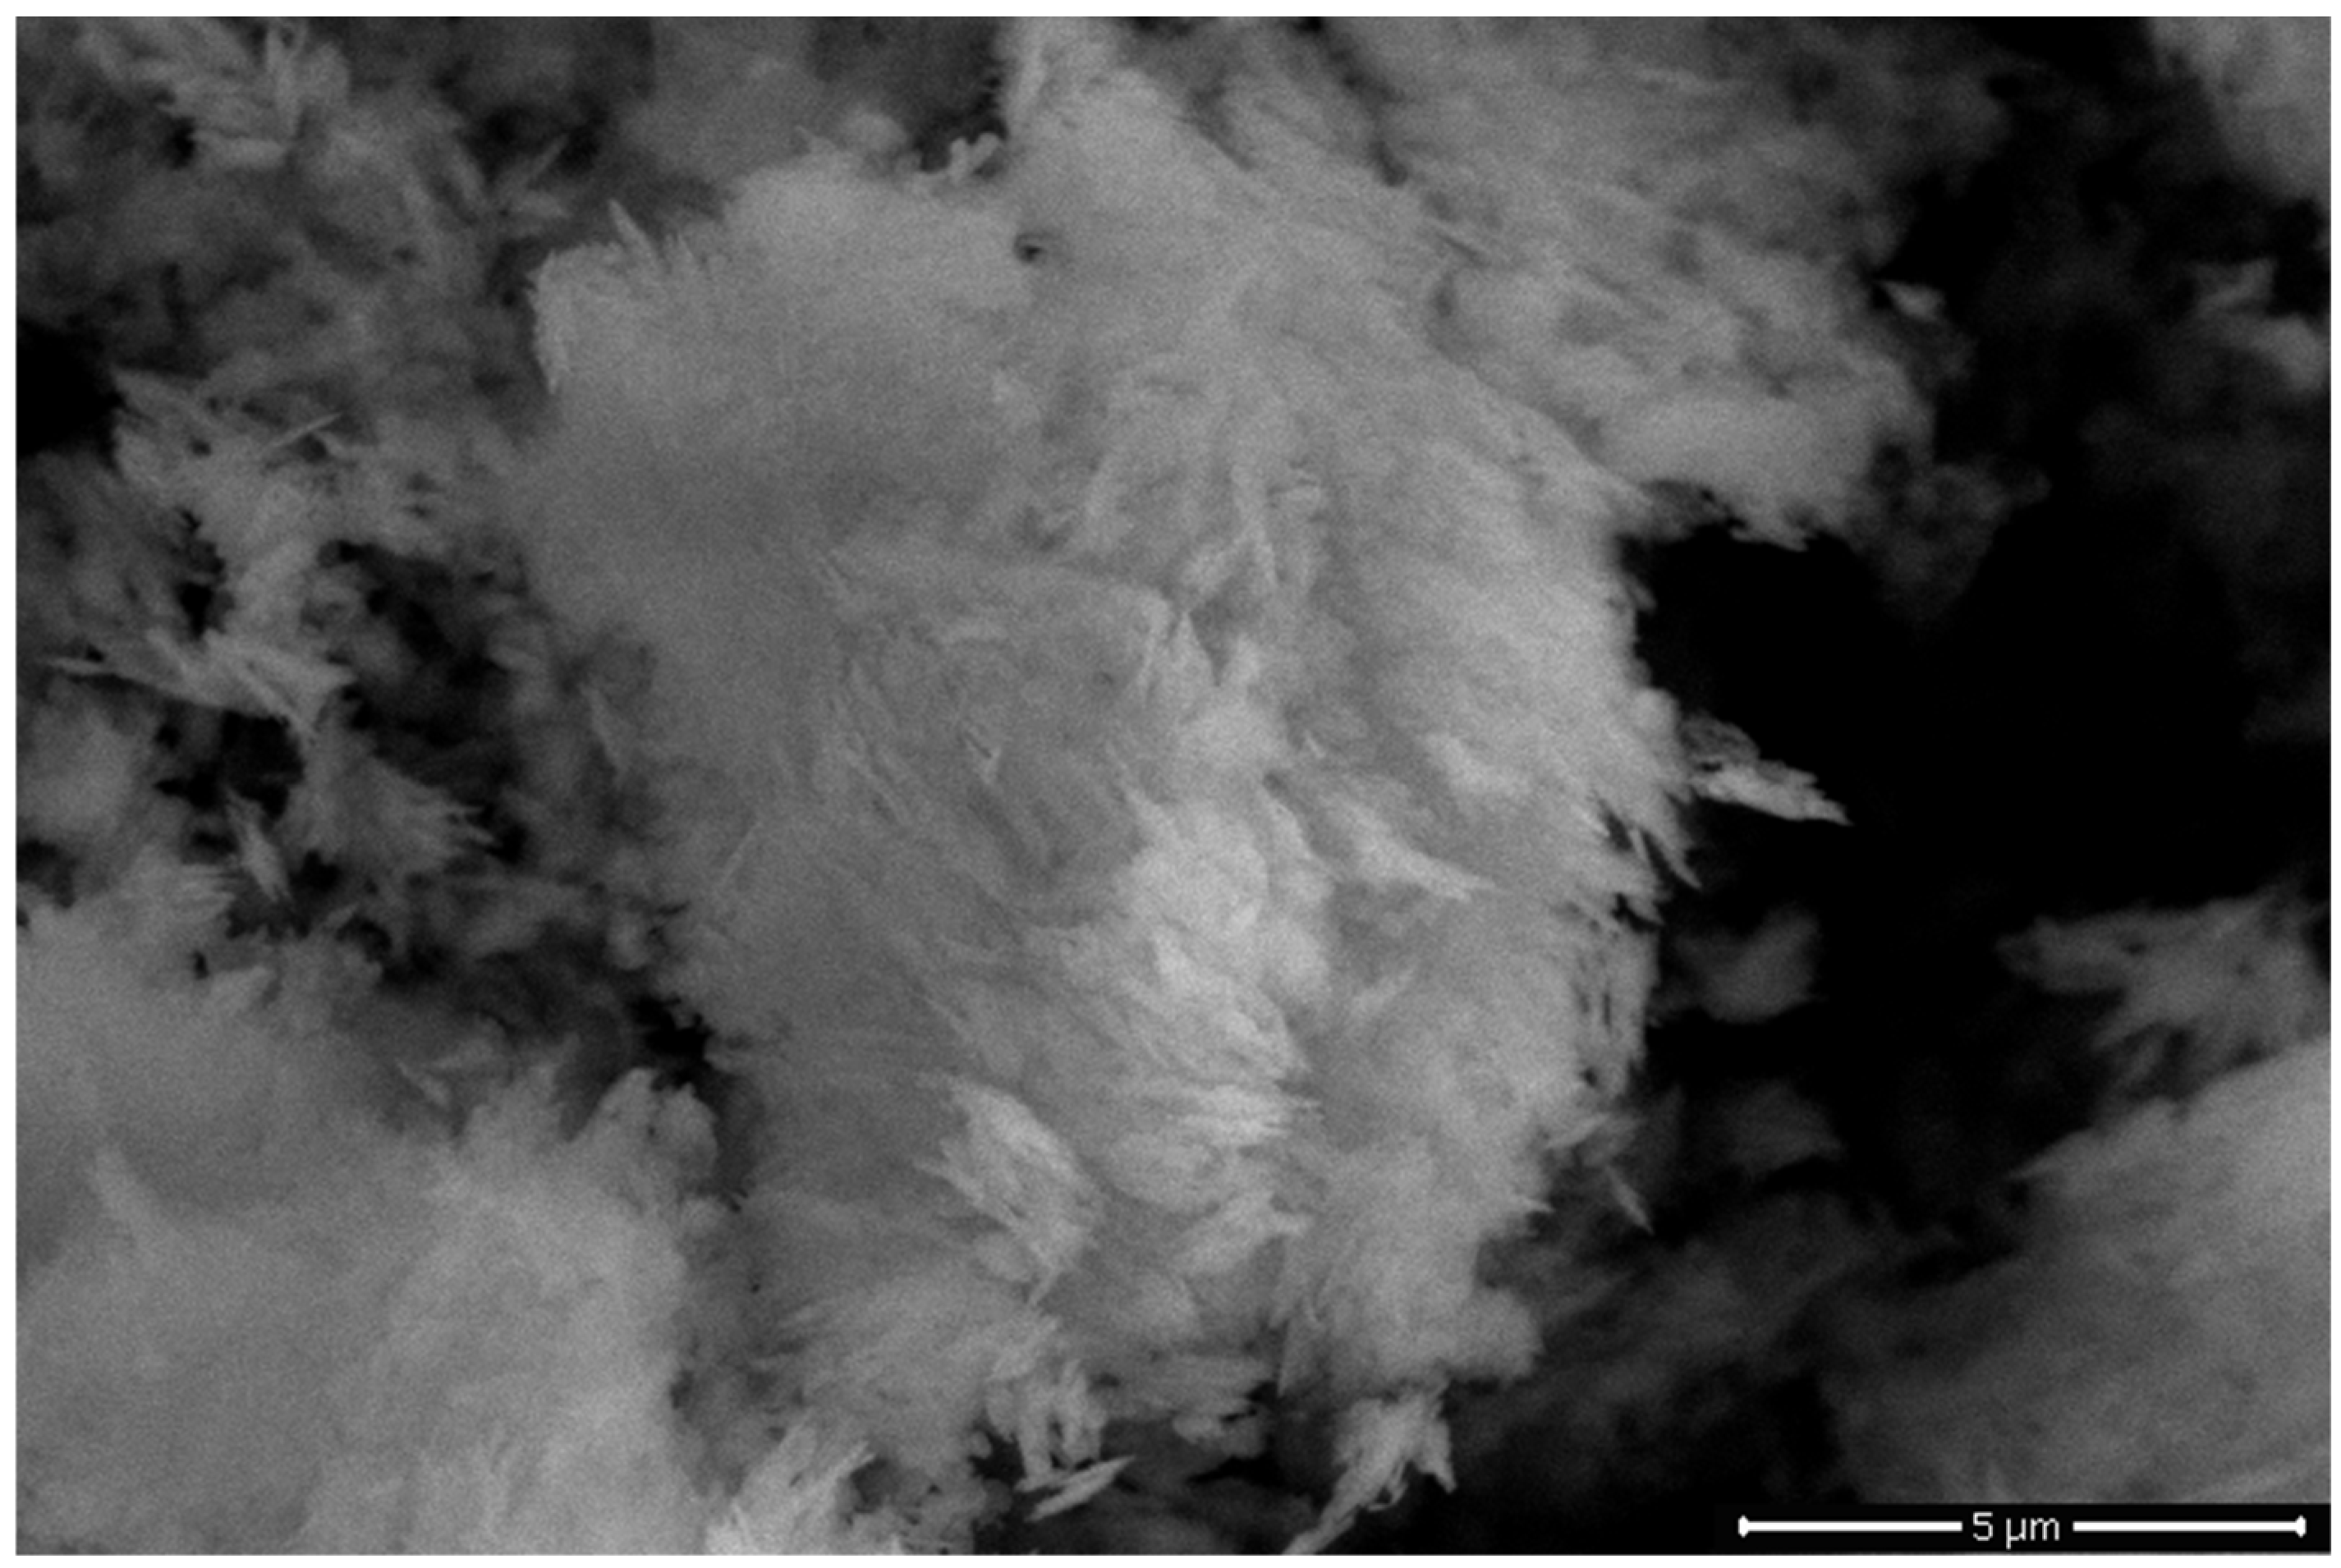
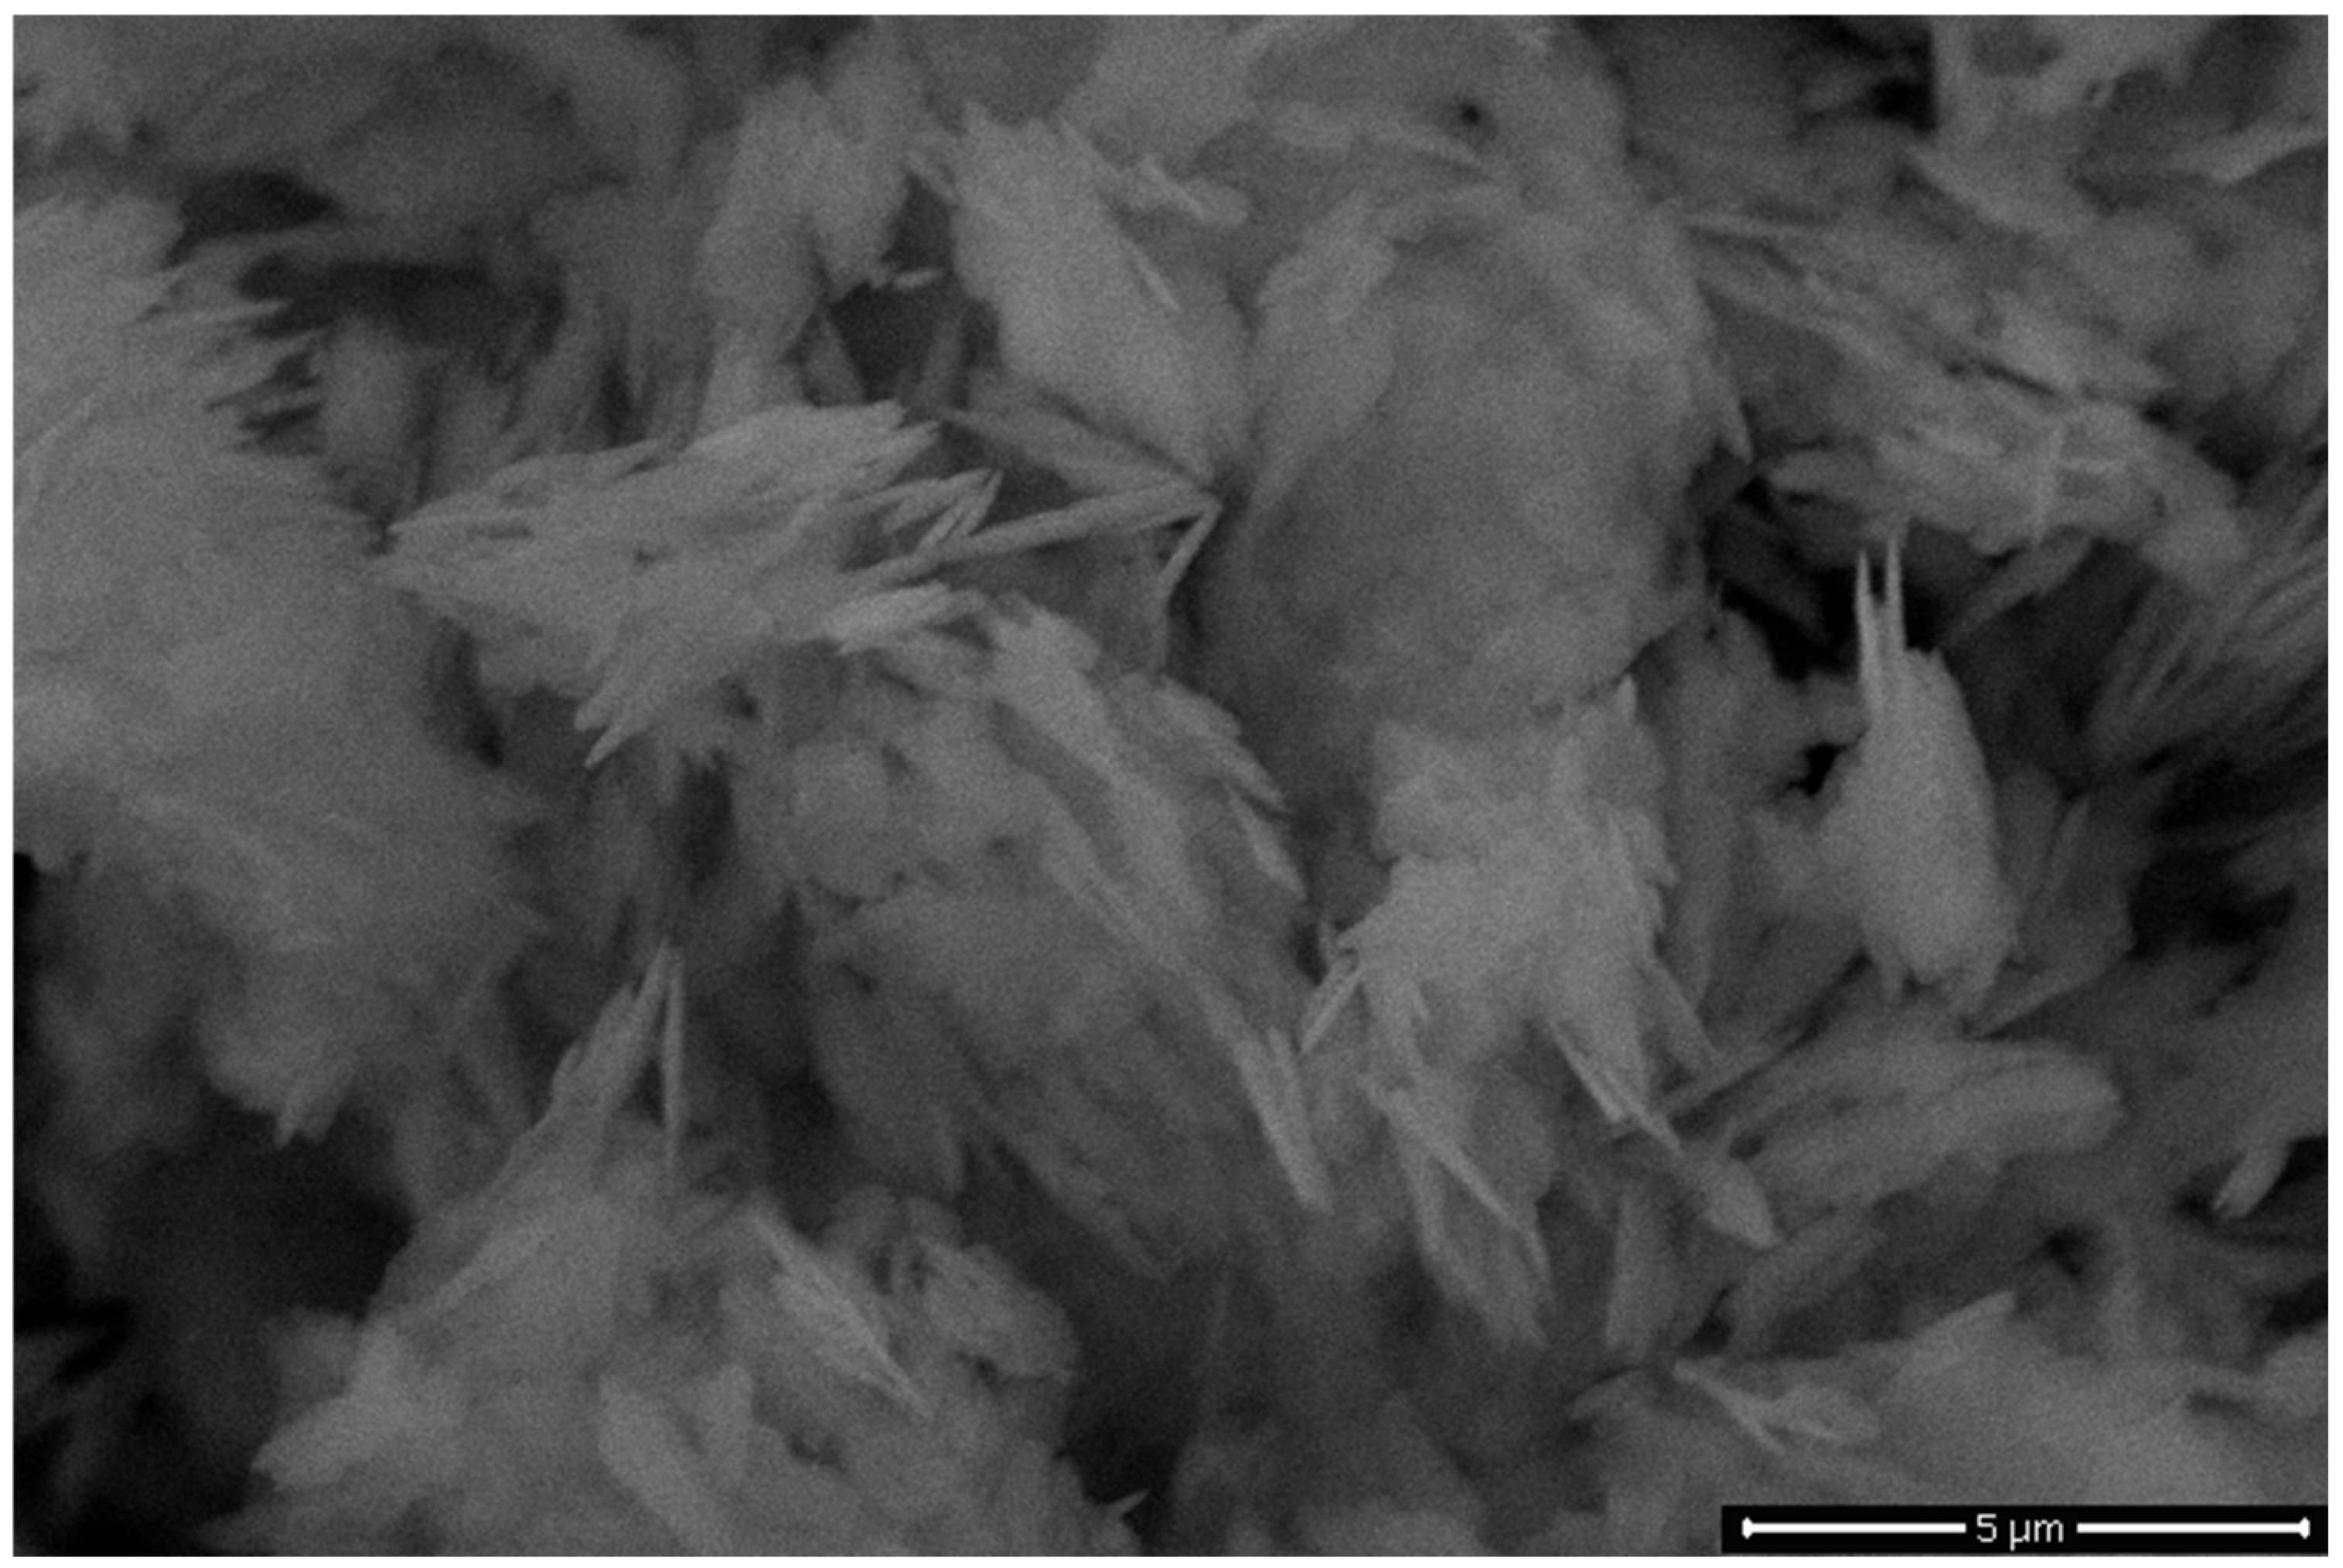
3.2.3. SEM
4. Conclusions
Author Contributions
Funding
Data Availability Statement
Conflicts of Interest
References
- Robinson, R.A.; Stokes, R.H. Electrolytes Solutions; Butterworth & Co. (Pulishers) Ltd.: Devon, UK, 2002. [Google Scholar]
- Gene Collins, A. Geochemistry of Oilfield Waters, 1st ed.; Elsevier Scientific Publishing Company: Amsterdam, The Netherlands, 1975; pp. 195–201. [Google Scholar]
- Wang, S.Y.; Mark, B.; Alice, M.B.; Aila, M.; Leena, S.; Donald, M. The water solubility of crude oils and petroleum products. Oil Chem. Pollut. 1990, 7, 57–84. [Google Scholar]
- Bosbach, D.; Hall, C.; Putnis, A. Mineral Precipitation and Dissolution in Aqueous Solution: In-Situ Microscopic Observations on Barite (001) with Atomic Force Microscopy. Chem. Geol. 1998, 151, 143–160. [Google Scholar] [CrossRef]
- Bracco, J.N.; Gooijer, Y.; Higgins, S.R. Hydrothermal atomic force microscopy observations 478 of barite step growth rates as a function of the aqueous barium-to-sulfate ratio. Geochim. Cosmochim. Acta 2016, 183, 1–13. [Google Scholar] [CrossRef]
- Pina, C.M.; Putnis, C.V.; Becker, U.; Biswas, S.; Carroll, E.C.; Bosbach, D.; Putnis, A. An atomic force microscopy and molecular simulations study of the inhibition of barite growth by phosphonates. Surf. Sci. 2004, 553, 61–74. [Google Scholar] [CrossRef]
- Pina, C.M.; Becker, U.; Risthaus, P.; Bosbach, D.; Putnis, A. Molecular-scale mechanisms of crystal growth in barite. Nature 1998, 395, 483–486. [Google Scholar] [CrossRef]
- Bin Merdhah, A.B. Inhibition of barium sulphate scale at high-barium formation water. J. Petrol. Sci. Eng. 2012, 90–91, 124–130. [Google Scholar] [CrossRef]
- Azaza, H.; Doggaz, A.; Mechi, L.; Optasanu, V.; Tlili, M.; Ben Amor, M. Synthesis of intermediate crystal Ba1−xCaxSO4 system via co-precipitation of BaSO4-CaSO4 and partial hindrance of gypsum formation. Desalin. Water Treat. 2017, 66, 80–87. [Google Scholar] [CrossRef]
- Azaza, H.; Mechi, L.; Doggaz, A.; Optasanu, V.; Tlili, M.; Ben Amor, M. Enhancement of calcite formation in presence of sulfate bariyum: Kinetic & morphological studies. Arab. J. Geosci. 2017, 10, 1–9. [Google Scholar]
- Wu, D.; Liu, D.; Luo, H.; Wang, J.; Zhao, H.; Dong, Y. Studies on the dissolution mechanism of barium sulfate by different alkaline metal hydroxides: Molecular simulations and experperiments. J. Mol. Liq. 2025, 418, 126708. [Google Scholar] [CrossRef]
- de Freitas Dam, R.S.; dos Santos, M.C.; Salgado, W.L.; da Cruz, B.L.; Schirru, R.; Salgado, C.M. Prediction of fluids volume fraction and barium sulfate scale in a multiphase system using gamma radiation and deep neural network. Appl. Radiat. Isot. 2023, 201, 111021. [Google Scholar]
- Li, L.; He, X.; Zhang, X.; Wang, S.; Guo, S.; Tang, N.; Wang, X. A facile method to control the morphologies of barium sulfate particles by using carboxylic carbon quantum dots as a regulator. Colloid. Surf. A 2021, 631, 127668. [Google Scholar] [CrossRef]
- Van Der Leeden, M.C.; Kashchiev, D.; Van Rosmalen, G.M. Precipitation of Barium Sulfate: Induction Time and the Effect of an Additive on Nucleation and Growth. J. Colloid. Interface Sci. 1992, 152, 338–350. [Google Scholar] [CrossRef]
- Jones, F.; Piana, S.; Gale, J.D. Understanding the Kinetics of Barium Sulfate Precipitation from Water and Water–Methanol Solutions. Cryst. Growth Des. 2008, 8, 817–822. [Google Scholar] [CrossRef]
- Gomaa, A. Solubility and Solvation Parameters of Barium Sulphate in Mixed Ethanol-Water Mixtures at 301.15 K. Int. J. Mater. Chem. 2012, 2, 16–18. [Google Scholar] [CrossRef]
- Gomis, V.; Saquete, M.D.; García-Cano, J. CaSO4 solubility in water–ethanol mixtures in the presence of sodium chloride at 25 °C application to a reverse osmosis process. Fluid Ph. Equilib. 2013, 360, 248–252. [Google Scholar] [CrossRef]
- Ruiz-Agudo, C.; Putnis, V.C.; Ruiz-Agudo, E.; Putnis, A. The influence of pH on barite nucleation and growth. Chem. Geol. 2015, 6, 7–18. [Google Scholar] [CrossRef]
- Monnin, C. A thermodynamic model for the solubility of barite and celestite in electrolyte solutions and seawater to 200 °C and to 1 kbar. Chem. Geol. 1999, 153, 187–209. [Google Scholar] [CrossRef]
- Davies, C.W. Ion Association, 1st ed.; Butterworths: London, UK, 1962; pp. 37–52. [Google Scholar]
- Rodriguez-Carvajal, J. FULLPROF: A Program for Rietveld Refinement and Pattern Matching Analysis. In Proceedings of the Satellite Meeting on Powder Diffraction of the XV Congress of the IUCr, Toulouse, France, 16–19 July 1990; p. 127. [Google Scholar]
- Mersmann, A.; Eble, A.; Heye, C. Cristallization Technology Handbook, 1st ed.; Marcel Dekker: New York, NY, USA, 1994; pp. 85–104. [Google Scholar]
- Nassif, A.G.; Ibrahim, S.S.; Majdi, H.S.; Alsalhy, Q.F. Ethanol Separation from an Ethanol–Water Solution Using Vacuum Membrane Distillation. Membranes 2022, 12, 807. [Google Scholar] [CrossRef]
- Ramaswamy, V.; Vimalathithan, R.; Ponnusamy, M.V. Synthesis and characterization of BaSO4 nano particles using micro emulsion technique. Adv. Appl. Sci. Res. 2010, 1, 197–204. [Google Scholar]
- Degen, T.; Sadki, M.; Bron, E.; König, U.; Nénert, G. The HighScore suite. Powder Diffr. 2014, 29 (Suppl. S2), S13–S18. [Google Scholar] [CrossRef]
- Jones, F.; Jones, P.; Ogden, M.I.; Richmond, W.R.; Rohl, A.L.; Saunders, M. The interaction of EDTA with barium sulphate. J. Colloid. Interf. Sci. 2007, 316, 553–561. [Google Scholar] [CrossRef] [PubMed]
- Meir, L.; Leslie, L. The effect of solvent on crystal growth and morphology. Chem. Eng. Sci. 2001, 56, 2245–2253. [Google Scholar]
- Brunsteiner, M.; Jones, A.G.; Pratola, F.; Price, S.L.; Simons, S.J.R. Toward a Molecular Understanding of Crystal Agglomeration. Cryst. Growth Des. 2005, 5, 3–16. [Google Scholar] [CrossRef]
- Wójcik, J.A.; Jones, A.G. Particle disruption of precipitated CaCO3 crystal agglomerates in turbulently agitated suspensions. Chem. Eng. Sci. 1998, 53, 1097–1101. [Google Scholar] [CrossRef]


| Solvent | Dipole Moment (D) | Dielectric Constant | Miscibility with Water |
|---|---|---|---|
| Water | 1.85 | 78.5 | --- |
| Ethanol | 1.69 | 24 | Total |
| Propan-1-ol | 1.68 | 20 | Partial |
| Composition | V of BaCl2 (mL) (5 × 10⁻³ M) | V of Na2SO4 (mL) (5 × 10⁻³ M) | V (mL) of Add Organic Solvent | Molarity of Added Organic Solvent (M) | Mass of Precipitate | |
|---|---|---|---|---|---|---|
| Solution | ||||||
| Solution S0 | 100 | 100 | 0 | 0 | 0.2131 | |
| Solution S1 | 100 | 100 | 10 mL of Ethanol | 0.68 | -- | |
| Solution S2 | 100 | 100 | 50 mL of Ethanol | 3.43 | 0.1940 | |
| Solution S3 | 100 | 100 | 10 mL of Propan-1-ol | 0.53 | -- | |
| Solution S4 | 100 | 100 | 50 mL of Propan-1-ol | 2.66 | 0.1882 | |
Disclaimer/Publisher’s Note: The statements, opinions and data contained in all publications are solely those of the individual author(s) and contributor(s) and not of MDPI and/or the editor(s). MDPI and/or the editor(s) disclaim responsibility for any injury to people or property resulting from any ideas, methods, instructions or products referred to in the content. |
© 2025 by the authors. Licensee MDPI, Basel, Switzerland. This article is an open access article distributed under the terms and conditions of the Creative Commons Attribution (CC BY) license (https://creativecommons.org/licenses/by/4.0/).
Share and Cite
Mechi, L.; S. K. Alshammri, K.; Alsukaibi, A.K.D.; Azaza, H.; Alimi, F.; Hedhili, F.; Moussaoui, Y. A Study of the Kinetics, Structure, and Morphology of the Effect of Organic Additives on Barium Sulfate Precipitation Reactions in Propan-1-ol–Water and Ethanol–Water Mixture Solutions. Processes 2025, 13, 1471. https://doi.org/10.3390/pr13051471
Mechi L, S. K. Alshammri K, Alsukaibi AKD, Azaza H, Alimi F, Hedhili F, Moussaoui Y. A Study of the Kinetics, Structure, and Morphology of the Effect of Organic Additives on Barium Sulfate Precipitation Reactions in Propan-1-ol–Water and Ethanol–Water Mixture Solutions. Processes. 2025; 13(5):1471. https://doi.org/10.3390/pr13051471
Chicago/Turabian StyleMechi, Lassaad, Khalid S. K. Alshammri, Abdulmohsen K. D. Alsukaibi, Hanen Azaza, Fathi Alimi, Fekhra Hedhili, and Younis Moussaoui. 2025. "A Study of the Kinetics, Structure, and Morphology of the Effect of Organic Additives on Barium Sulfate Precipitation Reactions in Propan-1-ol–Water and Ethanol–Water Mixture Solutions" Processes 13, no. 5: 1471. https://doi.org/10.3390/pr13051471
APA StyleMechi, L., S. K. Alshammri, K., Alsukaibi, A. K. D., Azaza, H., Alimi, F., Hedhili, F., & Moussaoui, Y. (2025). A Study of the Kinetics, Structure, and Morphology of the Effect of Organic Additives on Barium Sulfate Precipitation Reactions in Propan-1-ol–Water and Ethanol–Water Mixture Solutions. Processes, 13(5), 1471. https://doi.org/10.3390/pr13051471