Article

Three-Dimensional Numerical Simulation of Effective Thermal Conductivity and Fractal Dimension of Non-Aqueous Phase Liquid-Contaminated Soils at Mesoscopic Scale

1
Shandong Provincial Geo-Mineral Engineering Exploration Institute, Shandong Provincial Bureau of Geology & Mineral Resources, Jinan 250014, China
2
Shandong Engineering Research Center for Environmental Protection and Remediation on Groundwater, Jinan 250014, China
3
Key Laboratory of Geological Disaster Risk Prevention and Control, Emergency Management Department of Shandong Province, Jinan 250014, China
4
No.1 Geological Team of Shandong Provincial Bureau of Geology and Mineral Resources (Shandong No.1 Institute of Geology and Mineral Resources Exploration), Jinan 250100, China
5
Shandong Cancer Hospital and Institute, Shandong First Medical University and Shandong Academy of Medical Sciences, Jinan 250117, China
*
Author to whom correspondence should be addressed.
Processes 2025, 13(5), 1456; https://doi.org/10.3390/pr13051456
Submission received: 25 March 2025 / Revised: 1 May 2025 / Accepted: 4 May 2025 / Published: 9 May 2025
(This article belongs to the Section Chemical Processes and Systems)

Abstract

:
In situ thermal desorption is one of the most promising remediation techniques for soils contaminated with non-aqueous phase liquids (NAPLs), but its remediation efficiency is limited by the thermal conductivity (k) of NAPL-contaminated soils. The fractal dimension is an important factor affecting k. To systematically study the influence of the fractal dimension on k, firstly, this research establishes a three-dimensional numerical model of NAPL-contaminated soils and calculates its k. Subsequently, the reliability of the numerical simulation results is verified through experiments. Combining the numerical simulation method with Hausdorff fractal theory, we explored the relationship between the fractal dimension and k. This research shows that k decreases with increasing porosity and increases with increasing saturation. The liquid phase can form a “liquid bridge” between solid phases, greatly shortening the path of heat flux and increasing k. k is more affected by porosity. With the increase in porosity, the pore fractal dimension and liquid phase fractal dimension of NAPL-contaminated soils increase, while the solid phase fractal dimension and pore curvature fractal dimension decrease. The fractal dimension of the liquid phase increases with the increase in NAPL content. k increases with the increase in the solid phase fractal dimension, liquid phase fractal dimension, and pore curvature fractal dimension and decreases with the increase in the pore fractal dimension. This study provides a basis for the investigation of the thermal conductivity of NAPL-contaminated soils and the development of in situ thermal desorption technology.

1. Introduction

With the development of the economy, many petrochemical sites are polluted by NAPLs, which are volatile, difficult to degrade, and often toxic, damaging local ecosystems and endangering human health [1,2,3]. At present, in situ thermal desorption is considered a promising NAPL-contaminated soil remediation technology [4]. Its technical principle is to heat the contaminated soils in situ, separate the pollutants from the soil, and discharge them after centralized treatment [5]. The thermal conductivity of polluted soils is an important factor in the diffusion of heat in polluted soil, which restricts the remediation efficiency of in situ thermal desorption [6]. Soil has a large number of pore structures, which will directly affect the thermal conductivity of NAPL-contaminated soils [7]. This affects the repair efficiency of in situ thermal desorption. There are many studies on the distribution of pore parameters in geotechnical materials and their impact on thermal conductivity from the perspective of fractal geometry theory [8,9,10]. Hu et al. found through experiments that the curvature fractal dimension and fractal tree-like tortuosity characteristics of shale have a negative impact on thermal conductivity [8]. Shen et al. [11] compared the quality fractal dimension with the volume fractal dimension by comparative analysis. The volume fractal dimension formula was found to be more reasonable than the mass fractal dimension formula, and the most reasonable soil particle measurement method was the LD method. Xiao et al. analyzed the effect of the particle size distribution on the thermal conductivity of geotechnical materials through thermal needle experiments and found that the thermal conductivity of the sample increased with the increase in uniformity coefficient and fractal dimension [12]. Li et al. used ANSYS numerical simulation to simulate the thermal conductivity of rock and soil by changing material and element properties combined with the Fourier thermal transformation law [13]. They found that the effective thermal conductivity of rock and soil decreases exponentially with the increase in the volume fractal dimension. Cai et al. used thermal probe experiments and fractal model theory to elucidate the influence of soil structural parameters on thermal conductivity; that is, the influence of the soil fractal dimension and size ratio on thermal conductivity is relatively small, while the randomness of the soil pore structure has a significant impact on its thermal conductivity [14]. Shen et al. compared the effective thermal conductivity of soil media with indoor experiments and found that the pore structure has a significant impact on the thermal conductivity of unsaturated soil [15]. The effective thermal conductivity of soil gradually decreases with the increase in the pore fractal dimension, porosity, and tortuous fractal dimension. Qin et al. studied the theoretical model of soil’s effective thermal conductivity with different pore development characteristics, based on two-dimensional models and fractal geometry theory, and analyzed the influence of the geometric parameters of pores in soils on soils’ effective thermal conductivity [16]. Based on the development and distribution characteristics of root systems in soils, Huang et al. established using fractal theory a thermal resistance-based root–soil thermal conductivity theoretical model for alpine meadows. They studied the effects of the root area-to-total area ratio, area fractal dimension, and tortuosity fractal dimension on soil thermal conductivity in cold grasslands [17].
In summary, previous studies have mainly focused on uncontaminated soils; however, NAPL pollutants can affect the original thermal conductivity of the soils. In addition, the numerical models used in the fractal theory research of soil thermal conductivity are mostly two-dimensional models, and the existing models cannot reflect the real soil structure. This article uses the four-parameter random generation method (QSGS) to construct a three-dimensional soil structure model, and it uses the Lattice Boltzmann method to calculate its thermal conductivity. The reliability of the three-dimensional soil structure model constructed by QSGS was ultimately verified through series parallel models and indoor thermal conductivity testing experiments. The influence of saturation and porosity on k was studied. On this basis, the Hausdorff fractal theory was used to analyze the relationship between the fractal dimension and k, as well as the mechanism of the influence of the fractal dimension on k. This study provides a theoretical basis for the development and application of in situ thermal desorption remediation technology.

2. Materials and Methods
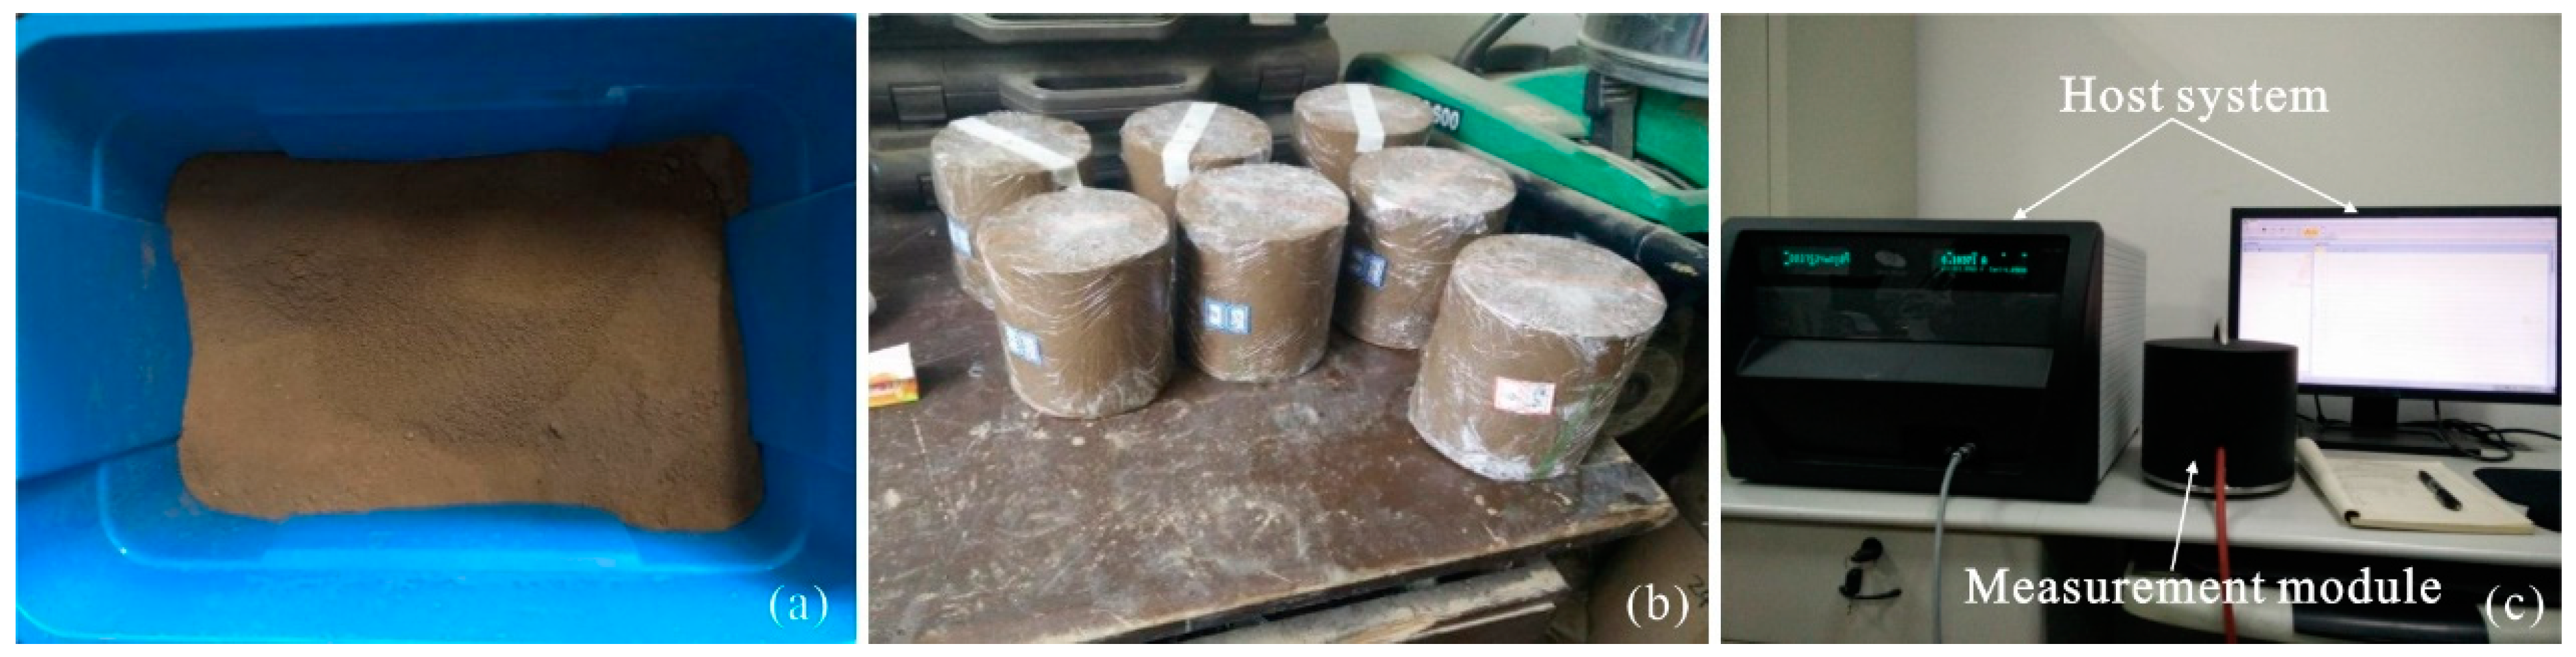
2.1. Materials

We remolded NAPL-contaminated soils by the compaction method [18]. Remolded silty clay samples with a porosity of 35% and diesel content of 8–20% wt.% (not exceeding the liquid limit) were prepared. Finally, we measured the thermal conductivity of the remolded soil samples using a thermal constant analyzer [19]. Figure 1 shows the experimental process.

2.2. Methodology

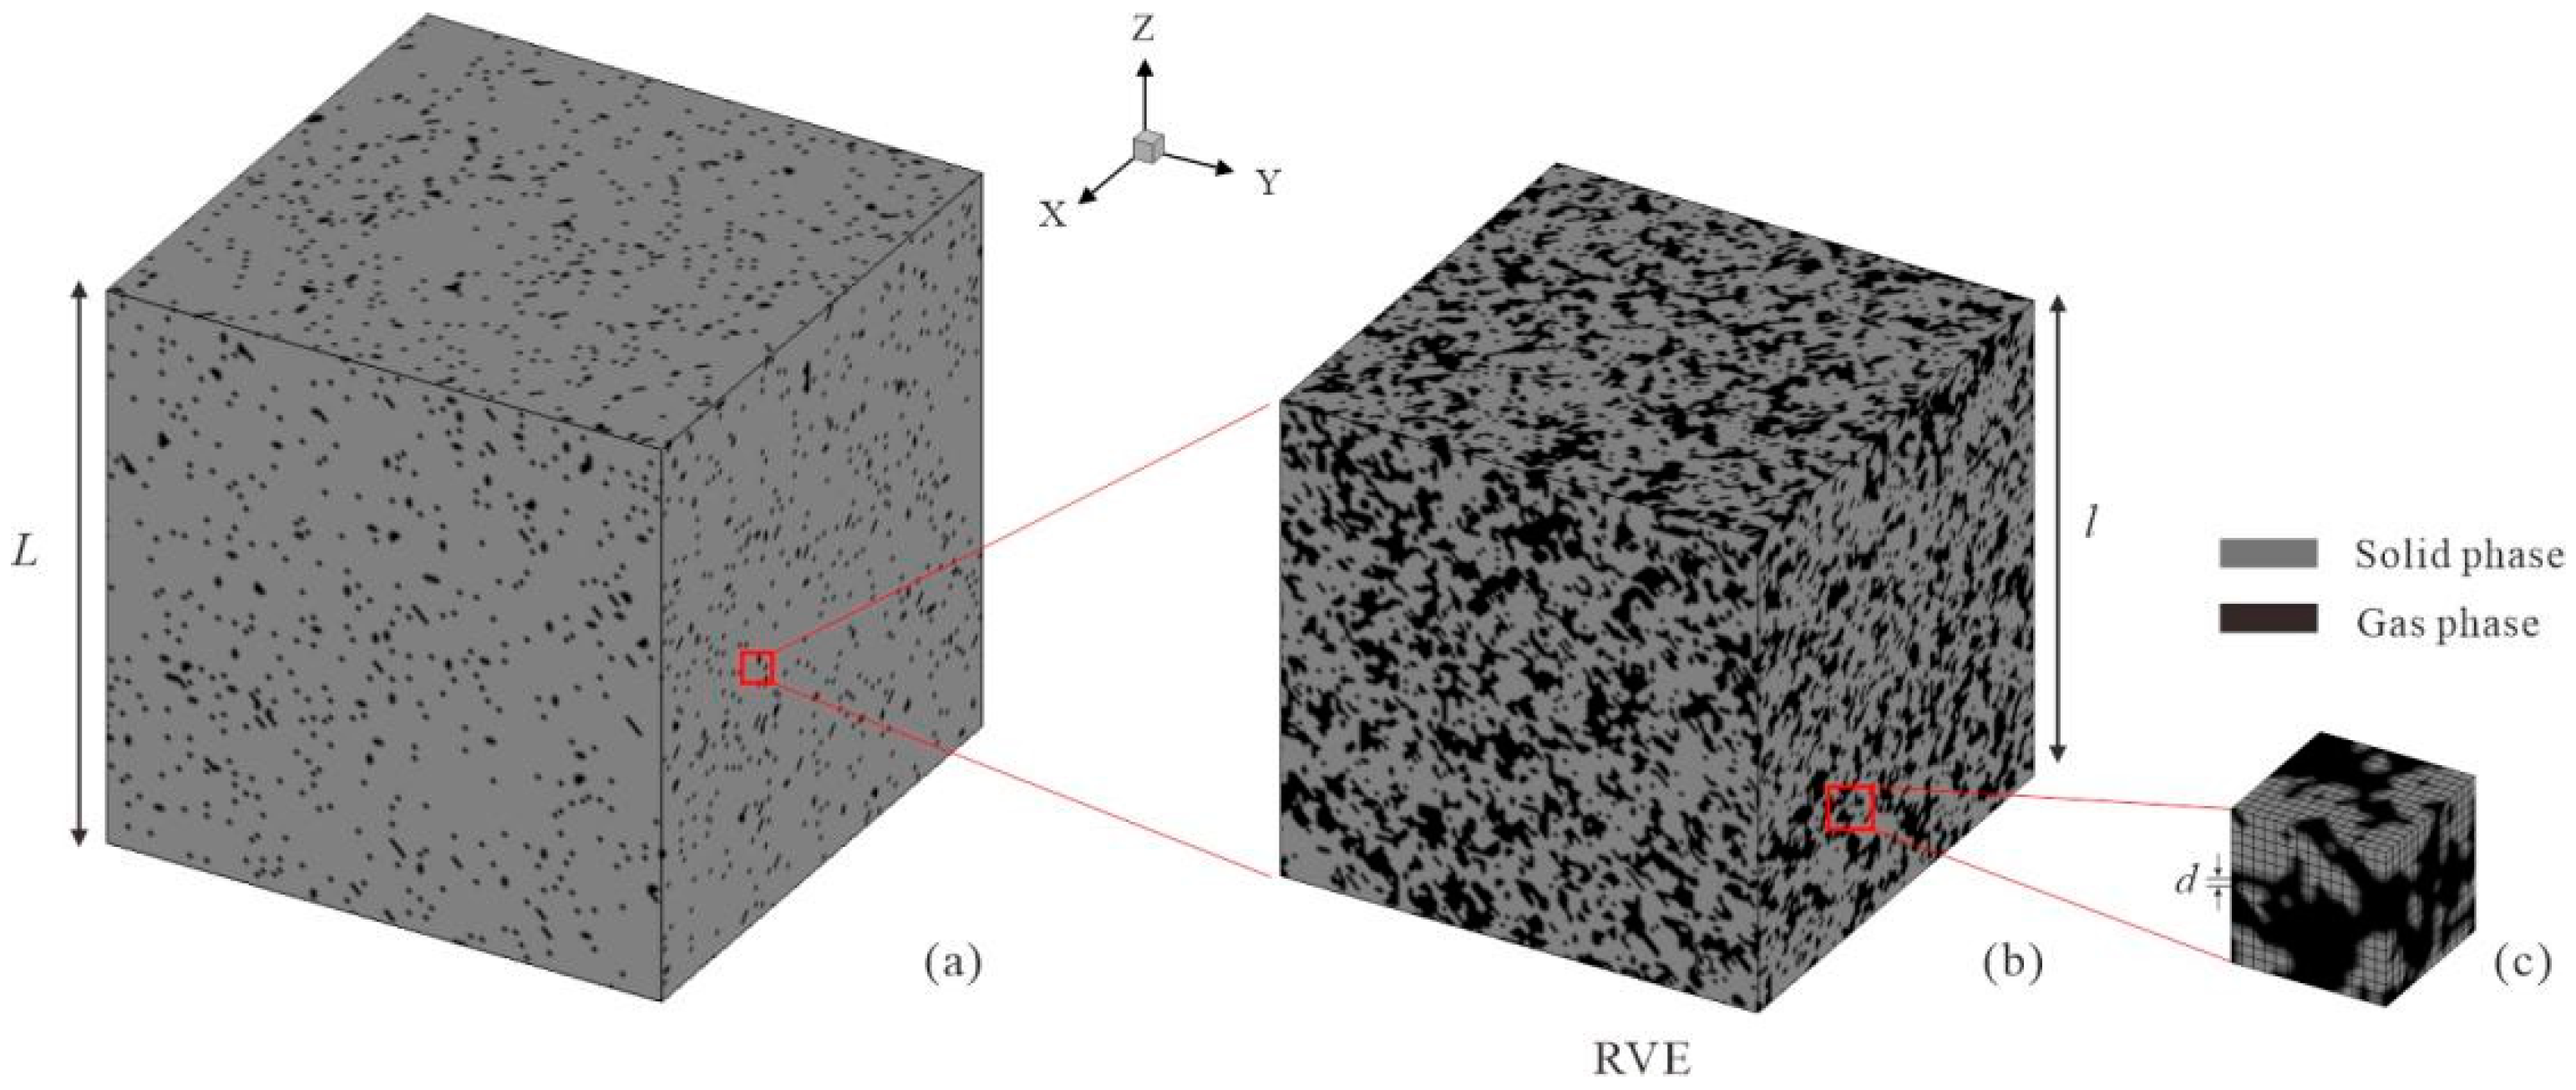
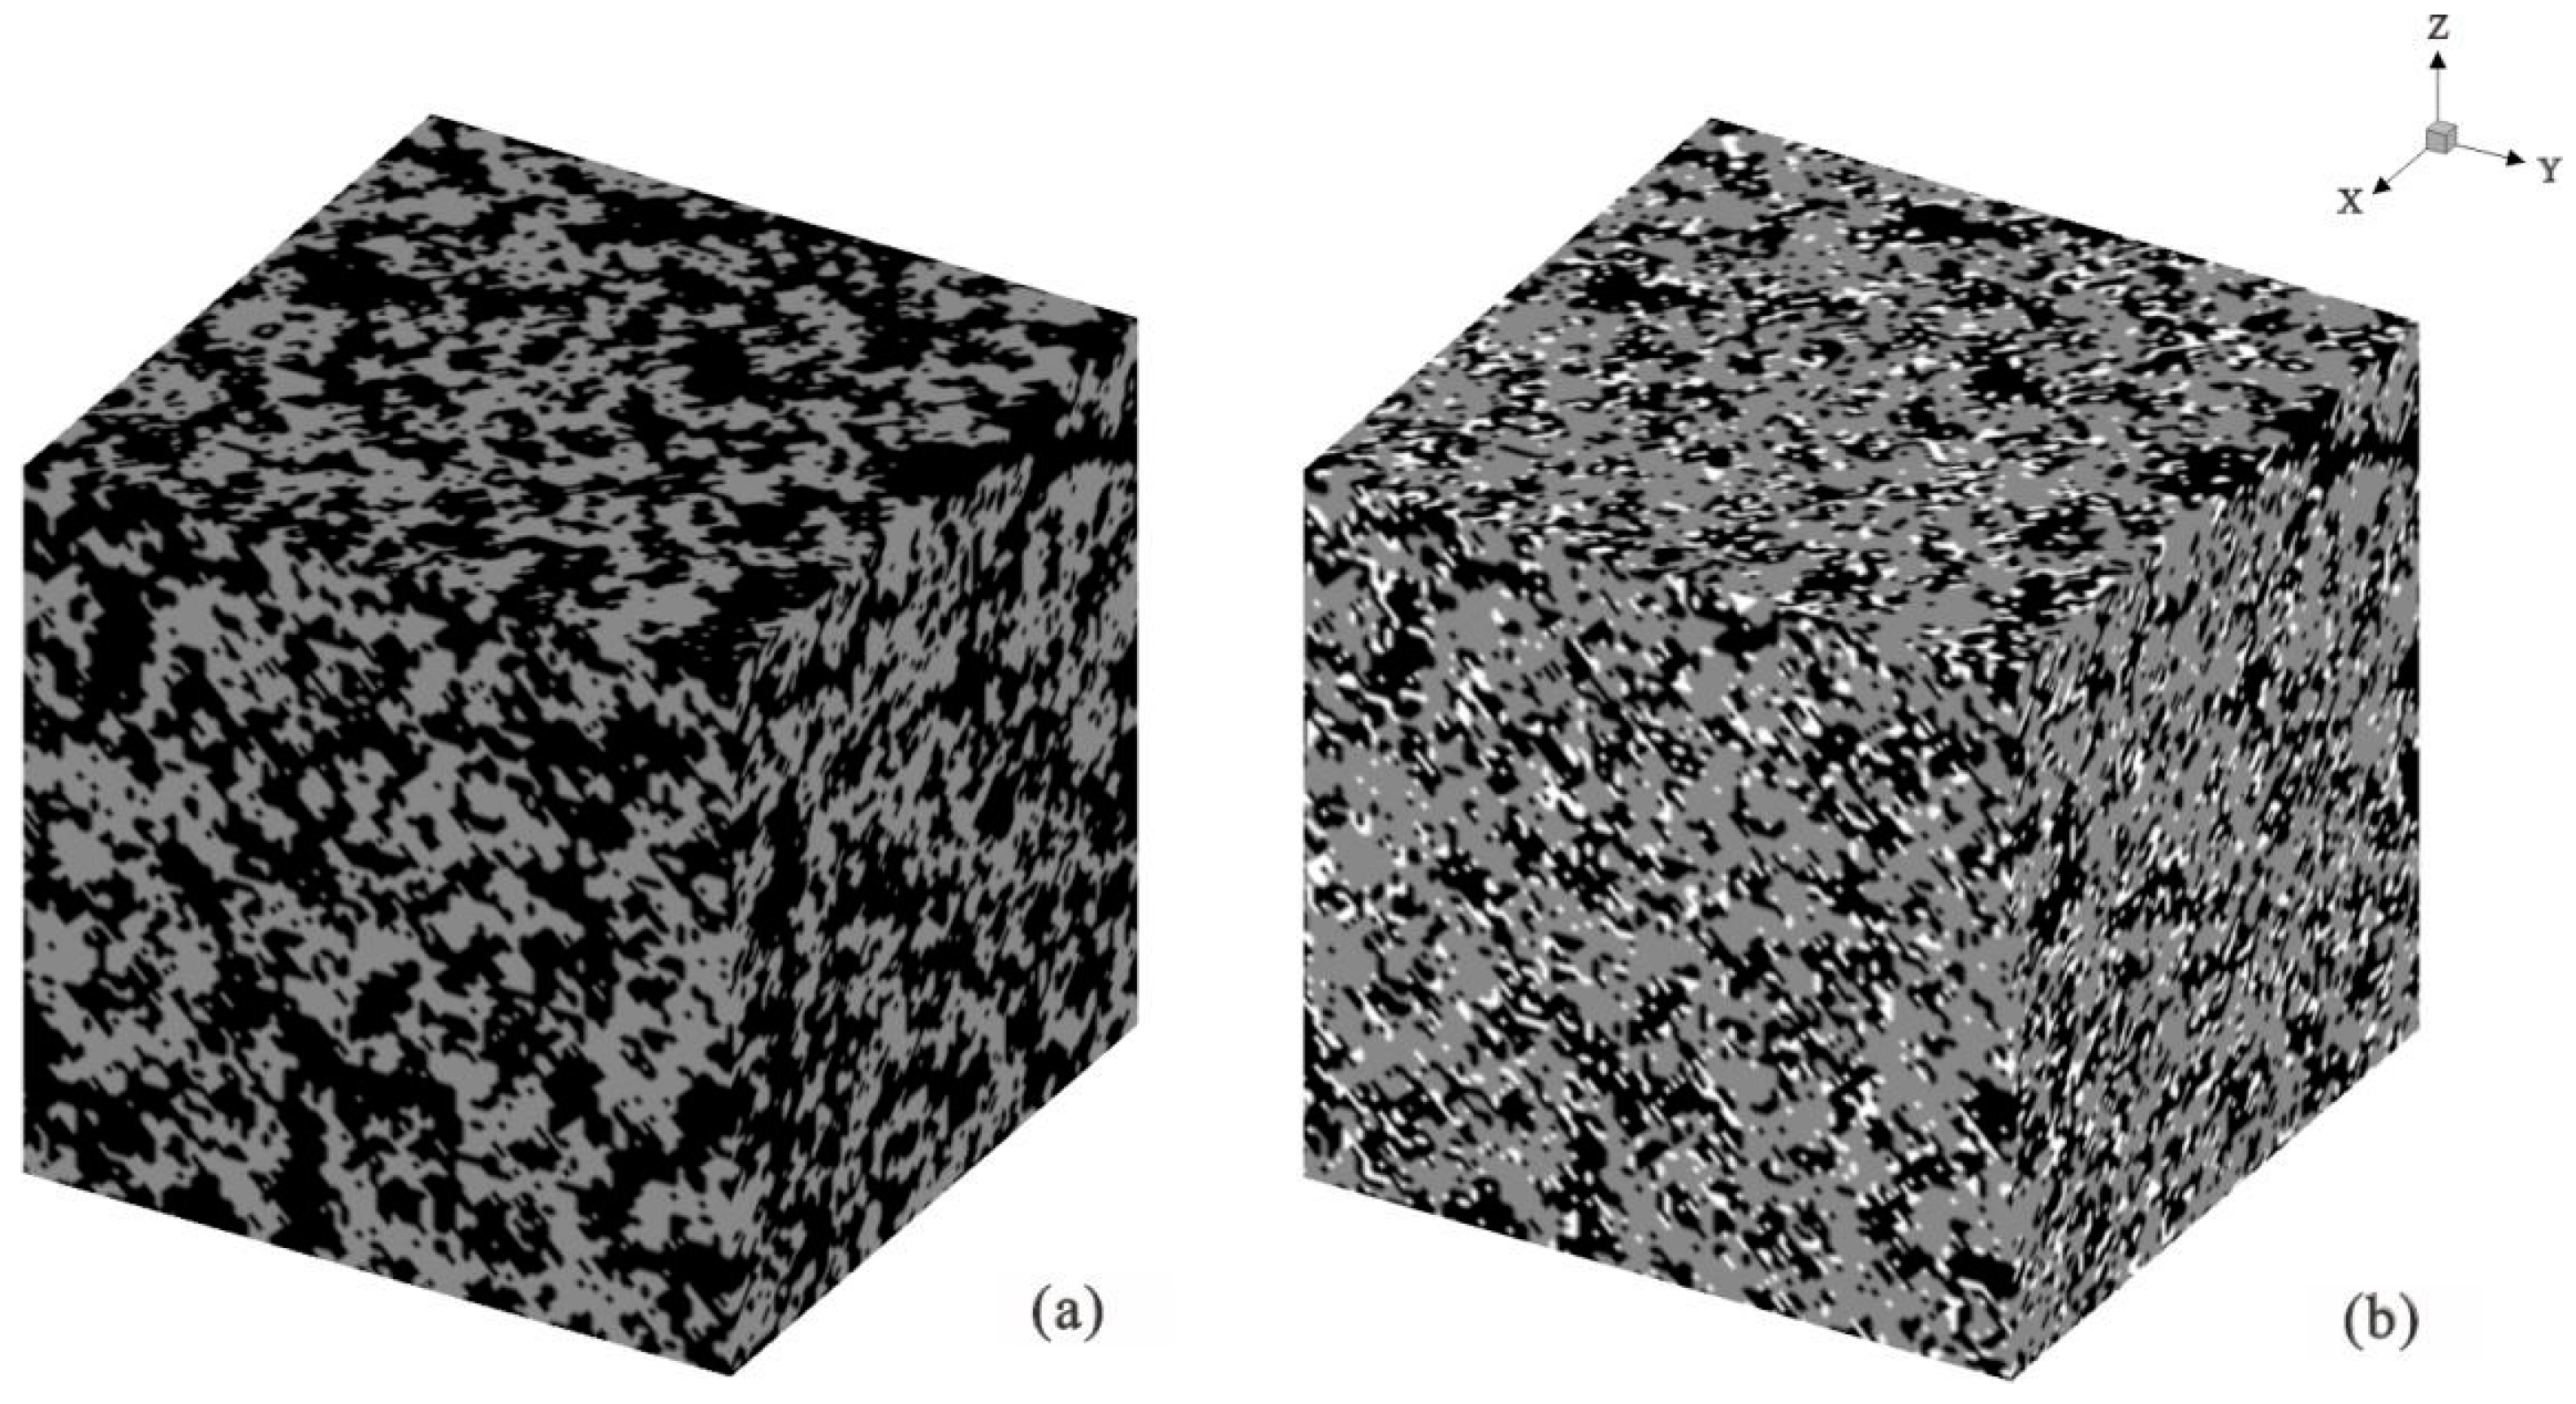
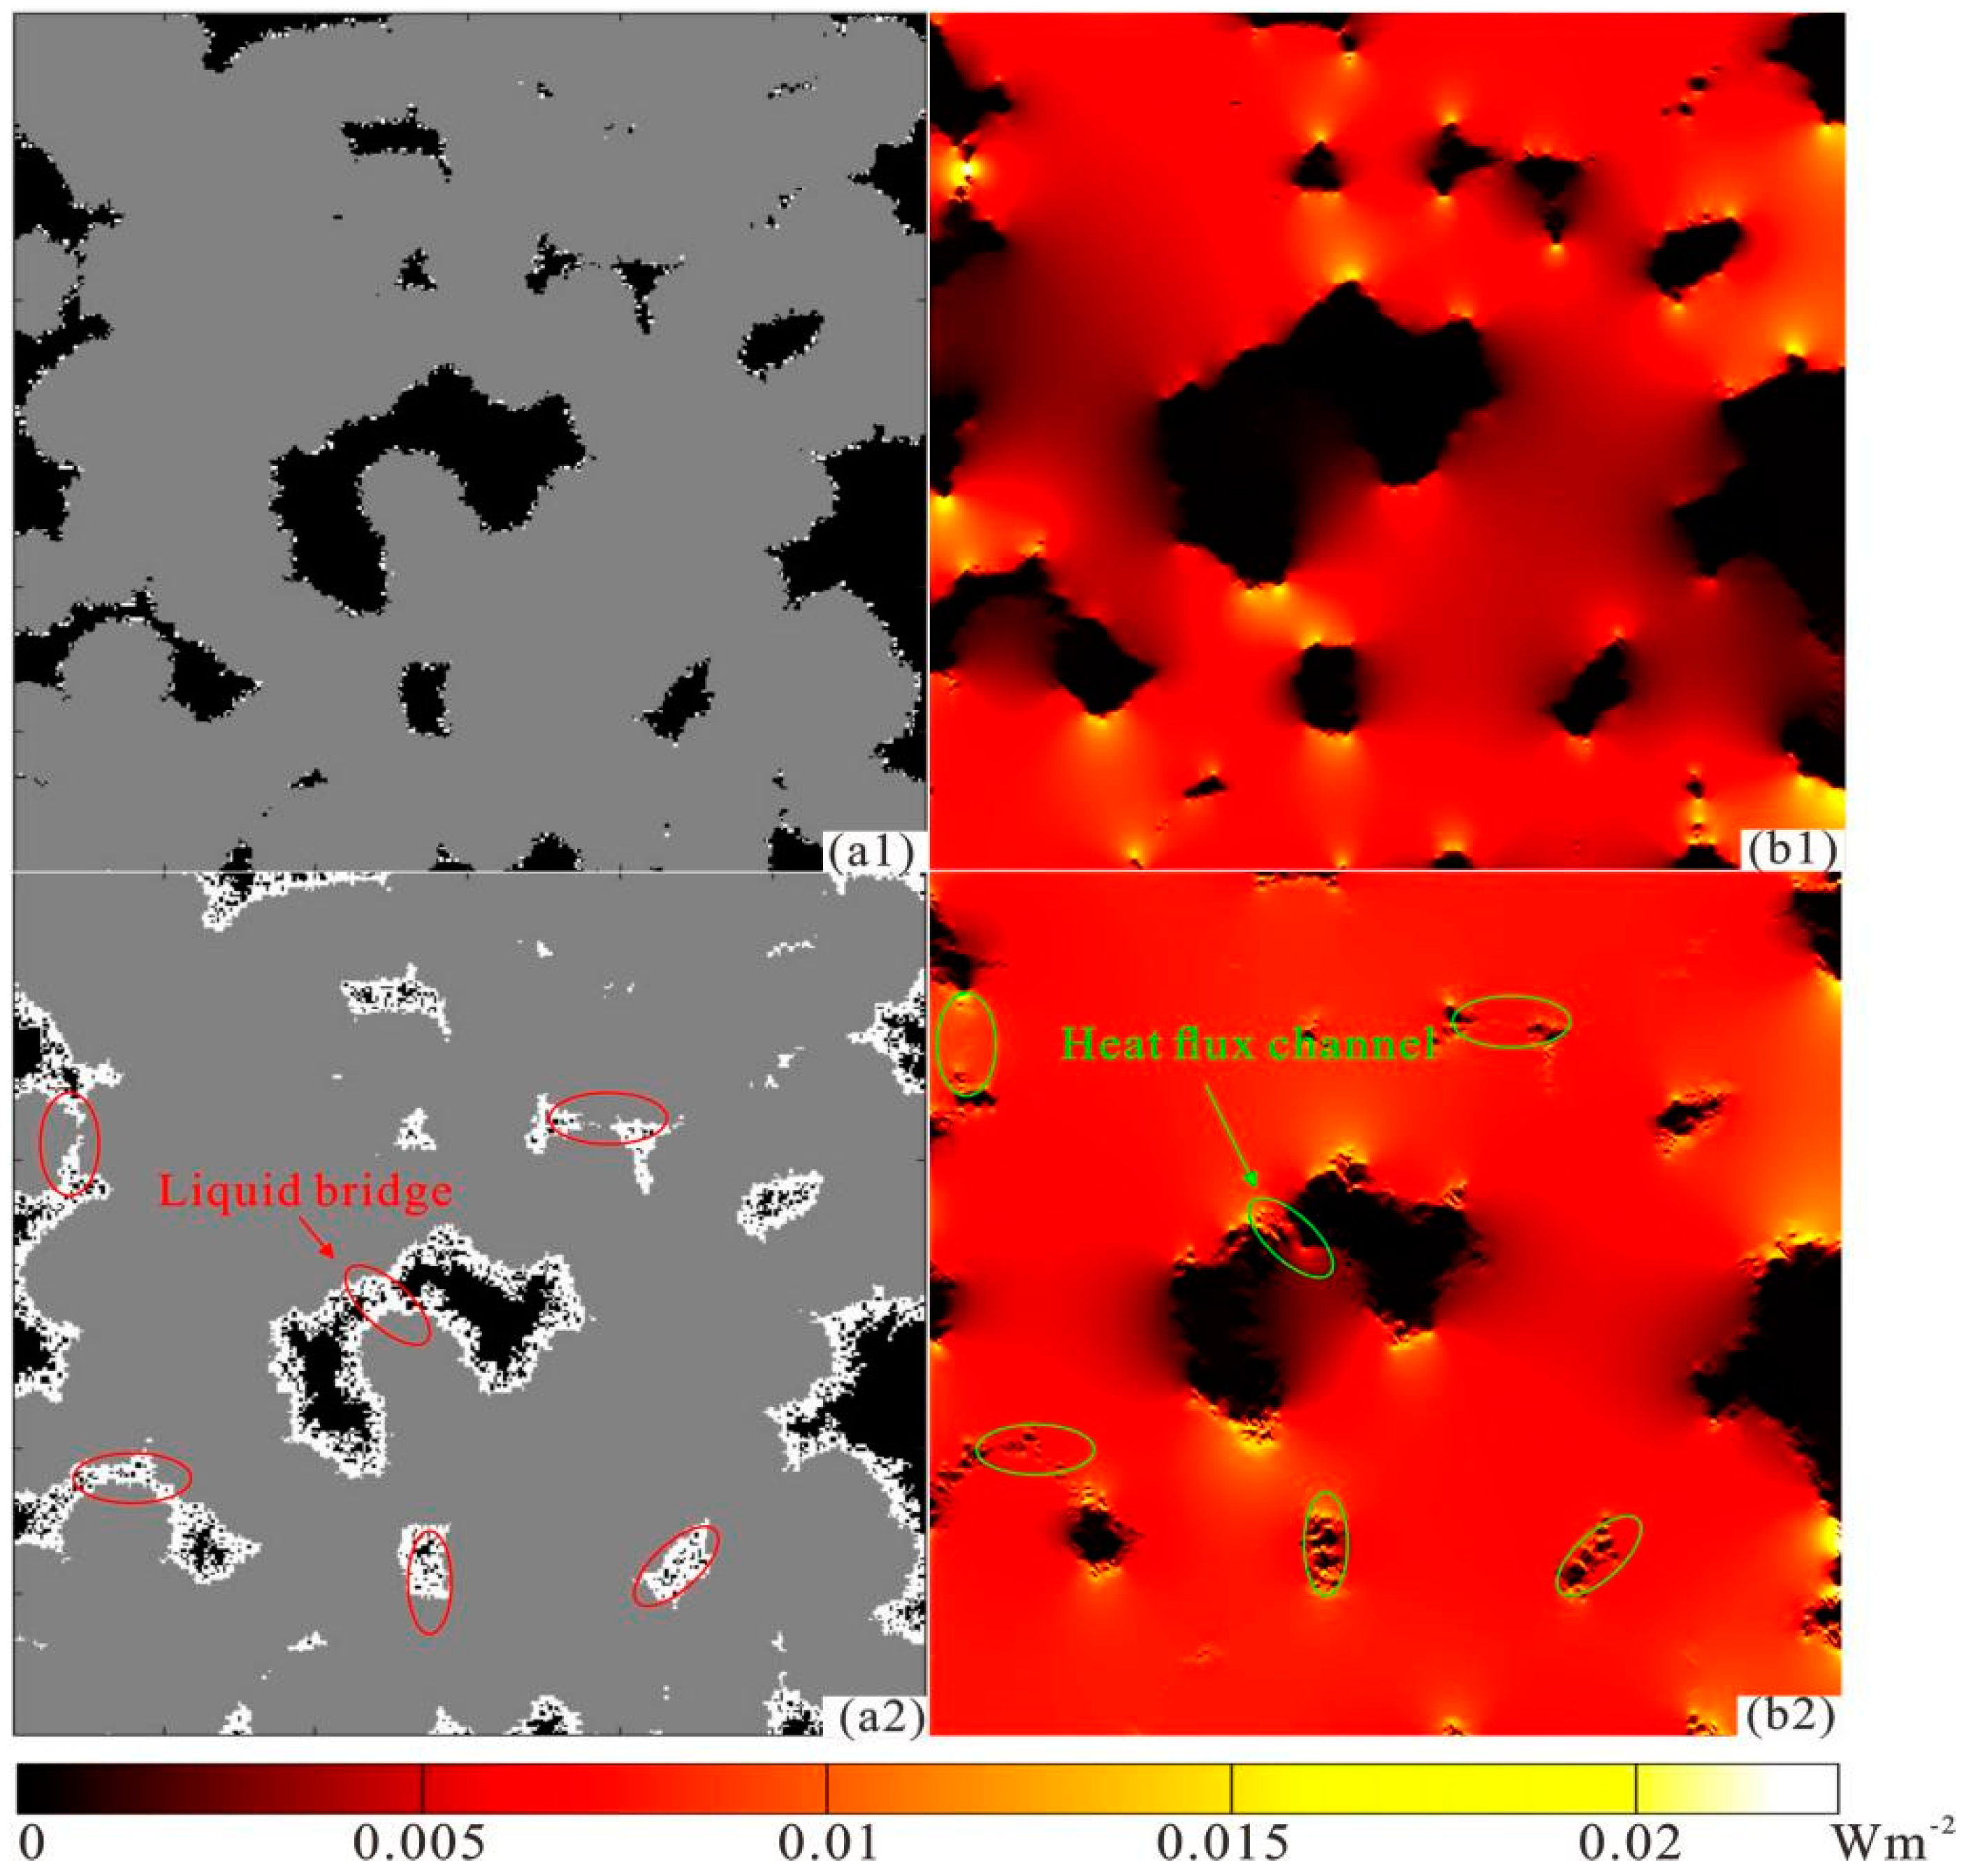
2.2.1. Establishment of NAPL-Contaminated Soil Model

LBM is a mesoscopic method that can be used for calculating heat transfer under multiphase complex boundary conditions [20]. According to the LBM theory, Qian et al. proposed the classical DdQm model [21]. D3Q19 is the most commonly used 3D model, as shown in Figure 2 [22,23].
RVE is the basis for establishing NAPL-contaminated soil models [18,22,24,25]. As shown in Figure 3, l and L, respectively, represent RVE and the macroscopic dimension of the soil, and d represents the microscopic characteristic dimension of the soil. The porous media model established by QSGS and the real model have high similarity compared with other modeling methods [18]. QSGS controls the structure of soil models through four parameters (Cd, Di, Pn, and Ii1,2) [25,26,27]. NAPL-contaminated soil is a special porous medium. The specific parameters are Di=1–6 = 4Di=7–18, Cd = 0.02, Ioo,o = 0.1, Ioo,s = 0.9 [18,28,29,30].
The model grid established by QSGS is 100 × 100 × 100. The cell size is 1. Meanwhile, the saturation (So) is used to normalize the diesel content of different porosity models. The constructed polluted soil model is shown in Figure 4.

2.2.2. Calculation of k

The two planes perpendicular to the X direction are the heating interface and the testing interface, while the four planes parallel to the X direction are the adiabatic boundaries. The temperatures of the test interface and the heating interface are 20 °C and 22 °C, respectively. The heat flow balance method is used to solve the discrete equation of node temperature in the model grid, to determine k. k is obtained by Formula (1).
k = L q d A Δ T d A
where q is thermal flux; k is the thermal conductivity; the temperature difference between the test interface and heating interface is ΔT; and the distance is L.
The model calculation parameters are ks = 2.38 Wm−1°C−1 (the thermal conductivity of diesel oil), kg = 0.024 Wm−1°C−1 (the thermal conductivity of air), and ko = 0.127 Wm−1°C−1 (the thermal conductivity of soil particles) [18,31,32,33,34,35].
Figure 5 shows the heat flux distribution and temperature field of contaminated soil models with porosities of 25% and 45%.
Figure 6 shows the heat flux distribution and temperature field of contaminated soil models with saturation levels of 0.2 and 0.8.

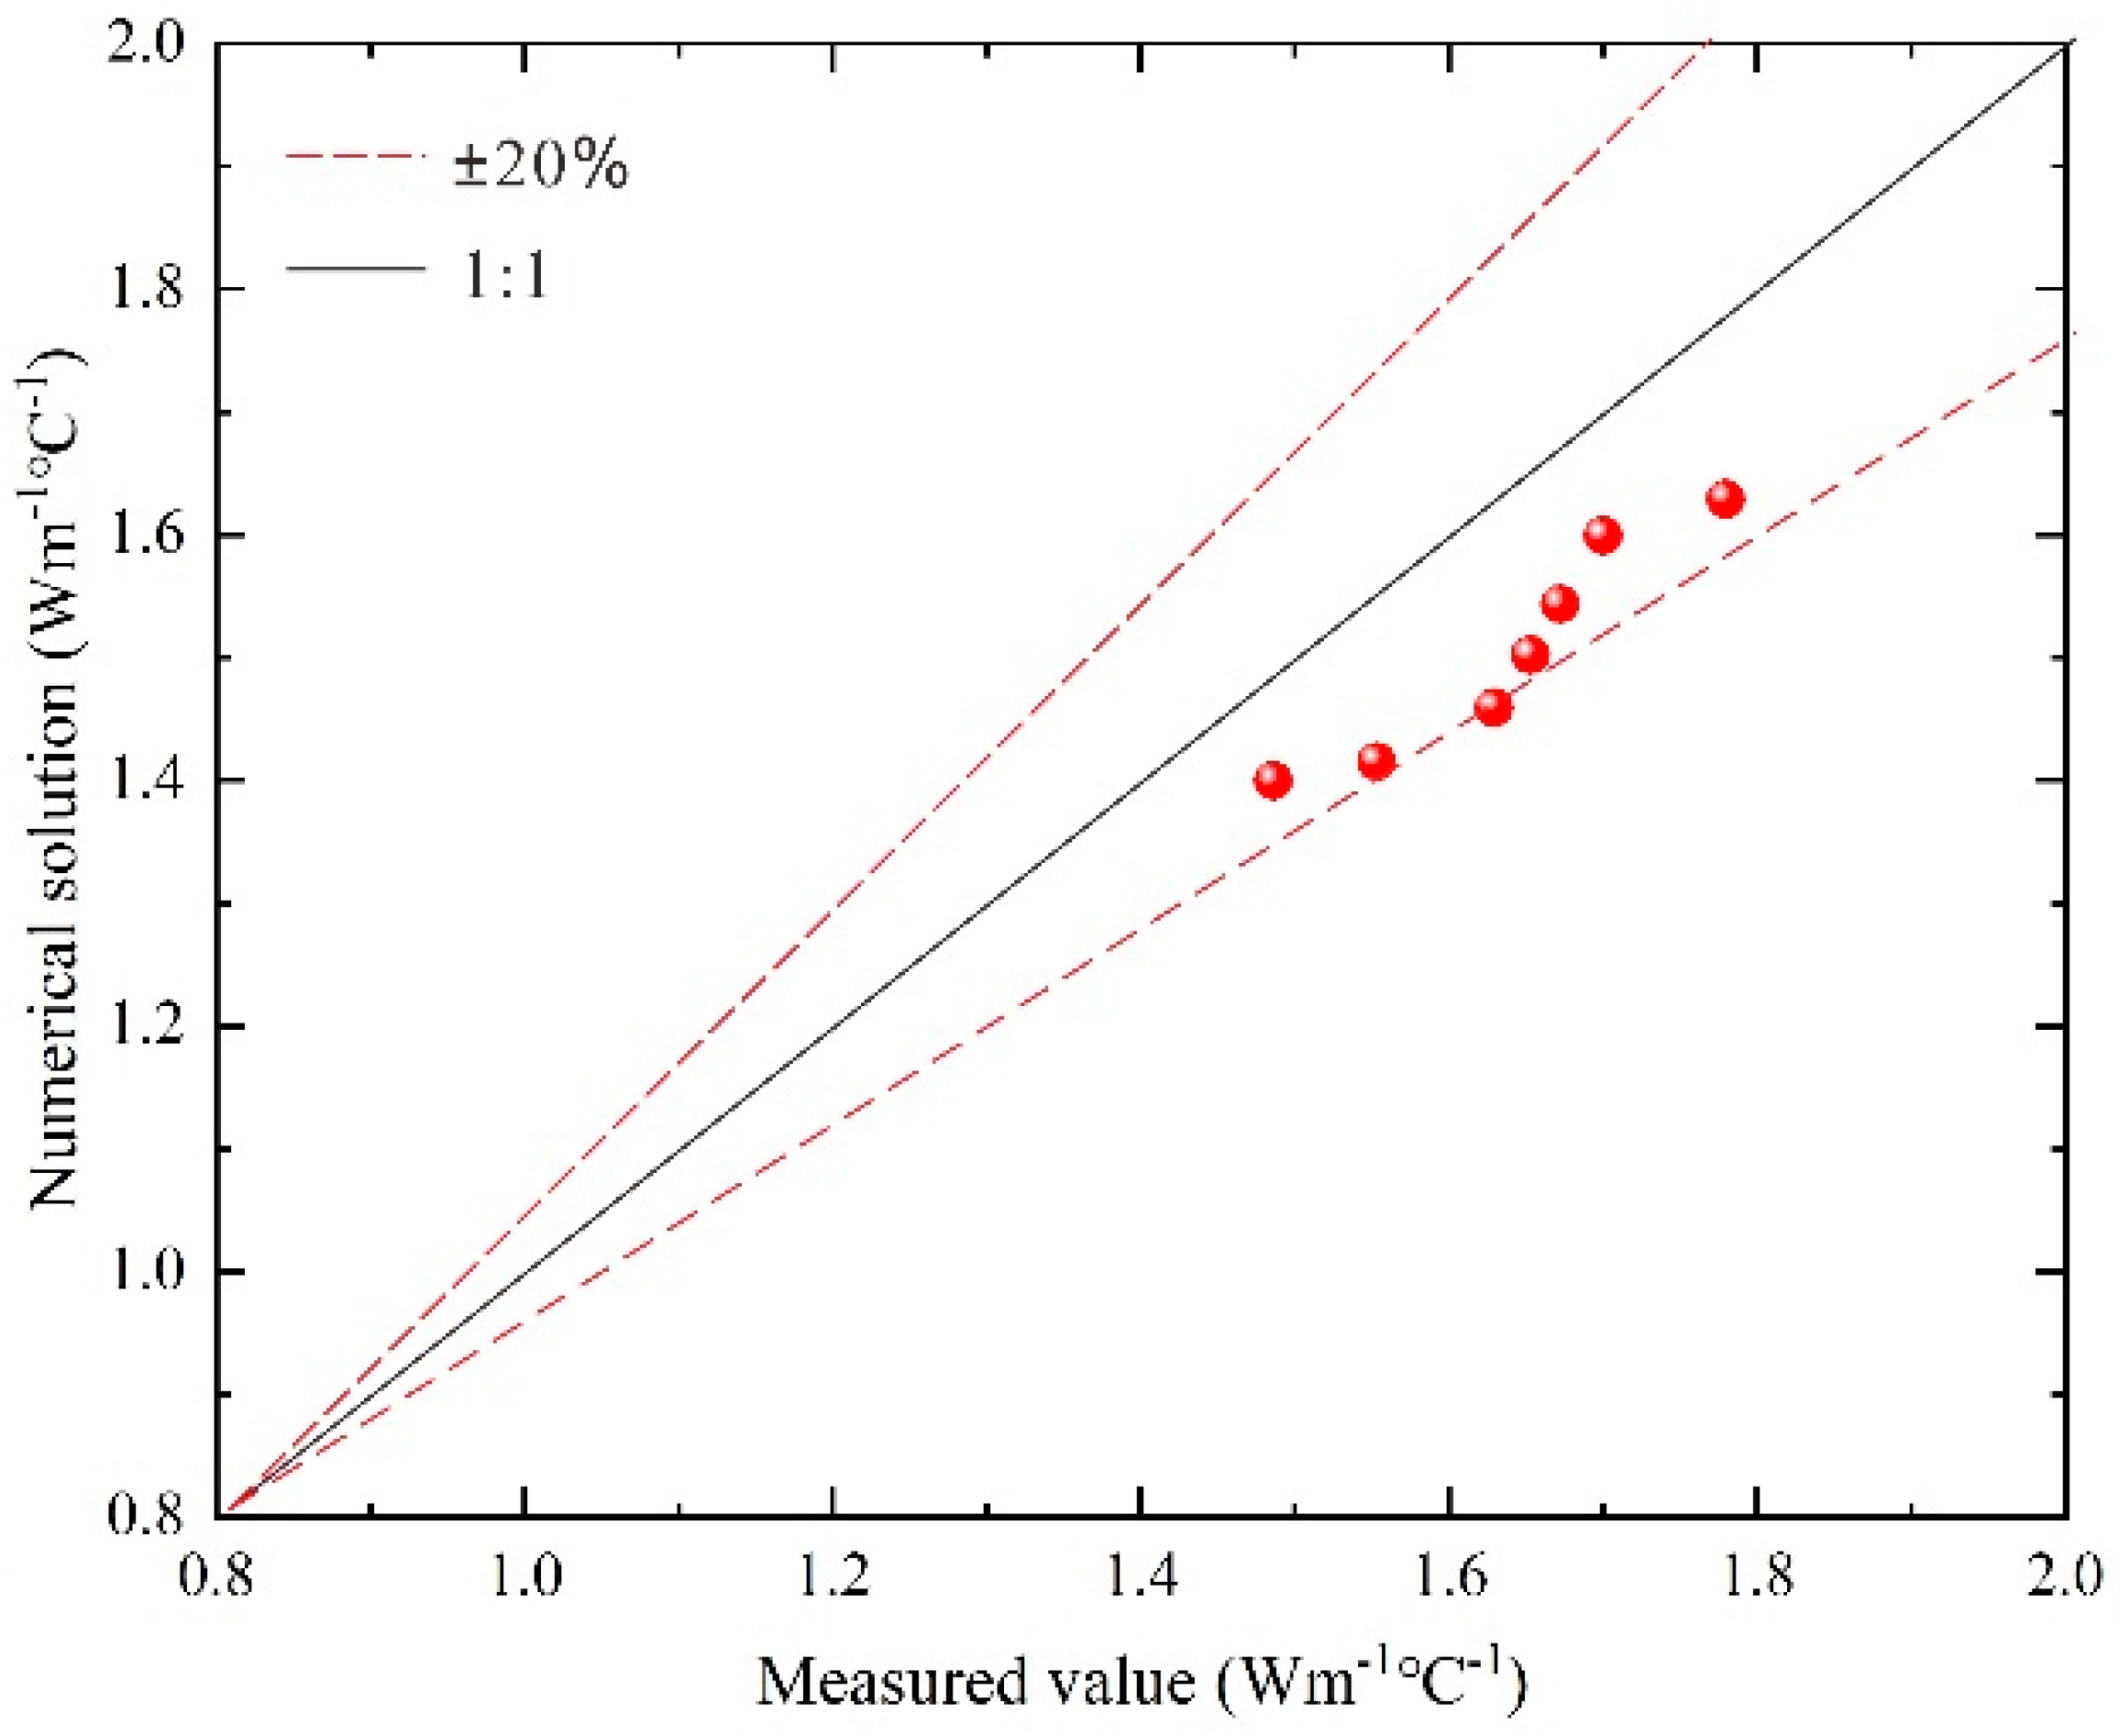
2.3. Verification of Numerical Models

The program is verified in the series mode and parallel mode before numerical simulation [36,37]. The theoretical calculation equation of k in the two basic modes is
k = 1 ε k 1 + 1 ε k 2   ,   Series   model   k = ε k 1 + 1 ε k 2   ,   Parallel   model
The comparison between the theoretical calculation values and numerical simulation results of the two models is shown in Figure 7. This indicates that the numerical calculation results have high reliability.
The internal structure of the model generated by QSGS is random, so a random seed algorithm is used to fix the structure of the model [20,38]. Finally, the LBM is used to calculate k. As shown in Figure 8, the numerical simulation values of the models fluctuate within ±20% of the measured values, indicating the reliability of the results obtained by the numerical calculation [39].

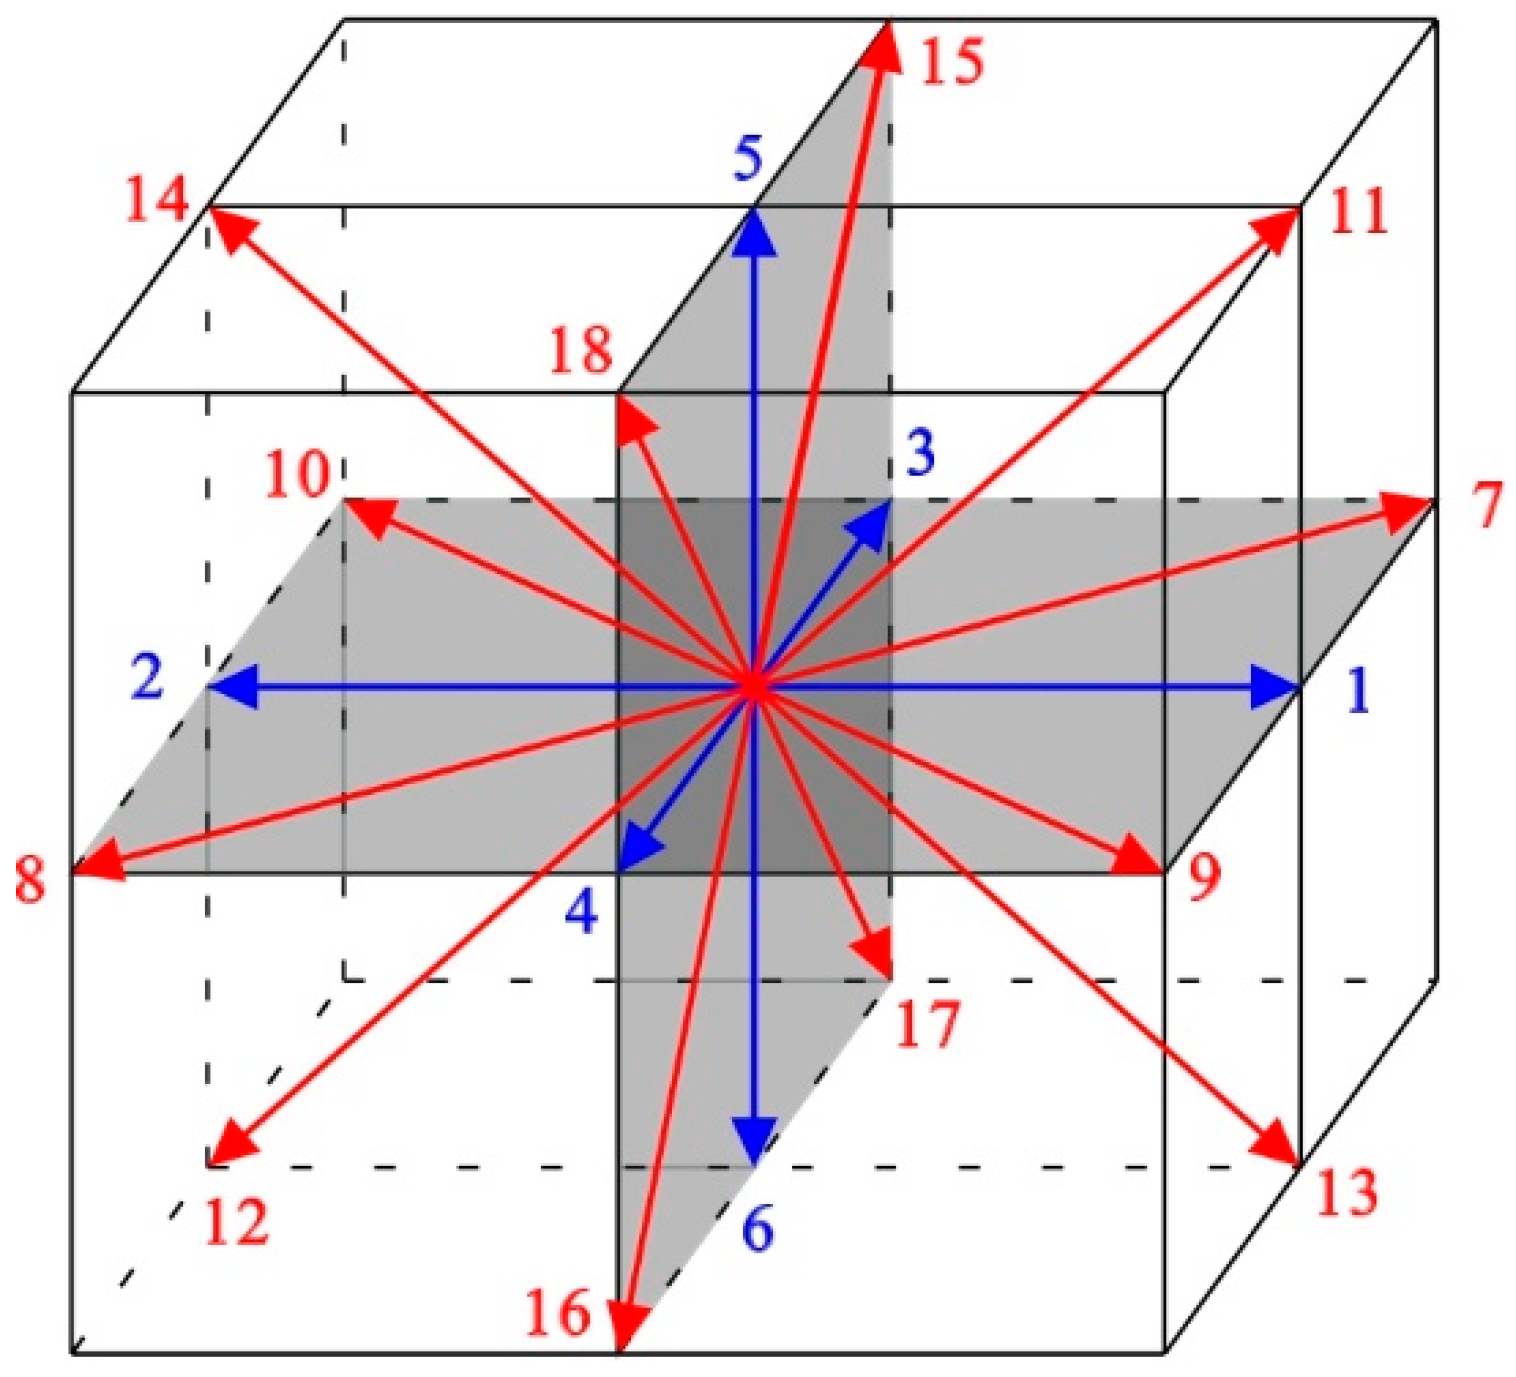
2.4. Hausdorff Fractal Dimension Method

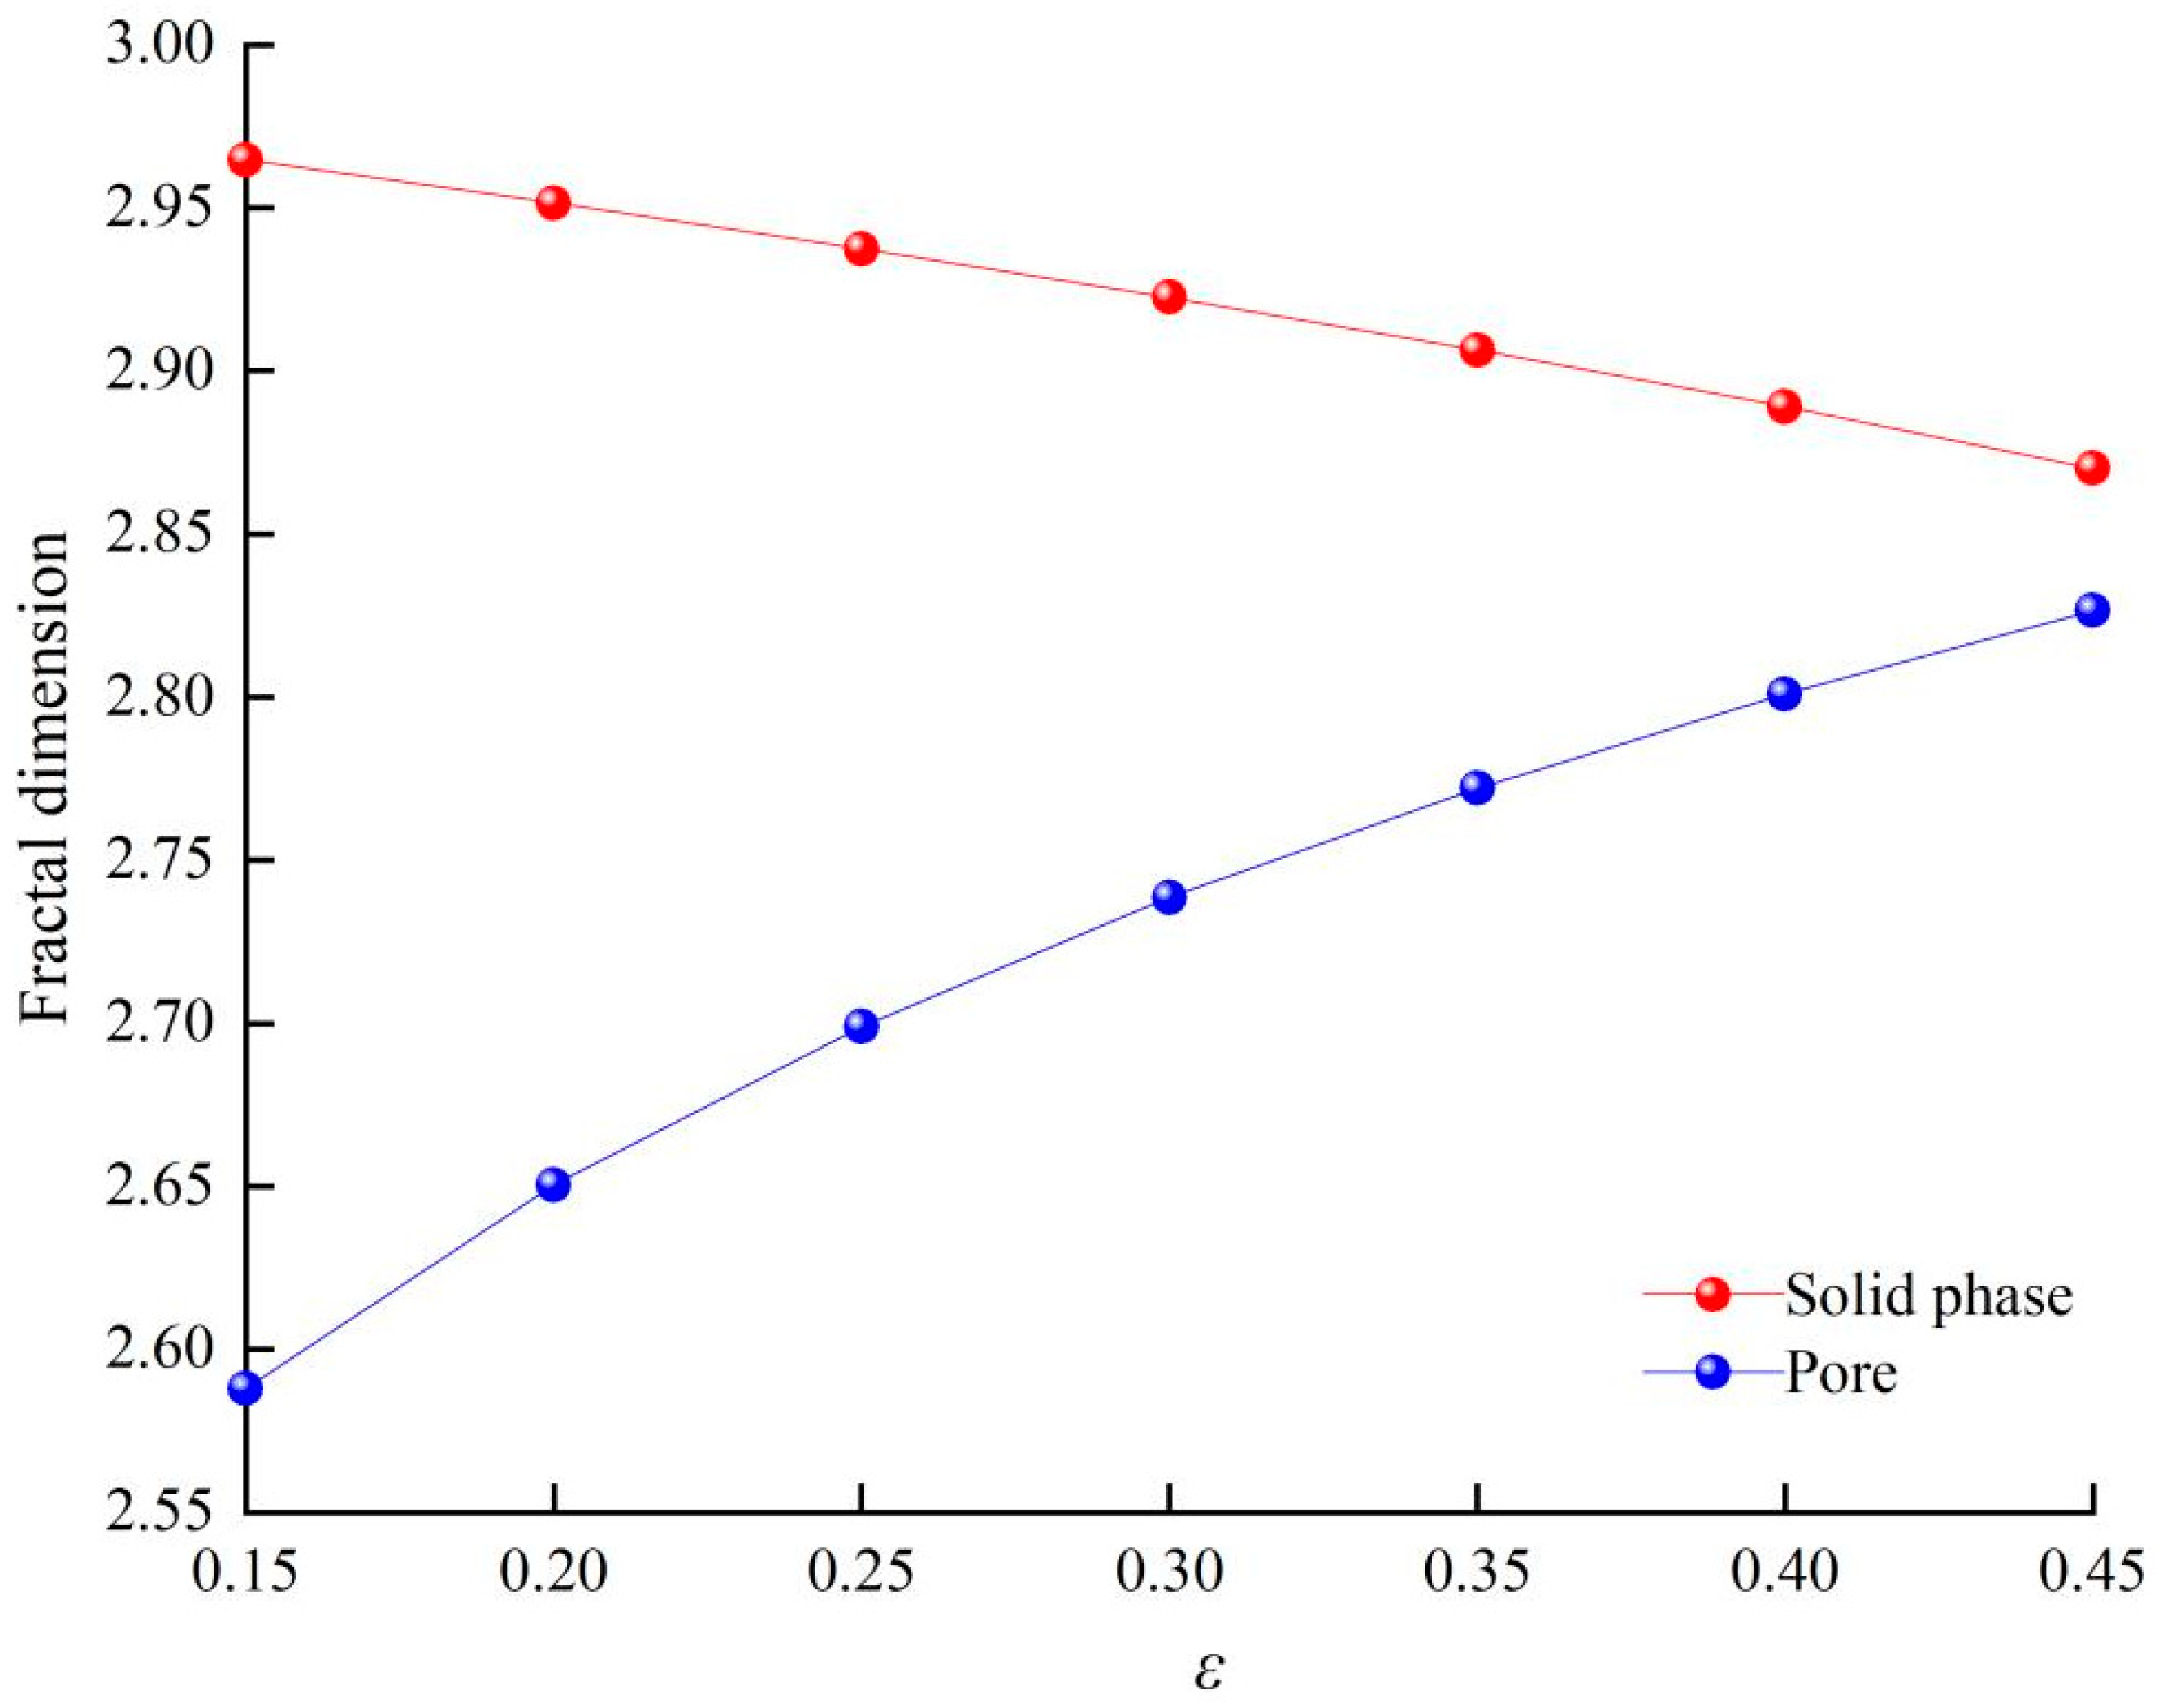
2.4.1. Fractal Dimensions of Solid Phase and Pore

According to the Hausdorff fractal dimension calculation method, the fractal dimensions of the solid phase and pores in polluted soil are
D fs = ln b 3 n ln b = ln b 3 1 ε ln b
D f = ln b 3 l d D E n ln b = ln b 3 ε ln b
where Dfs is the fractal dimension of the solid phase; Df is the fractal dimension of the pore; b is the scale factor (b = l/d); d is the size of the cell; ε is the porosity; and DE is the Euclid fractal dimension (in three-dimensional space, DE = 3). When ε = 0 and Dfs = 3, the solid phase is Euclid geometric fractal; when ε = 1 and Df = 3, the pore is Euclid geometric fractal. In this paper, l = 100 and d = 1.

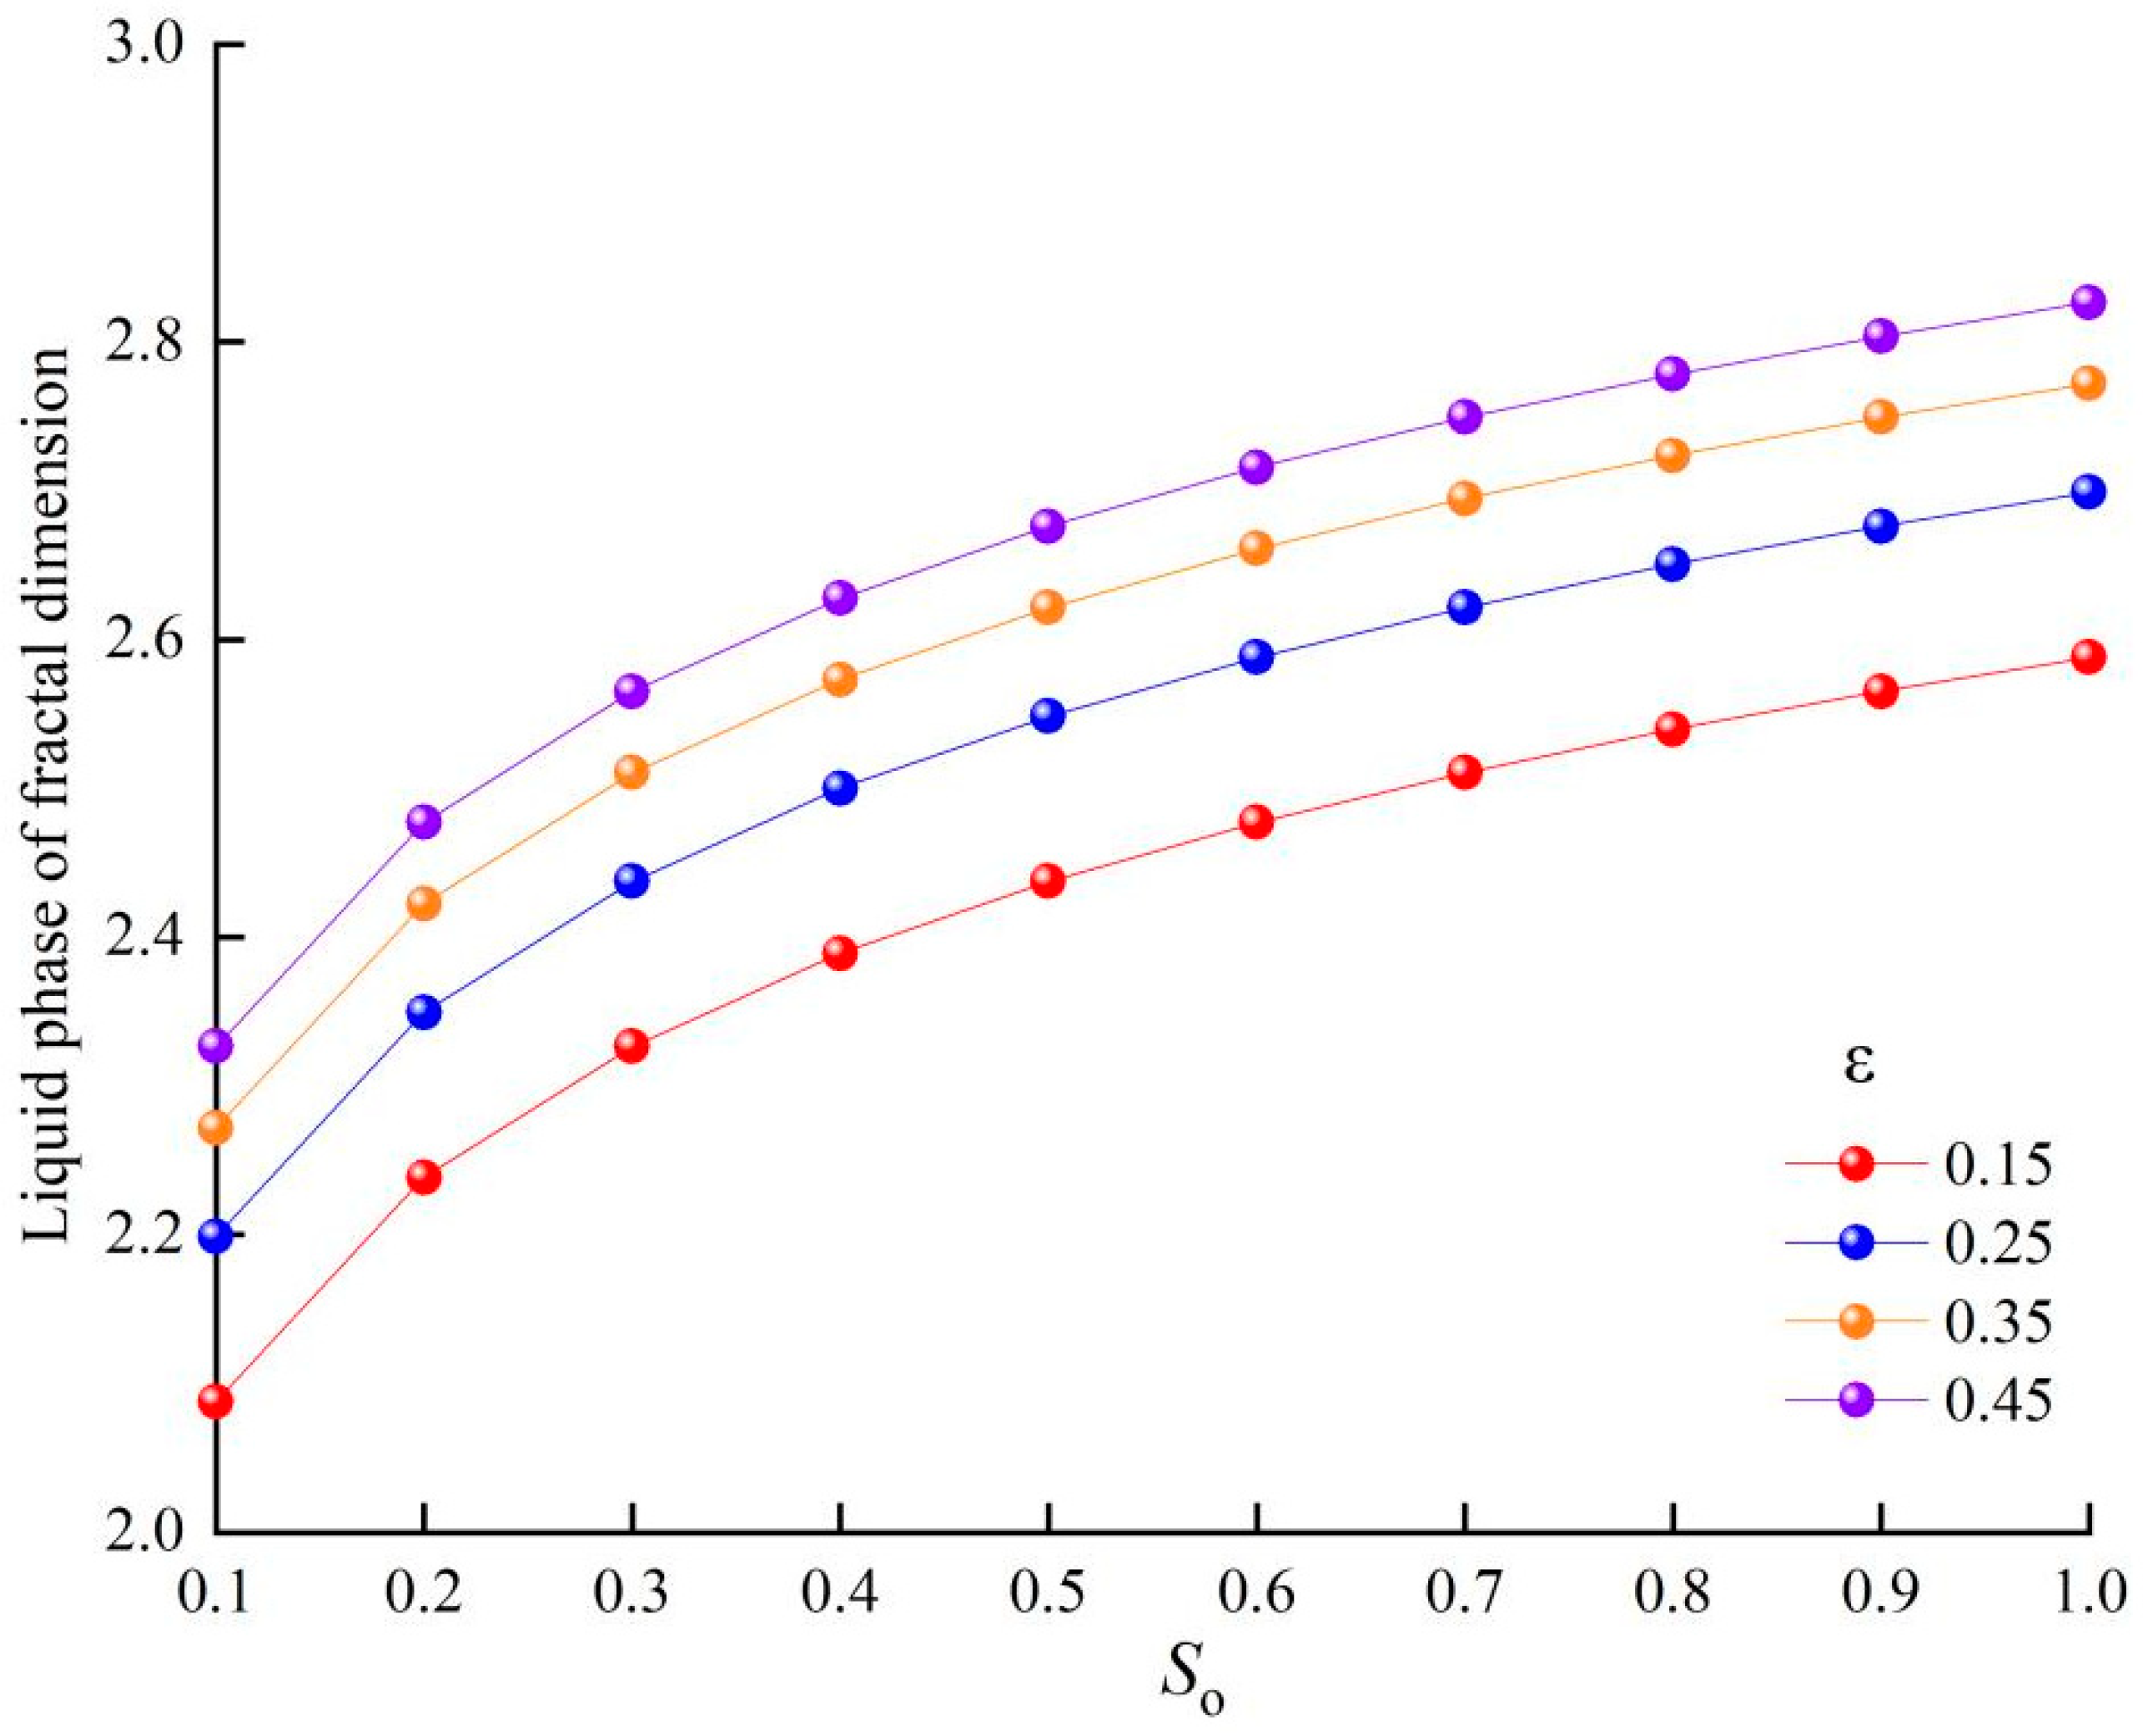
2.4.2. Fractal Dimension of Liquid Phase

NAPL pollutants in soils can affect the original thermal conductivity of the soils. The fractal dimension of NAPL pollutants in pores is the fractal dimension of the liquid phase (Dfo). Analogously, according to Formula (4), Dfo can be expressed as
D fo = ln b 3 S o ε ln b
The symbols in the formula are the same as above.

2.4.3. Fractal Dimension of Pore Curvature

In addition, the pore curvature of NAPL-contaminated soil will also affect its thermal conductivity. In the paper, the fractal dimension of pore curvature (DT) is used to express the degree of pore curvature. The fractal dimension of pore curvature in a three-dimensional model is
D T = 2 + ln τ av ln l λ av
where τav is the average curvature of the pore; λav is the average diameter of the pore; and l is the size RVE. τav and l/λav can be expressed by the following formula:
τ av = 1 + 0.63 ln 1 ε
l λ av = D fo 1 D fo 1 / 2 π 1 ε 4 ε 3 D fs 1 / 2 λ min λ max
where λmin is the minimum solid particle diameter; and λmax is the maximum solid particle diameter.
Generally, the value of λmin/λmax is between 10−2 and 10−4, and its average value is 10−3. In this paper, λmin/λmax is taken as 10−3.
Formulas (6)–(8) are combined to obtain DT.
D T = 2 + ln 1 + 0.63 ln 1 ε ln D fo 1 D fo 1 / 2 π 1 ε 4 ε 3 D fs 1 / 2 λ min λ max

3. Results and Discussion

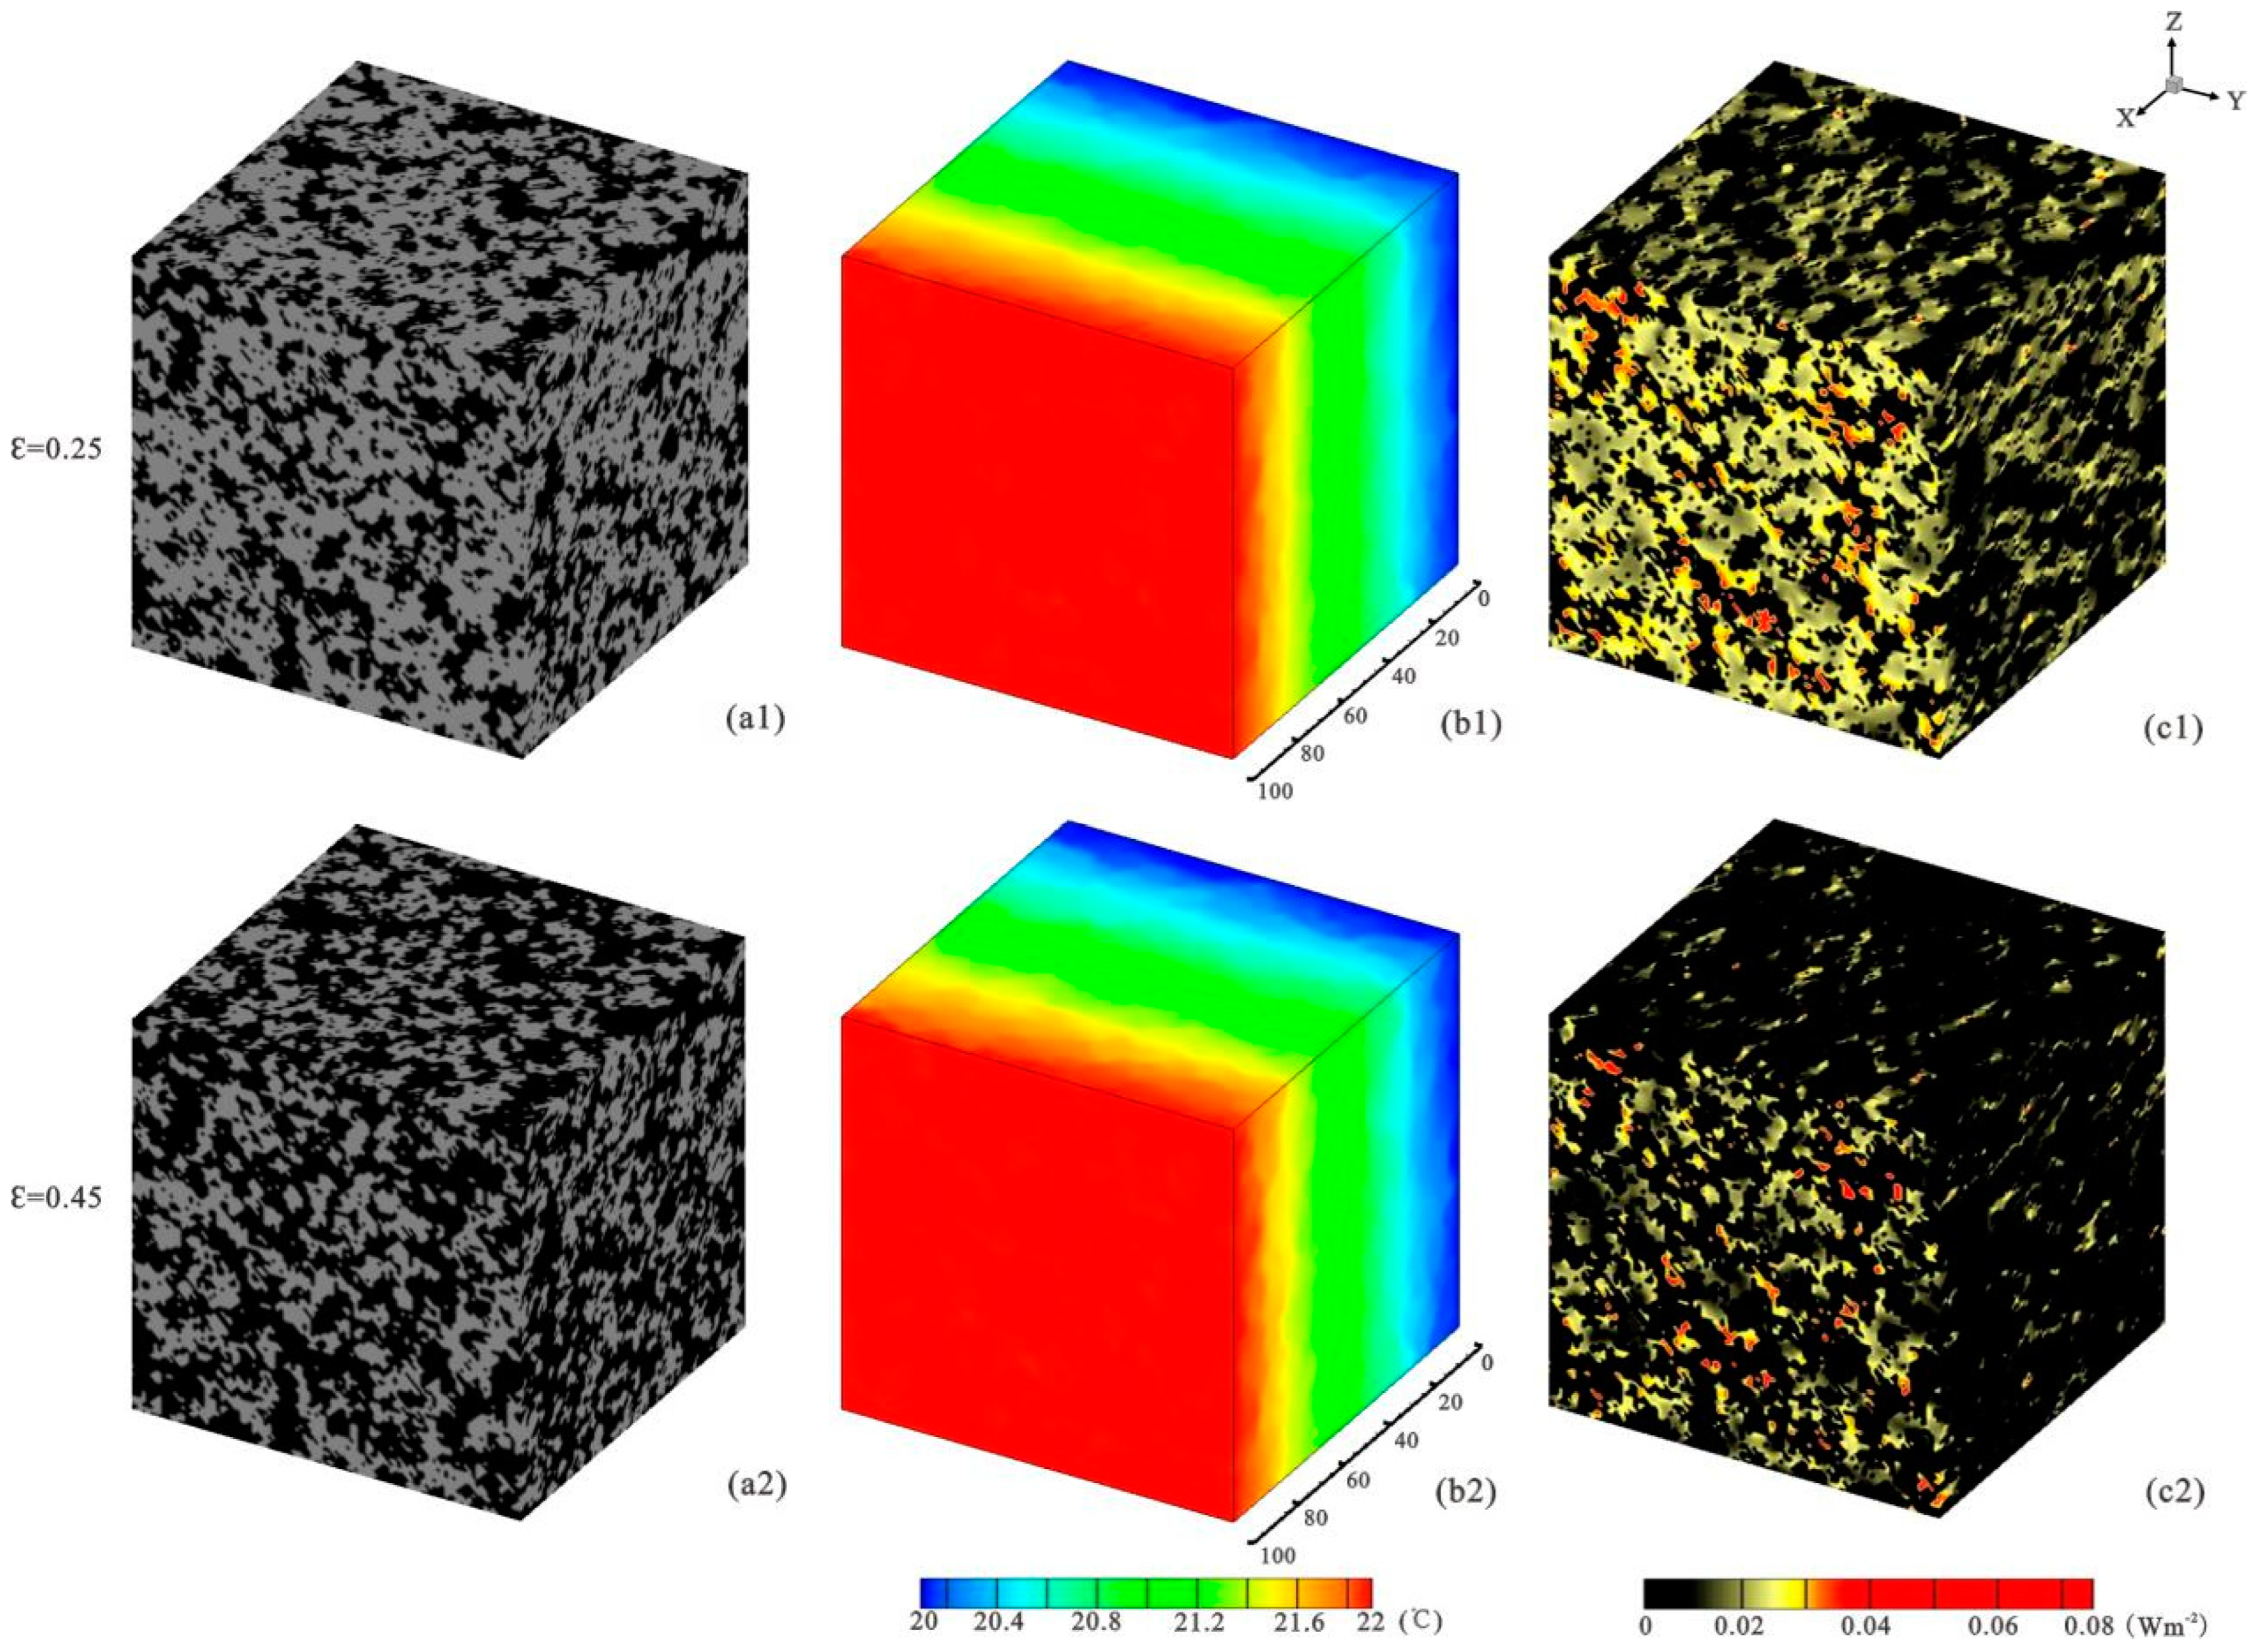
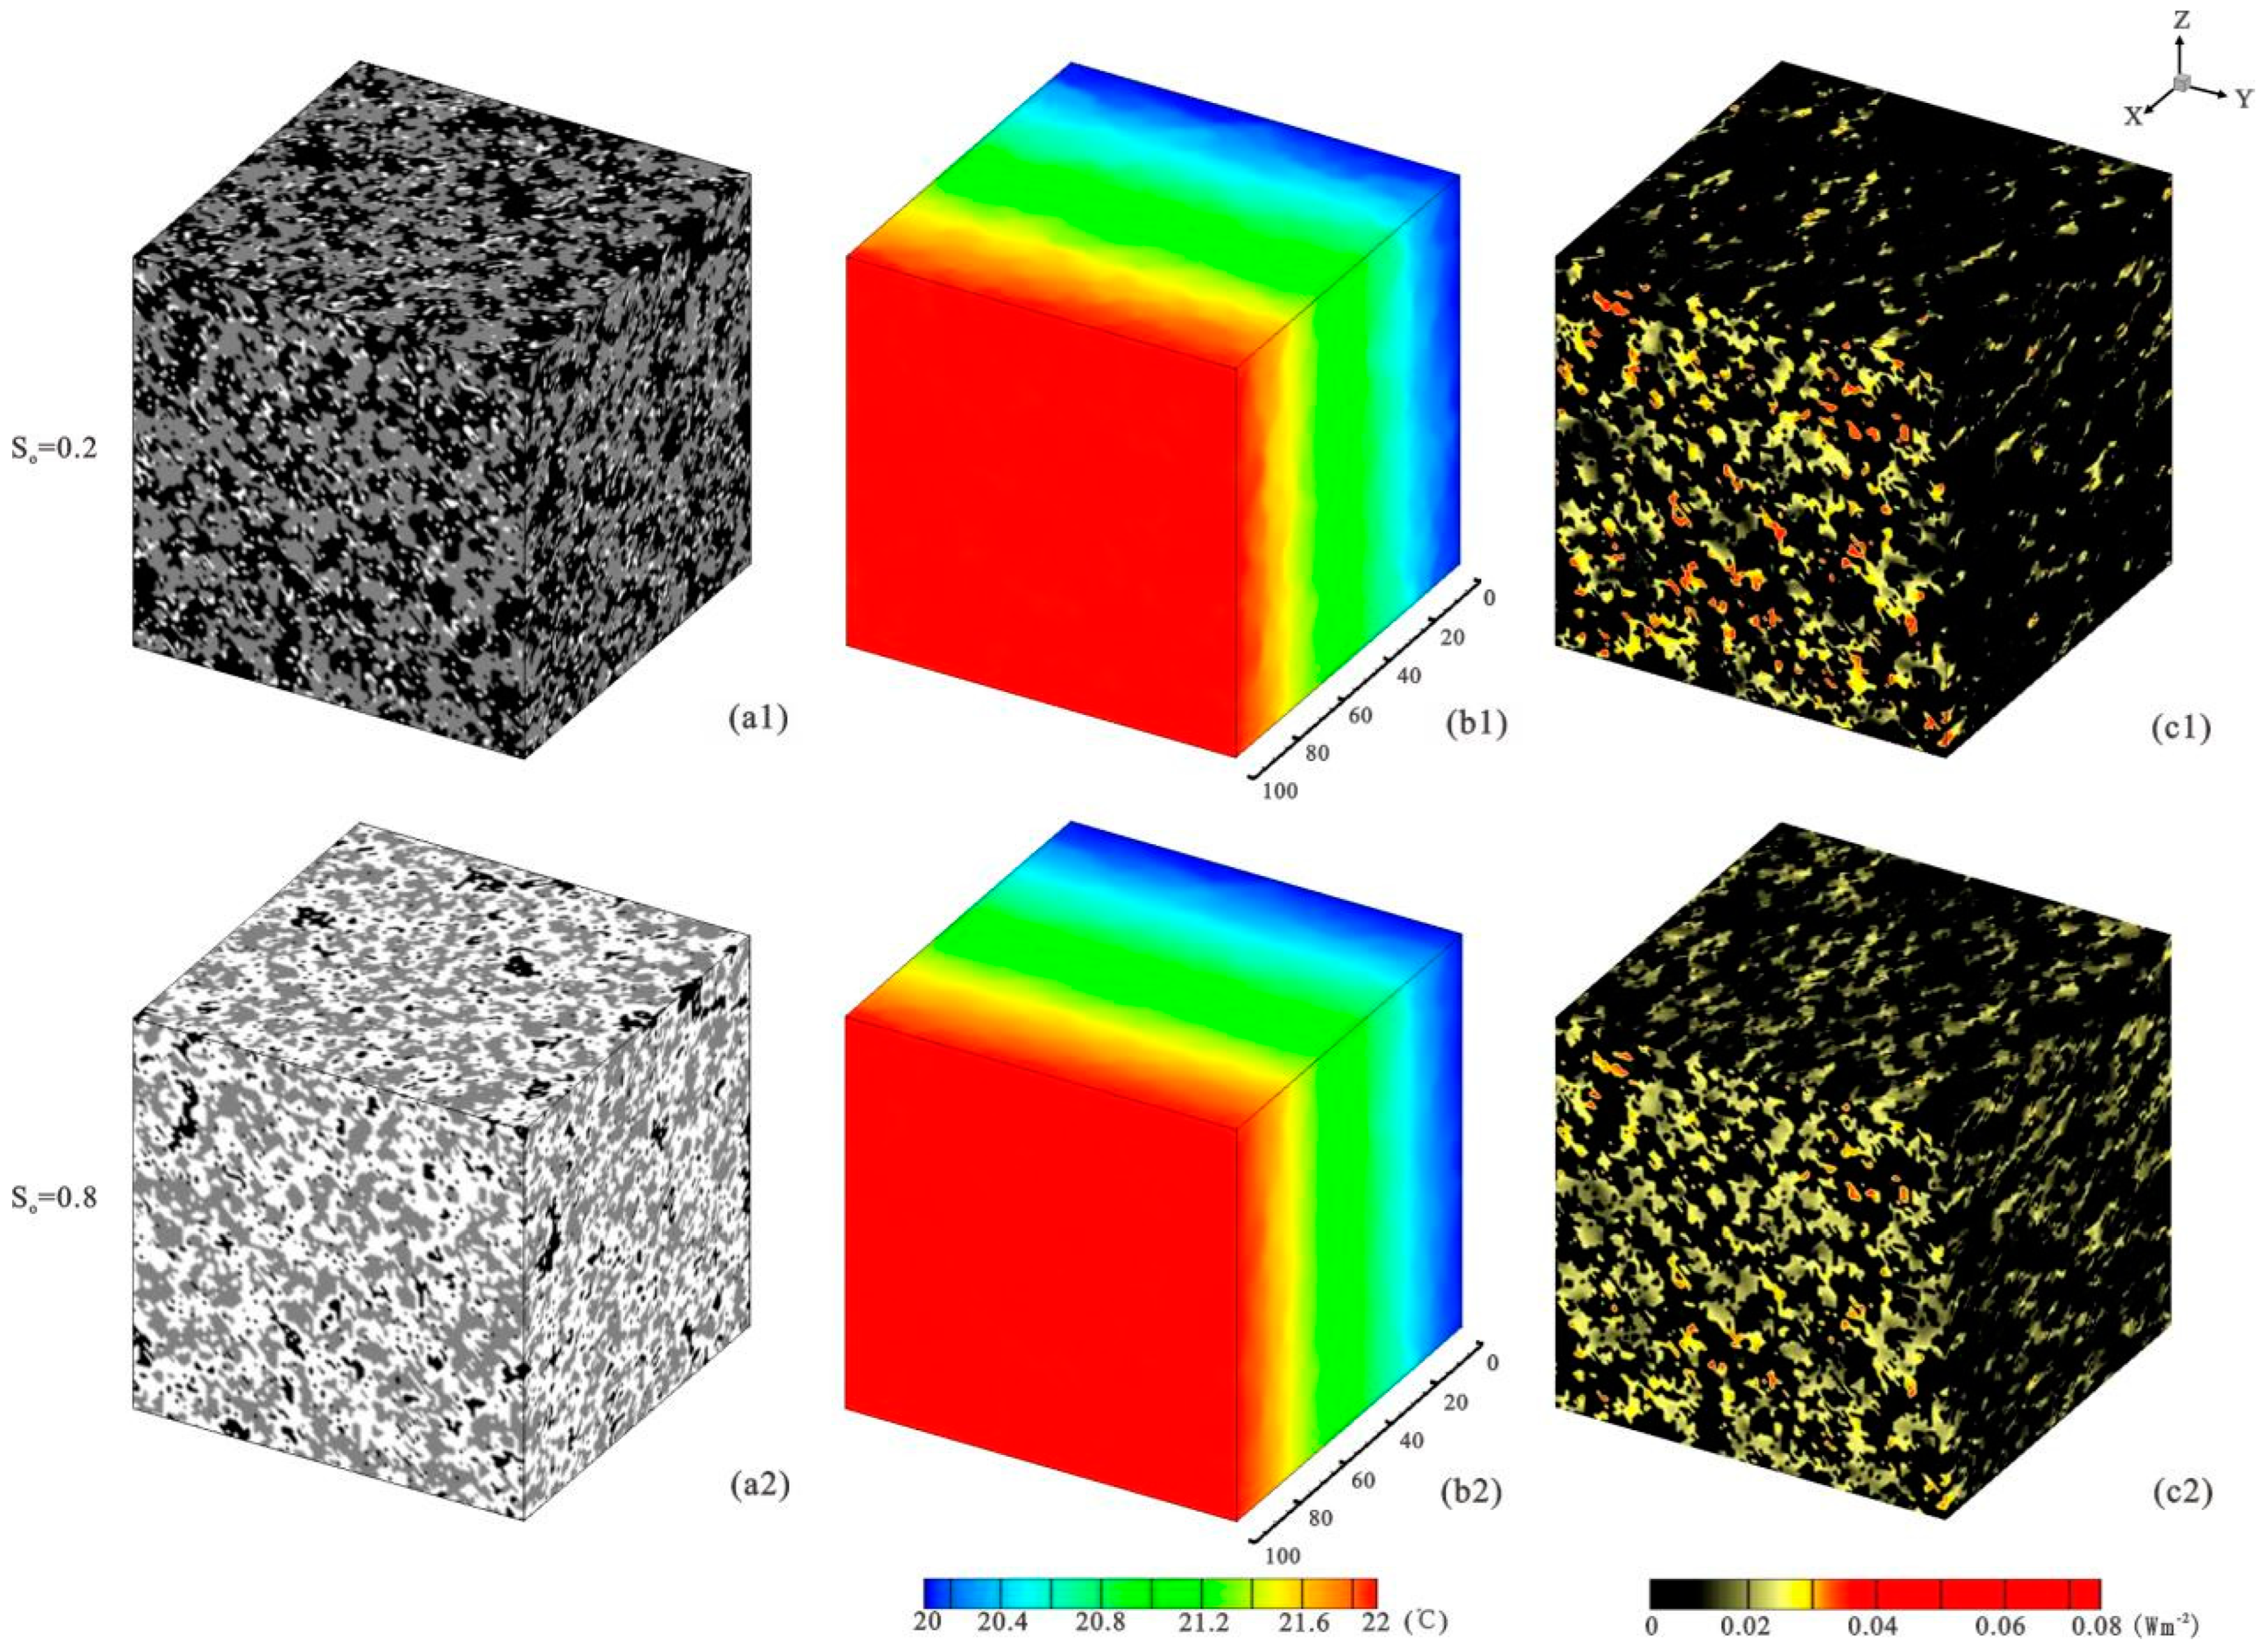
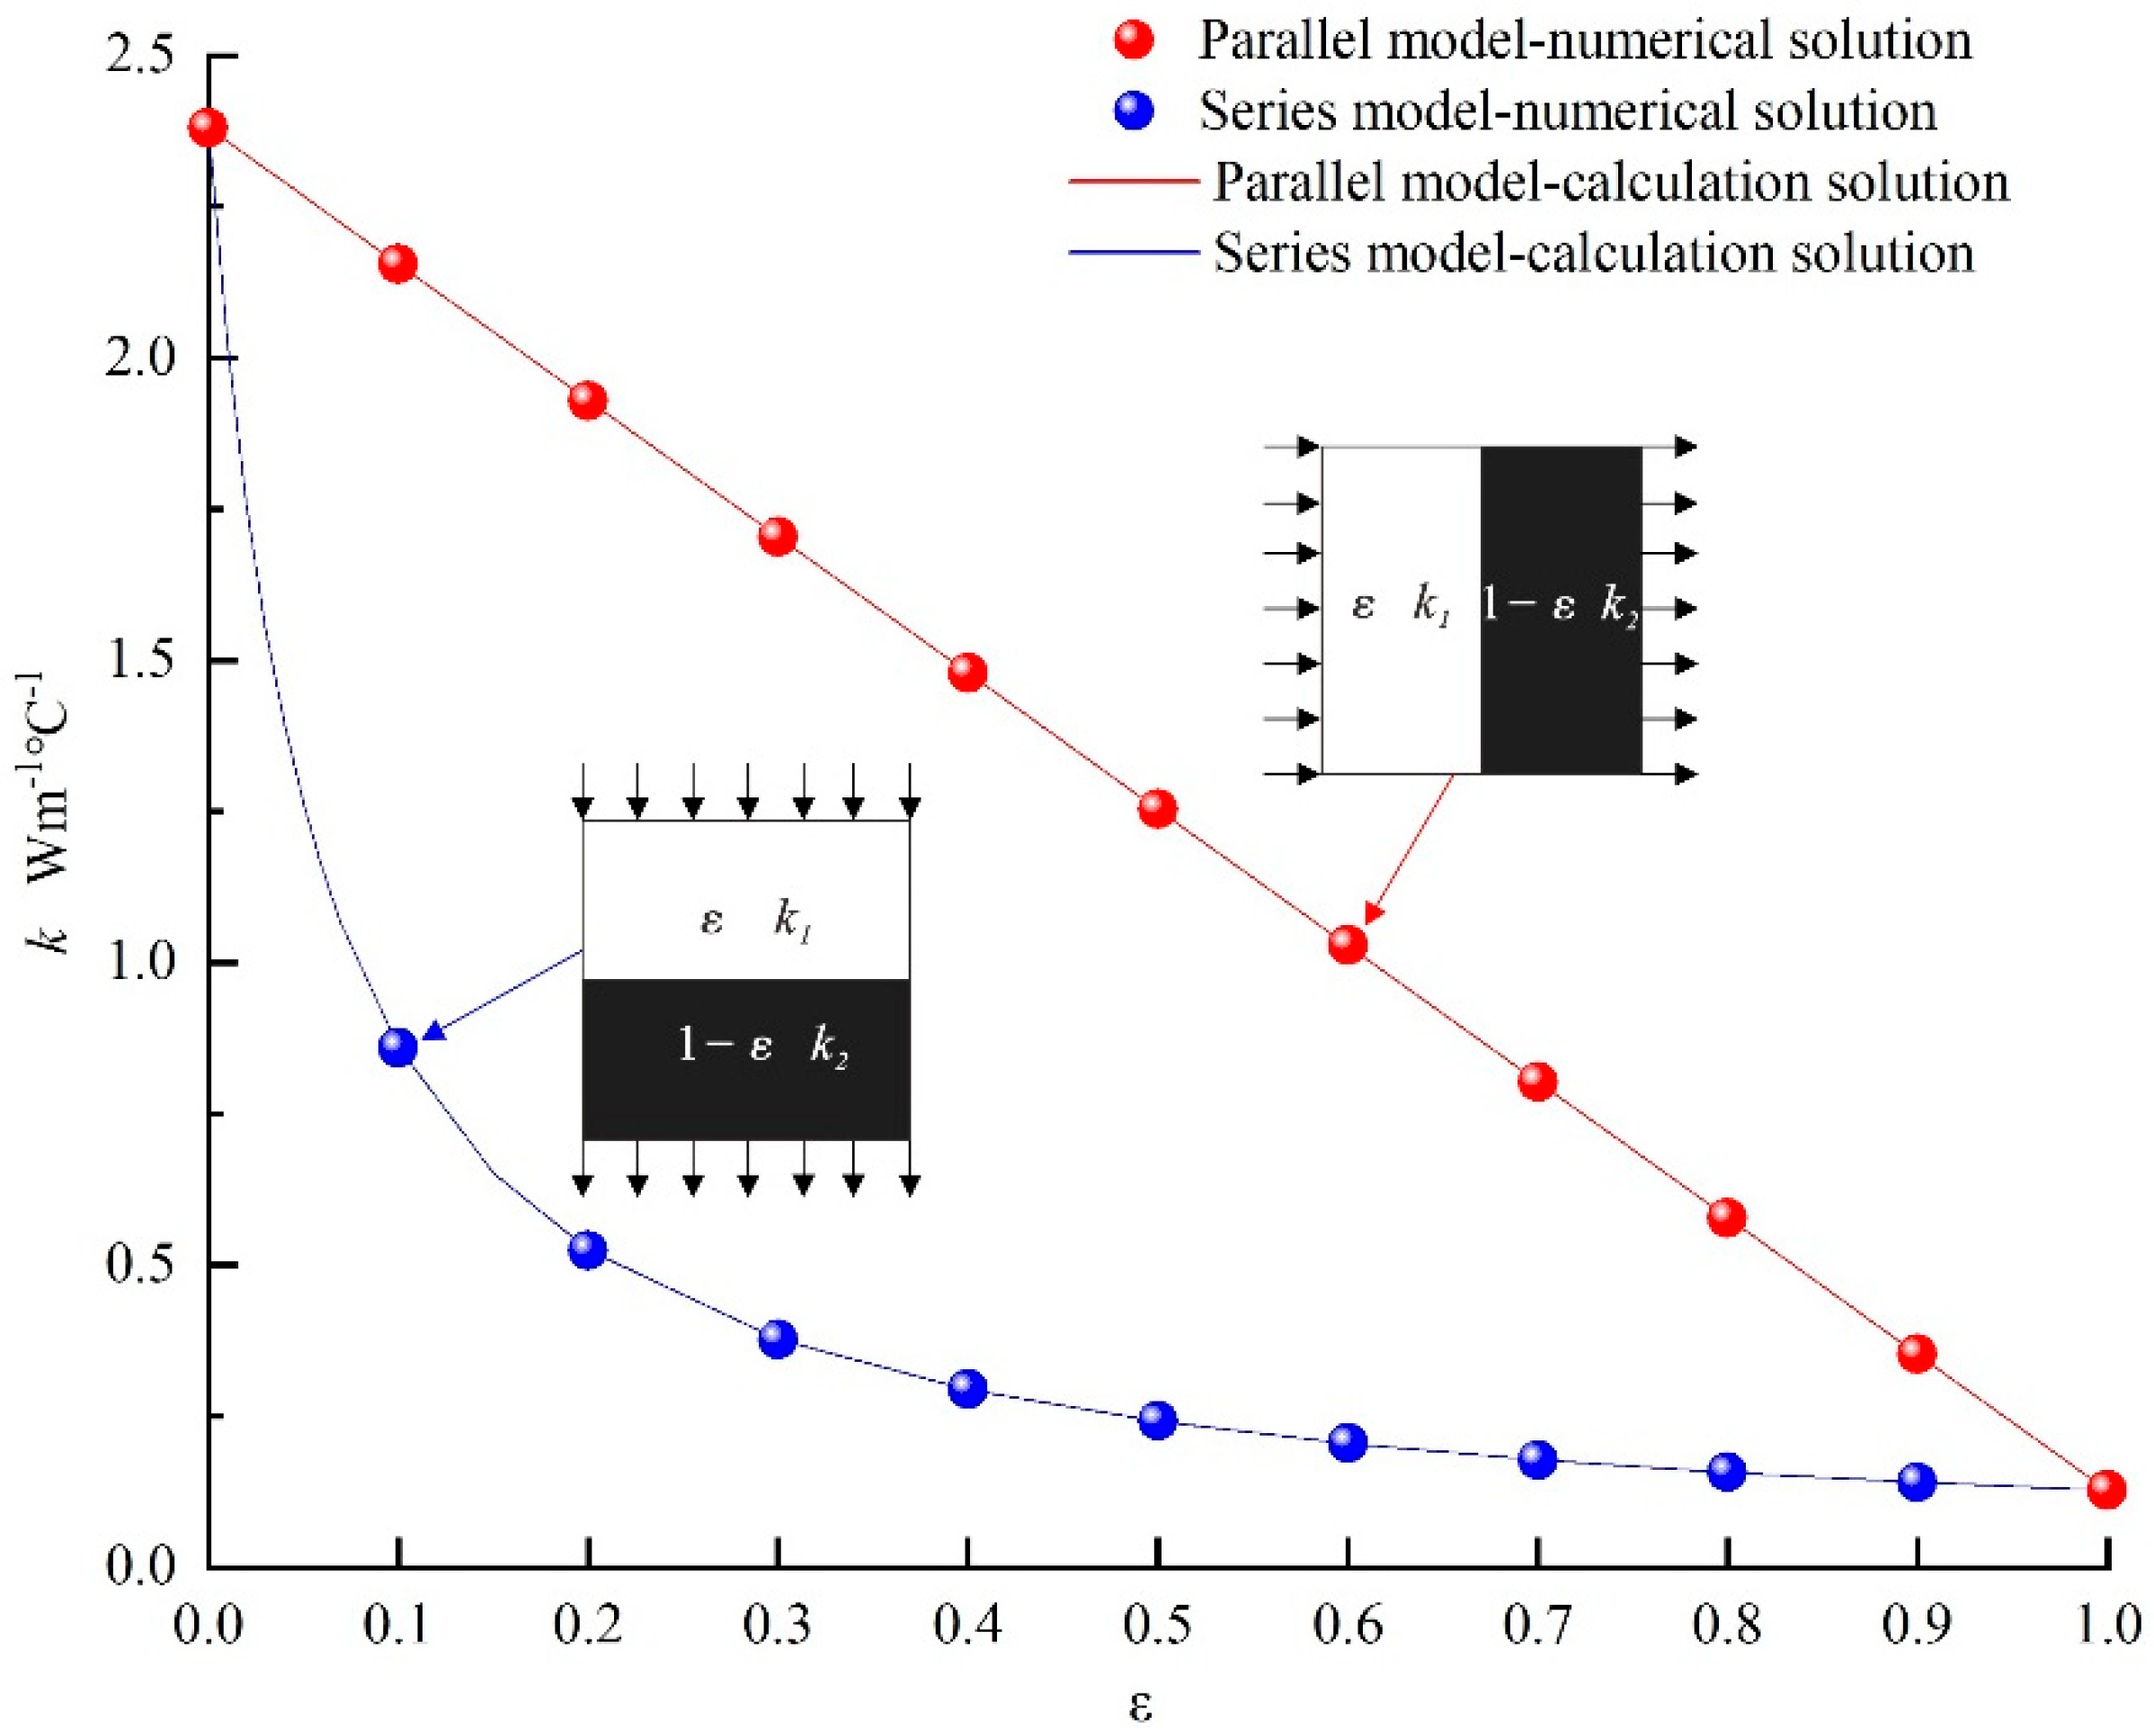
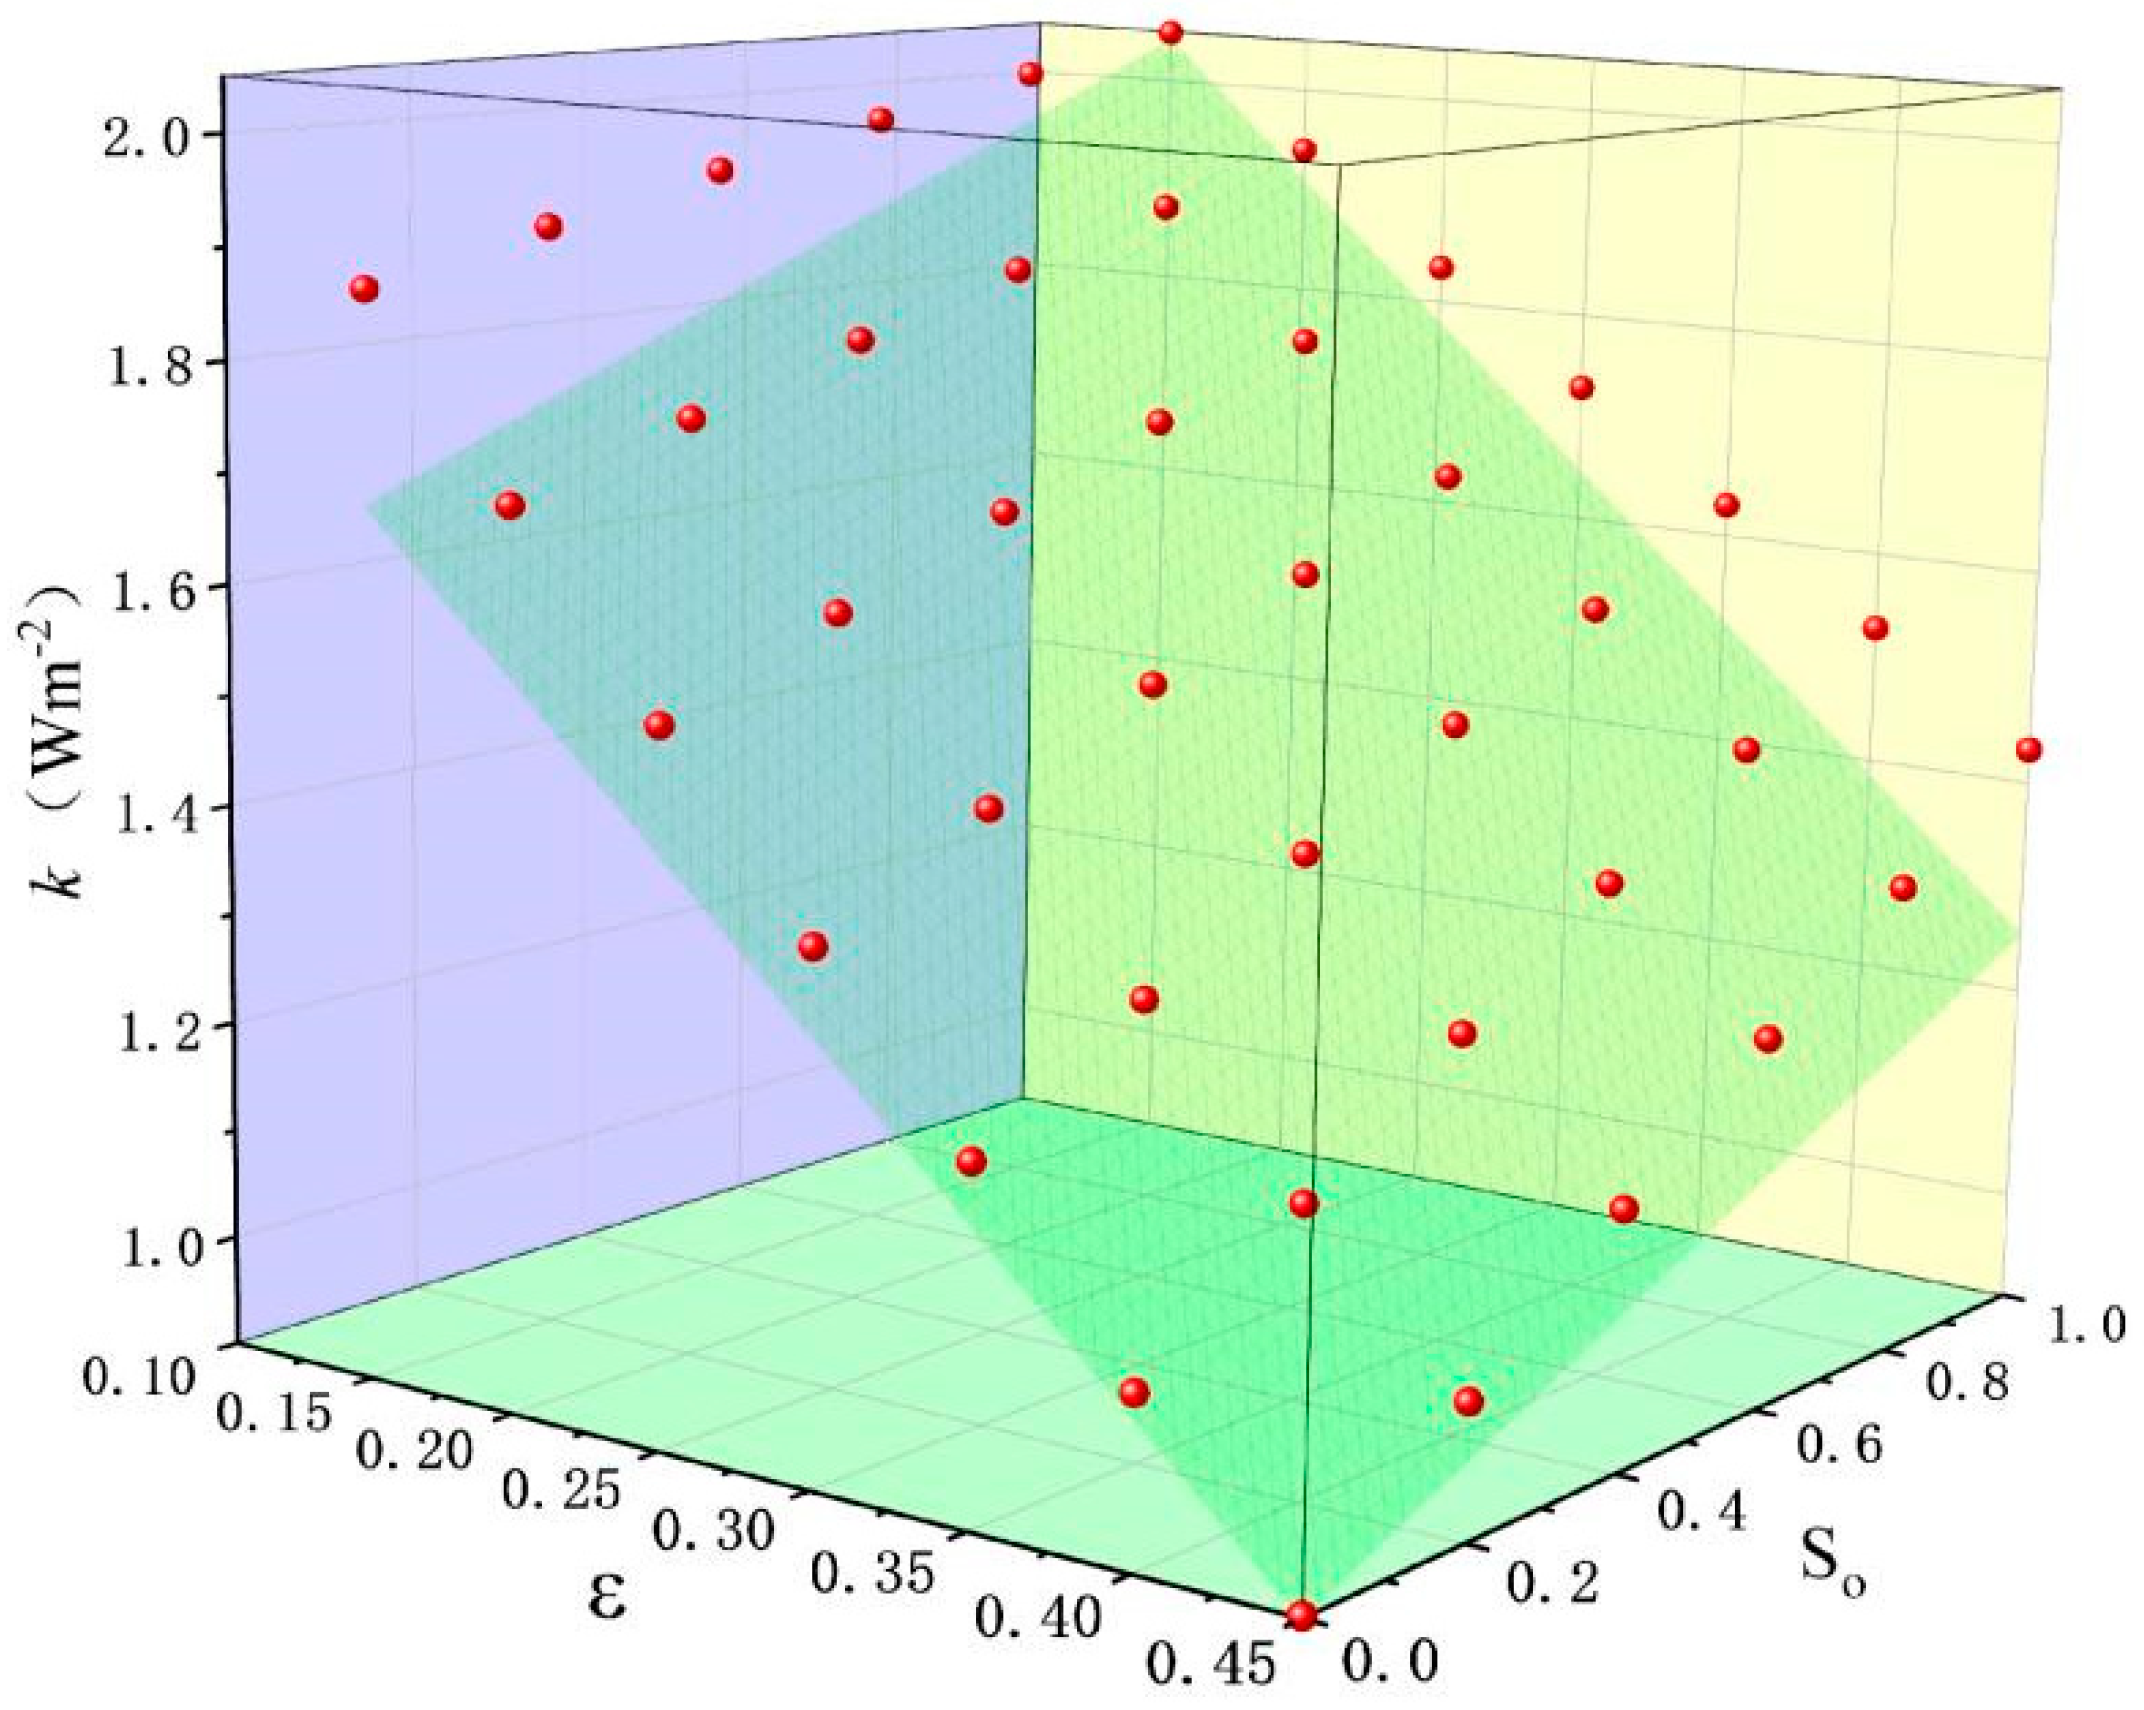
3.1. Effect of ε and So on k

In this paper, the content of NAPLs is normalized by saturation to explore the variation in k with different porosities and saturation levels. Taking a NAPL-contaminated soil model with a saturation of 0.1 as an example, Figure 9 shows the relationship between k and So, ε.
In the regression analysis of thermal conductivity and porosity, saturation is as follows:
k = - 2.6235 ε + 0.3541 S o + 2.1743           R 2 = 0.97991
According to Figure 9 and Formula (10), k increases with the increase in So and the decrease in ε. ε and So have a linear relationship with k. k is more affected by ε.

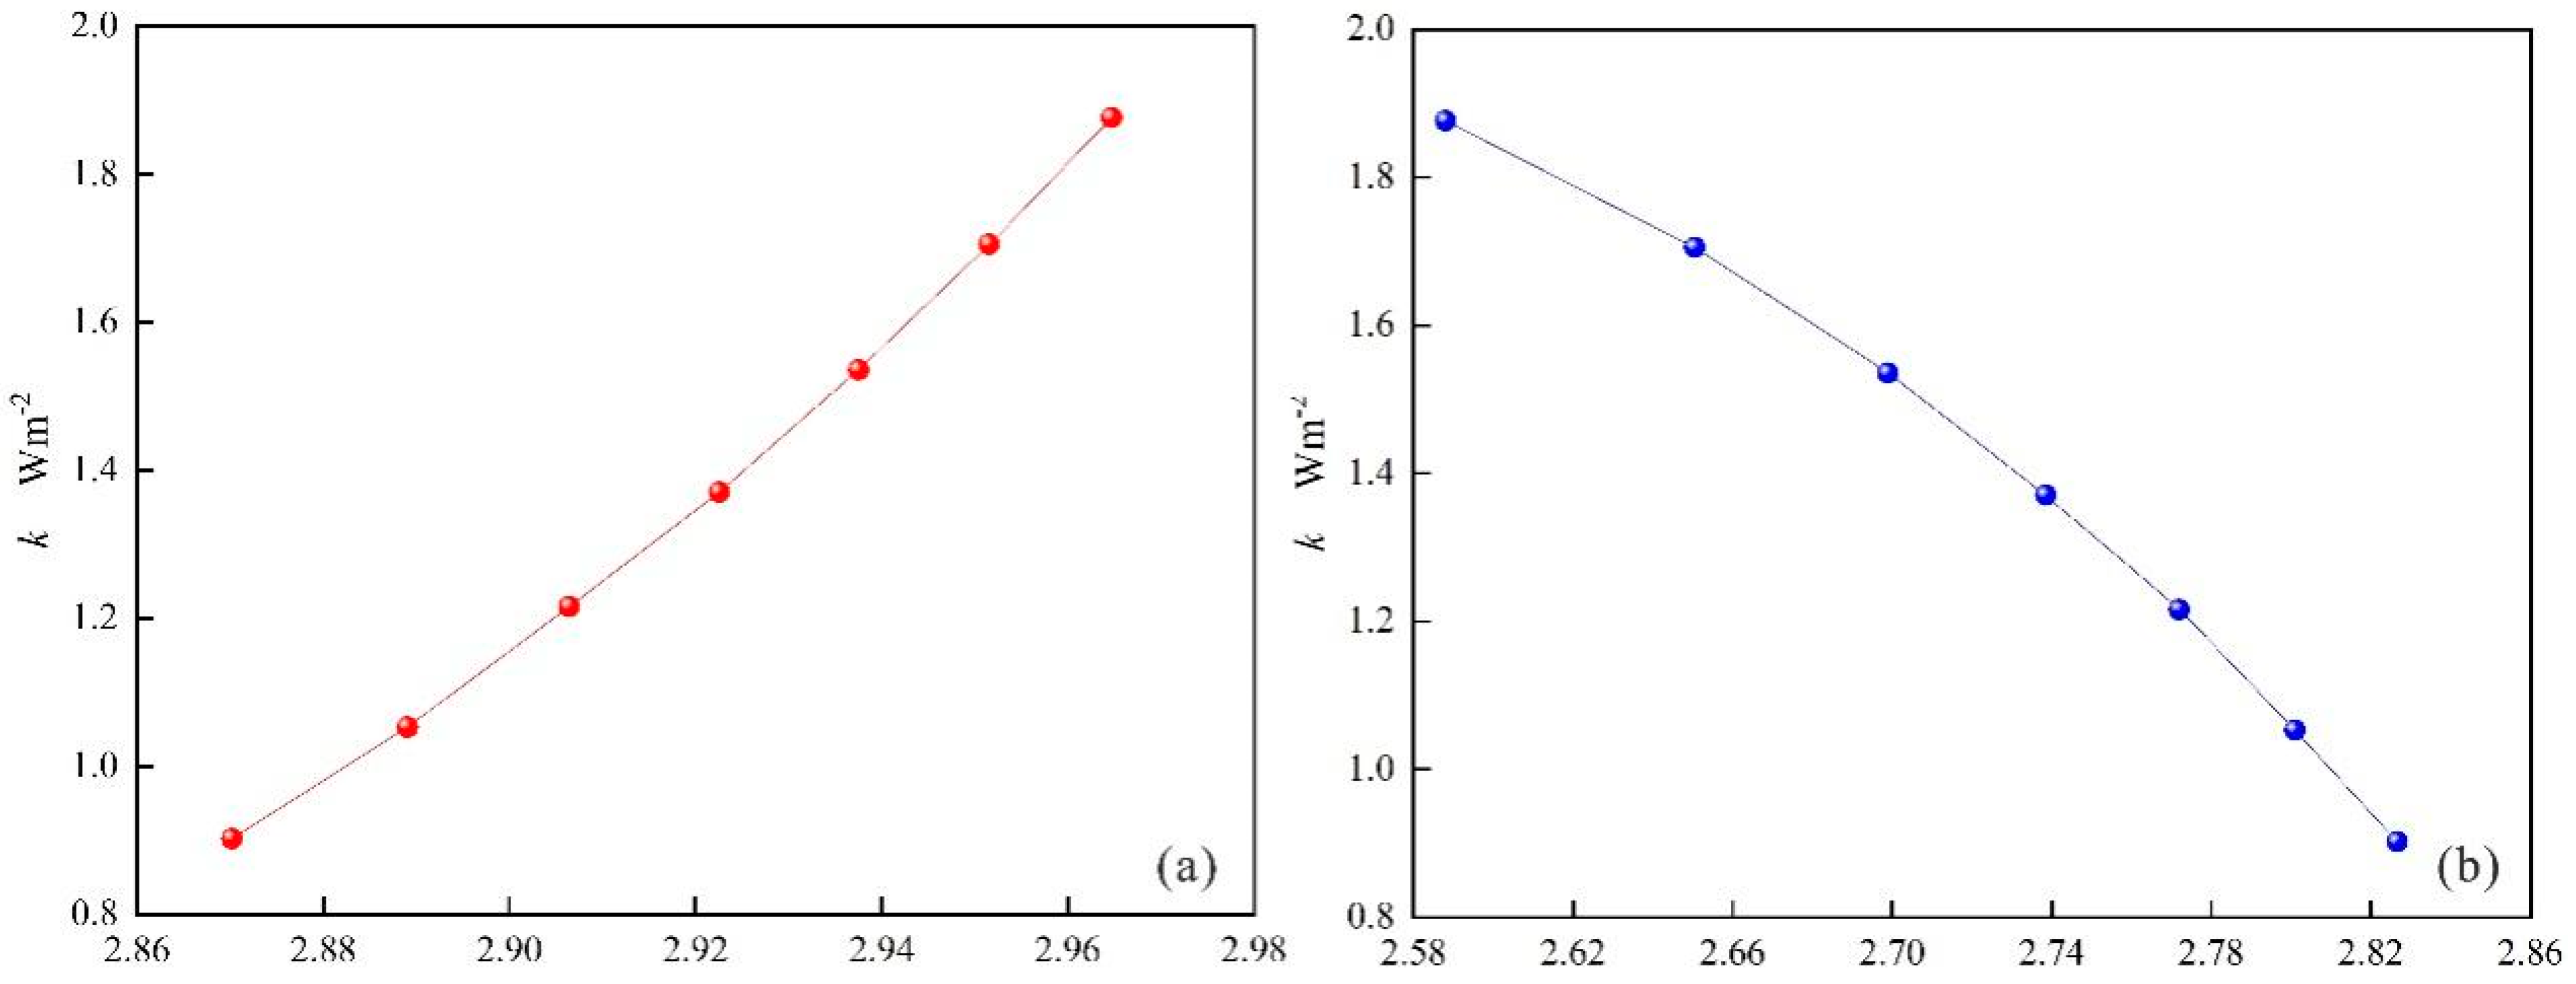
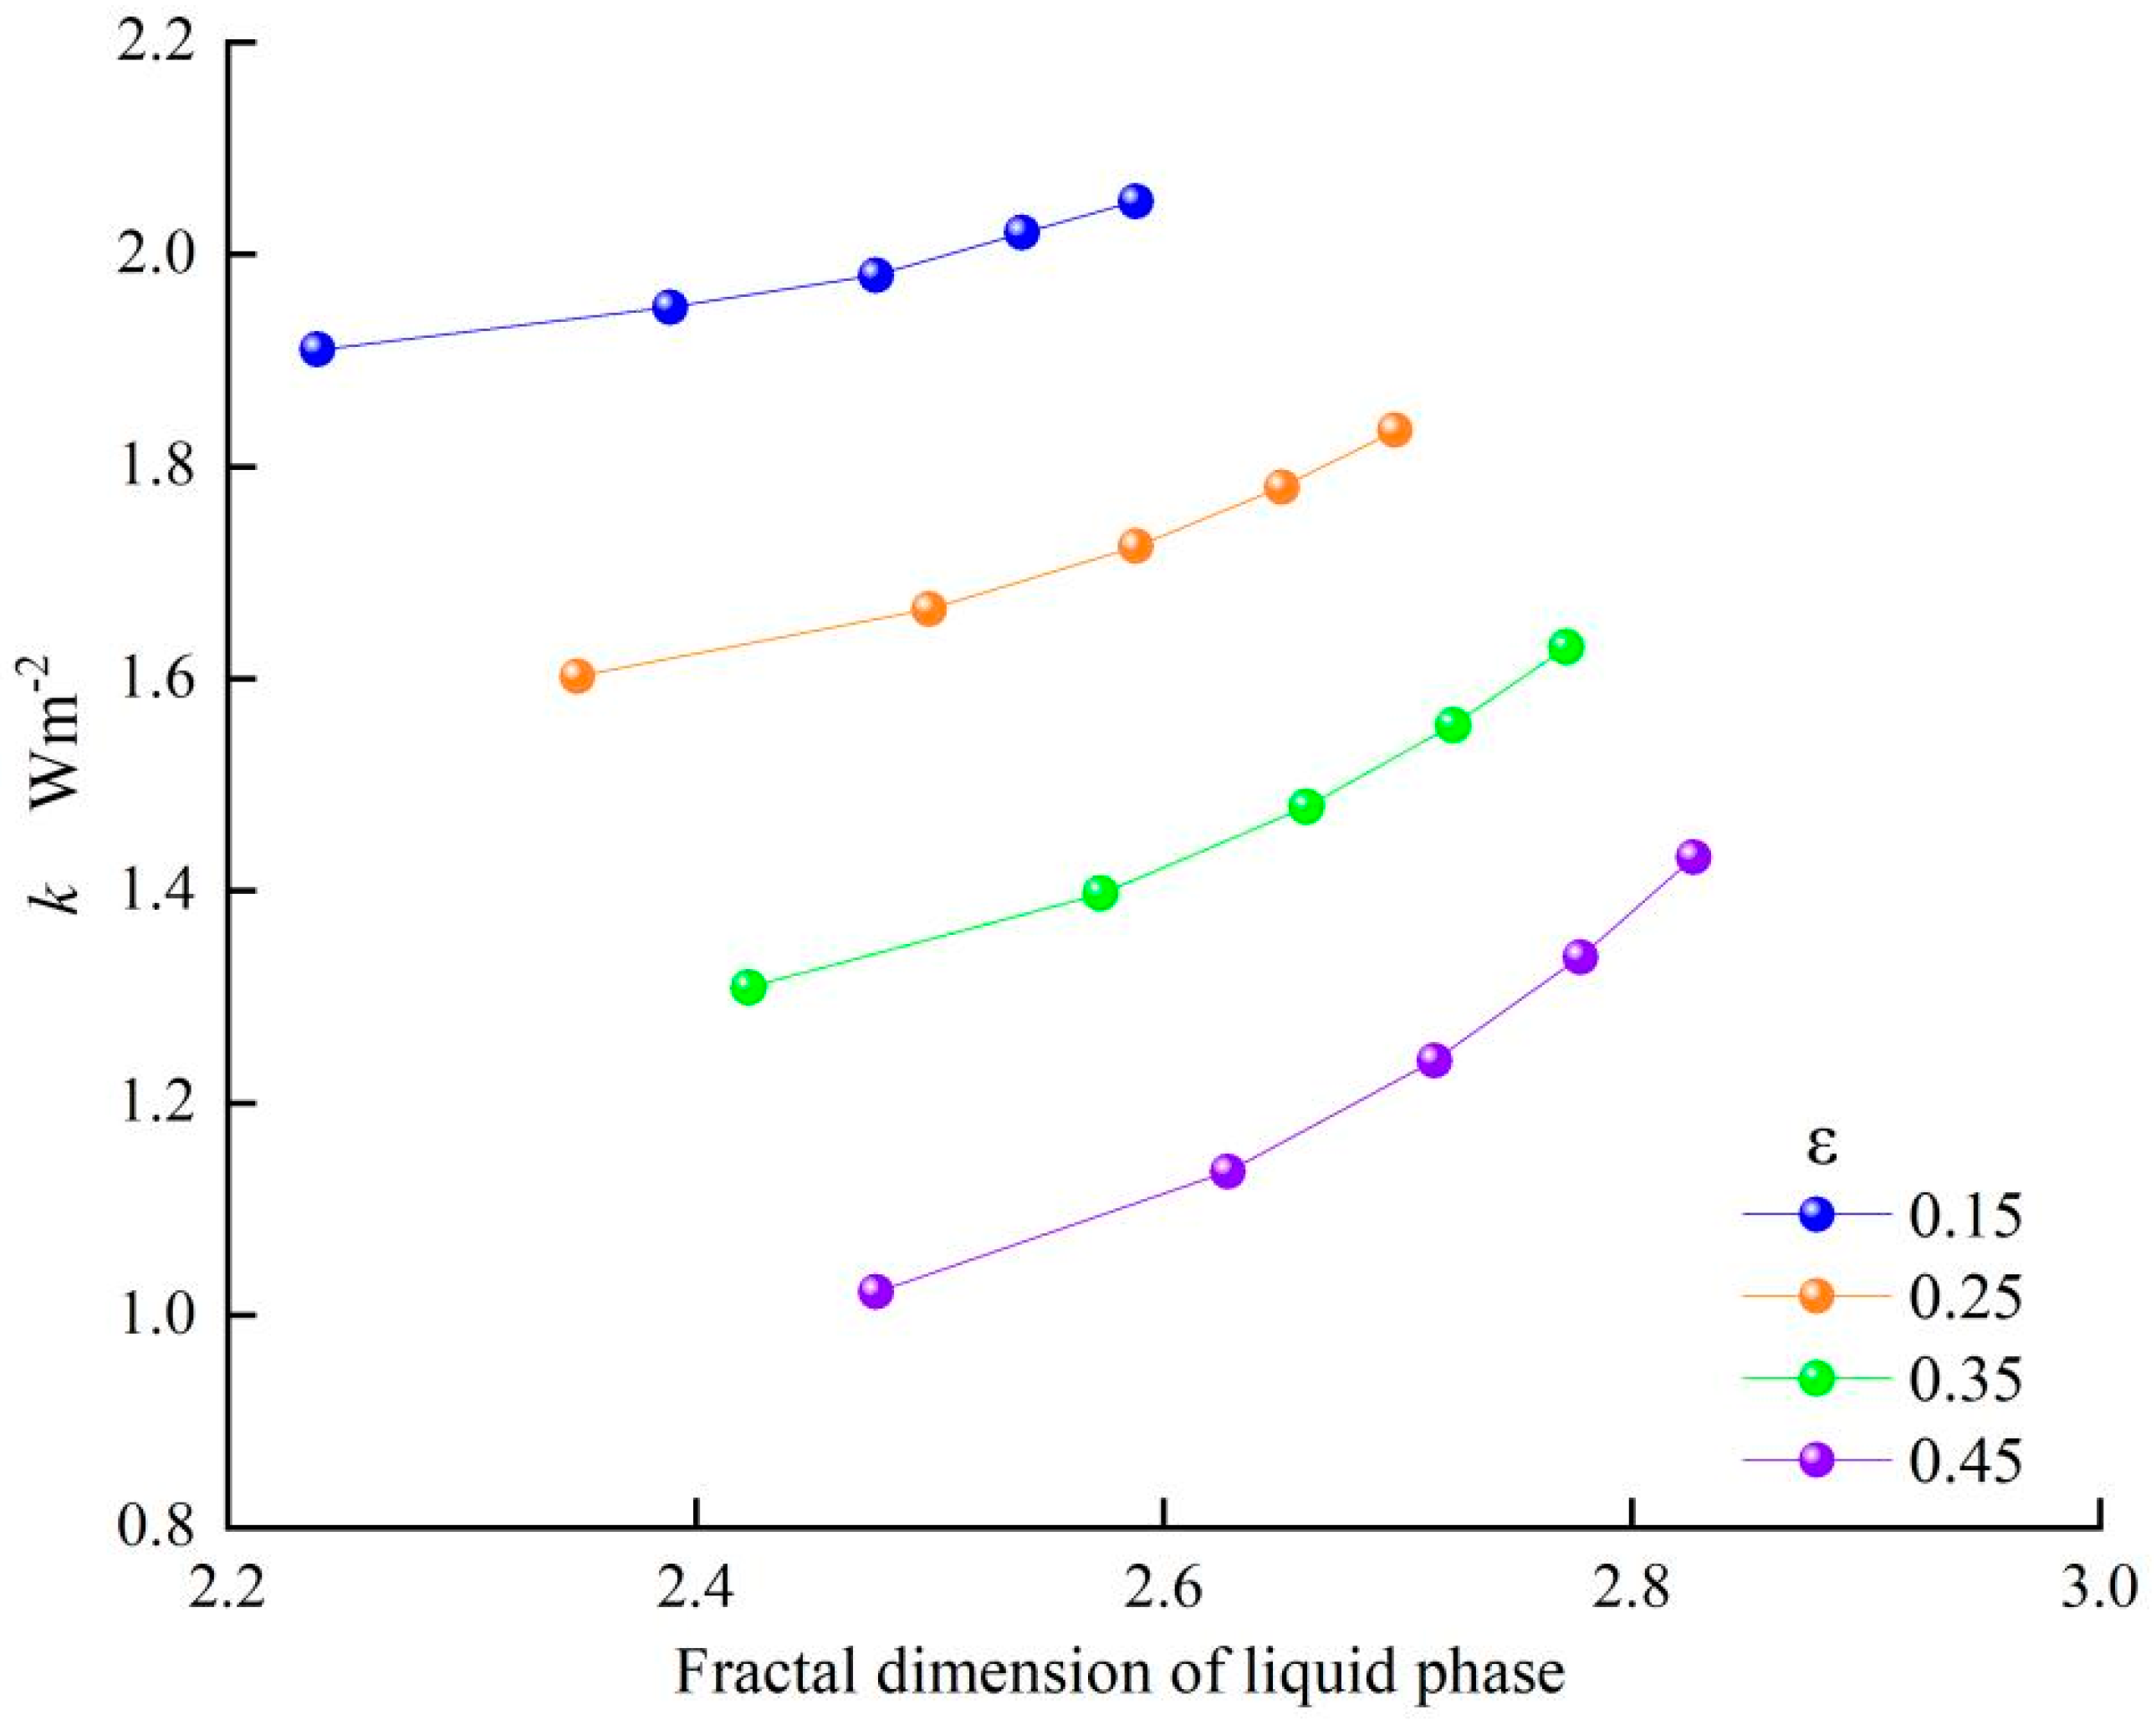
3.2. Relationship Between k and Dfs, Df

It can be seen from Figure 10 that the Dfs and Df of the three-dimensional NAPL-contaminated soil models are between 2 and 3, which conform to the fractal characteristics. The larger the porosity of the models, the larger the Df, and the smaller the Dfs. For the same b, the larger the ε, the more uniform the pore distribution, the smaller the ε, and the more uneven the pore distribution. Meanwhile, the decreasing rate of Dfs is smaller than the increasing rate of Df. When the pore volume is smaller than the solid volume (ε < 0.5), the change in pore uniformity caused by the increasing rate of porosity is larger.
Figure 11 shows the relationship between k and Dfs, Df. k increases with the increase in Dfs and decreases with the increase in Df. The thermal conductivity of soil particles is two orders of magnitude larger than that of air. The more the solid phase increases and the more its distribution is uniform, the greater the k.

3.3. Relationship Between Dfo and k

Figure 12 shows the relationship between the fractal dimension of the liquid phase (Dfo) and saturation (So). As So increases, Dfo increases, and the rate of increase in Dfo gradually decreases. In the case of a small So, the distribution of the liquid phase is more dispersed, and the increase in saturation will cause greater changes in the uniformity of the liquid phase and Dfo. Meanwhile, under the same So, the larger the ε, the larger the Dfo. In the case of a large ε, the larger the volume of the liquid phase, the more uniform the distribution and the larger the Dfo. In addition, with the increase in ε, the increasing rate of Dfo gradually decreases. In the case of a small ε, the liquid phase volume is smaller and the distribution is more dispersed. With the increase in ε, the uniformity and Dfo change more.
As shown in Figure 13, k increases with the increase in Dfo. In the case of a larger ε and larger Dfo, k increases more rapidly with the increase in Dfo. When ε and Dfo are large, the liquid phase is more uniform, and only more liquid phase can increase Dfo. That is consistent with the conclusion on the relationship between So and k.

3.4. Relationship Between DT and k

Figure 14a shows that DT decreases with the increase in ε, that is, the greater the ε, the greater the degree of pore curvature and the greater the degree of solid phase curvature. The smaller the DT, the smaller the k (Figure 14b). The solid phase is a good heat flow channel. The smaller the DT, the greater the curvature of the pores and the solid phase and the longer the heat flow path (Figure 15). In the case of the same DT, the greater the So, the greater the k (Figure 14b). When DT is small, the influence of saturation on k is greater. When DT is smaller, the influence of So on k is greater. The existence of the liquid phase can form “liquid bridges” between the solid phase and form a good heat flow channel (Figure 16). In particular, for the model with great curvature of the pores and the solid phase, the length of the heat flow path can be greatly shortened. The thermal resistance is reduced to improve k.

4. Conclusions

In the paper, QSGS is used to establish a NAPL-contaminated soil model, and LBM is used to calculate k. The relationship between k and the fractal dimension of NAPL-contaminated soils is studied by combining the numerical simulation method with Hausdorff fractal dimension theory. The main conclusions of this study are as follows:
(1)
It is simple and feasible to calculate the thermal conductivity (k) of NAPL-contaminated soils using the four-parameter random generation method combined with LBM and Monte Carlo simulation.
(2)
k decreases with the increase in porosity and increases with the increase in saturation. The thermal conductivity varies linearly with porosity and saturation. Porosity has a greater influence on the thermal conductivity of NAPL-contaminated soils. A calculation formula of thermal conductivity related to saturation and porosity is proposed.
(3)
With the increase in porosity, the pore fractal dimension and liquid phase fractal dimension of NAPL-contaminated soils increased, while the solid phase fractal dimension and pore curvature fractal dimension decreased. The fractal dimension of the liquid phase increases with the increase in NAPL content. The thermal conductivity increases with the increase in the solid phase fractal dimension, liquid phase fractal dimension, and pore curvature fractal dimension and decreases with the increase in the pore fractal dimension.

Author Contributions

S.G. and Y.H. made contributions to the conception and design, acquisition of literature, analysis, and/or writing the manuscript. W.Z. and C.H. made equal contributions to the acquisition of literature and/or analysis. X.W., L.G., Y.L. and B.L. participated in revising the manuscript critically for important intellectual content. Y.H. gave final approval of the version to be submitted and any revised version. All authors have read and agreed to the published version of the manuscript.

Funding

This study was financially supported by the Foundation of Shandong Engineering Research Center for Environmental Protection and Remediation on Groundwater (801KF2024-13) and the Shandong Provincial Natural Science Foundation (ZR2024QD212).

Data Availability Statement

The original contributions presented in this study are included in the article. Further inquiries can be directed to the corresponding author.

Conflicts of Interest

The authors declare no conflict of interest.

References

  1. Sun, L.; Wang, S.-w.; Guo, C.-j.; Shi, C.; Su, W.-C. Using Pore-Solid Fractal Dimension to Estimate Residual LNAPLs Saturation in Sandy Aquifers: A Column Experiment. J. Groundw. Sci. Eng. 2022, 10, 87–98. [Google Scholar] [CrossRef]
  2. Lin, R.; Fan, Z.; Chang, Y.; Deng, D. Novel Organic-Phase In Situ Chemical Oxidation for Highly Efficient Oxidation of Non-Aqueous Phase Liquids. Sep. Purif. Technol. 2024, 345, 127372. [Google Scholar] [CrossRef]
  3. Nie, S.; Liu, K.; Zhong, X.; Wang, Y.; Han, Y.; Xu, K.; Song, J.; Li, J. Numerical Investigation of Production Performance of Challenging Gas Hydrates from Deposits with Artificial Fractures and impermeable BARRIERS. Sci. Rep. 2025, 15, 5361. [Google Scholar] [CrossRef]
  4. Xia, T.; Zhang, J.; Li, M.; Jougnot, D.; Yang, K.; Li, S.; Mao, D. Evolution of In-Situ Thermal-Enhanced Oxidative Remediation Monitored by Induced Polarization Tomography. J. Hydrol. 2025, 648, 132464. [Google Scholar] [CrossRef]
  5. Xu, J.-C.; Yang, L.-H.; Yuan, J.-X.; Li, S.-Q.; Peng, K.-M.; Lu, L.-J.; Huang, X.-F.; Liu, J. Coupling Surfactants with ISCO for Remediating of NAPLs: Recent Progress and Application Challenges. Chemosphere 2022, 303, 135004. [Google Scholar] [CrossRef]
  6. Xu, X.-Y.; Hu, N.; Qian, Z.-K.; Wang, Q.; Fan, L.-W.; Song, X. Understanding of Co-Boiling Between Organic Contaminants and Water During Thermal Remediation: Effects of Nonequilibrium Heat and Mass Transport. Environ. Sci. Technol. 2023, 57, 16043–16052. [Google Scholar] [CrossRef] [PubMed]
  7. Ren, X.; Niu, F.; Yu, Q.; Yin, G. Research Progress of Soil Thermal Conductivity and Its Predictive Models. Cold Reg. Sci. Technol. 2024, 217, 104027. [Google Scholar] [CrossRef]
  8. Hu, B.W.; Wang, J.G.; Ma, Z.G.; Sang, S.X. Permeability and Thermal Conductivity Models of Shale Matrix with a Bundle of Tortuous Fractal Tree-like Branching Micropore Networks. Int. J. Therm. Sci. 2021, 164, 106876. [Google Scholar] [CrossRef]
  9. Katz, A.J.; Thompson, A.H. Fractal Sandstone Pores: Implications for Conductivity and Pore Formation. Phys. Rev. Lett. 1985, 54, 1325–1328. [Google Scholar] [CrossRef]
  10. Li, F.L.; Wang, M.Z.; Lin, S.B.; Hao, Y.W. Pore Characteristics and Influencing Factors of Different Types of Shales. Mar. Pet. Geol. 2019, 102, 391–401. [Google Scholar] [CrossRef]
  11. Shen, J.; Zhang, Y.; Ling, C.; Liu, W.; Zhang, X. Comparative Study on the Fractal Dimensions of Soil Particle Size. In Proceedings of the 3rd International Workshop on Renewable Energy and Development (IWRED), Guangzhou, China, 8–10 March 2019; LOP: Bristol, UK. [Google Scholar]
  12. Xiao, Y.; Liu, H.L.; Nan, B.W.; McCartney, J.S. Gradation-Dependent Thermal Conductivity of Sands. J. Geotech. Geoenviron. Eng. 2018, 144, e06018010. [Google Scholar] [CrossRef]
  13. Li, S.; Wang, Y.; Liu, Y.; Sun, W. Estimation of thermal conductivity of porous material with fem and fractal geometry. Int. J. Mod. Phys. C 2009, 20, 513–526. [Google Scholar] [CrossRef]
  14. Cai, S.; Zhang, B.; Cui, T.; Guo, H.; Huxford, J. Mesoscopic Study of the Effective Thermal Conductivity of Dry and Moist Soil. Int. J. Refrig.-Rev. Int. Du Froid 2019, 98, 171–181. [Google Scholar] [CrossRef]
  15. Shen, Y.; Xu, P.; Qiu, S.; Rao, B.; Yu, B. A Generalized Thermal Conductivity Model for Unsaturated Porous Media with Fractal Geometry. Int. J. Heat Mass Transfer 2020, 152, 119540. [Google Scholar] [CrossRef]
  16. Qin, X.; Cai, J.; Xu, P.; Dai, S.; Gan, Q. A Fractal Model of Effective Thermal Conductivity for Porous Media with Various Liquid Saturation. Int. J. Heat Mass Transfer 2019, 128, 1149–1156. [Google Scholar] [CrossRef]
  17. Huang, W.; Mao, X.; Wu, Q. Solid Phase Thermal Conductivity Model of Alpine Meadow Soils Based on Fractal Theory. Sci. Rep. 2025, 15, 6352. [Google Scholar] [CrossRef] [PubMed]
  18. Han, Y.; Wang, Y.; Liu, C.; Hu, X.; An, Y.; Du, L. Study on Thermal Conductivity of Non-Aqueous Phase Liquids-Contaminated Soils. J. Soils Sediments 2022, 23, 288–298. [Google Scholar] [CrossRef]
  19. El Idi, M.M.; Karkri, M.; Kraiem, M. Preparation and Effective Thermal Conductivity of a Paraffin/Metal Foam Composite. J. Energy Storage 2021, 33, 102077. [Google Scholar] [CrossRef]
  20. Han, Y.; Wang, Y.; Liu, C.; Hu, X.; An, Y.; Li, Z.; Jiang, J.; Du, L. Study on Numerical Model of Thermal Conductivity of Non-Aqueous Phase Liquids Contaminated Soils Based on Mesoscale. Int. J. Therm. Sci. 2024, 197, 108790. [Google Scholar] [CrossRef]
  21. Qian, Y.H.; Orszag, S.A. Lattice BGK Models for the Navier-Stokes Equation—Nonlinear DEVIATION in compressible Regimes. Europhys. Lett. 1993, 21, 255–259. [Google Scholar] [CrossRef]
  22. Wu, C.; Zhang, T.; Fu, J.; Liu, X.; Shen, B. Random Pore Structure and REV Scale Flow Analysis of Engine Particulate Filter Based on LBM. Open Phys. 2020, 18, 881–896. [Google Scholar] [CrossRef]
  23. Mei, R.; Shyy, W.; Yu, D.; Luo, L.S. Lattice Boltzmann Method for 3-D Flows with Curved Boundary. J. Comput. Phys. 2000, 161, 680–699. [Google Scholar] [CrossRef]
  24. Zhao, J.; Fu, D.; Li, Y.; Jiang, Y.; Xu, W.; Chen, X. REV-Scale Simulation of Gas Transport in Shale Matrix with Lattice Boltzmann Method. J. Nat. Gas Sci. Eng. 2018, 57, 224–237. [Google Scholar] [CrossRef]
  25. Hussain, M.; Tao, W.-Q. Thermal Conductivity of Composite Building Materials: A Pore Scale Modeling Approach. Int. J. Heat Mass Transfer 2020, 148, 118691. [Google Scholar] [CrossRef]
  26. Wang, M.; Wang, J.; Pan, N.; Chen, S. Mesoscopic Predictions of the Effective Thermal Conductivity for Microscale Random Porous Media. Phys. Rev. E 2007, 75, 036702. [Google Scholar] [CrossRef] [PubMed]
  27. Li, K.-Q.; Miao, Z.; Li, D.-Q.; Liu, Y. Effect of Mesoscale Internal Structure on Effective Thermal Conductivity of Anisotropic Geomaterials. Acta Geotech. 2022, 17, 3553–3566. [Google Scholar] [CrossRef]
  28. Li, K.-Q.; Li, D.-Q.; Chen, D.-H.; Gu, S.-X.; Liu, Y. A Generalized Model for Effective Thermal Conductivity of Soils Considering Porosity and Mineral Composition. Acta Geotech. 2021, 16, 3455–3466. [Google Scholar] [CrossRef]
  29. Li, K.-Q.; Li, D.-Q.; Liu, Y. Meso-Scale Investigations on the Effective Thermal Conductivity of Multi-Phase Materials Using the Finite Element Method. Int. J. Heat Mass Transfer 2020, 151, 119383. [Google Scholar] [CrossRef]
  30. Wang, M.; Pan, N.; Wang, J.; Chen, S. Mesoscopic Simulations of Phase Distribution Effects on the Effective Thermal Conductivity of Microgranular Porous Media. J. Colloid Interface Sci. 2007, 311, 562–570. [Google Scholar] [CrossRef]
  31. Ramirez-Moreno, M.A.; Angulo-Brown, F. A Simple Model for Determining the Atmospheric Thermal Conductivity. In Proceedings of the 8th International Congress of Engineering Physics, Merida, Mexico, 7–11 November 2017; LOP: Bristol, UK. [Google Scholar]
  32. Hlavacova, Z.; Bozikova, M.; Hlavac, P.; Regrut, T.; Ardonova, V. Selected Physical Properties of Various Diesel Blends. Int. Agrophys. 2018, 32, 93–100. [Google Scholar] [CrossRef]
  33. Zhou, Y. Macro-Mesoscopic Study of Dual-Porosity Effects on Soil Thermal Conduction. Ph.D. Thesis, Nanjing University, Nanjing, China, 2019. [Google Scholar]
  34. Yao, R. Study on Influencing Factors of Thermal Conductivity of Changchun Area Silt Clay. Ph.D. Thesis, Jilin University, Changchun, China, 2019. [Google Scholar]
  35. Różański, A. Relating Thermal Conductivity of Soil Skeleton with Soil Texture by the Concept of “Local Thermal Conductivity Fluctuation”. J. Rock Mech. Geotech. Eng. 2022, 14, 262–271. [Google Scholar] [CrossRef]
  36. Qin, X.; Cai, J.; Zhou, Y.; Kang, Z. Lattice Boltzmann Simulation and Fractal Analysis of Effective Thermal Conductivity in Porous Media. Appl. Therm. Eng. 2020, 180, 115562. [Google Scholar] [CrossRef]
  37. Wang, M.; Wang, J.; Pan, N.; Chen, S.; He, J. Three-Dimensional Effect on the Effective Thermal Conductivity of Porous Media. J. Phys. D Appl. Phys. 2007, 40, 260–265. [Google Scholar] [CrossRef]
  38. Kadam, M.; Siddamal, S.V.; Annigeri, S. Design and Implementation of Chaotic Non-Deterministic Random Seed-Based Hybrid True Random Number Generator. In Proceedings of the 24th International Symposium on VLSI Design and Test (VDAT), Bhubaneswar, India, 23–25 July 2020; IEEE: New York, NY, USA. [Google Scholar]
  39. Yuan, X.; Li, N.; Zhao, X.; Li, Q. Study of Thermal Conductivity Model for Unsaturated Unfrozen and Frozen Soils. Rock Soil Mech. 2010, 9, 2689–2694. [Google Scholar]
Figure 1. (a) Sieved soil particles. (b) Prepared remolded, contaminated soil samples. (c) Thermal conductivity test.
Processes 13 01456 g001
Figure 2. Discrete velocity diagram of the D3Q19 model.
Processes 13 01456 g002
Figure 3. Multi-scale model. (a) Macroscopic model. (b) Representative volume element (RVE). (c) Microscopic model.
Processes 13 01456 g003
Figure 4. Schematic diagram of polluted soil model. Gray represents solid phase, black represents gas phase, and white represents liquid phase (ε = 0.35, So = 0.3). (a) Generation of the solid phase. (b) Generation of the liquid phase.
Processes 13 01456 g004
Figure 5. (a1,a2) NAPL-contaminated soil models (So = 0). (b1,b2) Temperature field. (c1,c2) Heat flux distribution.
Processes 13 01456 g005
Figure 6. (a1,a2) NAPL-contaminated soil models (ε = 0.45). (b1,b2) Temperature field. (c1,c2) Heat flux distribution.
Processes 13 01456 g006
Figure 7. Numerical and computational solutions in two modes. The black arrows represent the heat transfer direction.
Processes 13 01456 g007
Figure 8. Comparison between measured values and numerical solutions (ε = 0.35, So = 0).
Processes 13 01456 g008
Figure 9. The relationship between k and So, ε.
Processes 13 01456 g009
Figure 10. The relationship between ε and Dfs, Df.
Processes 13 01456 g010
Figure 11. (a) The relationship between Dfs and k. (b) The relationship between Df. and k.
Processes 13 01456 g011
Figure 12. The curve of Dfo changing with So.
Processes 13 01456 g012
Figure 13. The curve of k changing with Dfo.
Processes 13 01456 g013
Figure 14. (a) The relationship between ε and DT. (b) The relationship between k and DT.
Processes 13 01456 g014
Figure 15. (a1a3) Contaminated soil models. (b1b3) Temperature field. (c1c3) Heat flux distribution.
Processes 13 01456 g015
Figure 16. (a1,a2) Phase distribution diagrams, and the position of “liquid bridges” is in the red circle. (b1,b2) Heat flux diagrams.
Processes 13 01456 g016
Disclaimer/Publisher’s Note: The statements, opinions and data contained in all publications are solely those of the individual author(s) and contributor(s) and not of MDPI and/or the editor(s). MDPI and/or the editor(s) disclaim responsibility for any injury to people or property resulting from any ideas, methods, instructions or products referred to in the content.

