Article

Application of Composite Drainage and Gas Production Synergy Technology in Deep Coalbed Methane Wells: A Case Study of the Jishen 15A Platform

1
Linfen Branch of PetroChina Coalbed Methane Co., Ltd., Linfen 041000, China
2
Research Institute of Production Engineering and Technology, Tuha Oilfield Branch Company, Shanshan 701165, China
*
Author to whom correspondence should be addressed.
Processes 2025, 13(5), 1457; https://doi.org/10.3390/pr13051457
Submission received: 3 April 2025 / Revised: 2 May 2025 / Accepted: 7 May 2025 / Published: 9 May 2025

Abstract

:
The development of deep coalbed methane (CBM) wells faces challenges such as significant reservoir depth, low permeability, and severe liquid loading in the wellbore. Traditional drainage and gas recovery techniques struggle to meet the dynamic production demands. This study, using the deep CBM wells at the Jishen 15A platform as an example, proposes a “cyclic gas lift–wellhead compression-vent gas recovery” composite synergy technology. By selecting a critical liquid-carrying model, innovating equipment design, and dynamically regulating pressure, this approach enables efficient production from low-pressure, low-permeability gas wells. This research conducts a comparative analysis of different critical liquid-carrying velocity models and selects the Belfroid model, modified for well inclination angle effects, as the primary model to guide the matching of tubing production and annular gas injection parameters. A mobile vent gas rapid recovery unit was developed, utilizing a three-stage/two stage pressurization dual-process switching technology to achieve sealed vent gas recovery while optimizing pipeline frictional losses. By combining cyclic gas lift with wellhead compression, a dynamic wellbore pressure equilibrium system was established. Field tests show that after 140 days of implementation, the platform’s daily gas production increased to 11.32 × 10⁴ m3, representing a 35.8% rise. The average bottom-hole flow pressure decreased by 38%, liquid accumulation was reduced by 72%, and cumulative gas production increased by 370 × 104 m3. This technology effectively addresses gas–liquid imbalance and liquid loading issues in the middle and late stages of deep CBM well production, providing a technical solution for the efficient development of low-permeability CBM reservoirs.

1. Introduction

Coalbed methane (CBM) is an unconventional natural gas that exists within coal seams, primarily composed of methane (CH4) [1]. Unlike conventional natural gas, CBM mainly exists in an adsorbed state within the coal matrix, with a portion also present as free gas and dissolved gas in coal fractures and associated water bodies [2]. The development of CBM not only provides a clean energy source but also helps mitigate coal mine gas hazards and enhances the comprehensive utilization of coal resources. As a result, it has attracted widespread attention from the global energy industry [3]. With the increasing exploration and development of unconventional natural gas resources worldwide, CBM’s role in the global energy mix has been steadily rising. Countries such as the United States, Australia, and China have established relatively mature CBM development systems [4].
The production of coalbed methane (CBM) relies on effective drainage and gas recovery techniques to reduce coal seam pressure, allowing the desorbed gas from the coal matrix to migrate into the fracture system, thereby enhancing CBM production. Currently, global CBM drainage and recovery technologies mainly include mechanical pumping, foam-assisted gas drainage, plunger lift, electric submersible pumps (ESP), progressive cavity pumps (PCP), and gas lift drainage systems [5,6]. Chen et al. analyzed the mechanical pumping method, in which liquid from deep wells is pumped to the bottom-hole liquid accumulation level, thereby lifting the fluid to the surface. This technique involves high investment, advanced core technology, and significant costs, making it primarily suitable for wells with severe liquid loading or even water-flooded gas wells where conventional drainage technologies fail [7]. Bai et al. conducted dynamic foam testing to evaluate the liquid-carrying capacity of different foaming agents under varying temperature and salinity conditions. Foam-assisted gas drainage reduces liquid column density in the wellbore, thereby improving gas production rates [8]. However, this technique is primarily used for low-pressure, low-production gas wells and incurs high chemical reagent costs. Yan et al. studied hydraulically driven progressive cavity pump (PCP) lifting technology to address high-pressure gradient issues in low-production wells. Their findings indicate that a hollow screw rotor driven by reverse circulation hydraulic fluid significantly enhances lifting efficiency [9]. However, plunger lift systems are typically applied to low-production wells and have limited adaptability to wellbore inclination. Additionally, they require strict gas–liquid ratio conditions, and sand production can damage plunger components, reducing drainage efficiency. Liu et al. analyzed the lifting technologies of ESPs and PCPs, which are mainly used in high-water-yield coal seams to mechanically drain water, reduce bottom-hole flowing pressure, and enhance CBM desorption and permeability [10]. Zhao et al. investigated conventional gas lift drainage, in which high-pressure gas is injected into the wellbore to reduce liquid column density and improve drainage efficiency. This method is generally suitable for moderate- to high-production gas wells [11].
However, traditional drainage and gas recovery technologies still face numerous challenges in the development of deep CBM reservoirs. Due to the unique geological conditions of deep CBM, conventional drainage methods struggle to adapt to high-pressure, high-stress, and low-permeability coal seams, necessitating further optimization and innovation [12].
Deep coalbed methane (DCBM) generally refers to CBM resources buried deeper than 1500 m [13]. Compared to shallow CBM, deep CBM reservoirs are characterized by higher formation pressure, lower coal seam permeability, and greater reservoir modification challenges, making their development significantly more difficult than that of conventional CBM [14]. To enhance the extraction efficiency of deep CBM, researchers have explored various production enhancement techniques. Zou et al. applied ultra-high-pressure hydraulic fracturing technology for deep CBM development, in which high-pressure fluids are used to create fractures in the coal seam, forming high-permeability channels to improve gas flow [15]. However, due to the high pressure in deep coal seams, artificial fractures tend to close, reducing connectivity over long distances. Additionally, hydraulic fracturing can generate large amounts of coal fines, which may clog fractures and wellbores, further reducing drainage efficiency [16,17]. Furthermore, Mu et al. conducted a stress analysis on deep CBM formations and found that the stress conditions are highly complex. Once fractures close, permeability recovery is difficult, making it challenging for conventional fracturing technologies to maintain coal seam permeability over the long term, ultimately affecting the sustained productivity of gas wells [18]. Beyond hydraulic fracturing, Liu et al. studied horizontal wells and multilateral well technologies for deep CBM development. Based on over a decade of development practices in the study area, their team used statistical and regression analyses to classify the gas production characteristics of open-hole multilateral horizontal wells into three types: sustained high production, initially high production followed by decline, and consistently low production. Their findings guided process optimization for multilateral horizontal well technology, ultimately improving single-well gas output [19]. Multilateral wells increase the contact area between the gas well and the coal seam, connect multiple coal seams, and enhance gas recovery rates [20]. However, due to high in situ stress and weak coal rock mechanical properties in deep CBM reservoirs, wellbore collapse is common, making multilateral well construction highly challenging and cost-intensive. Additionally, deep CBM wells typically experience high water production, leading to severe liquid loading and two-phase gas–liquid flow restrictions, which in turn reduce gas production rates and affect well stability [19].
Overall, the development of deep coalbed methane (DCBM) faces several key challenges:
(1)
Extremely low coal seam permeability and high flow resistance, making it difficult for conventional drainage and production methods to effectively reduce bottom-hole pressure.
(2)
Severe liquid accumulation in the wellbore, which hinders gas flow and desorption, leading to accelerated decline in gas well productivity.
(3)
Traditional hydraulic fracturing tends to generate coal fines, which clog fractures, reduce fracture connectivity, and compromise the long-term stability of gas wells.
Therefore, optimizing drainage and gas recovery techniques to enhance the development efficiency of deep CBM has become a critical issue in the coalbed methane industry.
Engineering data from the Daji Block in China further reveal that under conditions of 2100 m vertical depth and 85 °C bottom-hole temperature, the lifting efficiency of traditional mechanical pumping systems is extremely low. More critically, the controllable range of production pressure differential in deep CBM wells is very narrow [21]. Excessive production pressure differentials can cause coal fines migration, leading to permeability damage, which necessitates high-precision pressure control within the production system. However, current technologies have yet to provide a solution that simultaneously meets the requirements for low-pressure adaptability and precise pressure regulation. To address the challenges of deep CBM development, this study proposes a circulating gas lift method in conjunction with wellhead compression and vent gas pressurization and recovery as a synergistic drainage and gas recovery technique. The circulating gas lift technology injects high-pressure gas into the wellbore, reducing liquid column density to achieve efficient drainage, while also maintaining coal seam pressure, making it suitable for high-water-yield wells and low-permeability coal seams [22]. Meanwhile, both vent gas pressurization and recovery and wellhead compression technologies work by increasing wellhead pressure to reduce bottom-hole flowing pressure, facilitating gas desorption and migration from the coal seam to the wellbore, thereby improving gas recovery efficiency [23]. The integration of these techniques effectively mitigates bottom-hole liquid accumulation, enhances drainage and gas production efficiency, and extends the productive life of gas wells.
Compared with existing drainage and gas recovery technologies applied in deep coalbed methane wells, this study introduces a novel composite drainage and production synergy technology integrating cyclic gas lift, wellhead compression, and vent gas pressurized recovery. Unlike traditional single-method approaches, our method dynamically regulates the bottom-hole pressure system through an internal circulation of produced gas combined with staged pressurization, significantly enhancing liquid unloading capacity while maintaining coal seam integrity. Additionally, the use of a mobile rapid gas recovery unit with a three-stage/two-stage compression switch design represents an innovative engineering solution to address rapid venting needs and pipeline friction losses. Field results demonstrate that this integrated process not only improves drainage efficiency and production rates but also extends the effective life cycle of deep CBM wells, achieving sustainable and high-efficiency resource development. This comprehensive strategy and its demonstrated performance provide clear technical advances over prior studies focusing on single drainage methods or static pressure control techniques.

2. Design of a Synergistic Composite Drainage and Gas Production System

The Daji Block in the Linfen Management Area of PetroChina’s coalbed methane project is the first deep CBM reservoir in China with a depth exceeding 2000 m.
At the early stage of deep coalbed methane production, the formation pressure is relatively high (22 MPa), and both water and gas production rates are extremely high. Initially, the gas primarily comes from free gas in the coal seam. In the mid-stage, the produced gas gradually transitions from free gas to adsorbed gas, and at this point, the water and gas production rates decrease rapidly, leading to unstable production. In the late stage, the formation pressure decreases (around 8 MPa), and the daily gas production decreases sharply compared to the early stage. Daily water production falls to less than 20 m3/d, and the primary source of gas is adsorbed gas from the deep coal seam.
The Jishen 15 A platform has three coalbed methane wells, all of which are horizontal wells. These wells were successively brought into production in June 2023. The producing formation is located in the Benxi Formation #8 deep coal seam system, with perforation and fracturing completed after well completion. The producing formation is situated at depths between 2900 m and 2950 m.
The completion tubing is casing φ139.7 × 12.7 mm, and the production tubing is φ60.3 × 4.0 mm. The produced natural gas density is 0.86 kg/m3, with C1 mole composition at 93.5%. The produced liquid has a mineralization level of ≥14 × 104 mg/L.
After entering the mid-to-late stage of production, the three coalbed methane wells on this platform adopted gas lifting and foam-assisted drainage technologies. These techniques effectively meet the production demands for high-volume rapid flowback during the early stage and continuous drainage and production in the later stage.
As the formation pressure and gas production rates continue to decrease, the limitations of single drainage and gas recovery technologies, such as gas lifting and foam-assisted drainage, gradually become apparent. The primary reason for this is the rapid decline in formation pressure and gas production, leading to the rapid influx of bottom water and fracturing flowback fluid into the well, which causes a sharp decrease in the gas-to-liquid ratio.
Severe liquid loading in the well leads to the risk of well shutdown, marking the onset of unstable production periods. To enable the well to resume production quickly and achieve sustained, stable production, an evaluation and analysis based on critical liquid-carrying capacity were carried out to address the issues mentioned above.

2.1. Critical Liquid-Carrying Model

The critical liquid-carrying flow method is a commonly used method for predicting liquid loading in the field. However, models like the Turner model and the Coleman model, which are based on spherical liquid droplets, do not provide satisfactory prediction accuracy for liquid loading in most gas wells in China. The Li Min model, which considers droplet deformation, offers higher prediction accuracy for liquid loading in vertical wells, but it does not take into account the effects of wellbore inclination and production rate variations on liquid accumulation in the wellbore [24].
Subsequently, researchers such as Wang Zhibin [25] and Pan Jie [26] incorporated both droplet deformation and production rates, establishing a critical liquid-carrying flow model for vertical wells. Researchers like Belfroid [27], Li [28], and Chen [29] considered wellbore inclination and developed critical liquid-carrying flow models for inclined (horizontal) wells. Additionally, Wang [30] modified the Belfroid model based on experimental data and derived a critical liquid-carrying relationship for continuous tubing, considering both wellbore inclination and liquid phase flow rates, but the application conditions remain limited.
In summary, current critical liquid-carrying flow models have not accurately or reasonably reflected the critical liquid-carrying capacity of deep coalbed methane (CBM) wells. Therefore, a thorough analysis and application of relevant models is needed, primarily comparing models such as the classic liquid model, the liquid film model, and the critical liquid-carrying flow models commonly used for gas wells in China.

2.1.1. Critical Liquid-Carrying Flow Velocity Model

(1)
Turner model
Turner [31], based on the force balance theory of droplet particles, was the first to propose the continuous liquid-carrying droplet model for gas wells. He assumed that the droplets in the gas well are spherical and analyzed the forces acting on a single droplet in a vertical pipe. The droplet is mainly subjected to the drag force exerted by the upward gas flow and its own gravitational settling force. When the drag force on the droplet in the gas flow equals the droplet’s settling gravity, the forces on the droplet reach equilibrium (Equation (1)).
v = 4 g ( ρ l ρ g ) d 3 C d ρ g
where σ -Gas–liquid surface tension, N/m; ρ l -liquid density, kg/m3; ρ g -liquid density, kg/m3; C d -drag coefficient; g -gravity acceleration, m/s2; d -droplet diameter, m; v -gas flow rate, m/s.
Through research, it was found that when the drag coefficient is taken as 0.44, the minimum critical liquid-carrying gas flow velocity for the gas well can be obtained (Equation (2)):
v c r = 5.5 [ σ ( ρ l ρ g ) ρ g 2 ] 0.25
where σ -gas–liquid surface tension, N/m; ρ l -liquid density, kg/m3; ρ g -liquid density, kg/m3; v c r -gas flow rate, m/s.
Turner validated the model using a large amount of production data and found that increasing the calculated values by 20% better matched the actual conditions of gas wells. Consequently, the final coefficient was set to 6.6 (Equation (3)).
v c r = 6.6 [ σ ( ρ l ρ g ) ρ g 2 ] 0.25
where σ -gas–liquid surface tension, N/m; ρ l -liquid density, kg/m3; ρ g -liquid density, kg/m3; v c r -gas flow rate, m/s.
(2)
Coleman model
Coleman [32] found that the critical flow rate formula proposed by Turner was derived under wellhead pressures greater than 500 psi. However, for liquid-loaded wells, the wellhead pressure is generally lower than 500 psi. He also discovered that the Turner method is not applicable to low-pressure gas wells and needs to be improved. Therefore, he proposed a critical liquid-carrying velocity model for low-pressure gas wells (Equation (4)).
v c r = 4.45 [ σ ( ρ l ρ g ) ρ g 2 ] 0.25
where σ -gas–liquid surface tension, N/m; ρ l -liquid density, kg/m3; ρ g -liquid density, kg/m3; v c r -gas flow rate, m/s.
(3)
Li Min model
Li Min [33] suggested that when droplets move in a high-velocity upward gas flow, the pressure on the front and rear of the droplet differs. Under this pressure difference, the droplet deforms from a spherical shape into an ellipsoidal shape. Based on force equilibrium in the steady state, the critical liquid-carrying velocity can be obtained (Equation (5)).
u = [ 4 g σ ( ρ l ρ g ) ρ g 2 C d ] 0.25
When the droplet takes an ellipsoidal shape, its effective windward area approaches 100%, resulting in a drag coefficient approximately equal to 1.0. Substituting this into Equation (5), the critical gas–liquid-carrying velocity is obtained (Equation (6)).
v c r = u = 2.5 [ σ ( ρ l ρ g ) ρ g 2 ] 0.25
where σ -gas–liquid surface tension, N/m; ρ l -liquid density, kg/m3; ρ g -liquid density, kg/m3; C d -drag coefficient; g -gravity acceleration, m/s2; v c r -gas flow rate, m/s.
(4)
Pan Jie model
Wei Na [34] discovered in experiments that moving droplets are approximately ellipsoidal. In a vertical wellbore, under the critical liquid-carrying velocity, the droplet is subjected to gravity, drag force, and buoyancy. When these three forces reach equilibrium, the following equation can be obtained (Equation (7)).
v c = 32 g σ V s l ( ρ l ρ g ) 3 C d K 2 f V c 3 ρ g 2
Pan Jie suggested that under mist flow conditions in the wellbore, small droplets move vertically upward like rigid spheres. Due to inertial forces, the droplets coalesce, forming larger droplets. When a single droplet reaches force equilibrium, the influence of buoyancy on the movement of larger droplets is greater than that of inertia. Therefore, a new critical liquid-carrying velocity equation is established (Equation (8)).
v c = 2.3 K C d [ σ ( ρ l ρ g ) ρ g 2 ] 0.25
where σ -gas–liquid surface tension, N/m; ρ l -liquid density, kg/m3; ρ g -liquid density, kg/m3; C d -drag coefficient; g -gravity acceleration, m/s2; v c -gas flow rate, m/s; V s l -liquid superficial velocity, m s−1; K -deformation parameters; f -friction coefficient; V c -critical liquid-carrying velocity, m s−1.
(5)
Wang Yizhong model
Wang Yizhong [35], based on the droplet morphology diagram summarized by Grace et al., suggested that droplets in the gas well liquid-carrying process mainly take a cap-shaped form. Using cap-shaped droplets as the basis, he derived the minimum critical liquid-carrying velocity for gas wells (Equation (9)).
u = 1.8 [ σ ( ρ l ρ g ) ρ g 2 ] 0.25
Since the assumptions made during the derivation of the formula do not fully correspond to the actual liquid-carrying process, it is recommended to incorporate a 25% safety factor when applying this model in practice. Thus, the field-applied minimum critical liquid-carrying velocity model is obtained (Equation (10)).
v c r = 2.25 [ σ ( ρ l ρ g ) ρ g 2 ] 0.25
where σ -gas–liquid surface tension, N/m; ρ l -liquid density, kg/m3; ρ g -liquid density, kg/m3; v c r -gas flow rate, m/s.
(6)
Yang Wenming model
Yang Wenming [36] et al. considered the influence of the production tubing inclination angle based on Turner’s droplet model. By analyzing the forces acting on droplets in an inclined pipe, they derived a critical gas velocity model for liquid carrying (Equation (11)).
v g = 1.9 [ d ( ρ l ρ g ) C d ρ g sin θ ] 0.25
Taking C d = 0.44 and recommending a larger Weber number, the critical Weber number is set as New = 30. Additionally, a 20% safety factor is incorporated. Based on Turner’s droplet model, the derived calculation method for the critical liquid-carrying velocity in an inclined pipe is given as
v c r = 6.6 [ σ ( ρ l ρ g ) ρ g 2 sin θ ] 0.25
where σ -gas–liquid surface tension, N/m; ρ l -liquid density, kg/m3; ρ g -liquid density, kg/m3; v c r -gas flow rate, m/s; θ -pipe section inclination angle.
(7)
Belfroid model
Belfroid comprehensively considered the impact of tubing inclination on both droplet and liquid film continuous transport. By utilizing the Fiedler shape function, which reflects the relationship between critical liquid-carrying velocity and pipe inclination, and combining it with Turner’s model, a semi-empirical model was developed for calculating the critical continuous liquid-carrying velocity in horizontal wells. The corresponding equation is given as
v c r = 6.6 [ σ ( ρ l ρ g ) ρ g 2 ] 0.25 ( sin ( 1.7 θ ) ) 0.38 0.74
where σ -gas–liquid surface tension, N/m; ρ l -liquid density, kg/m3; ρ g -liquid density, kg/m3; v c r -gas flow rate, m/s; θ -pipe section inclination angle, °.

2.1.2. Comparative Analysis of Critical Liquid-Carrying Velocity Models

Select two deep coalbed methane wells (all vertical wells) from each of the Jishen 10-8 platform, Jishen 12-8 platform, and Jishen 11-6 platform to compare critical liquid-carrying flow rate models. During the corresponding periods, all six coalbed methane wells were in a liquid-loading state. The platform well data are shown in Table 1.
Based on these data, we used the critical liquid-carrying flow rate model commonly applicable to gas wells in China (the critical liquid-carrying velocity model from Section 2.1.1) for the corresponding calculations. The results are shown in Table 2 and Figure 1.
Through data analysis, it was found that the Turner model, Coleman model, Pan Jie model, and Belfroid model all predict a liquid-loading state. However, the target platform consists of horizontal wells, and the wellbore has a certain degree of inclination. Therefore, we selected the Belfroid model as the primary model.

2.2. Gas Release and Rapid Recovery Device and Parameter Design

Based on the actual conditions of deep coalbed methane production and functional requirements, a recovery process is implemented where gas is vented and pressurized into the natural gas production/injection pipeline. Two specific technical measures are formulated.
(1)
Construction Process: The air is first separated from the gas–liquid mixture. The separated gas is pressurized and fed into the natural gas production/injection pipeline system, while the separated liquid is directed to the field sewage tank. This process ensures the sealing and rapid recovery and reuse of the air vented at the wellhead.
(2)
Key Technical Parameters: The critical liquid-carrying gas volume of the gas well is used as the design basis for the minimum recovery gas velocity. A venting booster device with low inlet pressure and high exhaust flow is employed to achieve the venting process, discharge accumulated liquid, and meet the self-flow re-production process requirements.
During production, the oil pressure typically ranges from 2.0 to 3.5 MPa, with an average gas production rate of 2 to 4 × 10⁴ m3/d and liquid production less than 20 m3/d. When the oil pressure decreases to the export pressure, the rapid air recovery process is initiated, quickly venting the wellhead oil pressure to 0.2 to 0.5 MPa (determined by pipeline friction).

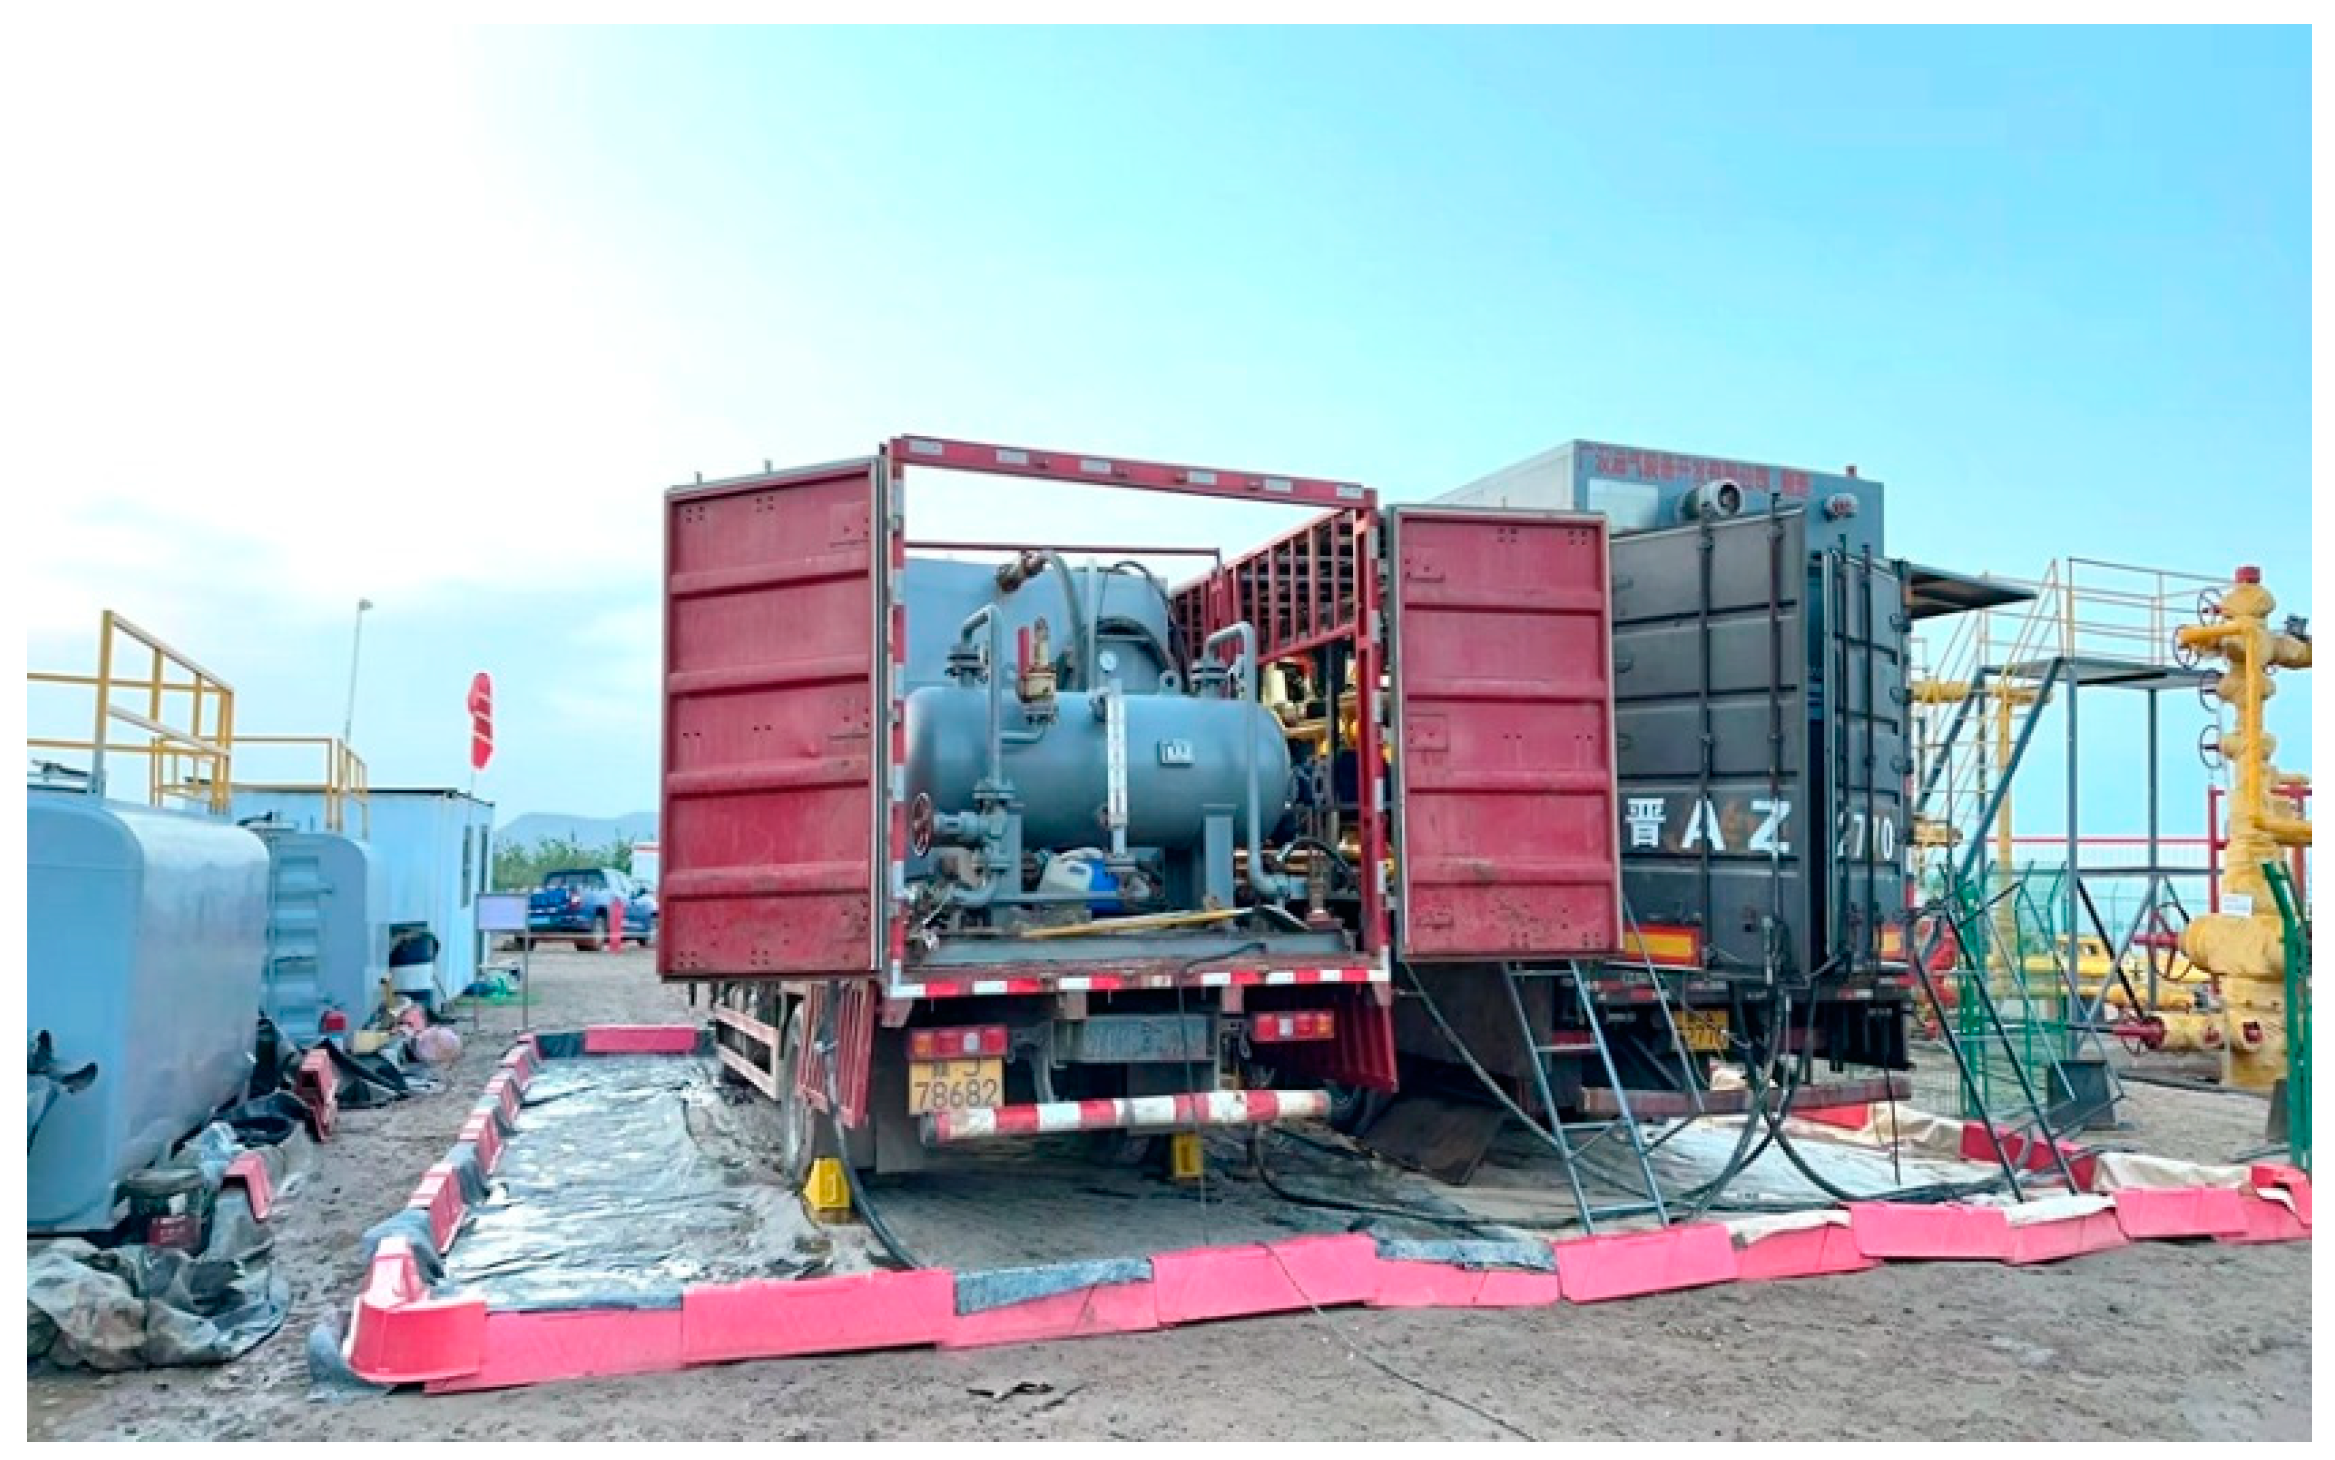
2.2.1. Gas Venting Rapid Pressurization and Recovery Device

The gas venting rapid pressurization and recovery device adopts a dual-carrier structure, consisting of two modules: the vehicle-mounted gas–liquid phase separation module and the vehicle-mounted pressurization recovery module (Figure 2), for convenient and quick relocation. The device features pressure regulation of the gas–liquid mixture during venting, gas–liquid phase separation, segment plug suppression (or segment plug capture), gas pressurization and external delivery, gas recovery metering, centralized venting, and centralized sewage discharge, meeting the requirements for air venting sealing, rapid venting, and pressurized recovery. Key process parameters, such as inlet pressure, exhaust pressure, and exhaust flow, determine the recovery efficiency of the device.
(1)
Vehicle-mounted gas–liquid phase separation module
The module mainly consists of systems such as a gas–liquid separator, level and pressure control, gas phase metering, and liquid phase metering. It can achieve pressure regulation of the gas–liquid mixture, gas–liquid phase separation, and liquid phase segment plug capture functions. At the same time, to address issues such as the presence of coal dust, formation sand, foam-depressing agents, and high mineralization of produced liquids in the vented air, the gas–liquid separator needs to be equipped with components such as mesh demisters and filter cartridge filters to ensure effective protection against coal dust, sand, foam-depressing agents, and scaling.
The working pressure of the module is 0.5 to 5 MPa, with a design pressure of 6.0 MPa. At a working pressure of 1.5 MPa, the gas treatment capacity is 15 × 104 m3/d, and the liquid treatment capacity is 100 m3/d. The extracted natural gas has a density of 0.86 kg/m3, with a C1 mole fraction of 93.5%. The produced liquid is water, with a density of 1.05 kg/cm3 and a mineralization degree of ≥14 × 104 mg/L. After separation, the droplet diameter in the natural gas should be less than 10–100 μm, and the liquid content in the separated gas should be K < 0.5 mL/m3.
(2)
Vehicle-mounted pressurization recovery module.
A statistical analysis of the oil pressure and export pressure of deep coalbed methane wells was conducted. To ensure a utilization rate of ≥80%, the inlet pressure of the recovery device (Figure 3) is determined to be Ps = 0.1~0.8 MPa, and the exhaust pressure is Pd = 2.0~5.0 MPa. Additionally, the exhaust flow of the device needs to be determined. Specifically, we use the following:
a. The production rate at different wellhead oil pressures to determine the working exhaust flow of the recovery device;
b. The critical liquid-carrying flow rate to determine the working exhaust flow of the recovery device;
c. The exhaust flow of the air venting rapid pressurization and recovery device, with the design process described in Section 2.2.3.

2.2.2. Pipeline Friction Optimization

Taking the Jishen 10B platform recovery test as an example, during the venting and recovery operation, the wellhead casing pressure drops rapidly, reaching 1.5 MPa after half an hour. At this point, the vented recovery gas volume reaches 3600 m3/h. Subsequently, the wellhead casing pressure decreases slowly, and the instantaneous recovery gas volume gradually increases, reaching the maximum exhaust flow of the equipment. However, the total water discharge throughout the process remains relatively unchanged (Figure 4). The total water discharge during the venting and recovery process increases only as the venting time extends and is unrelated to the daily water production of the gas well.
Taking the recovery test of the Jishen 10B platform as an example, during the venting and recovery operation, the wellhead casing pressure showed a rapid downward trend. According to Figure 4, within half an hour after the start of the operation, the wellhead casing pressure dropped rapidly from the initial about 2.7 MPa to about 1.5 MPa; at the same time, the instantaneous gas recovery volume rose rapidly, reaching about 3600 m3/h when the casing pressure dropped to 1.5 MPa; high-pressure gas flowed in large quantities to the low-pressure environment, and the wellbore pressure dropped rapidly, while the pressure difference was drastic, driving the gas to move to the wellhead at a higher flow rate, and the gas production increased significantly in a short period of time. Subsequently, the rate of decline of the wellhead casing pressure slowed down and entered a slow decline stage. During this period, the instantaneous gas recovery volume increased slightly and tended to stabilize, gradually approaching the equipment recovery limit exhaust capacity (about 4000 m3/h).
From the perspective of the change in the discharge volume, during the entire venting and recovery process, the instantaneous liquid production changed slightly, always maintained at a low level (less than 0.8 m3/h), and did not increase or fluctuate significantly over time. This shows that the total liquid discharge during the venting operation is mainly positively correlated with the duration of the venting, but has little to do with the daily water production of the gas well itself. That is, the cumulative increase in liquid discharge only comes from the extension of the venting time, rather than the change in liquid production.
Overall, the venting recovery operation can quickly reduce the wellbore pressure and effectively improve the gas production efficiency, but the drainage capacity is limited by the original well liquid volume and equipment recovery characteristics, and the overall change is relatively stable.
The main reason is that during the rapid venting process, the instantaneous gas volume is very large, which leads to significant pressure drop losses in the gas supply pipeline from the wellhead to the recovery device inlet. This causes the oil pressure to be too high and results in poor pressure drop and liquid discharge performance. Additionally, it leads to low inlet pressure, affecting the exhaust flow and recovery speed, further reducing the liquid discharge effectiveness.
Taking this platform well as an example, the oil pressure before venting is 2.5 MPa, and the maximum instantaneous gas volume during venting is 4000 m3/h, with an instantaneous gas–liquid ratio of 10,015 m3/m3. A pipeline friction analysis is performed based on different gas pipeline lengths and diameters to calculate the pipeline pressure P and determine the designed pipeline frictional pressure drop ΔP (Equation (14)). The calculation results are shown in Table 3.
( d p d L ) t o t a l = ( f ρ v 2 2 g d ) f r i c t i o n a l ( ρ g sin θ ) e l e v a t i o n a l
where ρ -fluid density, kg/m3; g -gravitational acceleration, m/s2; f -Moody friction factor; v -fluid velocity, m/s; d -pipeline internal diameter, m.
To reduce the tubing pressure being too high after venting due to pipeline friction, it is determined that when the pipeline length is ≤30 m, the diameter of the gas supply pipeline should be ≥DN50; when the pipeline length is ≥30~60 m, the diameter of the gas supply pipeline should be ≥DN65. Steel pipelines are used to reduce friction.

2.2.3. Gas Venting Recovery Critical Parameter Design

(1)
Determining the working exhaust flow of the recovery device based on the production rate at different wellhead tubing pressures.
At a tubing pressure of 2.6 MPa, a gas production rate of 2.85 × 10⁴ m3/d, and a gas–liquid ratio of 3 × 10⁴ m3/m3, the multiphase flow relationship of the multiphase pipe flow model is based on the Ansari model. The simulation of the bottom-hole flowing pressure for the oil production well gives a bottom-hole pressure of 4.58 MPa. The reservoir pressure is calculated to be 6.25 MPa, with a gas production index of 1580 m3/(d·MPa2).
Taking the bottom-hole as the node, node analysis is performed for tubing pressures of 0.5, 1.5, and 2.5 MPa, simulating the gas production rate during wellhead pressure reduction (Figure 5). A comparison of the post-depression production forecasts for three wells is shown in Table 4. The predicted maximum gas production rate of 5.45 × 10⁴ m3/d for Jishen 15A Platform Well 01, after the oil pressure is reduced to 0.5 MPa, is used as the design working point exhaust flow rate for the air venting rapid pressurization and recovery device.
(2)
Determining the working point exhaust flow rate of the recovery device based on the critical liquid-carrying flow rate.
Referring to the typical well Jishen 15 A Platform Well 02, with a vertical depth of 2600 m, the completion string consists of a casing φ114 mm × 2550 m, and a tubing φ73 mm × 2500 m, with an average gas–liquid ratio of 1.5 × 10⁴ m3/m3. Using the Belfroid critical liquid-carrying model, the calculation of the critical liquid-carrying flow rate Qct for three production conditions (casing, annular space between casing and tubing, and tubing) during the venting process at the shoe and wellhead positions is performed (Figure 6).
Determine the gas venting pressurization recovery rate, where the annular production recovery rate is ≥2.60 to 7.02 × 10⁴ m3/d, and the tubing production recovery rate is ≥2.01 to 3.85 × 10⁴ m3/d.
(3)
Determination of the exhaust flow rate of the gas venting rapid pressurization recovery device.
Deep coalbed methane wells are primarily produced through the annular space, but the accumulated liquid is mainly located at the tubing shoe and below, in the high-angle-to-horizontal section, which is in a casing production condition. Therefore, using the critical liquid-carrying flow rate at the casing production shoe position and an oil pressure of 1.5 MPa as a reference, the design exhaust flow rate for the air venting rapid recovery device is determined to be Qd ≥ 4300 m3/h, with Ps = 0.5 MPa, and Pd = 3.5 MPa. This design point is then used for the selection and design of the compressor unit.
(4)
Design of the pressurization recovery module structure
The vehicle-mounted pressurization recovery module is driven by a gas engine with a rated power of 382 kW and a rated speed of 1500 rpm. The compressor has a balanced opposed design with a 4-row, 4-cylinder layout (Figure 7). Cylinders 1 and 3 have a bore diameter of 8-7/8 inches with dual cylinders, cylinder 4 has a bore diameter of 7-1/2 inches, and cylinder 2 has a bore diameter of 5-1/8 inches.
(5)
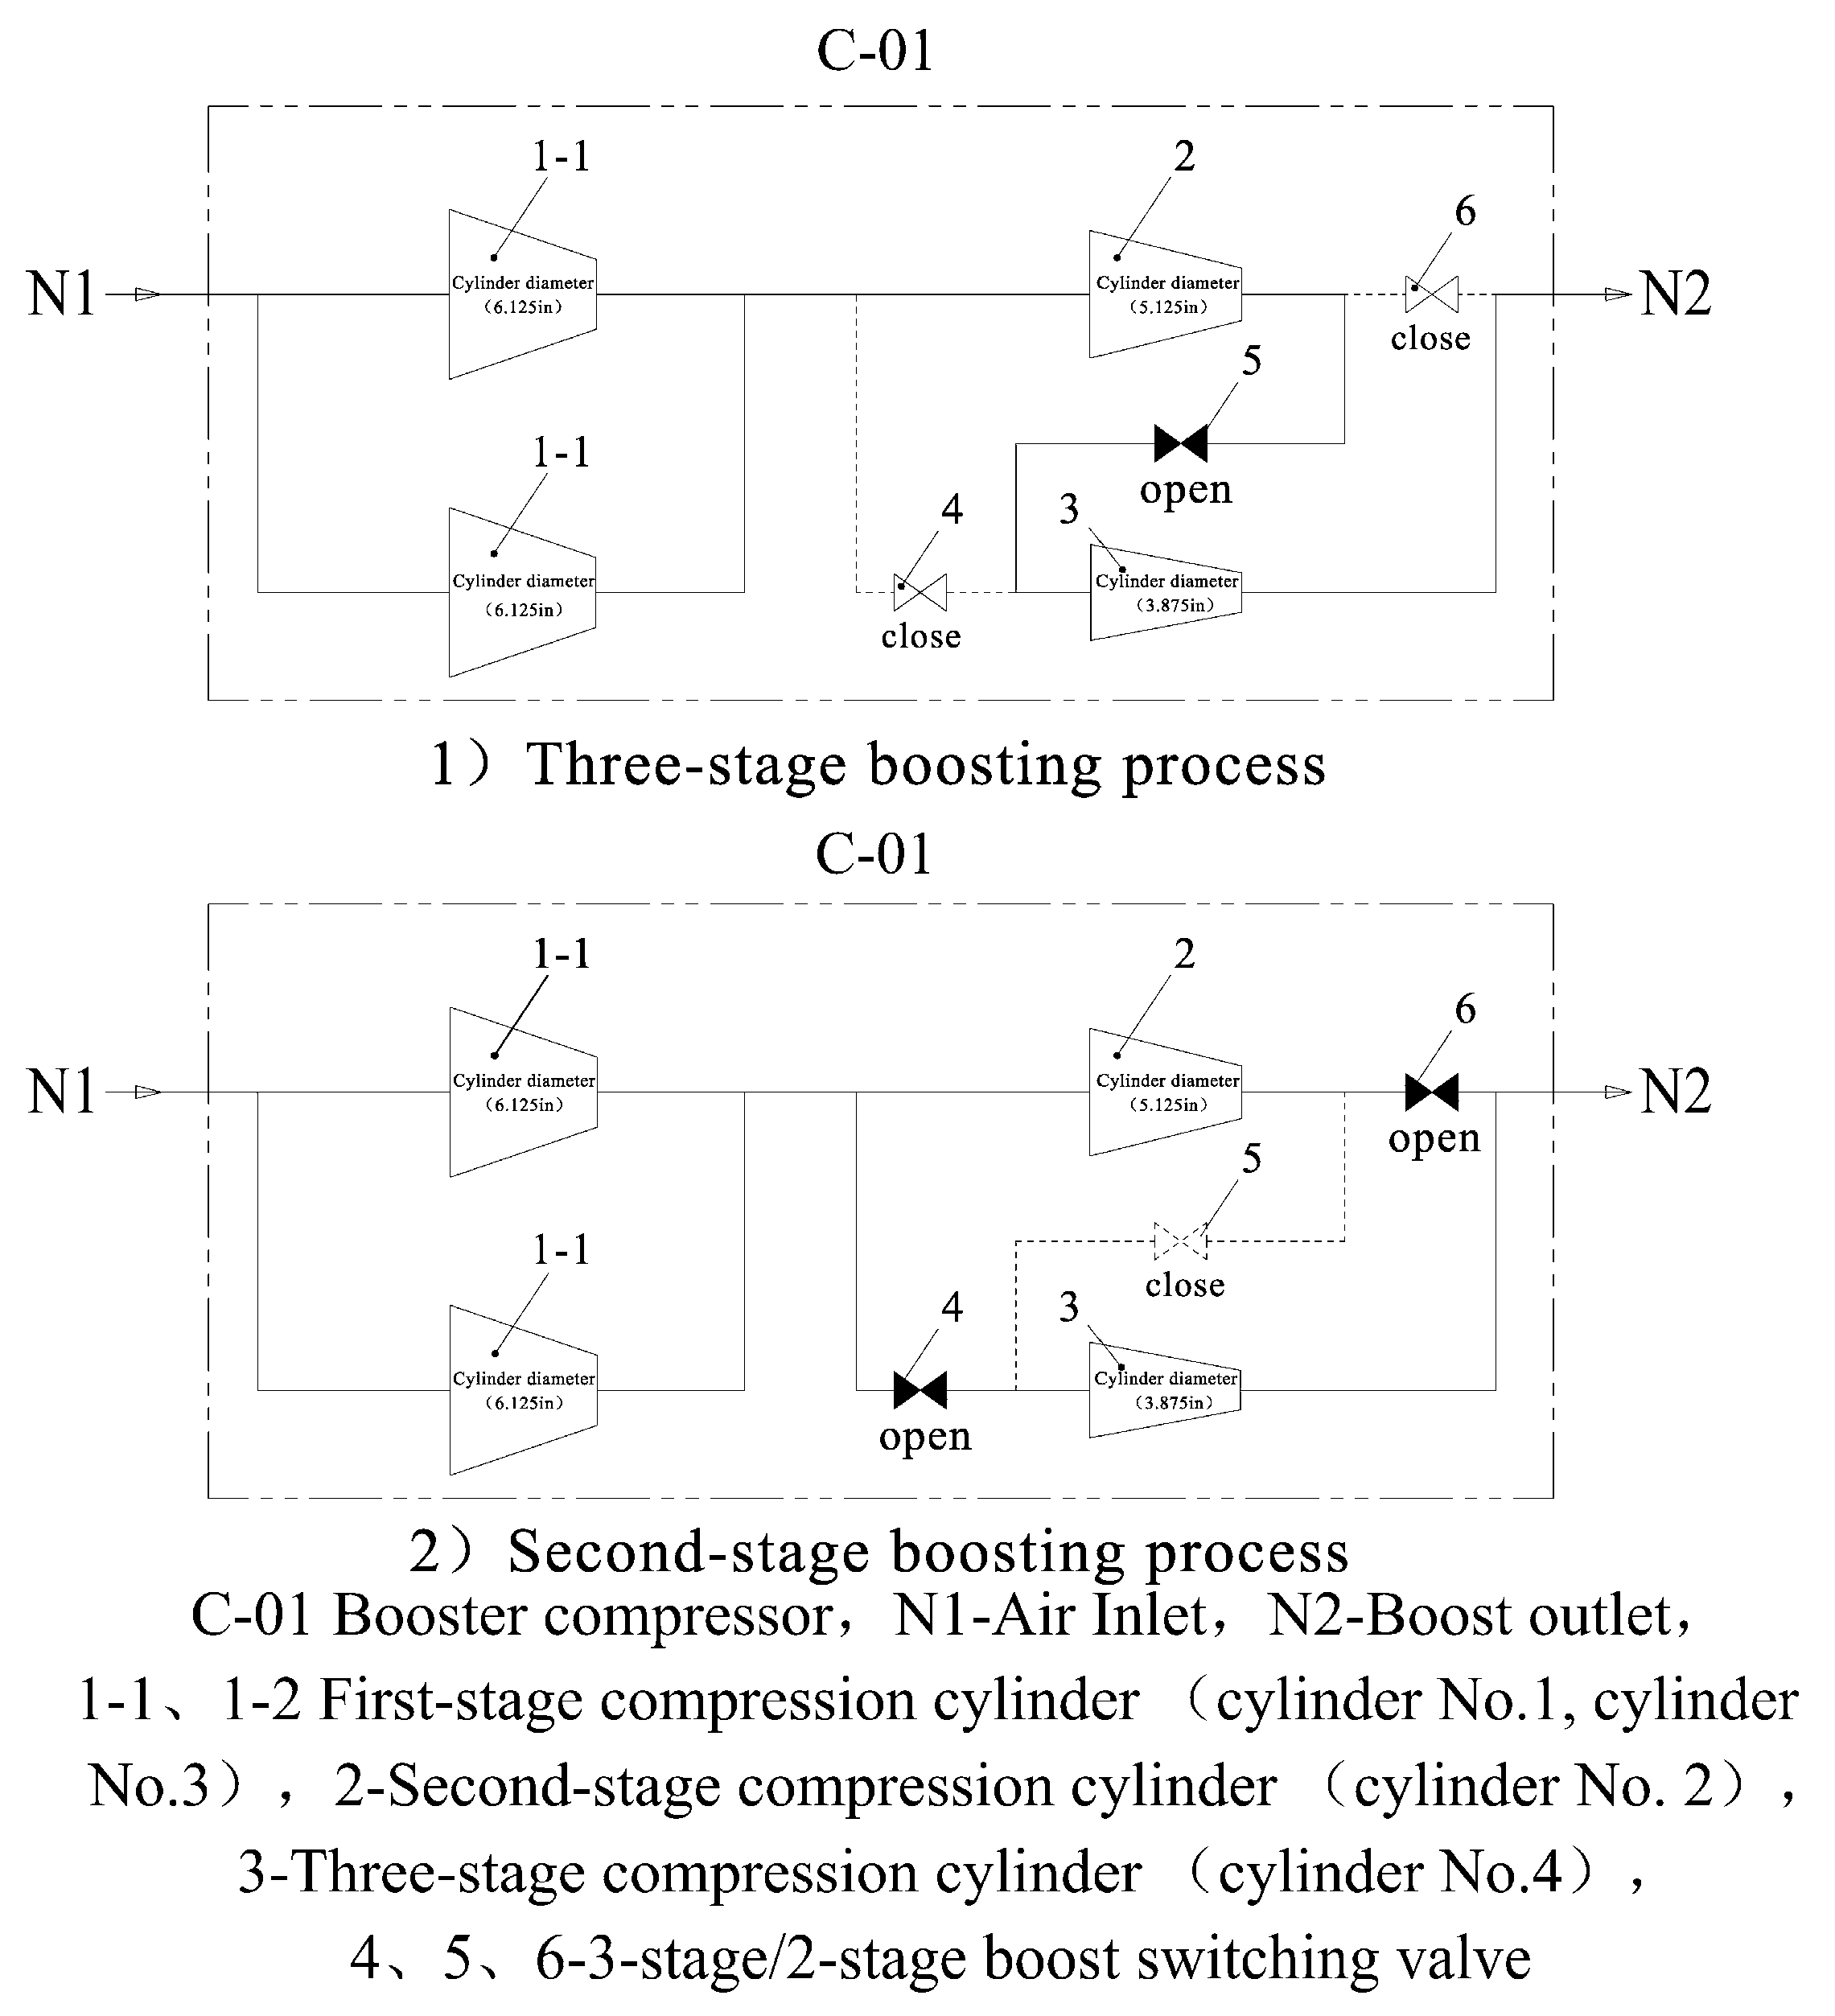
Design of the dual-flow switching process for the device’s compressed air cylinders.
An innovative three-stage/second-stage pressurization dual-flow switching design has been adopted for the compression cylinders. The process flow is shown in Figure 8. By opening and closing valves 4, 5, and 6 set on the intake and exhaust pipelines, the function of switching between the three-stage and second-stage pressurization flows can be achieved.
When valves 4 and 6 are closed and valve 5 is open, three-stage pressurization is achieved with an intake pressure of 0.1 to 0.5 MPa and a maximum exhaust pressure of 5.0 MPa. When switching valves 4 and 6 are open and valve 5 is closed, two-stage pressurization is achieved, with the first stage being pressurized by cylinder 3 and the second stage by a single cylinder. The intake pressure is 0.2 to 0.8 MPa, the maximum exhaust pressure is 3.5 MPa, and the maximum daily exhaust volume is 15.95 × 10⁴ m3/d.
The three-stage/second-stage pressurization dual-flow switching design enables the achievement of three extreme operating conditions under the same engine power: the lowest intake pressure, the highest exhaust pressure, and the maximum exhaust volume. This design aims to meet the technical objectives of achieving the lowest possible tubing pressure, the largest possible recovery gas volume, and the shortest possible recovery cycle, in order to best satisfy the rapid pressurization and recovery needs of the blow-off gas.
Compared to the three-stage/second-stage pressurization dual-flow switching technology, under the same intake pressure conditions, it can increase the exhaust volume by 10% and improve the engine power utilization efficiency by more than 20%. Under the same output power conditions, the exhaust volume can be increased by 10%.
Through the above design process, the technical parameters of the blow-off gas rapid pressurization recovery device are finalized, as shown in Table 5.

2.3. Combined Drainage and Gas Production Process

2.3.1. The Cooperative Mechanism of Gas Lift and Wellhead Pressurization

The cyclic gas lift drainage and gas production process is a type of continuous pressurized gas lift process. The principle is to continuously extract gas from the gas lift wellhead, pass it through oil–gas separation and natural gas pressurization, and then perform gas lift drainage and gas production operations on the gas lift well. The gas extracted from the wellhead is subsequently circulated for gas extraction, separation, pressurization, and injection in the gas lift process. This continues until the gas production rate at the wellhead exceeds the injection rate, at which point excess gas is exported, ensuring that low-production wells can also achieve continuous gas lift drainage and gas production.
The cyclic gas lift and wellhead pressurization combined drainage and gas production process (hereinafter referred to as the combined drainage and gas production process) is a method where wellhead pressurization measures are implemented simultaneously while performing cyclic gas lift drainage and gas production operations in a gas lift well, thereby forming a combined drainage and gas production process that integrates cyclic gas lift and wellhead pressurization. The mechanism of the combined drainage and gas production process is as follows:
(1)
Gas–liquid two-phase flow theory
The core of the liquid loading problem in gas wells lies in the energy balance of the gas–liquid two-phase flow. According to the Belfroid horizontal well critical liquid carryover velocity theoretical model selected in Section 2.1.1, the critical liquid carryover velocity of the gas well is determined by the formula
v c r = 6.6 [ σ ( ρ l ρ g ) ρ g 2 ] 0.25 ( sin ( 1.7 θ ) ) 0.38 0.74
where σ -gas–liquid surface tension, N/m; ρ l -liquid density, kg/m3; ρ g -liquid density, kg/m3; v c r -gas flow rate, m/s; θ -pipe section inclination angle, °.
(2)
Wellbore pressure gradient model
The pressure gradient of the mixed fluid in the wellbore can be expressed as
d p d z = ( ρ g ϕ + ρ l ( 1 ϕ ) ) g + f ( ρ g ϕ + ρ l ( 1 ϕ ) ) v m i x 2 2 d
where ρ l -liquid density, kg/m3; ρ g -liquid density, kg/m3; ϕ -gas content; g -gravity acceleration, m/s2; f -friction coefficient; v m i x -gas–liquid mixing speed, m/s; d -oil pipe inner diameter, m.
(3)
Dynamic complementarity of the pressure system
The synergistic effect of wellhead pressurization and circulating gas lift is reflected in the dynamic balance of the pressure system. Wellhead pressurization reduces wellhead backpressure, expanding the pressure differential across the wellbore and promoting the influx of reservoir fluids into the wellbore. Circulating gas lift, on the other hand, increases the annular pressure by injecting high-pressure gas, achieving dynamic pressure balance. This process is the overall system pressure optimization under Bernoulli’s equation (Equation (17)).
P i n j e c t i o n + 1 2 ρ g v g 2 = P t u b i n g + 1 2 ( ρ g ϕ + ρ l ( 1 ϕ ) ) v m i x 2 + Δ P f r i c t i o n
where P i n j e c t i o n -injection pressure, MPa; ρ g -liquid density, kg/m3; v g -gas velocity, m/s; P t u b i n g -tubing pressure, MPa; v m i x -gas–liquid mixing speed, m/s; ϕ -gas content; Δ P f r i c t i o n -friction loss, MPa.
After pressurizing the wellhead output gas, it is re-injected into the annular space of the casing, forming an “internal circulating gas source”, which reduces the gas lift cost. At the same time, by injecting high-pressure gas, the annular pressure is increased, lifting the liquid from the oil pipe in reverse, forming a “depressurization–pressurization” dynamic balance that maintains the wellbore pressure gradient.

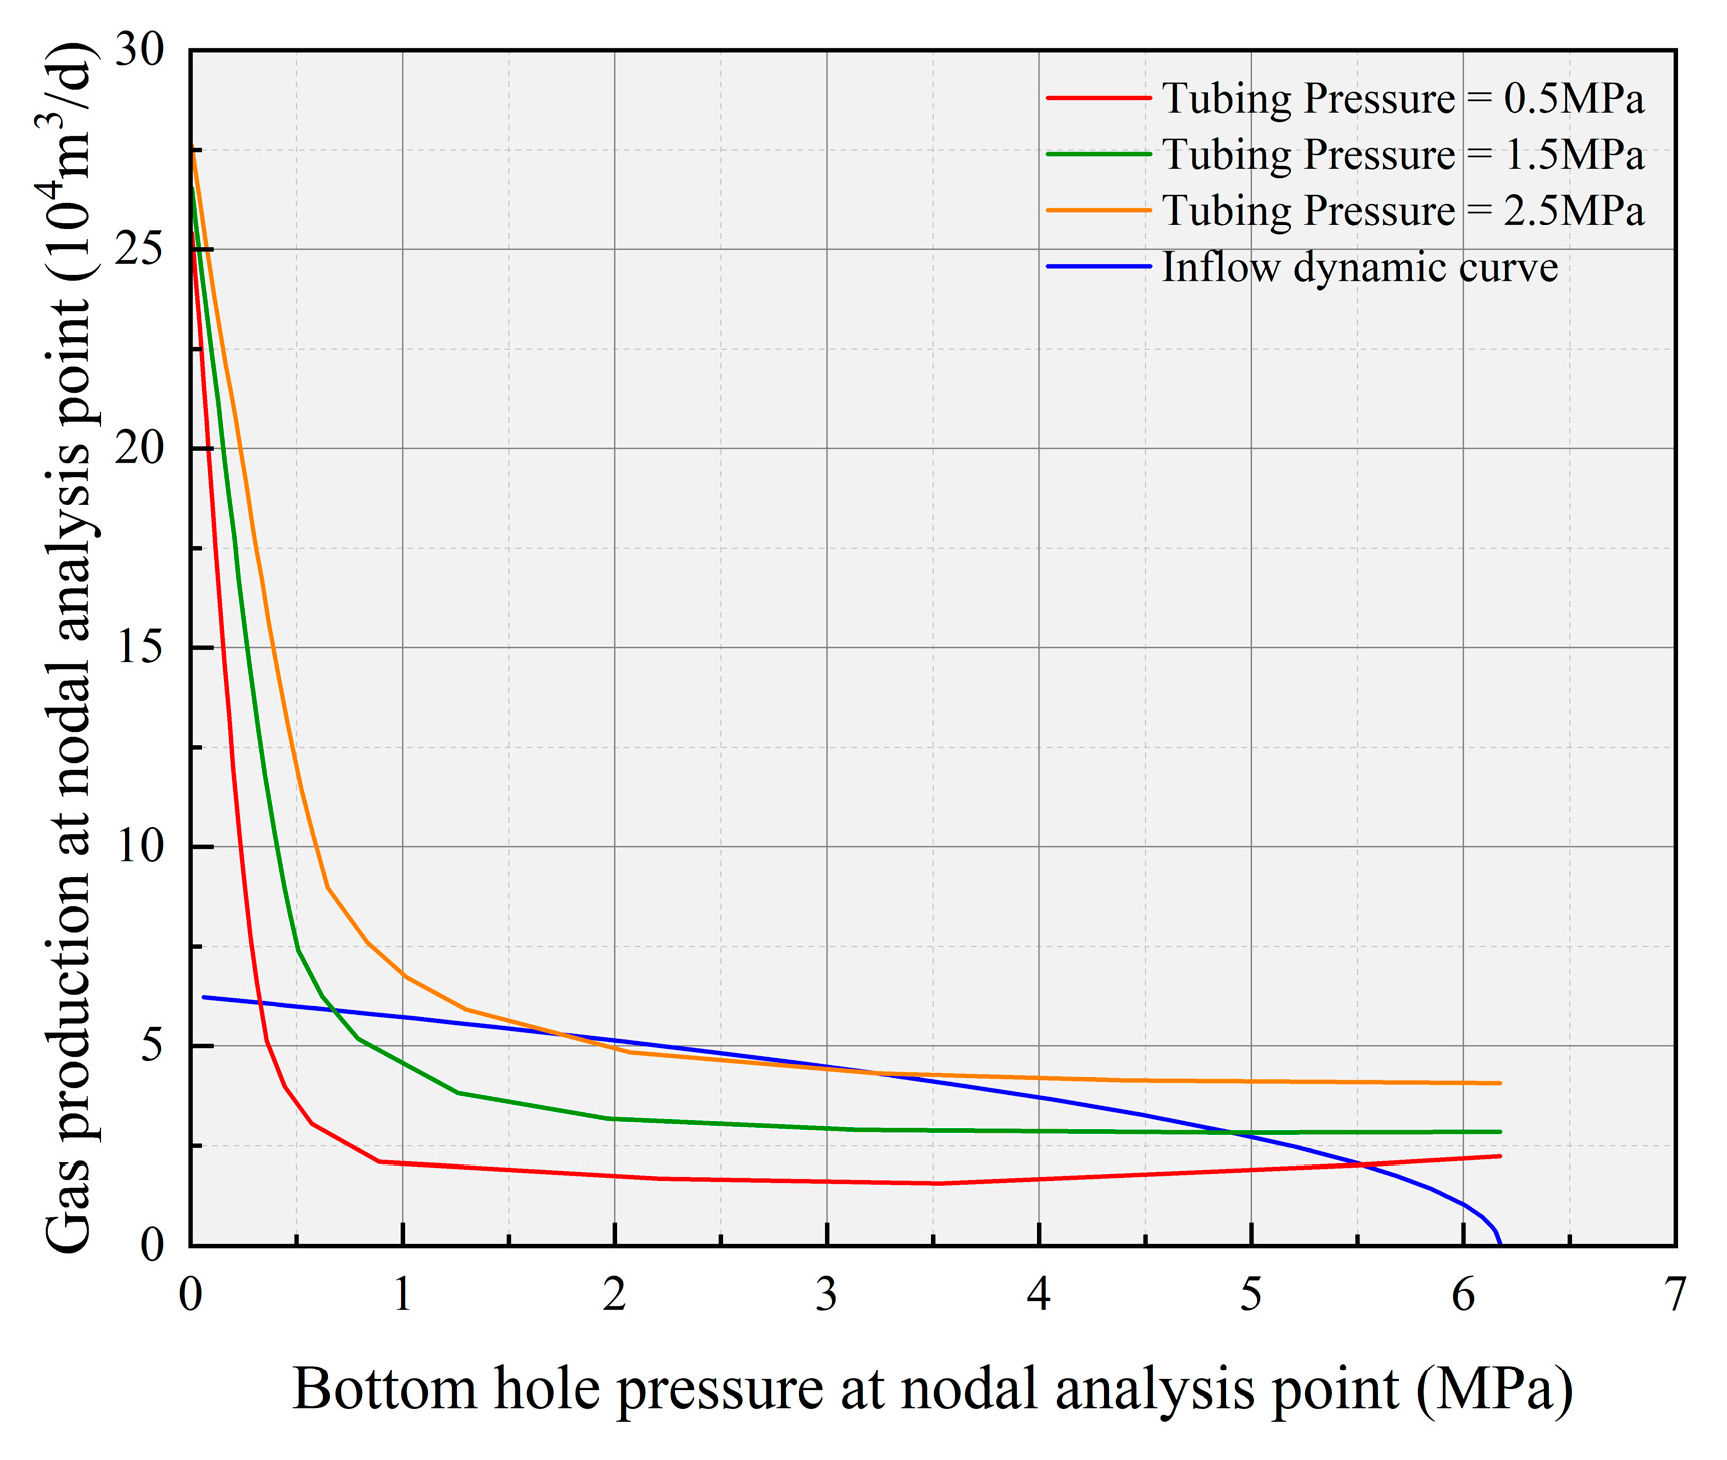
2.3.2. Production Dynamics Analysis and Parameter Optimization

Taking the typical well Jishen 15A Platform 02 as an example, under the typical operating conditions of a gas-to-liquid ratio of 2 to 4 × 10⁴ m3/m3, the multiphase flow correlation for tubing production is based on Ansari’s model, while the multiphase flow correlation for annular production is based on Beggs and Brill [37]. Simulations of the bottom-hole flowing pressure for tubing and annular production are conducted.
According to the simulated gas production rate–bottom-hole flowing pressure relationship (Figure 9), under the gas-to-liquid ratio of 2 × 10⁴ m3/m3, when the single-well gas production rate is ≤7.3 × 10⁴ m3/d, the bottom-hole flowing pressure for tubing production is between 3.0 to 4.0 MPa, which is lower than the bottom-hole tubing pressure for annular production. This is more favorable for low-pressure production in the later stages, and it is recommended to use tubing production. When the gas production rate exceeds this value, annular production should be adopted.
At the same time, as the gas-to-liquid ratio increases to the 4 × 10⁴ m3/m3 condition (Figure 10), when the single-well gas production rate is ≤4.6 × 10⁴ m3/d, the bottom-hole flowing pressure for tubing production is slightly lower than the bottom-hole oil pressure for annular production, but the difference is no longer significant. In the low gas production phase, the advantage of tubing production is not apparent.
Comprehensive analysis of Figure 8 and Figure 9 shows that the bottom-hole pressure is sensitive to changes in gas production and gas–liquid ratio. When the production is low, the inner diameter of the tubing is small, and the liquid is easily carried up by the gas, which reduces the pressure of the liquid column; when the production increases, the gas velocity in the tubing increases, and the friction and pressure drop also increase, resulting in an increase in the bottom-hole pressure. As the gas–liquid ratio increases, the gas density decreases, the ability to carry liquid increases, and the friction in the wellbore changes accordingly; therefore, under high gas–liquid ratio conditions, the gas–liquid-carrying performance is good regardless of the tubing or the annulus, and the tubing size advantage is not obvious. Therefore, when the gas production increases slightly, the bottom-hole pressure decreases, and when the production increases further, the friction becomes significant, and the bottom-hole pressure increases; the increase in the gas–liquid ratio improves the overall liquid-carrying performance and reduces the flow pressure drop, and it is necessary to flexibly select tubing or annulus production methods according to different stages.
The critical liquid-carrying flow rate for the typical deep coalbed methane well Jishen 15A Platform 02 is calculated using the Belfroid critical liquid-carrying flow velocity model. The calculation is conducted for two production scenarios: the tubing–annulus flow channel and the tubing flow channel, determining the critical liquid-carrying flow rate at the casing shoe, as shown in Figure 11.
When the wellhead pressure is between 1.5 and 2.6 MPa, the critical liquid-carrying flow rate (Qct) for annular production is ≥6.31 to 7.59 × 10⁴ m3/d, while for tubing production, the critical liquid-carrying flow rate (Qct) is ≥1.93 to 2.29 × 10⁴ m3/d. Based on the results from two evaluation methods—well bottom pressure and critical liquid-carrying flow rate—the optimization for the three wells on the Jishen 15A platform indicates that tubing production is preferred. Additionally, the gas lift method for all wells is determined to be annular gas injection.
The three wells on the Jishen 15A platform are currently in the production phase. According to the well bottom pressure test data for these three wells, the well bottom pressure at the shoe ranges from 3.1 to 9.2 MPa. The well bottom pressure is calculated using the gas column pressure distribution method (Equation (18)).
P g ( x ) = P s o ( 1 + ρ g o g T o x P o T a V Z a V )
where P g ( x ) -gas column pressure, MPa; P s o -initial gas pressure, MPa; ρ g o -gas density kg/m3; T o -standard temperature, K; x -height, m; P o -standard atmospheric pressure, MPa; T a V -well gas temperature, K; Z a V -gas compressibility factor, dimensionless.
The core equipment of the combined drainage and gas extraction process is the integrated circulation gas lifting and wellhead boosting device. The integrated device selected for this experiment uses a gas engine with a power of 280 kW. It adopts a gas lift–wellhead boosting dual-flow design with an intake pressure of 0.5 to 2.0 MPa. When gas lifting and injecting, the designed exhaust pressure is 8 MPa with an exhaust capacity of 10 × 104 m3/d. When performing wellhead boosting, the designed exhaust pressure is 4 MPa with an exhaust capacity of 15 × 104 m3/d.

2.4. Technical Route and Measures

After multiple rounds of validation, the final construction approach (Figure 12) is determined as follows:
  • Lower the wellhead oil pressure to expand the production pressure differential in the wellbore, and conduct short-term, multiple rapid wellhead venting operations to efficiently discharge accumulated liquid and achieve the process objective of gas well resumption.
  • Recover the vented gas in a sealed manner to reduce gas waste, protect the environment, and lower production safety risks.
  • After the venting process, the well’s critical liquid-carrying capacity significantly decreases. At this point, when the gas well’s output approaches the critical liquid-carrying rate, the cyclic gas lift process is introduced into production (Figure 13) to achieve gas well activation and continuous liquid drainage.
  • Gas separation is carried out, with a portion of the gas being further compressed and reinjected, while the remaining gas is directed to booster transmission equipment for entry into the pipeline network.

3. Field Test Verification of the Composite Drainage Gas Recovery Synergistic Process

3.1. Field Test of the Composite Drainage Gas Recovery Synergistic Process

The test began on 7 February 2024, on three wells at the Jishen 15 A platform, following the wellhead rapid depressurization + cyclic gas lift + wellhead pressurization synergistic process. The production curves before and after the test are shown in the figure below (Figure 14).

3.2. Field Test Effect Evaluation

(1)
After implementing the combined drainage and gas production process test, the platform’s gas production significantly increased. As of 27 June 2024, the combined drainage and gas production process had been tested for 140 days, with a daily gas production of 11.32 × 10⁴ m3/d and daily water production of 4.49 m3/d, resulting in a daily gas increase rate of 35.8%. The highest daily gas production on the platform reached 5.52 × 10⁴ m3/d, with a daily gas increase rate of 54.4% (Table 6). By December 2024, the combined drainage and gas production process had been tested for 310 days, with a cumulative gas production increase of 370 × 104 m3/d, achieving significant liquid drainage and increased production results.
(2)
After the combined drainage and gas production process test, the bottom-hole pressures of all wells significantly decreased. Specifically, the bottom-hole pressure of Well Ping 01 reduced from 4.45 MPa before the test to a minimum of 2.26 MPa; the bottom-hole pressure of Well Ping 02 reduced from 3.78 MPa to a minimum of 2.73 MPa; and the bottom-hole pressure of Well Ping 03 reduced from 3.66 MPa to a minimum of 2.73 MPa (Figure 15).
(3)
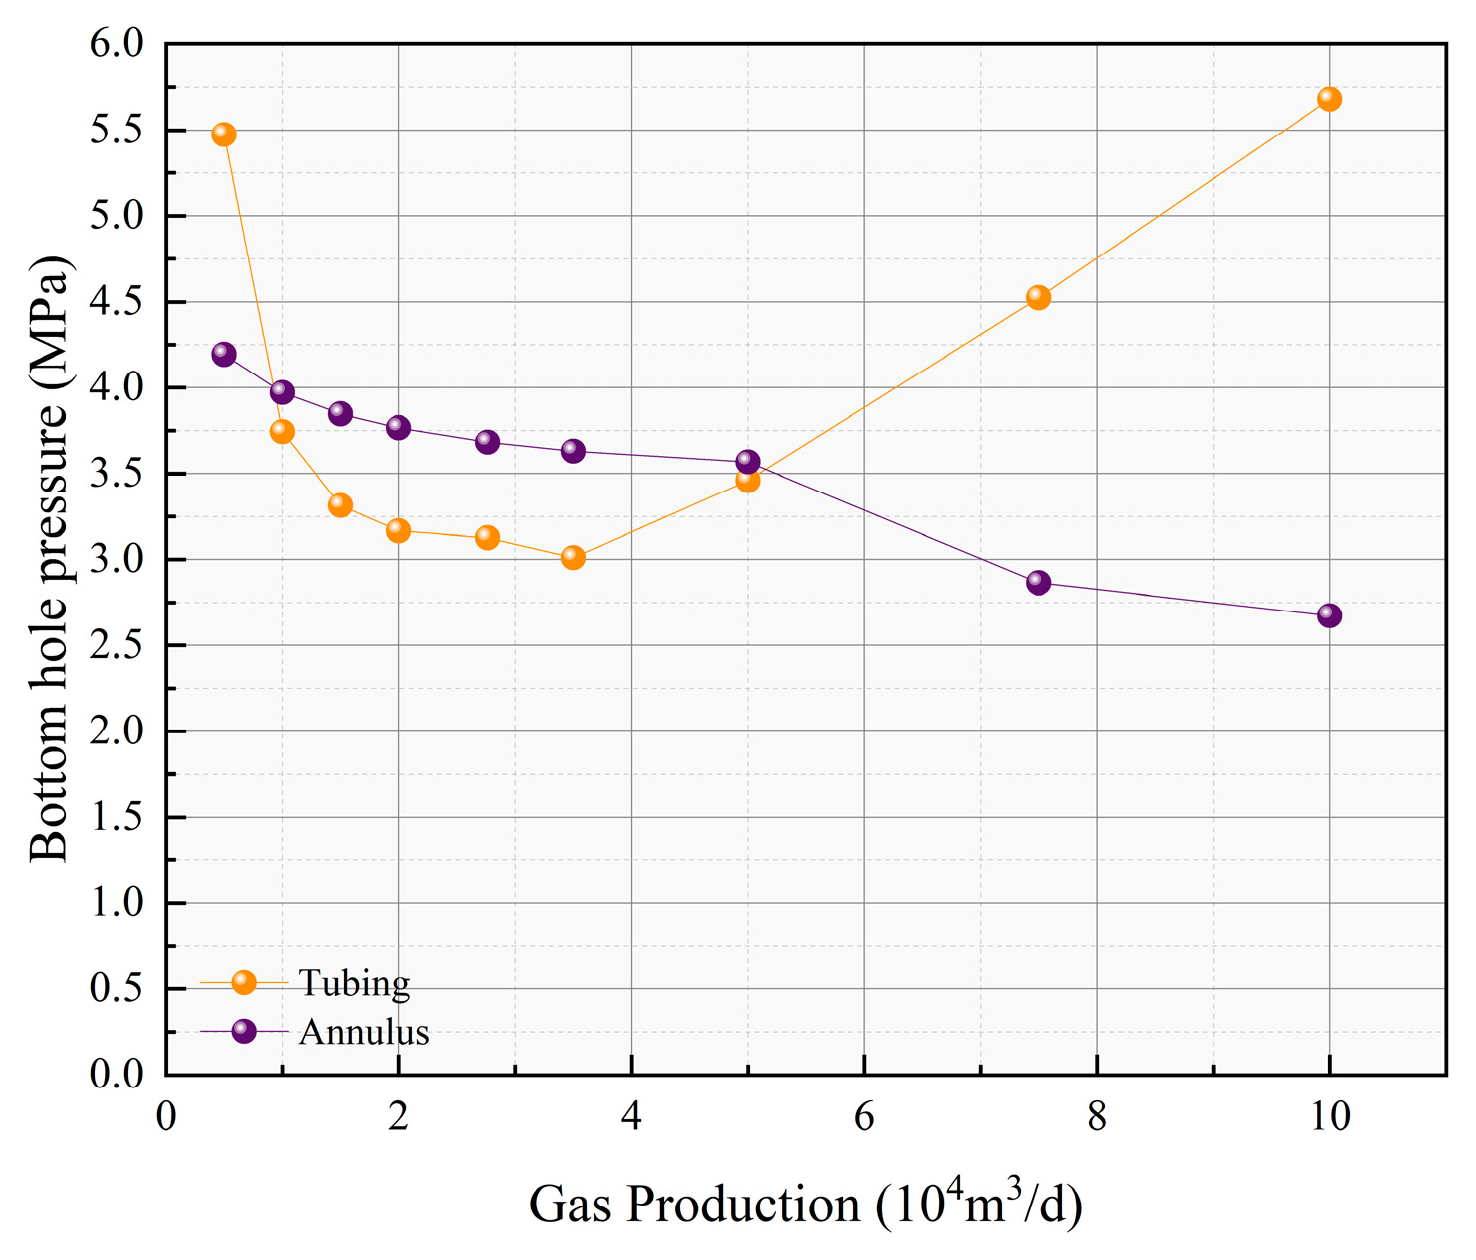
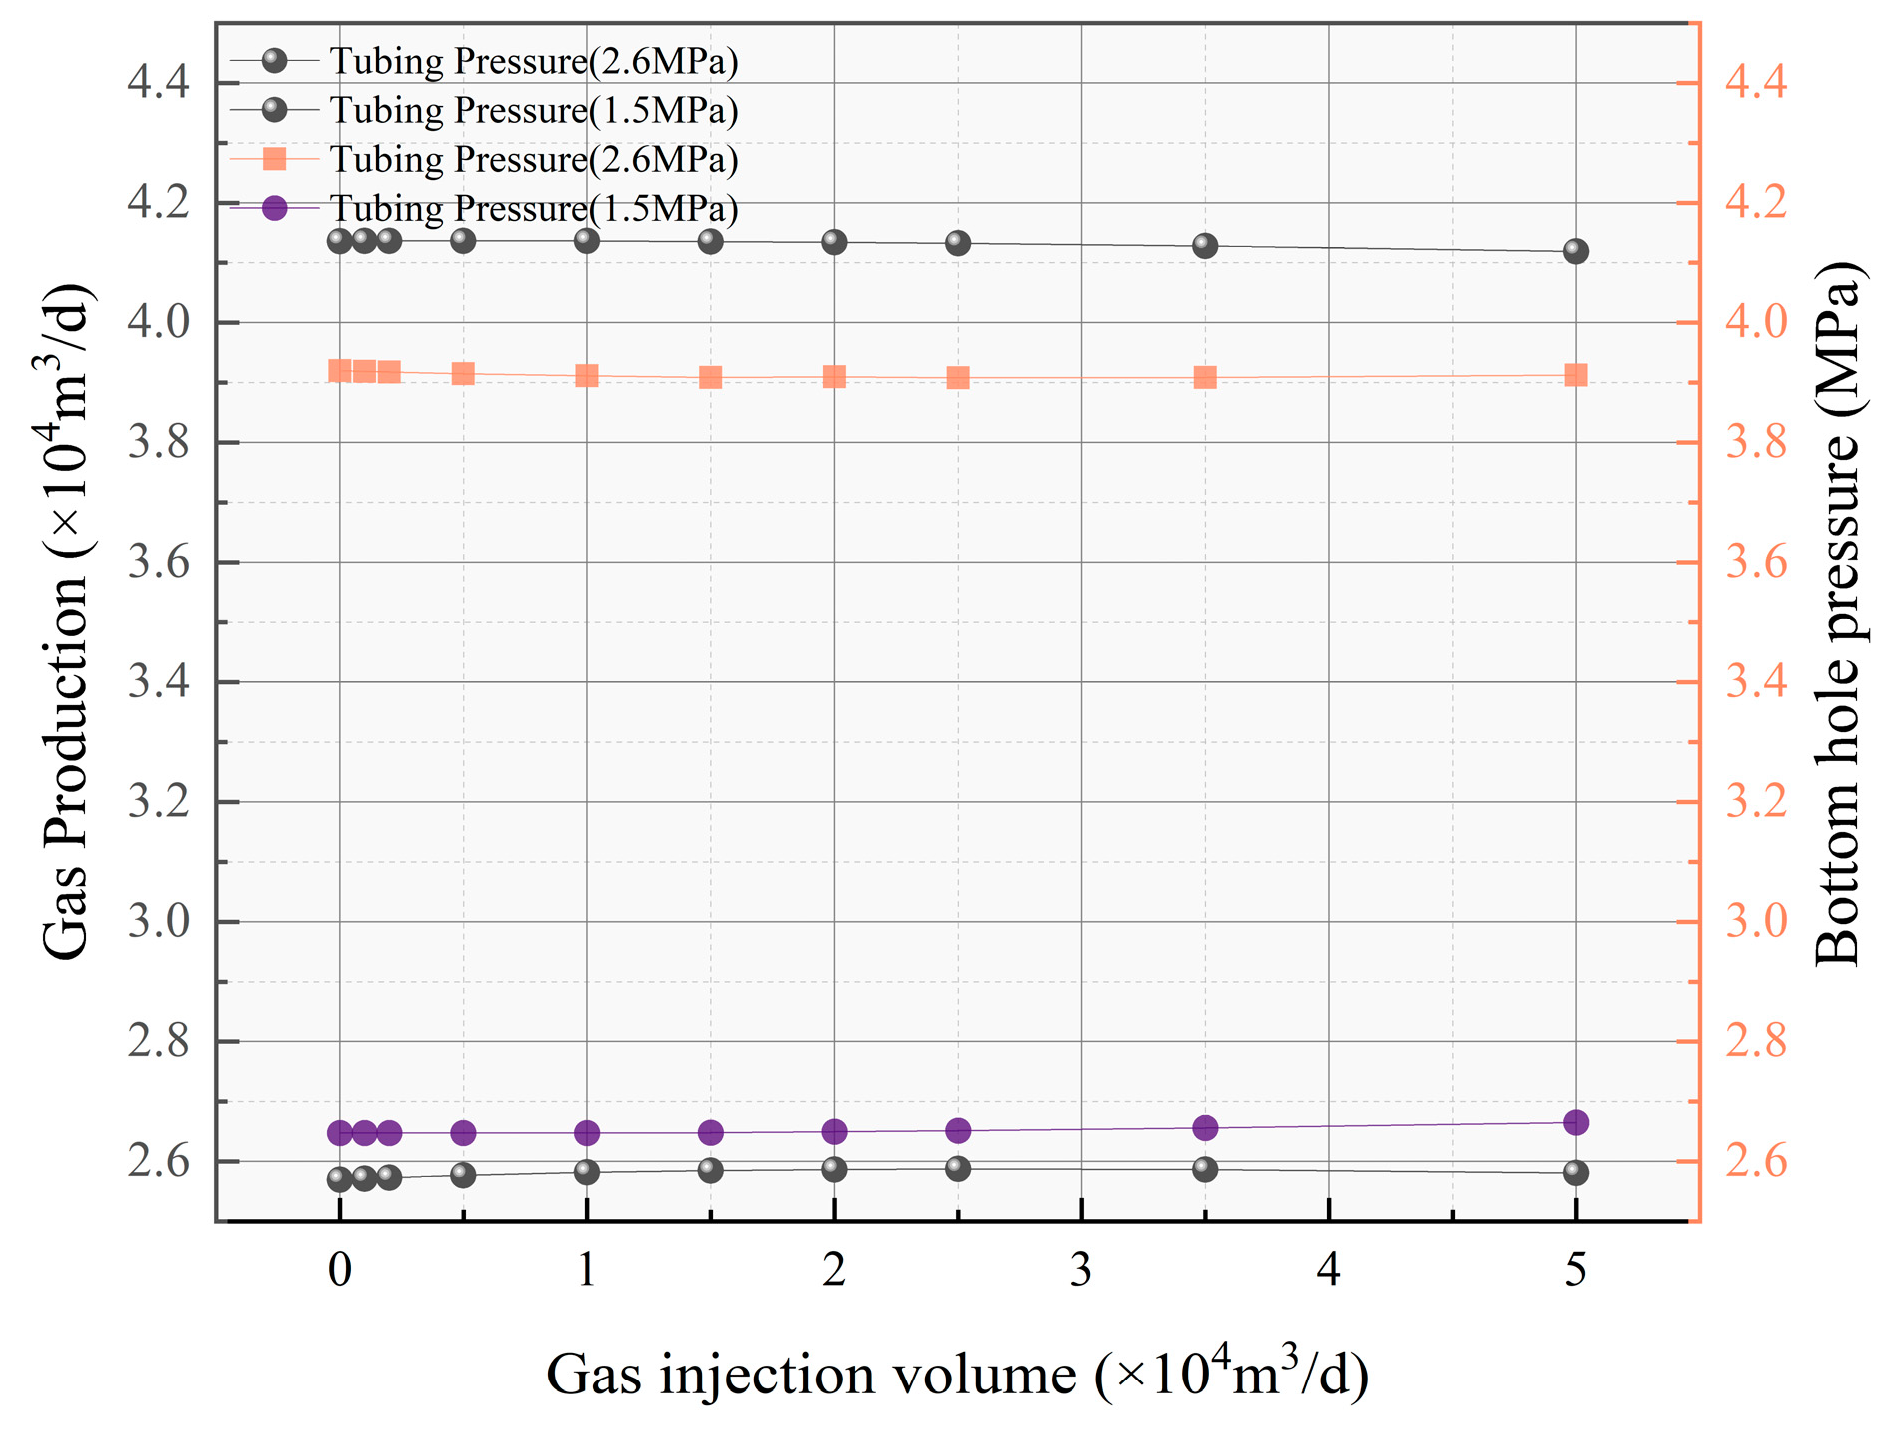
When using annular production and injecting gas into the tubing (Figure 16), the oil pressure was reduced to 2.6 and 1.5 MPa, respectively. As the oil pressure decreased, the gas production increased from 2.6 × 10⁴ m3/d to 4.1 × 10⁴ m3/d, and the bottom-hole pressure decreased from 3.9 MPa to 2.6 MPa. However, when the wellhead oil pressure remained constant and only the gas injection rate was increased from 0 to 5.0 × 10⁴ m3/d, the gas production remained almost unchanged, and the bottom-hole pressure did not significantly decrease. Therefore, it was confirmed that during annular production, reducing the wellhead oil pressure significantly affects the reduction of bottom-hole oil pressure and increases gas production, and both bottom-hole pressure and gas production are sensitive to oil pressure. Increasing the gas injection rate has little effect on reducing bottom-hole oil pressure or increasing gas production, and both bottom-hole pressure and gas production are not sensitive to the injection rate.
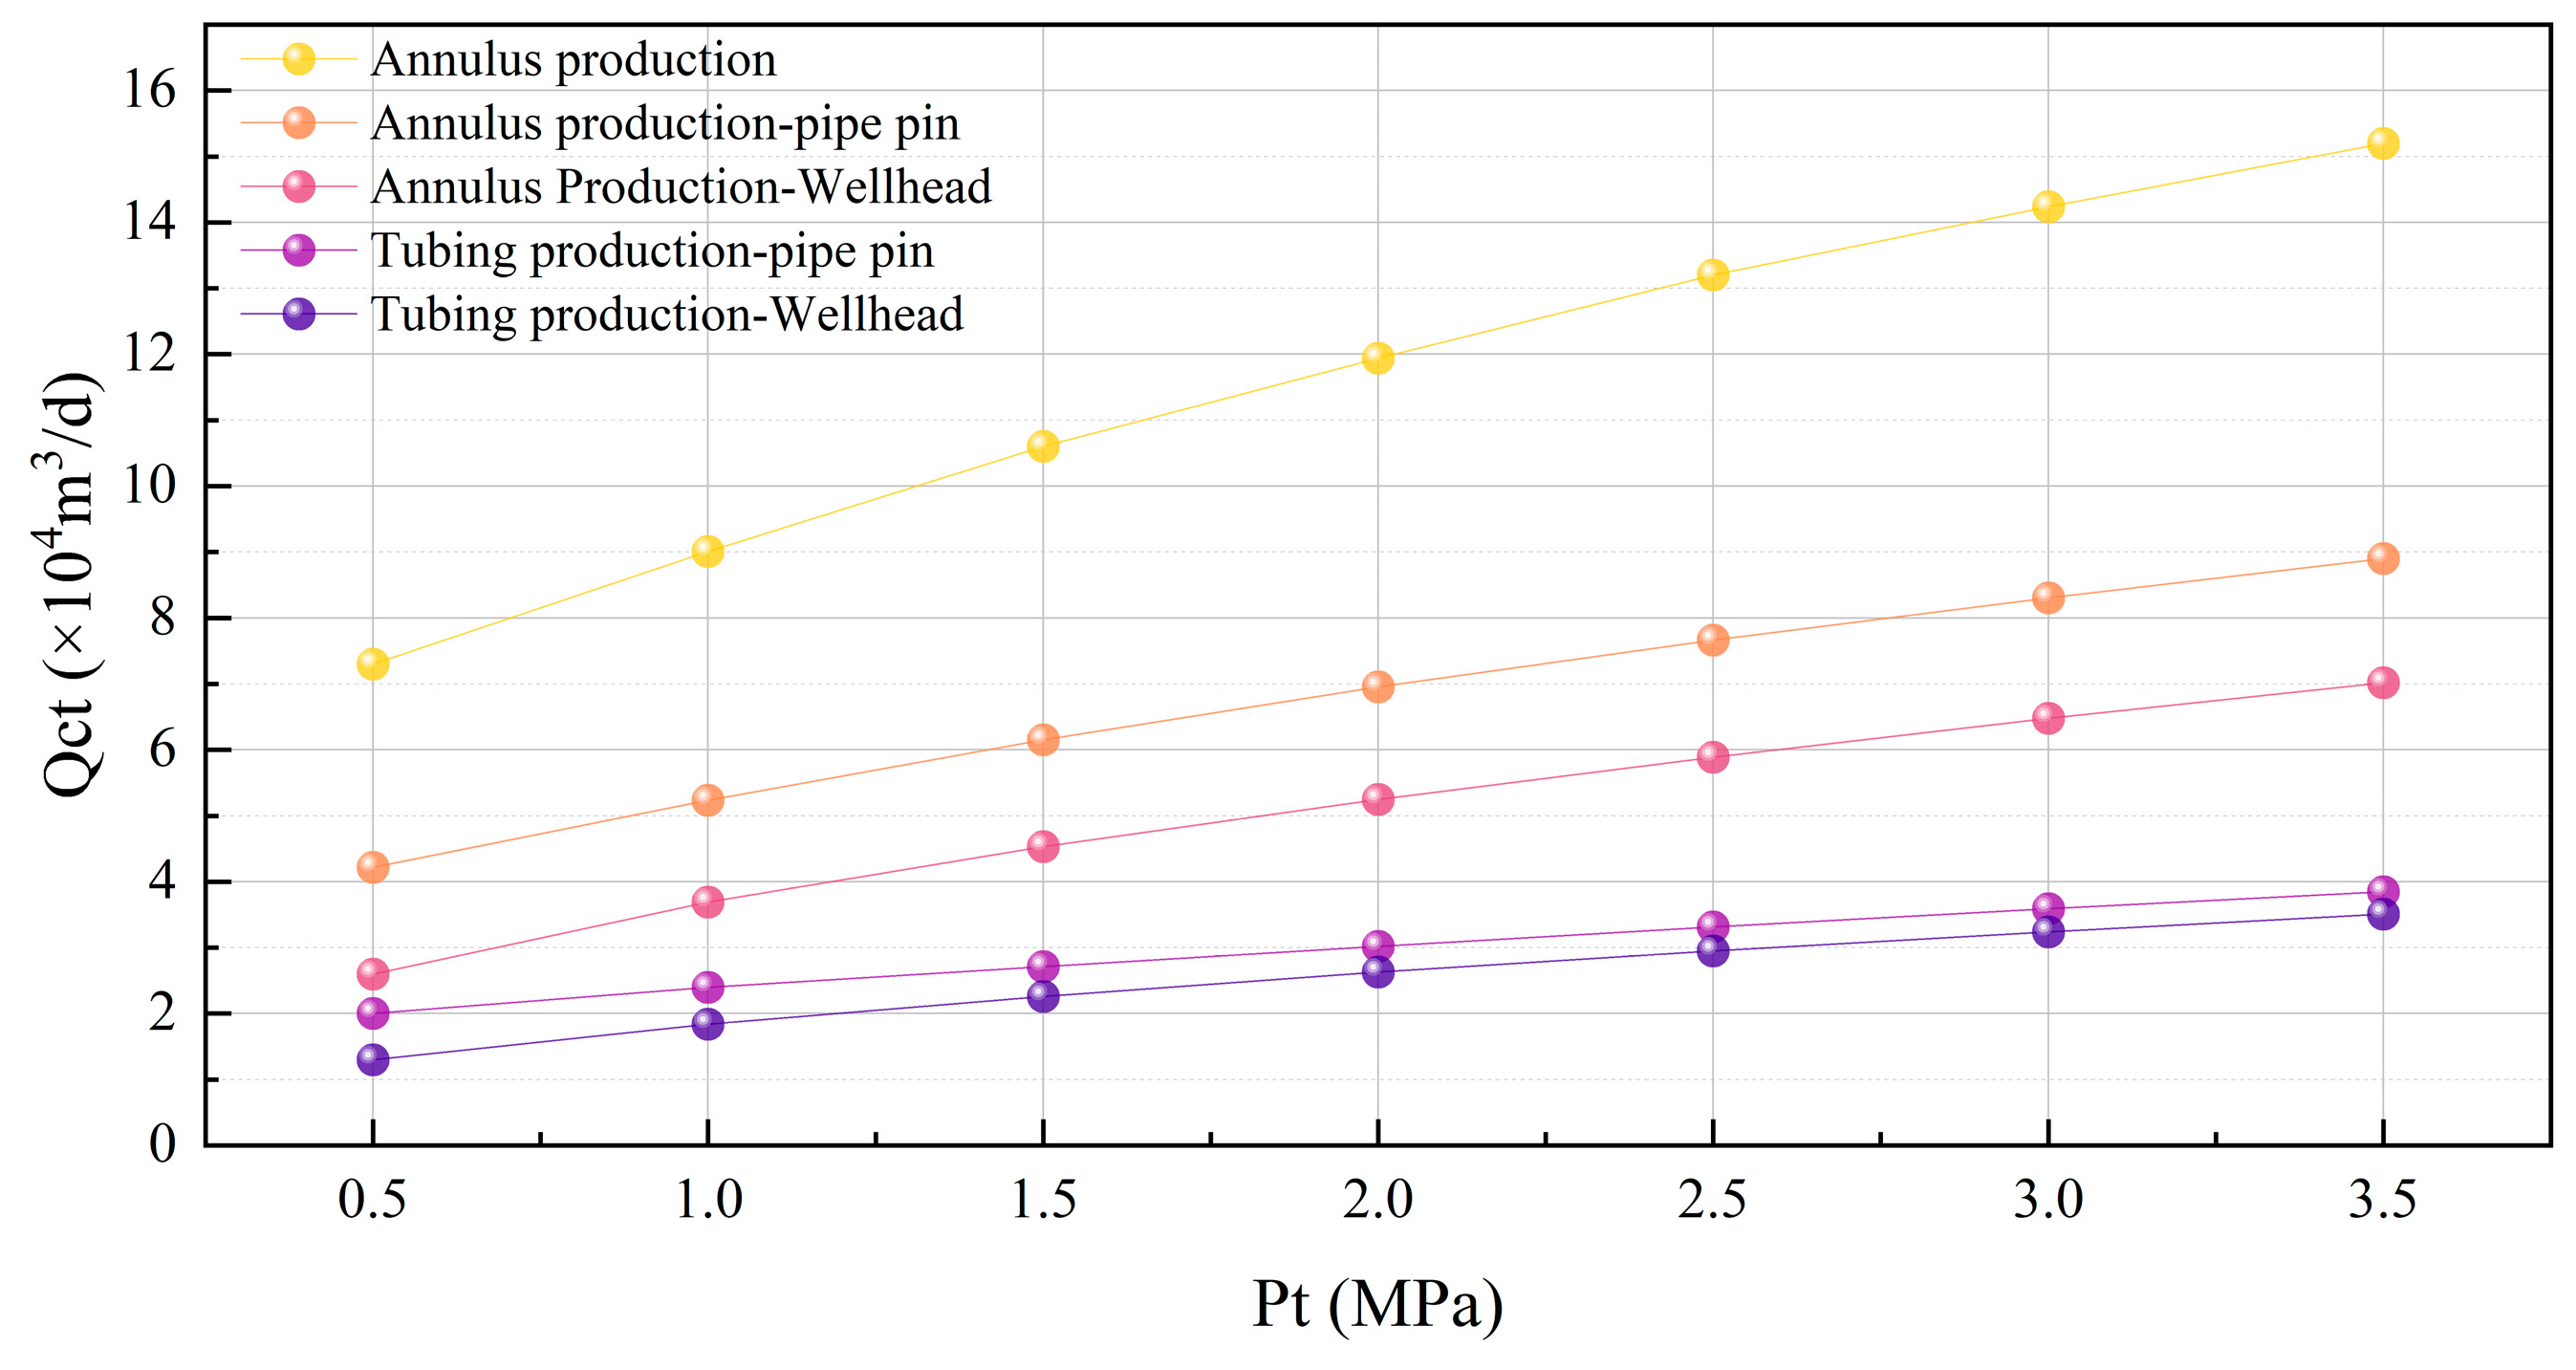
(4)
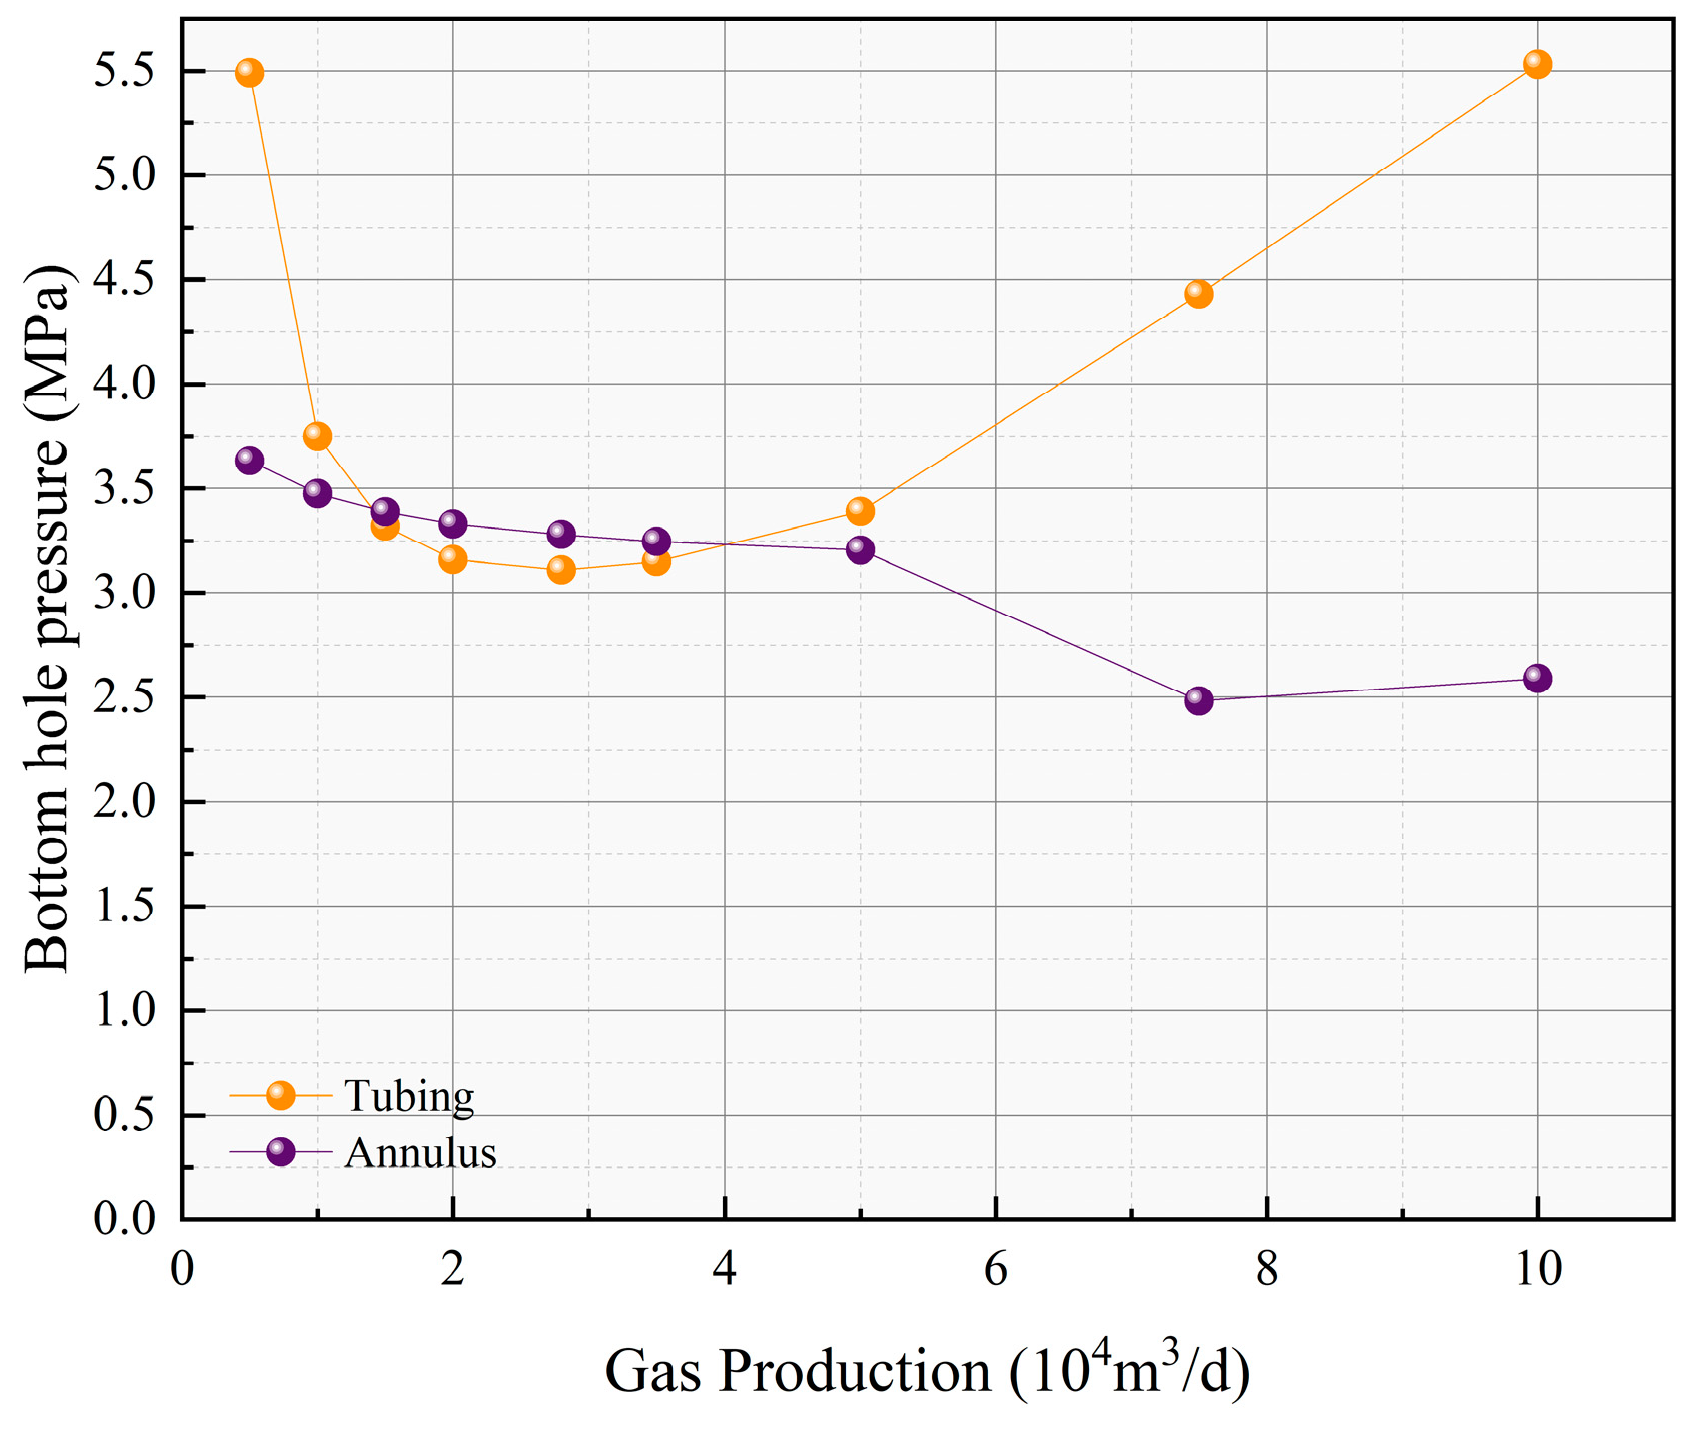
Similarly, when using tubing production and injecting gas into the annulus (Figure 17), it can be concluded that during tubing production, both lowering the wellhead oil pressure and increasing the gas injection rate lead to significant changes in bottom-hole oil pressure and gas production. Therefore, the tubing production method is sensitive to both the reduction in bottom-hole oil pressure and the increase in gas production, whereas the annular production method is not sensitive to these factors.

3.3. Potential Input–Output Ratio of Composite Drainage Technology

By replacing the traditional single deep coalbed methane drainage production process with an integrated deep coalbed methane drainage production process, not only the surface equipment process is simplified, but also the operation and maintenance costs and energy consumption are reduced. The corresponding expected cost drivers and potential production ratios are as follows (Table 7 and Table 8).
One integrated device replaced three gas wellhead boosters and one gas lift compressor, simplifying the ground process and reducing ground operation and maintenance personnel and costs by 4140 CNY/day, a decrease of 37.6%; before the test, the total power of the four drainage and production equipment engines on the platform was 450 kW, and the daily gas consumption was 3100 m3; after the test, the total power was 200 kW, the daily gas consumption was 1370 m3, and the energy consumption was reduced by 1730 m3/d, a decrease of 55.8%.
The deep coalbed methane composite drainage and production technology of Jishen 15-6A platform well has been applied for 310 days, increasing gas production by 3.7 million cubic meters and output value by CNY 7.4 million. The new technology reduces operating costs by CNY 1.24 million and saves energy consumption by CNY 1.038 million. The average input–output ratio is 1:4.6, with significant economic benefits.

4. Discussion

(1)
This process achieves efficient drainage and gas production through the dynamic coordination of “circulating gas lift–wellhead pressurization-venting air recovery”: wellhead pressurization quickly reduces the oil pressure (such as 2.5 MPa→0.5 MPa), expands the production pressure difference, and promotes fluid inflow; circulating gas lift pressurizes the recovered gas and injects it back into the annulus (8 MPa), pushing the accumulated liquid back up, forming a dynamic pressure balance of “low-pressure attraction–high-pressure lifting”; at the same time, the venting air recovery module realizes the closed circulation of methane (efficiency > 95%), which not only reduces dependence on external gas sources, but also reduces emissions. The three are coordinated to solve the separation problems of “difficult pressure reduction”, “difficult lifting”, and “waste of venting” in traditional processes, and achieved significant effects and advantages of reducing bottom-hole pressure by 38% and increasing daily gas volume by 35.8% on the Jishen 15A platform.
(2)
The results of multi-model comparison show that the Belfroid model is most suitable for the horizontal well structure adopted by the Jishen 15A platform. The model fully considers the influence of the wellbore inclination on the droplet morphology and the critical velocity of the liquid carrying, and is highly consistent with the prediction results of the on-site liquid accumulation state. In the process parameter design and gas injection rate control, the Belfroid model provides a reliable basis for the evaluation of liquid-carrying capacity, especially in the mid-to-late production stage with low pressure and low gas–liquid ratio. With the guidance of this model, the liquid-carrying efficiency has increased by more than 30%, significantly improving the overall drainage efficiency.
(3)
Through node analysis and multiphase flow simulation, the influence of parameter changes on the dynamic behavior of the wellbore under different production modes is clarified. In the annular production mode, reducing the wellhead oil pressure has a significant effect on increasing gas production and reducing the bottom-hole flow pressure, while simply increasing the gas injection volume has limited effect; in the tubing production mode, the bottom-hole pressure is sensitive to both oil pressure and gas injection volume, and the system control window is wider. Therefore, it is recommended to dynamically adjust the production mode according to the gas production stage and gas–liquid ratio, focusing on annular production in the early stage, switching to tubing production in the middle and late stages, matching the gas lift gas injection strategy, and further optimizing the overall drainage and production system.
(4)
The composite drainage gas production process adopted in this study has significant advantages: it can adapt to complex gas reservoir environments such as deep layers, low permeability, low pressure, and high water content, and combines the dynamic synergy of wellhead pressurization and circulating gas lift to improve gas–liquid-carrying capacity, reduce bottom-hole flow pressure, and extend the stable production cycle; the venting air recovery system effectively reduces environmental emissions and energy consumption, and has a high green economic value; the modular design of the equipment improves the flexibility of on-site construction and deployment, and adapts to the needs of multi-well field and multi-cycle operation. However, this process also has certain disadvantages, such as complex system structure, multiple operating parameters, and high requirements for on-site operation and control accuracy.
(5)
The composite drainage gas production process has shown good adaptability and promotion prospects in this study area, and is particularly suitable for coal–rock gas wells with deep reservoirs, high water production in the early stage, and rapid decline in the gas–liquid ratio in the later stage. It is recommended to further optimize and expand in the following directions in the future: first, introduce real-time dynamic monitoring and intelligent gas injection control systems to improve process response efficiency; second, strengthen the integrated application of multi-branch technology of horizontal wells and flexible pipe column drainage technology to improve the adaptability of complex wellbore systems; third, expand the test to different geological blocks and coal seam types, evaluate the universality and economic boundaries of the process, and provide more popular technical solutions for the efficient development of deep coalbed methane.

5. Conclusions

This paper takes the deep coalbed methane wells at the Jishen 15A platform as the research object, addressing the challenges faced in the later stages of development, such as serious wellbore liquid loading, sudden drops in gas-to-liquid ratio, and coal dust blockage. A “circulating gas lift–wellhead pressure boosting-air release recovery” combined drainage and gas recovery synergistic process is proposed and systematically studied. The main research conclusions of this paper are as follows:
(1)
Through the “circulating gas lift–wellhead pressure boosting-air release recovery” synergistic process, the daily gas production at the Jishen 15A platform increased from 8.34 × 10⁴ m3 to 11.32 × 10⁴ m3, an increase of 35.8%. The average bottom-hole pressure decreased by 38%, and the liquid loading cycle was extended by 3 times, validating the dynamic pressure balance system’s efficient regulatory capability for low-pressure, low-permeability gas wells.
(2)
The vehicle-mounted booster device uses a three-stage/two-stage booster dual-process switching technology. With an intake pressure of 0.5 MPa, the exhaust volume reaches 10.38 × 10⁴ m3, with a recovery efficiency of ≥95%. Combined with pipeline friction optimization (DN65 pipeline pressure loss ≤ 0.16 MPa), the wellhead pressure drops rapidly from 2.5 MPa to 0.5 MPa, effectively shortening the restoration cycle to 24 h.
(3)
The critical liquid carry rate model was optimized, and the Belfroid liquid carry model was selected as the main model. This model incorporates the effect of wellbore inclination, guiding a 35% improvement in the liquid-carrying capacity under tubing production. After optimizing the gas injection rate, the bottom-hole pressure was reduced by 41%.
(4)
The synergistic composite drainage and gas recovery process significantly extended the production cycle and enhanced the overall recovery rate of the three gas wells on the Jishen 15A platform. This highlights the need for further optimization and technological advancements to improve production sustainability in deep coalbed methane development.
(5)
Although this study is currently based only on the test data of the Jishen 15-6A platform, due to the small number of similar well types, other wells are still in the early stages of development and have not yet entered the appropriate production stage, resulting in limited comparable application cases. We fully recognize that this is a limitation of this study. In the future, as other wells gradually enter the corresponding production stage, we will continue to carry out follow-up research and comparative verification work to further enrich and improve the adaptability analysis and application evaluation of this process under different well conditions.
(6)
This study focuses on the implementation effect of the composite process, so it does not include a systematic analysis of environmental impacts or related risk mitigation strategies. We recognize that such assessments usually require long-term tracking and multi-dimensional data support, which is beyond the scope of this stage of research. However, we have included environmental impact assessments in subsequent research plans, and will conduct systematic research in a broader application context in the future to ensure sustainability and environmental responsibility during technology promotion.

Author Contributions

L.S. and D.L.: Writing—original draft, methodology, conceptualization, and model programming. W.Q., L.H. and A.T.: Supervision. L.Y., K.Z. and Y.Z.: Visualization, validation, and resources. L.S.: Writing—review and editing. All authors have read and agreed to the published version of the manuscript.

Funding

This research received no external funding.

Data Availability Statement

The data presented in this study are available on request from the corresponding author.

Conflicts of Interest

Authors Longfei Sun, Wei Qi, Li Hao, Lin Yang, Kang Zhang and Yun Zhang were employed by the company Linfen Branch of PetroChina Coalbed Methane Co., Ltd. Author Donghai Li and Anda Tang were employed by the company Research Institute of Production Engineering and Technology, Tuha Oilfield Branch Company.

References

  1. Lin, L.; Lu, H.; Huang, L.; Luo, P. A molecular dynamics study of methane/water diffusion and water-blocking effects in coalbed methane. Fuel 2025, 386, 134234. [Google Scholar] [CrossRef]
  2. Clarkson, C.R.; McGovern, J.M. Optimization of coalbed-methane-reservoir exploration and development strategies through integration of simulation and economics. SPE Reserv. Eval. Eng. 2005, 8, 502–519. [Google Scholar] [CrossRef]
  3. Ahmed, A.-J.; Johnston, S.; Boyer, C.; Lambert, S.W.; Bustos, O.A.; Pashin, J.C.; Wray, A. Coalbed methane: Clean energy for the world. Oilfield Rev. 2009, 21, 4–13. [Google Scholar]
  4. Moore, T.A. Coalbed methane: A review. Int. J. Coal Geol. 2012, 101, 36–81. [Google Scholar] [CrossRef]
  5. Flores, R.M. Coal and Coalbed Gas: Fueling the Future; Newnes: London, UK, 2013. [Google Scholar]
  6. Lu, Y.; Yang, Z.; Li, X.; Han, J.; Ji, G. Problems and methods for optimization of hydraulic fracturing of deep coal beds in China. Chem. Technol. Fuels Oils 2015, 51, 41–48. [Google Scholar] [CrossRef]
  7. Chen, M.; Sun, J.; Gao, E.; Tian, H. A Summary of Wellbore Fluid Accumulation and Drainage Gas Production Technology in Gas Wells. IOP Conf. Ser. Earth Environ. Sci. 2021, 621, 12113. [Google Scholar] [CrossRef]
  8. Bai, X.; Rong, F.; Zhang, Z.; Xu, J.; Wang, J.; Bai, Y.; Yang, W.; Li, Y. Study on Gas Production Mechanism of Foam Drainage and Optimization of Technological Parameters. Chem. Technol. Fuels Oils 2025, 60, 1594–1603. [Google Scholar]
  9. Liu, P.; Chen, M.; He, Z.; Luo, W.; Miao, S. Study on a gas plunger lift model for shale gas wells and its effective application. Fluid Dyn. Mater. Process. 2022, 18, 933–955. [Google Scholar] [CrossRef]
  10. Yan, Y.; Li, Z.; Shao, L.; Wang, X.; Liu, W. Experimental Study on Lifting Technology of Hydraulic Driving Screw Pump. IOP Conf. Ser. Earth Environ. Sci. 2021, 769, 042066. [Google Scholar] [CrossRef]
  11. Liu, H.; Hao, X.; Wang, L.; Cao, G. Current technical status and development trend of artificial lift. Acta Pet. Sin. 2015, 36, 1441. [Google Scholar]
  12. Yang, Z.; Zhang, Z.; Qin, Y.; Wu, C.; Yi, T.; Li, Y.; Tang, J.; Chen, J. Optimization methods of production layer combination for coalbed methane development in multi-coal seams. Pet. Explor. Dev. 2018, 45, 312–320. [Google Scholar] [CrossRef]
  13. Qin, Y.; Shen, J. On the fundamental issues of deep coalbed methane geology. Acta Pet. Sin. 2016, 37, 125. [Google Scholar]
  14. Xu, F.; Hou, W.; Xiong, X.; Xu, B.; Wu, P.; Wang, H.; Feng, K.; Yun, J.; Li, S.; Zhang, L.; et al. The status and development strategy of coalbed methane industry in China. Pet. Explor. Dev. 2023, 50, 765–783. [Google Scholar] [CrossRef]
  15. Niu, X.; Pang, D.; Liu, H.; Zhang, Y.; Cheng, G.; Cao, J.; Zhao, Y. Gas extraction mechanism and effect of ultra-high-pressure hydraulic slotting technology: A case study in Renlou coal mine. Nat. Resour. Res. 2023, 32, 321–339. [Google Scholar] [CrossRef]
  16. Zou, M.; Wei, C.; Zhang, M.; Shen, J.; Shao, C. A mathematical approach investigating the production of effective water during coalbed methane well drainage: A case study on well QNPN01 of the southern Qins hui basin, China. Arab. J. Geosci. 2014, 7, 1683–1692. [Google Scholar] [CrossRef]
  17. Yan, X.; Zhang, S.; Tang, S.; Li, Z.; Guan, W.; Zhang, Q.; Wang, J. A prediction model for pressure propagation and production boundary during coalbed methane development. Energy Fuels 2021, 35, 1219–1233. [Google Scholar] [CrossRef]
  18. Wang, W.; Li, X.; Lin, B.; Zhai, C. Pulsating hydraulic fracturing technology in low permeability coal seams. Int. J. Min. Sci. Technol. 2015, 25, 681–685. [Google Scholar] [CrossRef]
  19. Mu, Y.; Fan, N.; Wang, J. CBM recovery technology characterized by docking ground multi-branch horizontal wells with underground boreholes. Energy Sources Part A Recovery Util. Environ. Eff. 2021, 43, 645–659. [Google Scholar] [CrossRef]
  20. Liu, C.; Jia, H.; Mao, S.; Cui, X.; Peng, H.; Li, X.; Zhang, G. The development characteristics and main control factors of the open-hole multi-branch CBM horizontal wells. Coal Geol. Explor. 2018, 46, 140–145. [Google Scholar]
  21. Yin, J.; Wu, Y.; Zhang, H.; Cao, J. A research on destress mechanism of underlying roadway for gas outburst prevention in deep, low-permeability coal seam. Energy Sci. Eng. 2024, 12, 2661–2675. [Google Scholar] [CrossRef]
  22. Sun, L.; Zhao, Z.; Li, C.; Feng, R.; Meng, Y.; Li, Y. Research and Application of Treatment Measures for Low-Yield and Low-Efficiency Coalbed Methane Wells in Qin shui Basin. Processes 2024, 12, 1381. [Google Scholar] [CrossRef]
  23. Ma, T.; Liu, J.; Fu, J.; Wu, B. Drilling and completion technologies of coalbed methane exploitation: An overview. Int. J. Coal Sci. Technol. 2022, 9, 68. [Google Scholar] [CrossRef]
  24. Hu, Z.; Jin, Z.; Zhang, X.; Kong, F.; Wang, J.; Luo, Y. A calculation model for critical liquid-carrying flow rate of shale gas horizontal well section. Nat. Gas Explor. Dev. 2024, 47, 18–24. [Google Scholar]
  25. Wang, Z.; Li, Y. The mechanism of continuously removing liquids from gas wells. Acta Pet. Sin. 2012, 33, 681–686. [Google Scholar]
  26. Pan, J.; Wang, W.-J.; Wei, Y.-Q.; Chen, J.-B.; Wang, L.-L. A New Prediction Model for Continuous Liquid Carrying in Gas Wells. J. Eng. Thermophys. 2019, 40, 579–586. [Google Scholar]
  27. Belfroid, S.P.C.; Schiferli, W.; Alberts, G.J.N.; Veekenet, C.A.M.; Biezen, E. Prediction onset and dynamic behaviour of liquid loading gas wells. In Proceedings of the SPE Annual Technical Conference and Exhibition, Denver, CO, USA, 21–24 September 2008; SPE-115567-MS. [Google Scholar]
  28. Li, L.; Zhang, L.; Yang, B.; Yin, Y.; Li, D. Prediction method of critical liquid-carrying flow rate for directional gas wells. Oil Gas Geol. 2012, 33, 650–654. [Google Scholar]
  29. Chen, D.; Yao, Y.; Han, H.; Fu, G.; Song, T.; Xie, S. A new prediction model for critical liquid-carrying flow rate of directional gas wells. Nat. Gas Ind. 2016, 36, 40–44. [Google Scholar]
  30. Wang, Z.; Zhang, Y.; Sun, T.; Li, Z.; Yang, Z.; Zhu, G.; Shi, H. Dynamic behavior of single drop and critical single drop carrying gas flow rate under the well condition of gas well. Oil Drill. Prod. Technol. 2021, 43, 642–650. [Google Scholar]
  31. Turner, R.G.; Hubbard, M.G.; Dukler, A.E. Analysis and prediction of minimum flow rate for the continuous removal of liquids from gas wells. J. Pet. Technol. 1969, 21, 1475–1482. [Google Scholar] [CrossRef]
  32. Coleman, S.B.; Clay, H.B.; McCurdy, D.G.; Lee, H. A new look at predicting gas-well load-up. J. Pet. Technol. 1991, 43, 329–333. [Google Scholar] [CrossRef]
  33. Li, M.; Guo, P.; Tan, G. New look on removing liquids from gas wells. Pet. Explor. Dev. 2001, 28, 105–106. [Google Scholar]
  34. Wei, N.; Meng, Y.; Li, Y.; Liu, A.; Ban, X.; Jiang, X.; Lei, Y. Research on The Liquid Droplet’s Drag Coefficient for Continuous Removal of Liquid from Gas well. Nat. Gas Technol. 2007, 1, 50–54. [Google Scholar]
  35. Wang, Y.; Liu, Q. A new method to calculate the minimum critical liquids carrying flow rate for gas wells. Pet. Geol. Oilfield Dev. Daqing 2007, 6, 82–85. [Google Scholar]
  36. Yang, W.; Wang, M.; Chen, L.; Wu, J.; Yu, P. A prediction model on calculation of continuous liquid carrying critical production of directional gas wells. Nat. Gas Ind. 2009, 29, 82–84+141–142. [Google Scholar]
  37. Beggs, D.H.; Brill, J.P. A study of two-phase flow in inclined pipes. J. Pet. Technol. 1973, 25, 607–617. [Google Scholar] [CrossRef]
Figure 1. Comparative analysis of errors of different critical liquid-carrying flow models.
Processes 13 01457 g001
Figure 2. Vehicle-mounted gas venting rapid pressurization and recovery device assembly.
Processes 13 01457 g002
Figure 3. Vehicle-mounted pressurization and recovery module.
Processes 13 01457 g003
Figure 4. Jishen 10B Platform Well 02 recovery curve.
Processes 13 01457 g004
Figure 5. Jishen 15A Platform Well 02 nodal analysis.
Processes 13 01457 g005
Figure 6. Analysis of the critical liquid-carrying flow rate under different production conditions.
Processes 13 01457 g006
Figure 7. Cylinder structure of the pressurization recovery module.
Processes 13 01457 g007
Figure 8. Three-stage/second-stage pressurization dual-flow diagram of the pressurization recovery module.
Processes 13 01457 g008
Figure 9. Gas production vs. bottom-hole pressure (GLR 2 × 10⁴ m3/m3).
Processes 13 01457 g009
Figure 10. Gas production vs. bottom-hole pressure (GLR 4 × 10⁴ m3/m3).
Processes 13 01457 g010
Figure 11. The relationship between wellhead pressure and critical liquid-carrying flow rate.
Processes 13 01457 g011
Figure 12. Deep coalbed methane composite drainage and gas production synergistic process flow.
Processes 13 01457 g012
Figure 13. Wellhead compression + circulating gas lift physical diagram.
Processes 13 01457 g013
Figure 14. Production curve of the Jishen A platform before and after the test.
Processes 13 01457 g014
Figure 15. Platform bottom-hole flow pressure test curve.
Processes 13 01457 g015
Figure 16. Bottom-hole pressure sensitivity relationship (annulus production).
Processes 13 01457 g016
Figure 17. Bottom-hole pressure sensitivity relationship (tubing production).
Processes 13 01457 g017
Table 1. Platform well production status.
Well NumberTubing PressureGas ProductionLiquid
Production
Pipe DiameterGas Well Status
(MPa)(m3/d)(m3/d)(mm)
11.416,0401.2062Liquid accumulation
21.315,9442.0962Liquid accumulation
31.014,5810.9562Liquid accumulation
41.215,5512.1662Liquid accumulation
50.913,2461.0562Liquid accumulation
61.517,0400.4562Liquid accumulation
Table 2. Calculation results of critical liquid-carrying flow rate.
Well NumberTubing PressureGas Productionqc/×104 m3/dGas Well Status
(MPa)(m3/d)TurnerColemanLi MinPan JieWang YizhongYang WenmingBelfroid
11.416,0401.792.490.812.250.580.811.79Liquid accumulation
21.315,9441.742.420.792.190.570.791.74Liquid accumulation
31.014,5811.532.140.681.930.490.681.53Liquid accumulation
41.215,5511.682.340.762.110.550.761.68Liquid accumulation
50.913,2461.462.050.651.840.470.651.45Liquid accumulation
61.517,0401.852.560.832.310.590.831.84Liquid accumulation
Table 3. Air supply line friction calculation table.
Pipeline LengthInstantaneous Gas VolumeStarting Tubing
Pressure
Pipeline Friction ΔP (MPa)
(m)(m3/h)(MPa)DN80 PipeDN65 PipeDN50 Pipe
3029002.50.010.020.09
41001.50.030.080.35
22000.50.020.08>0.50
6029002.50.010.040.18
41001.50.050.160.95
22000.50.050.18>0.50
Table 4. Production forecast for each well on the Jishen 15A platform after pressure reduction.
Well NumberProduction MethodTubing Pressure
(MPa)
Casing
Pressure
(MPa)
Liquid
Production
(m3/d)
Gas Production
(m3/d)
Output After Reducing Tubing Pressure Q (×104 m3/d)
Pt = 2.5 MPaPt = 1.5 MPaPt = 0.5 MPa
1Tubing2.603.740.3235,7323.634.845.45
2Tubing2.632.600.7125,5953.794.675.11
3Tubing1.452.671.8222,0293.373.603.74
Table 5. Technical parameters of the vent air rapid pressurization recovery device.
NumberPressurization MethodMain Design Technical ParametersRemark
Intake Pressure Ps
(MPa)
Exhaust Pressure Pd
(MPa)
Instantaneous Exhaust Volume (m3/h)Daily Exhaust Volume (×104 m3/d)
12-stage boost0.23.018344.40
20.53.5432710.38Design work point
30.63.5492011.81
40.83.5664515.95Maximum displacement point
53-stage boost0.15.011522.76
60.35.024995.99
70.55.038679.28
Table 6. Comparison of production increase before and after the combined drainage gas production process test.
Well NumberBefore the Test (7 February 2024)After the Test (27 June 2024)Daily Gas Increase Rate (%)
Tubing Pressure
(MPa)
Casing Pressure
(MPa)
Gas Production
(m3/d)
Liquid Production
(m3/d)
Tubing Pressure
(MPa)
Casing Pressure
(MPa)
Gas Production
(m3/d)
Liquid Production
(m3/d)
12.63.7435,7320.322.12.1455,2043.2554.5%
22.632.625,5950.711.51.5834,0381.7933.0%
31.52.6722,0291.821.62.223,9301.568.6%
Total//83,3562.85//113,1724.4935.8%
Table 7. Operation and maintenance cost comparison.
StageName12Total
Before the testDevice NameWellhead boosterGas lift compressor-
Quantity31-
Power (kW)39060450
Operation and maintenance costs (CNY/Day)6000500011,000
Daily gas consumption (m3/d)26904103100
After the testDevice NameIntegrated drainage and gas production device-
Quantity1-
Quantity200200
Power (kW)68606860
Operation and maintenance costs (CNY/Day)13701370
Reduction in operation and maintenance costs//37.6%
Energy consumption reduction//55.8%
Table 8. Jishen 15-6A platform cumulative production statistics.
NumberWell NumberRunning Time (days)Cumulative Production Increase
(×104 m3/d)
Cumulative Output Value
(10,000 CNY)
Yield Increase Effect Evaluation
101310121.84243.68Good
202310236.88473.76Good
30323011.2922.58Poor
Total--370740-
Disclaimer/Publisher’s Note: The statements, opinions and data contained in all publications are solely those of the individual author(s) and contributor(s) and not of MDPI and/or the editor(s). MDPI and/or the editor(s) disclaim responsibility for any injury to people or property resulting from any ideas, methods, instructions or products referred to in the content.

