
Model for Predicting Corrosion in Steel Pipelines for Underground Gas Storage


Abstract
1. Introduction
2. Investigation Scheme Design of Experiment
2.1. Corrosion Influencing Factors
- (1)
- Each UGS extracted pipeline generally contains a certain amount of water with a water/gas ratio of 0.001–0.78 m3/(104 m3). This water causes the steel electrochemical corrosion [22].
- (2)
- The produced gas generally contains CO2 at a concentration of 0.07–0.38 MPa. The CO2 gas dissolves in water to form H2CO3, and the resultant acidic environment in steel pipelines produces hydrogen depolarization corrosion, resulting in FeCO3 corrosion products [23].
- (3)
- The produced water generally contains Cl− at a concentration between 1000 and 93,000 mg/L. Cl− has a ring-breaking effect on the passivation film and the formation of corrosion product film on the surface of the pipeline, thus increasing the corrosion rate [24].
- (4)
- The operating temperature of the pipeline is 20–60 °C. A higher operating temperature typically accelerates the chemical reaction rate, i.e., the corrosion rate [25].
- (5)
- The flow rate of the produced gas is 1.36–3.70 m/s, which controls the mass transfer process of the chemical reaction. When the flow rate is low, a stable electrochemical corrosion environment is formed, and corrosion continues to occur. When the flow rate is high, the corrosion product film is not easily enriched, and the fresh metal surface is constantly exposed, which generally promotes corrosion.
2.2. The Level Value of the Factors
2.3. Design of Test Points
2.4. Data Analysis Based on RSM
3. Results and Discussion
3.1. Corrosion Prediction Model
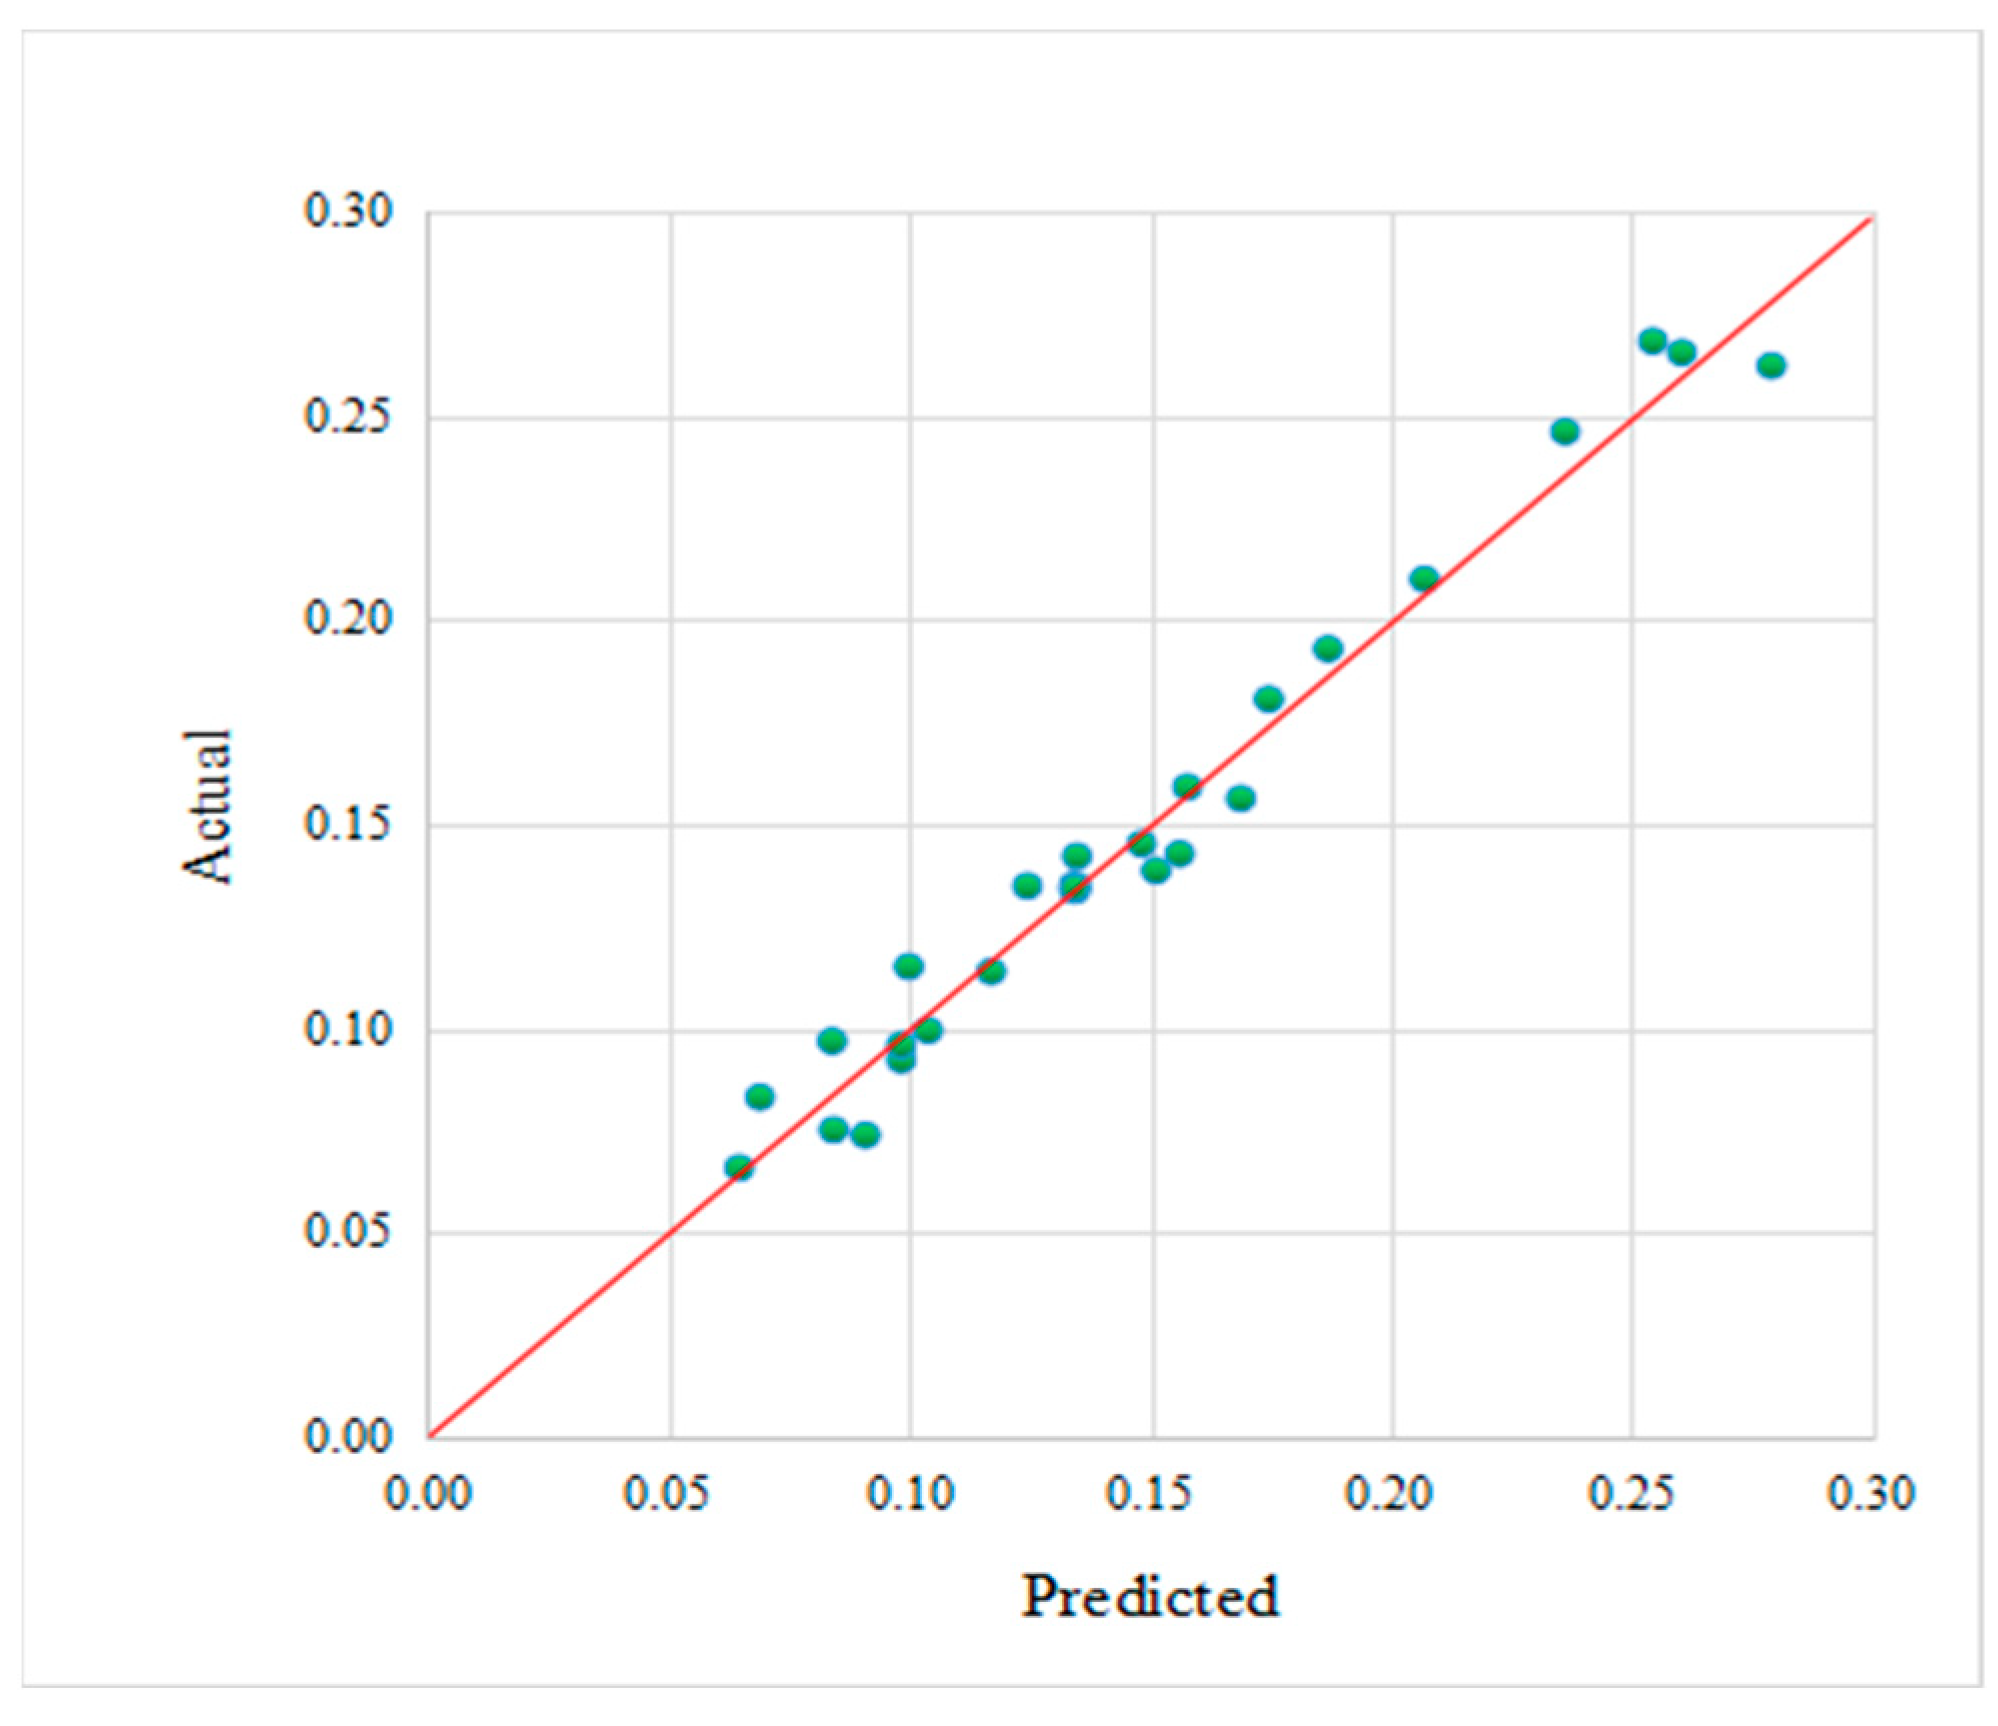
3.2. Validity Evaluation of the Fitted Model
3.3. Example Application of the Model
4. Conclusions
- (1)
- The operating parameters of 14 domestic UGSs are investigated and analyzed, and four main corrosion factors are determined as follows: the CO2 partial pressure, Cl− concentration, temperature, and flow rate. The p-values of the independent variables in the prediction model are <0.01, which confirms that the four corrosion-influencing factors selected are significant and reasonable.
- (2)
- Based on 29 groups of high-temperature and high-pressure corrosion tests designed as per the RSM, a quadratic regression equation for the prediction of corrosion in the UGS extracted pipelines is finally established. The F-value of the model is greater than the critical value, the p-value of the model is <0.01, and the coefficient R2 is 0.9491, indicating that the model has a high degree of truth.
- (3)
- The corrosion rate in 14 domestic UGS extracted pipelines is predicted by using this model. The corrosion degree of each pipeline is determined, and these results provide a scientific basis for the material selection, anti-corrosion strategy formulation, and process parameter optimization of gas pipelines.
Author Contributions
Funding
Data Availability Statement
Acknowledgments
Conflicts of Interest
References
- Molíková, A.; Vítězová, M.; Vítěz, T.; Buriánková, I.; Huber, H.; Dengler, L.; Hanišáková, N.; Onderka, V.; Urbanová, I. Underground gas storage as a promising natural methane bioreactor and reservoir? J. Energy Storage 2022, 47, 103631. [Google Scholar] [CrossRef]
- Al-Shafi, M.; Massarweh, O.; Abushaikha, A.S.; Bicer, Y. A review on underground gas storage systems: Natural gas, hydrogen and carbon sequestration. Energy Rep. 2023, 9, 6251–6266. [Google Scholar] [CrossRef]
- Zhang, J.; Tan, Y.; Zhang, T.; Yu, K.; Wang, X.; Zhao, Q. Natural gas market and underground gas storage development in China. J. Energy Storage 2020, 29, 101338. [Google Scholar] [CrossRef]
- Xie, S.; He, B.; Chen, L.; Xu, K.; Luo, J.; Li, L.; Wang, B. Key elements in integrity management of underground gas storage: A framework for energy safety. Energies 2025, 18, 378. [Google Scholar] [CrossRef]
- Kazemi, T.; Arezou, J.; Ali, T. Gas-water-rock interactions and factors affecting gas storage capacity during natural gas storage in a low permeability aquifer. Pet. Explor. Dev. 2018, 45, 1123–1128. [Google Scholar]
- Chen, Z.; Xu, M.; Hu, T. Effects of H2S content on the corrosion behavior of gas storage reservoir injection and production pipeline steel in CO2-H2S environment. Mater. Today Commun. 2024, 41, 110364. [Google Scholar] [CrossRef]
- Dana, M.; Javidi, M. Corrosion simulation via coupling computational fluid dynamics and NORSOK CO2 corrosion rate prediction model for an outlet header piping of an air-cooled heat ex-changer. Eng. Fail. Anal. 2021, 122, 105285. [Google Scholar] [CrossRef]
- Nesic, S. Effects of multi-phase flow on internal CO2 corrosion of mild steel pipelines. Energy Fuels 2012, 26, 4098–4111. [Google Scholar] [CrossRef]
- Waard, C.; Smith, L.; Craig, B. The influence of crude oil on well tubing corrosion rates. In Proceedings of the Conference Corrosion 2003, San Diego, CA, USA, 16–20 March 2003; p. 03629. [Google Scholar]
- Zoubeik, M.; Salama, A.; Henni, A. A comprehensive experimental and artificial network investigation of the performance of an ultrafiltration titanium dioxide ceramic membrane: Application in produced water treatment. Water Environ. J. 2019, 33, 459–475. [Google Scholar] [CrossRef]
- Rocabruno-Valdés, C.; González-Rodriguez, J.; Díaz-Blanco, Y.; Juantorena, A.; Munoz-Ledo, J.; El-Hamzaoui, Y.; Hernandez, J.A. Corrosion rate prediction for metals in biodiesel using artificial neural networks. Renew. Energy 2019, 140, 592–601. [Google Scholar] [CrossRef]
- Zhi, Y.; Fu, D.; Yang, T.; Zhang, D.; Li, X.; Pei, Z. Long-term prediction on atmospheric corrosion data series of carbon steel in China based on NGBM (1, 1) model and genetic algorithm. Anti-Corros. Methods Mater. 2019, 66, 403–411. [Google Scholar] [CrossRef]
- Jamshidi, A.; Yazdani-Chamzini, A.; Yakhchali, S.; Khaleghi, S. Developing a new fuzzy inference system for pipeline risk assessment. J. Loss Prev. Process Ind. 2013, 26, 197–208. [Google Scholar] [CrossRef]
- Kui, C. Experimental Design and Analysis; Tsinghua University Publishing House Co., Ltd.: Beijing, China, 2005. [Google Scholar]
- Wang, L.; Jiang, J.; Saleh, B.; Reham, F.; Huang, H.; Liu, H.; Ma, A. Optimization of the experimental parameters affecting the corrosion behavior for Mg–Y–Zn–Mn alloy via response surface methodology. Met. Mater. Int. 2021, 27, 5095–5107. [Google Scholar] [CrossRef]
- Hao, J.; Xu, S.; Xu, J.; Cao, H.; Miao, H. Modeling and optimization of the corrosion resistance of Cr-free and Cr-based chemical conversion coatings on nickel foil by artificial neural network and response surface method. Mater. Today Commun. 2023, 36, 106858. [Google Scholar] [CrossRef]
- Chimklin, K.; Phuangkaew, S.; Deeying, J. Multi-objective optimization of laser spot welding parameters for enhancing mechanical properties of hard disk components using response surface methodology. Results Eng. 2025, 25, 104449. [Google Scholar] [CrossRef]
- Ana, K.; Davorin, K.; Ingrid, M. Experimental approach and assessment of Zr conversion coatings on Al alloy using response surface methodology. Corros. Sci. 2025, 249, 112824. [Google Scholar]
- Chung, N.T.; So, Y.S.; Kim, W.C.; Kim, J.G. Evaluation of the Influence of the Combination of pH, Chloride, and Sulfate on the Corrosion Behavior of Pipeline Steel in Soil Using Response Surface Methodology. Materials 2021, 14, 6596. [Google Scholar] [CrossRef]
- Mehdi, J.; Hooman, K.A.; Fatemeh, N.; Hamid, R.Y.; Narjes, S.S. A new perspective on the corrosion of carbon steels in H2SO4 acid environments: Statistical analysis of corrosion mechanisms by response surface modeling. Mater. Chem. Phys. 2024, 312, 128608. [Google Scholar]
- Pandit, M.; Sood, S.; Mishra, P.; Khanna, P. Mathematical analysis of the effect of process parameters on angular distortion of MIG welded stainless steel 202 plates by using the technique of response surface methodology. Mater. Today Proc. 2021, 41, 1045–1054. [Google Scholar] [CrossRef]
- Abd, A.; Naji, S.; Hashim, A. Failure analysis of carbon dioxide corrosion through wet natural gas gathering pipelines. Eng. Fail. Anal. 2019, 105, 638–646. [Google Scholar] [CrossRef]
- Choi, Y.; Farelas, F.; Nesic, S. Augusto, A.; Andrade, C. Corrosion behavior of deep water oil production tubing material under super critical CO2 environment: Part 1—Effect of pressure and temperature. Corrosion 2014, 70, 38–47. [Google Scholar] [CrossRef] [PubMed]
- Liu, Q.; Mao, L.; Zhou, S. Effects of chloride content on CO2 corrosion of carbon steel in simulated oil and gas well environments. Corros. Sci. 2014, 84, 165–171. [Google Scholar] [CrossRef]
- Chen, X.; Li, C.; Ming, N.; He, C. Effects of temperature on the corrosion behaviour of X70 steel in CO2-Containing formation water. J. Nat. Gas Sci. Eng. 2021, 88, 103815. [Google Scholar] [CrossRef]
- Salehi, E.; Askari, M.; Aliee, M.; Goodarzi, M.; Mohammadi, M. Data-based modeling and optimization of a hybrid column-adsorption/depth-filtration process using a combined intelligent approach. J. Clean. Prod. 2019, 236, 117664. [Google Scholar] [CrossRef]
- NACE RP 0775-2023; Preparation, Installation, Analysis, and Interpretation of Corrosion Coupons Inhydrocarbon Operations. NACE: Houston, TX, USA, 2023.


| UGS Name | CO2 Partial Pressure (MPa) | Cl− Concentration (×103 mg/L) | Temperature (°C) | Operating Pressure (MPa) | Water/Gas Ratio (m3/104 m3) | Flow Rate (m/s) | Pipeline Material |
|---|---|---|---|---|---|---|---|
| S1 | 0.14 | 2.62 | 20 | 12 | 0.22 | 1.67 | L360N (X52) |
| S2 | 0.32 | 1.70 | 25 | 20 | 0.10 | 2.22 | L450Q (X65) |
| S3 | 0.17 | 3.50 | 38 | 12 | 0.001 | 3.70 | L450Q (X65) |
| S4 | 0.13 | 1.29 | 51 | 12.8 | 0.18 | 3.47 | L450Q (X52) |
| S5 | 0.08 | 0.20 | 25 | 7.7 | 0.04 | 3.16 | L415M (X60) |
| S6 | 0.25 | 1.85 | 35 | 10 | 0.20 | 1.60 | L360N (X52) |
| S7 | 0.21 | 0.29 | 60 | 11.5 | 0.78 | 1.93 | L450Q (X65) |
| S8 | 0.12 | 0.78 | 40 | 10 | 0.48 | 3.20 | 16Mn (X52) |
| S9 | 0.07 | 0.07 | 30 | 6 | 0.11 | 2.96 | 16Mn (X52) |
| S10 | 0.07 | 0.10 | 25 | 6.5 | 0.41 | 2.73 | 16Mn (X52) |
| S11 | 0.14 | 1.00 | 25 | 20 | 0.06 | 2.22 | L450Q (X65) |
| S12 | 0.09 | 0.46 | 51 | 10.5 | 0.016 | 3.04 | L415M (X60) |
| S13 | 0.15 | 1.60 | 26 | 5 | 0.002 | 2.56 | L360N (X52) |
| S14 | 0.38 | 9.30 | 40 | 23 | 0.15 | 1.36 | L450Q (X65) |
| Factors | Levels | ||
|---|---|---|---|
| −1 | 0 | 1 | |
| CO2 partial pressure (MPa) | 0.050 | 0.275 | 0.500 |
| Cl− concentration (mg/L) | 1000 | 50,500 | 100,000 |
| Temperature (°C) | 20 | 40 | 60 |
| Flow rate (m/s) | 1 | 2.5 | 4 |
| Test Serial Number | CO2 Partial Pressure (MPa) | Cl− Concentration (mg/L) | Temperature (°C) | Flow Rate (m/s) |
|---|---|---|---|---|
| 1 | 0.050 | 1000 | 40 | 2.5 |
| 2 | 0.500 | 1000 | 40 | 2.5 |
| 3 | 0.050 | 100,000 | 40 | 2.5 |
| 4 | 0.500 | 100,000 | 40 | 2.5 |
| 5 | 0.275 | 50,500 | 20 | 1.0 |
| 6 | 0.275 | 50,500 | 60 | 1.0 |
| 7 | 0.275 | 50,500 | 20 | 4.0 |
| 8 | 0.275 | 50,500 | 60 | 4.0 |
| 9 | 0.050 | 50,500 | 40 | 1.0 |
| 10 | 0.500 | 50,500 | 40 | 1.0 |
| 11 | 0.050 | 50,500 | 40 | 4.0 |
| 12 | 0.500 | 50,500 | 40 | 4.0 |
| 13 | 0.275 | 1000 | 20 | 2.5 |
| 14 | 0.275 | 100,000 | 20 | 2.5 |
| 15 | 0.275 | 1000 | 60 | 2.5 |
| 16 | 0.275 | 100,000 | 60 | 2.5 |
| 17 | 0.050 | 50,500 | 20 | 2.5 |
| 18 | 0.500 | 50,500 | 20 | 2.5 |
| 19 | 0.050 | 50,500 | 60 | 2.5 |
| 20 | 0.500 | 50,500 | 60 | 2.5 |
| 21 | 0.275 | 1000 | 40 | 1.0 |
| 22 | 0.275 | 100,000 | 40 | 1.0 |
| 23 | 0.275 | 1000 | 40 | 4.0 |
| 24 | 0.275 | 100,000 | 40 | 4.0 |
| 25 | 0.275 | 50,500 | 40 | 2.5 |
| 26 | 0.275 | 50,500 | 40 | 2.5 |
| 27 | 0.275 | 50,500 | 40 | 2.5 |
| 28 | 0.275 | 50,500 | 40 | 2.5 |
| 29 | 0.275 | 50,500 | 40 | 2.5 |
| Name | Fitting Coefficient |
|---|---|
| Intercept | 0.1344 |
| X1 | 0.068 |
| X2 | 0.0137 |
| X3 | 0.0391 |
| X4 | 0.0122 |
| X1X2 | 0.01 |
| X1X3 | 0.0223 |
| X1X4 | −0.0001 |
| X2X3 | 0.0062 |
| X2X4 | −0.0034 |
| X3X4 | 0.0024 |
| X12 | 0.0311 |
| X22 | −0.0028 |
| X32 | −0.0159 |
| X42 | 0.0148 |
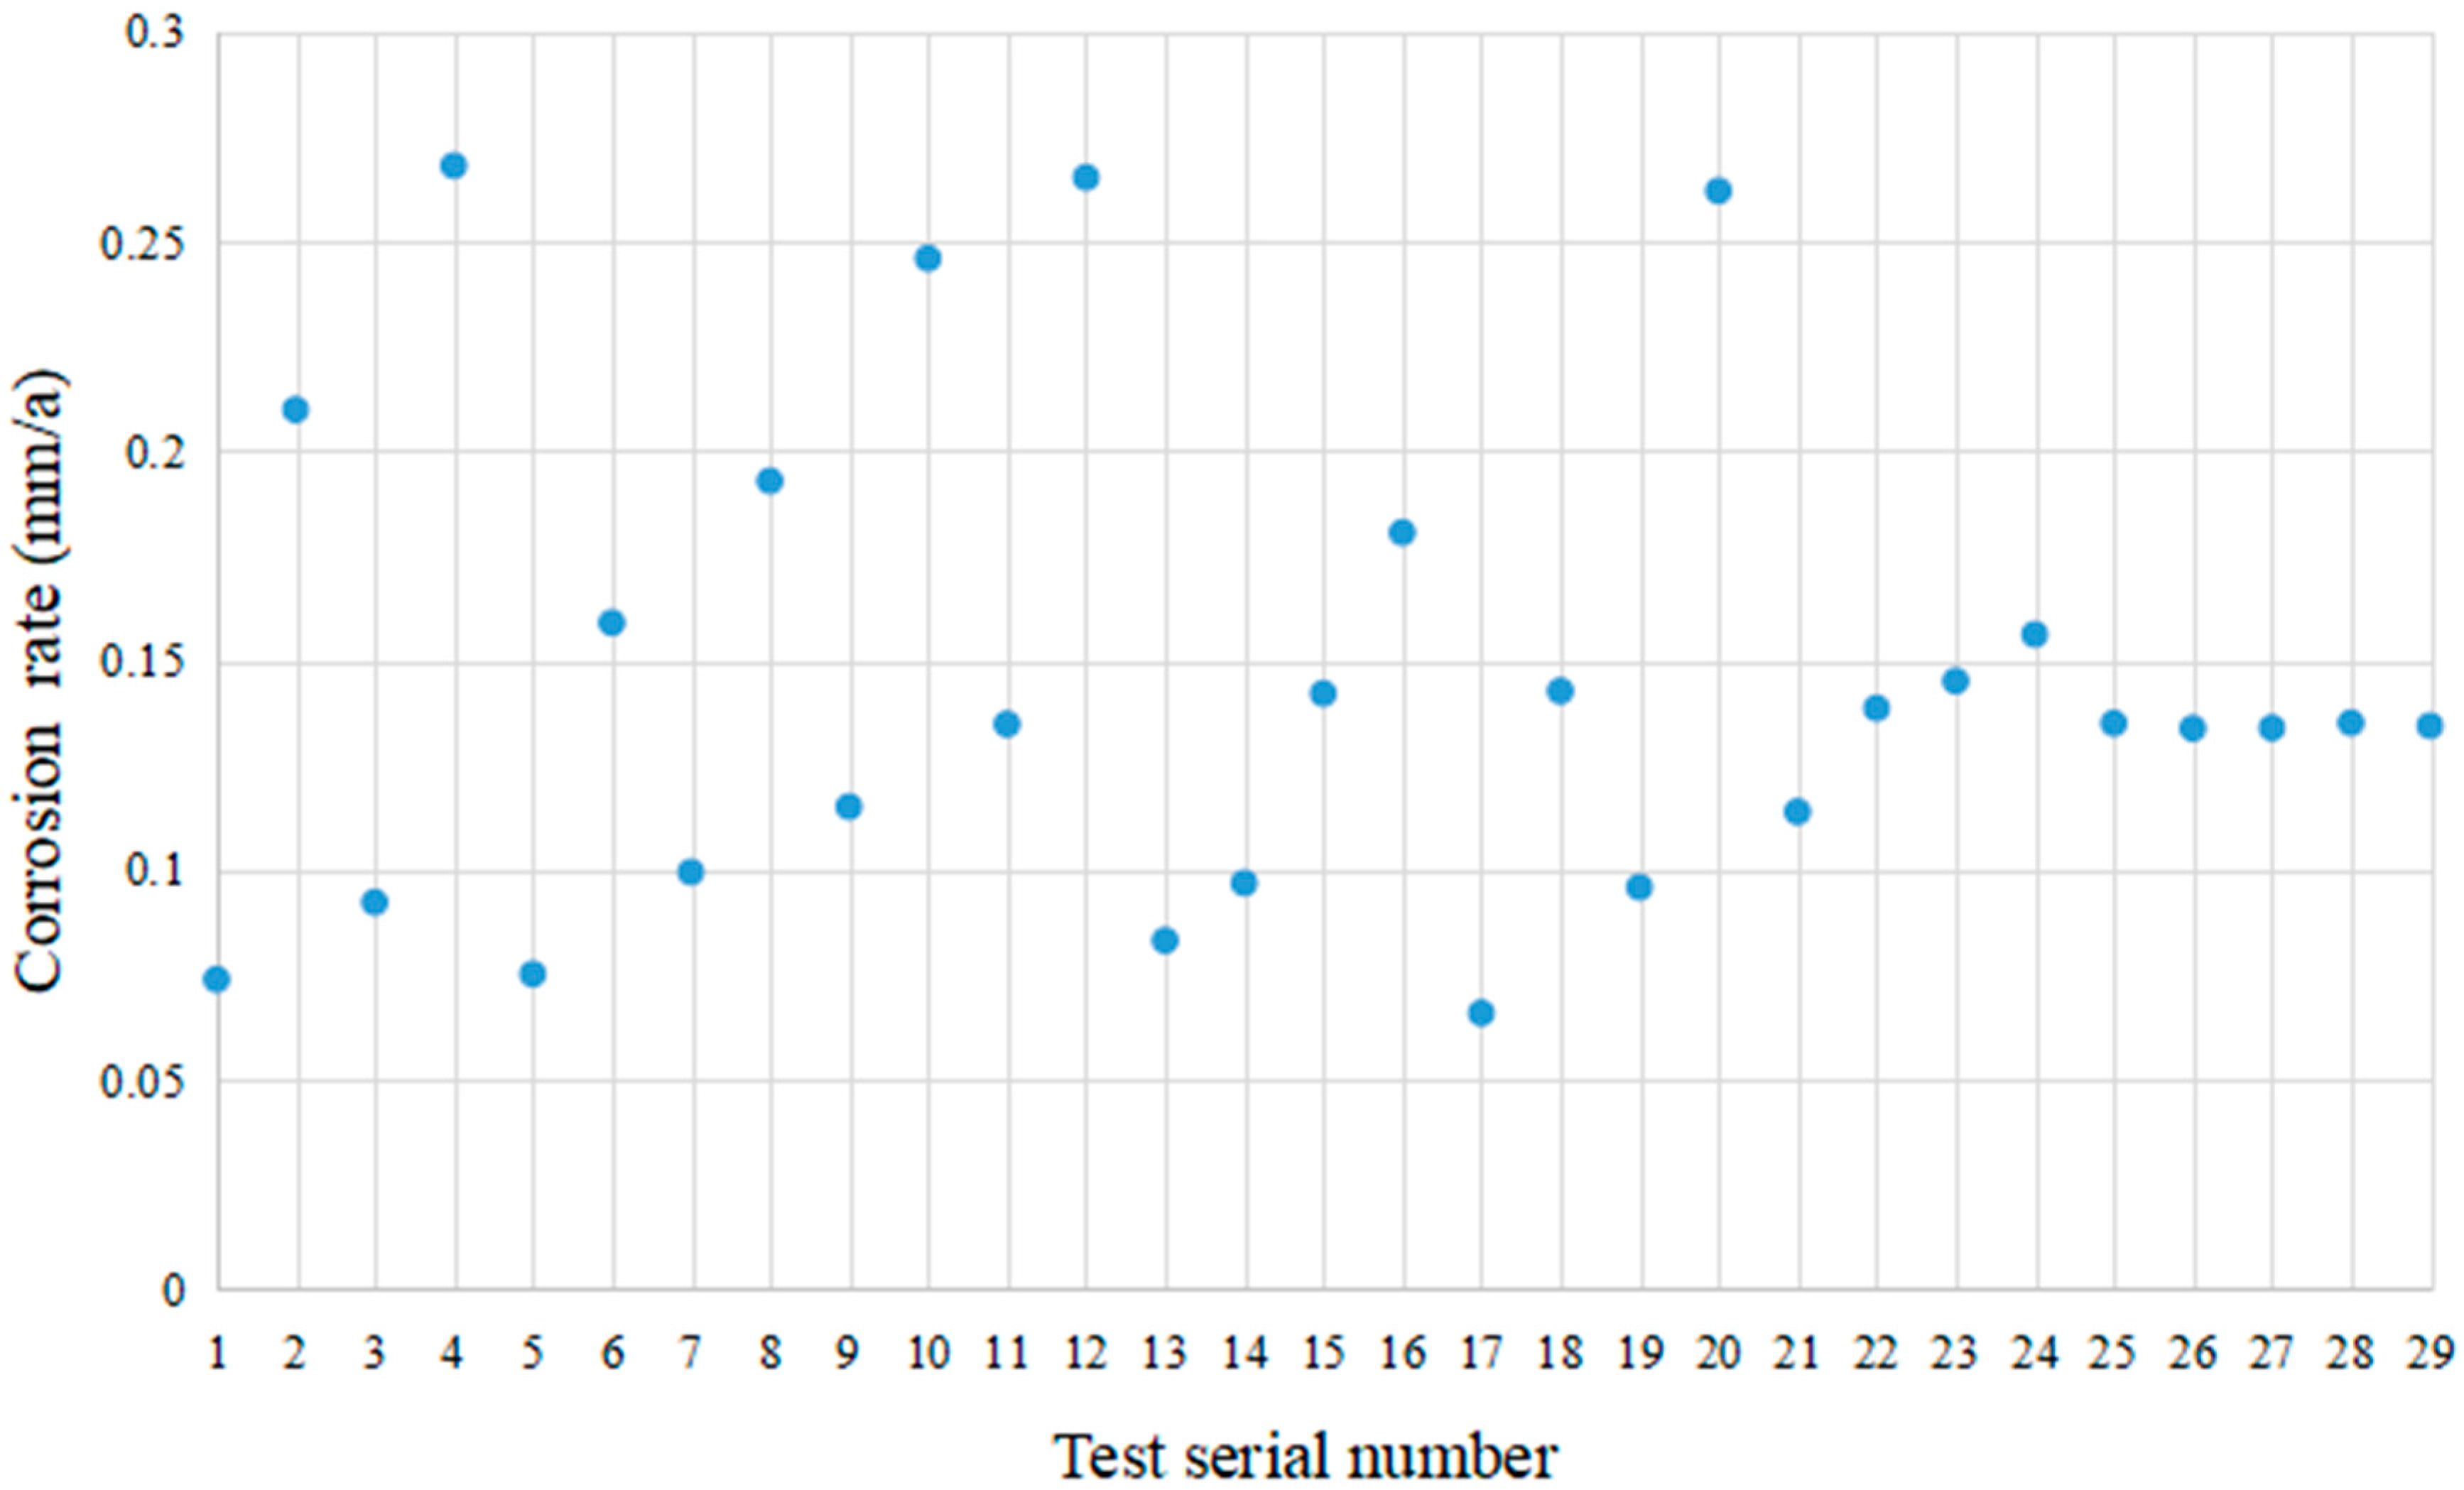
| Test Serial Number | Actual Value (mm/a) | Predicted Value (mm/a) | Absolute Error (mm/a) | Relative Error % |
|---|---|---|---|---|
| 1 | 0.0739 | 0.06603 | −0.0079 | −10.65 |
| 2 | 0.2098 | 0.16183 | −0.0180 | −9.99 |
| 3 | 0.0923 | 0.16023 | −0.0336 | −17.32 |
| 4 | 0.2680 | 0.33603 | −0.0438 | −11.52 |
| 5 | 0.0752 | 0.0878 | −0.0112 | −11.31 |
| 6 | 0.1590 | 0.1362 | 0.0042 | 3.18 |
| 7 | 0.0995 | 0.156 | −0.0087 | −5.28 |
| 8 | 0.1928 | 0.1892 | 0.0068 | 3.73 |
| 9 | 0.1151 | 0.0672 | −0.0199 | −22.85 |
| 10 | 0.2459 | 0.197 | 0.0050 | 2.60 |
| 11 | 0.1348 | 0.1218 | −0.0033 | −2.64 |
| 12 | 0.2652 | 0.2636 | 0.0216 | 8.93 |
| 13 | 0.0832 | 0.07823 | −0.0184 | −19.02 |
| 14 | 0.0969 | 0.20283 | −0.0042 | −2.01 |
| 15 | 0.1421 | 0.10943 | −0.0416 | −27.53 |
| 16 | 0.1805 | 0.25323 | −0.0274 | −9.75 |
| 17 | 0.0659 | 0.0895 | 0.0047 | 5.54 |
| 18 | 0.1427 | 0.1999 | −0.0099 | −4.72 |
| 19 | 0.0959 | 0.1049 | 0.0126 | 13.65 |
| 20 | 0.2620 | 0.2661 | −0.0019 | −0.71 |
| 21 | 0.1139 | 0.05873 | −0.0185 | −23.92 |
| 22 | 0.1386 | 0.19713 | −0.0073 | −3.56 |
| 23 | 0.1451 | 0.12353 | −0.0375 | −23.27 |
| 24 | 0.1562 | 0.25353 | −0.0997 | −28.22 |
| 25 | 0.1350 | 0.1716 | 0.0014 | 0.82 |
| 26 | 0.1338 | 0.1716 | 0.0004 | 0.23 |
| 27 | 0.1339 | 0.1716 | −0.0016 | −0.92 |
| 28 | 0.1351 | 0.1716 | −0.0009 | −0.52 |
| 29 | 0.1344 | 0.1716 | 0.0007 | 0.41 |
| Source | Sum of Squares | Degrees of Freedom | Mean Square | F-Value | p-Value | Salience |
|---|---|---|---|---|---|---|
| Model | 0.0913 | 14 | 0.0065 | 38.31 | <0.0001 | * |
| X1 | 0.0554 | 1 | 0.0554 | 325.8 | <0.0001 | * |
| X2 | 0.0023 | 1 | 0.0023 | 13.25 | 0.0027 | * |
| X3 | 0.0183 | 1 | 0.0183 | 107.66 | <0.0001 | * |
| X4 | 0.0018 | 1 | 0.0018 | 10.42 | 0.0061 | * |
| X1X2 | 0.0004 | 1 | 0.0004 | 2.33 | 0.1494 | |
| X1X3 | 0.002 | 1 | 0.002 | 11.71 | 0.0041 | * |
| X1X4 | 4.00 × 10⁻⁸ | 1 | 4.00 × 10⁻⁸ | 0.0002 | 0.988 | |
| X2X3 | 0.0002 | 1 | 0.0002 | 0.8962 | 0.3599 | |
| X2X4 | 0 | 1 | 0 | 0.2717 | 0.6103 | |
| X3X4 | 0 | 1 | 0 | 0.1326 | 0.7212 | |
| X12 | 0.0063 | 1 | 0.0063 | 36.9 | <0.0001 | * |
| X22 | 0 | 1 | 0 | 0.2907 | 0.5982 | |
| X32 | 0.0016 | 1 | 0.0016 | 9.59 | 0.0079 | * |
| X42 | 0.0014 | 1 | 0.0014 | 8.39 | 0.0117 | |
| Residual | 0.0024 | 14 | 0.0002 | |||
| Lack of fit | 0.0024 | 10 | 0.0002 | 655.96 | <0.0001 | * |
| Pure error | 1.45 × 10⁻⁶ | 4 | 3.63 × 10⁻⁷ | |||
| Cor total | 0.0937 | 28 |
| UGS Name | Corrosion Rate Predicted Value (mm/a) | Degree of Corrosion |
|---|---|---|
| S1 | 0.0600 | Moderate |
| S2 | 0.0970 | Moderate |
| S3 | 0.1230 | Severe |
| S4 | 0.1187 | Moderate |
| S5 | 0.0812 | Moderate |
| S6 | 0.1058 | Moderate |
| S7 | 0.1106 | Moderate |
| S8 | 0.1049 | Moderate |
| S9 | 0.0873 | Moderate |
| S10 | 0.0750 | Moderate |
| S11 | 0.0702 | Moderate |
| S12 | 0.1032 | Moderate |
| S13 | 0.0763 | Moderate |
| S14 | 0.1890 | Severe |
Disclaimer/Publisher’s Note: The statements, opinions and data contained in all publications are solely those of the individual author(s) and contributor(s) and not of MDPI and/or the editor(s). MDPI and/or the editor(s) disclaim responsibility for any injury to people or property resulting from any ideas, methods, instructions or products referred to in the content. |
© 2025 by the authors. Licensee MDPI, Basel, Switzerland. This article is an open access article distributed under the terms and conditions of the Creative Commons Attribution (CC BY) license (https://creativecommons.org/licenses/by/4.0/).
Share and Cite
Song, C.; Li, W.; Li, C.; Li, L.; Luo, J.; Zhu, L. Model for Predicting Corrosion in Steel Pipelines for Underground Gas Storage. Processes 2025, 13, 1439. https://doi.org/10.3390/pr13051439
Song C, Li W, Li C, Li L, Luo J, Zhu L. Model for Predicting Corrosion in Steel Pipelines for Underground Gas Storage. Processes. 2025; 13(5):1439. https://doi.org/10.3390/pr13051439
Chicago/Turabian StyleSong, Chengli, Wei Li, Chunhui Li, Lifeng Li, Jinheng Luo, and Lixia Zhu. 2025. "Model for Predicting Corrosion in Steel Pipelines for Underground Gas Storage" Processes 13, no. 5: 1439. https://doi.org/10.3390/pr13051439
APA StyleSong, C., Li, W., Li, C., Li, L., Luo, J., & Zhu, L. (2025). Model for Predicting Corrosion in Steel Pipelines for Underground Gas Storage. Processes, 13(5), 1439. https://doi.org/10.3390/pr13051439