

Proof-of-Concept Study on Supercritical Fluid Chromatography Hyphenated with a Fast Optoelectronic Nose for Online Monitoring of Odorant Molecules


Abstract
1. Introduction
2. Materials and Methods
2.1. Sample Preparation
2.2. SFC Parameters
2.3. SFC-E-Nose Hyphenation
2.4. E-Nose Parameters
3. Results
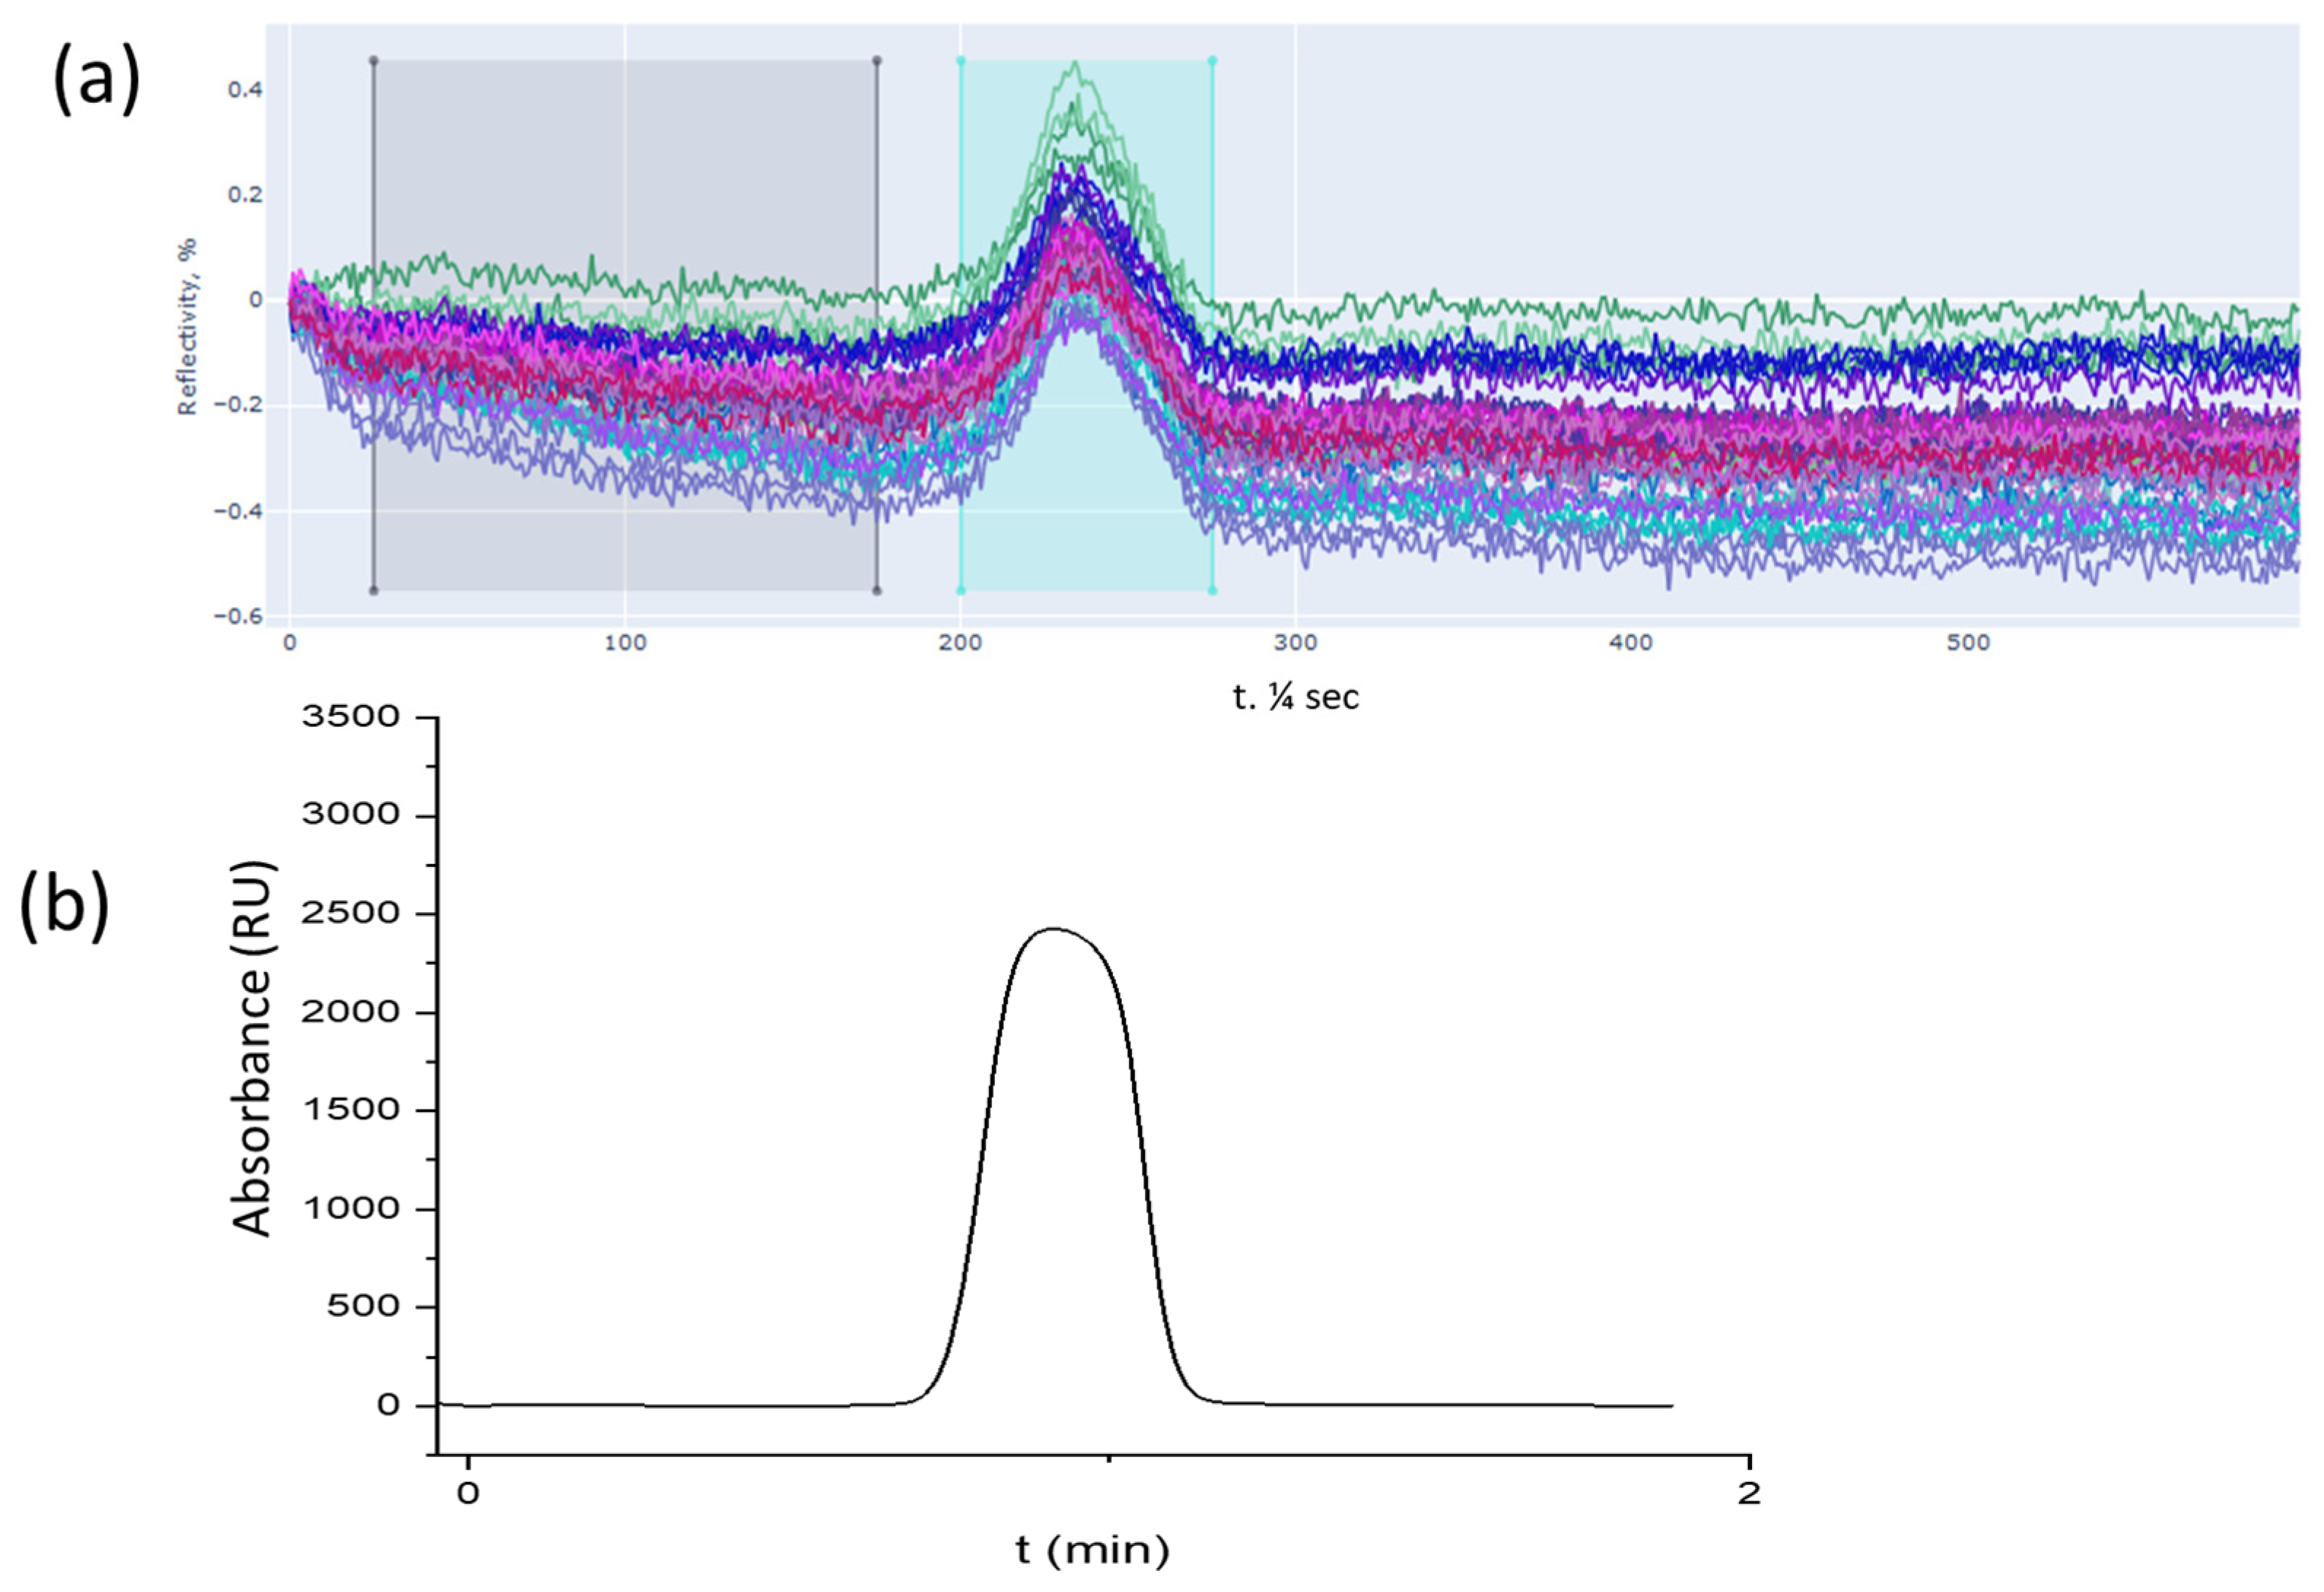
3.1. SPR Detection
3.2. Mach–Zehnder Detection
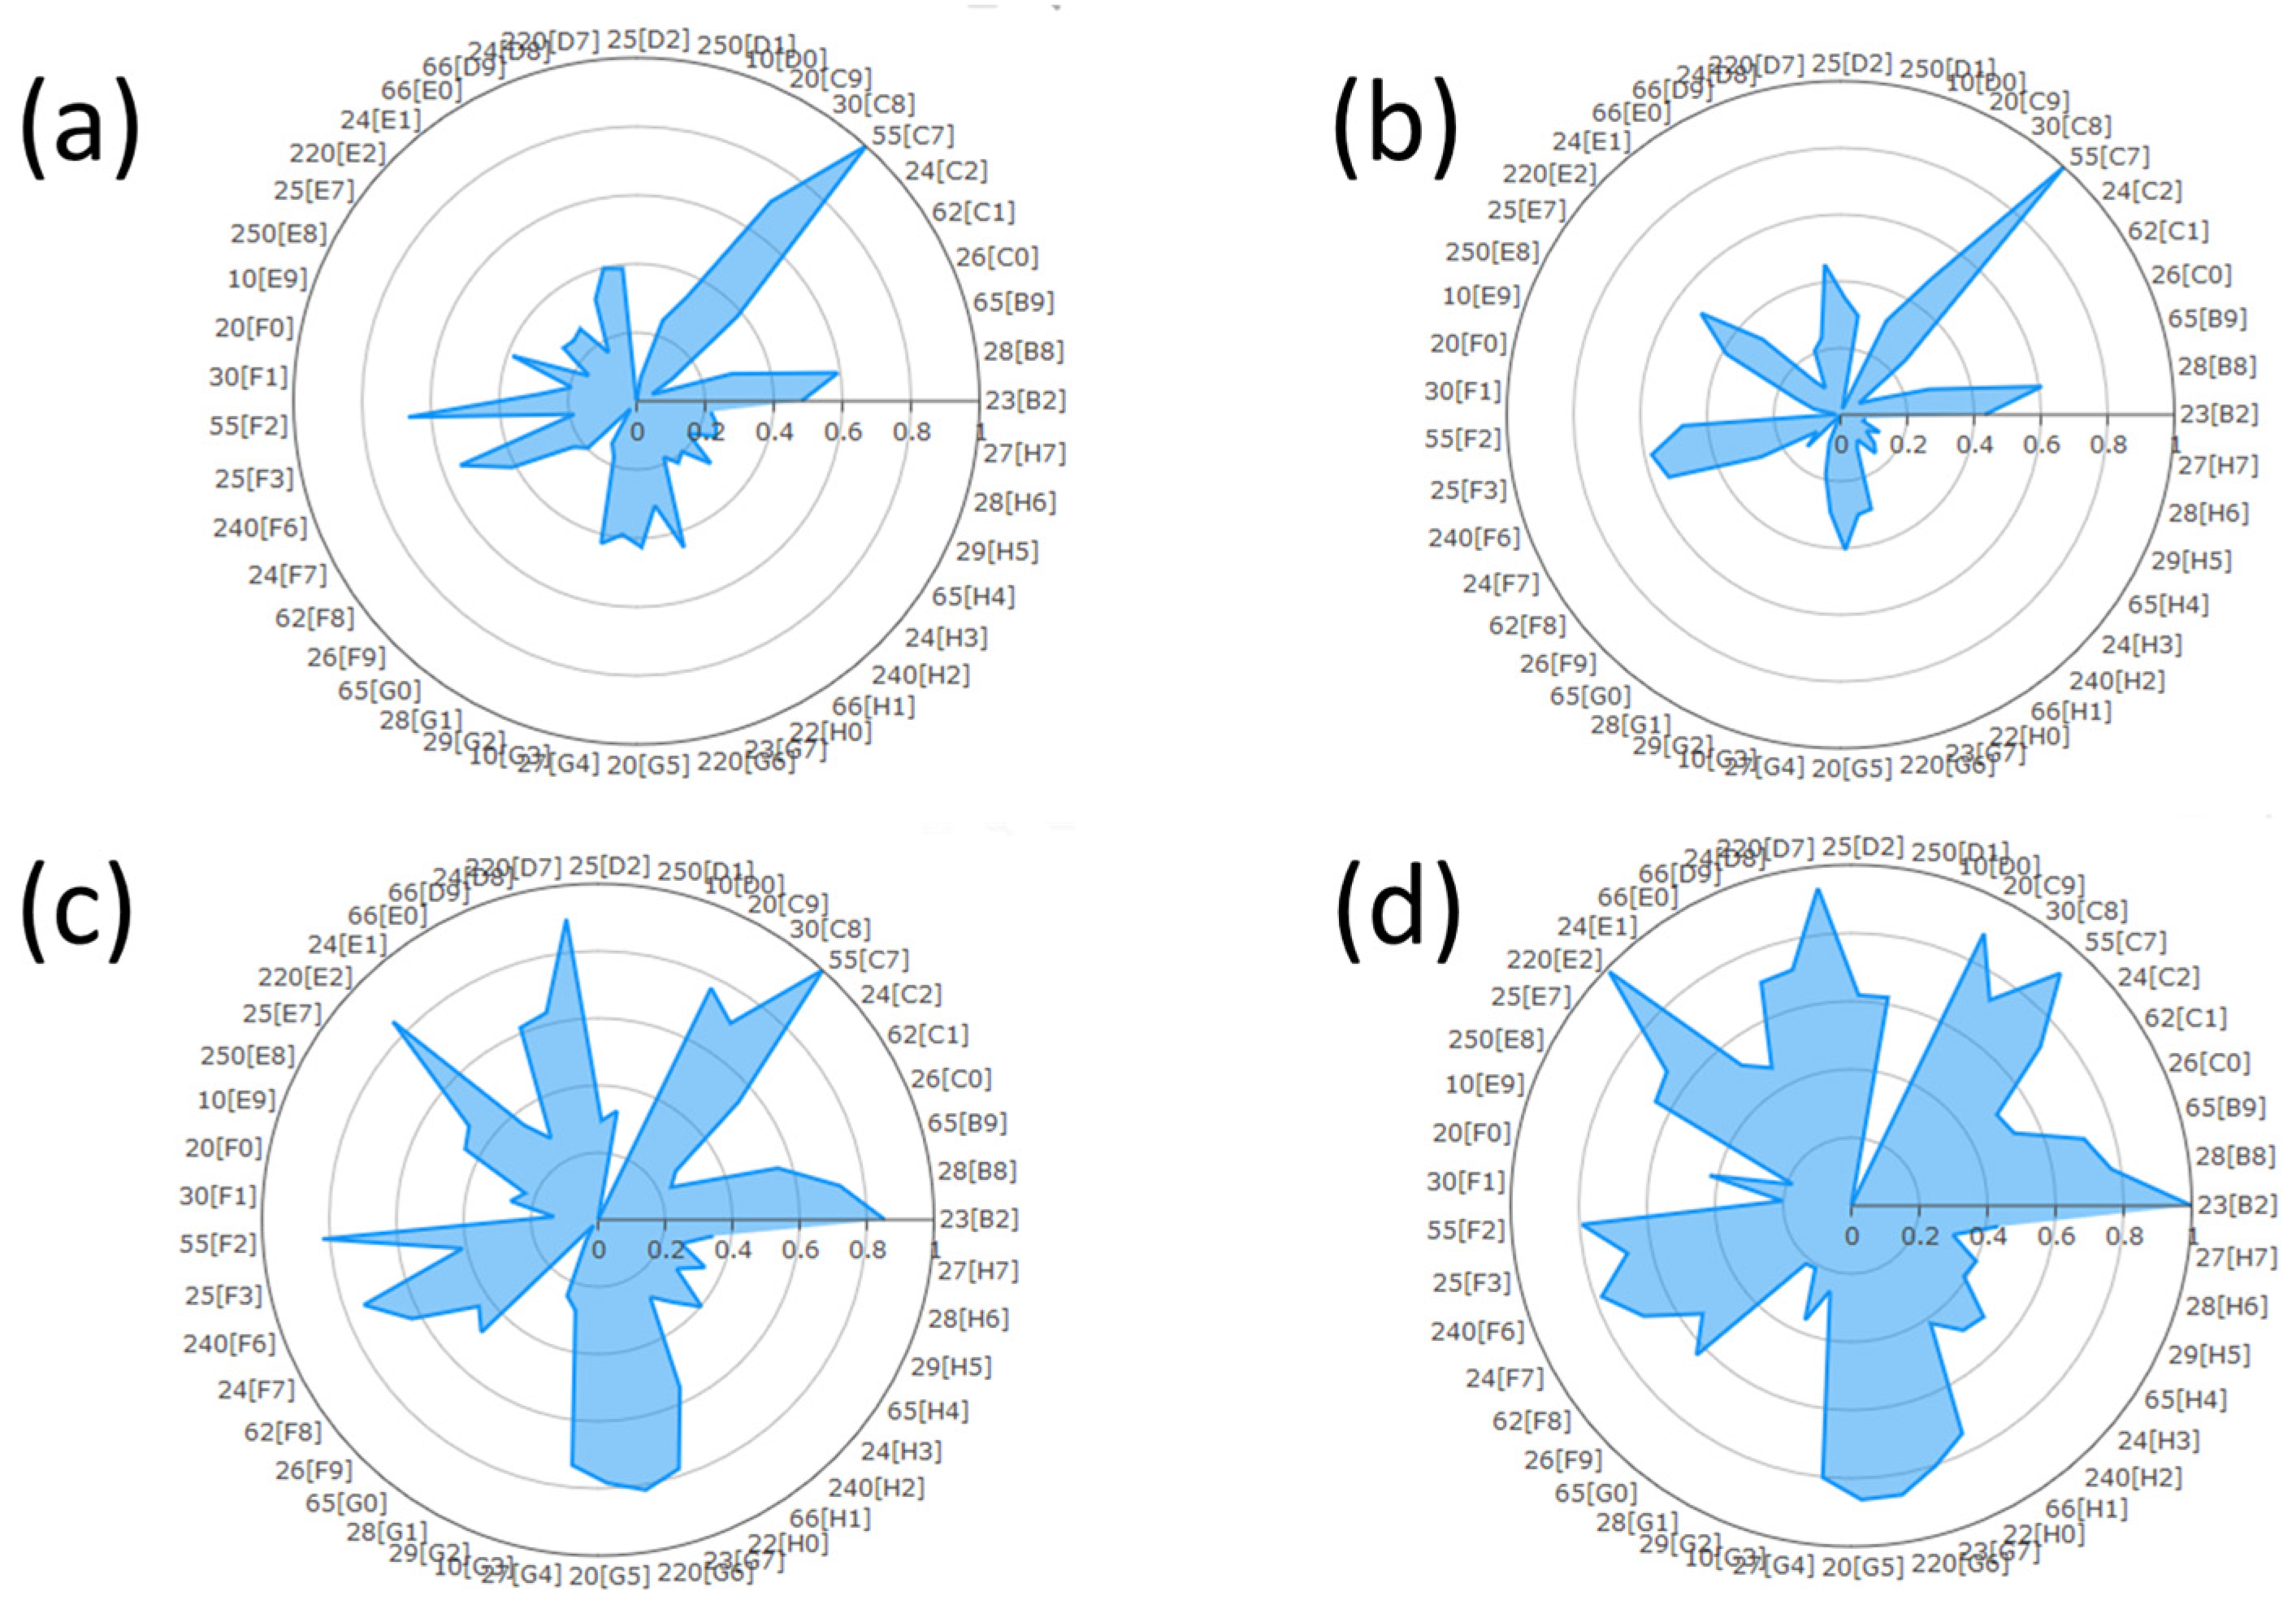
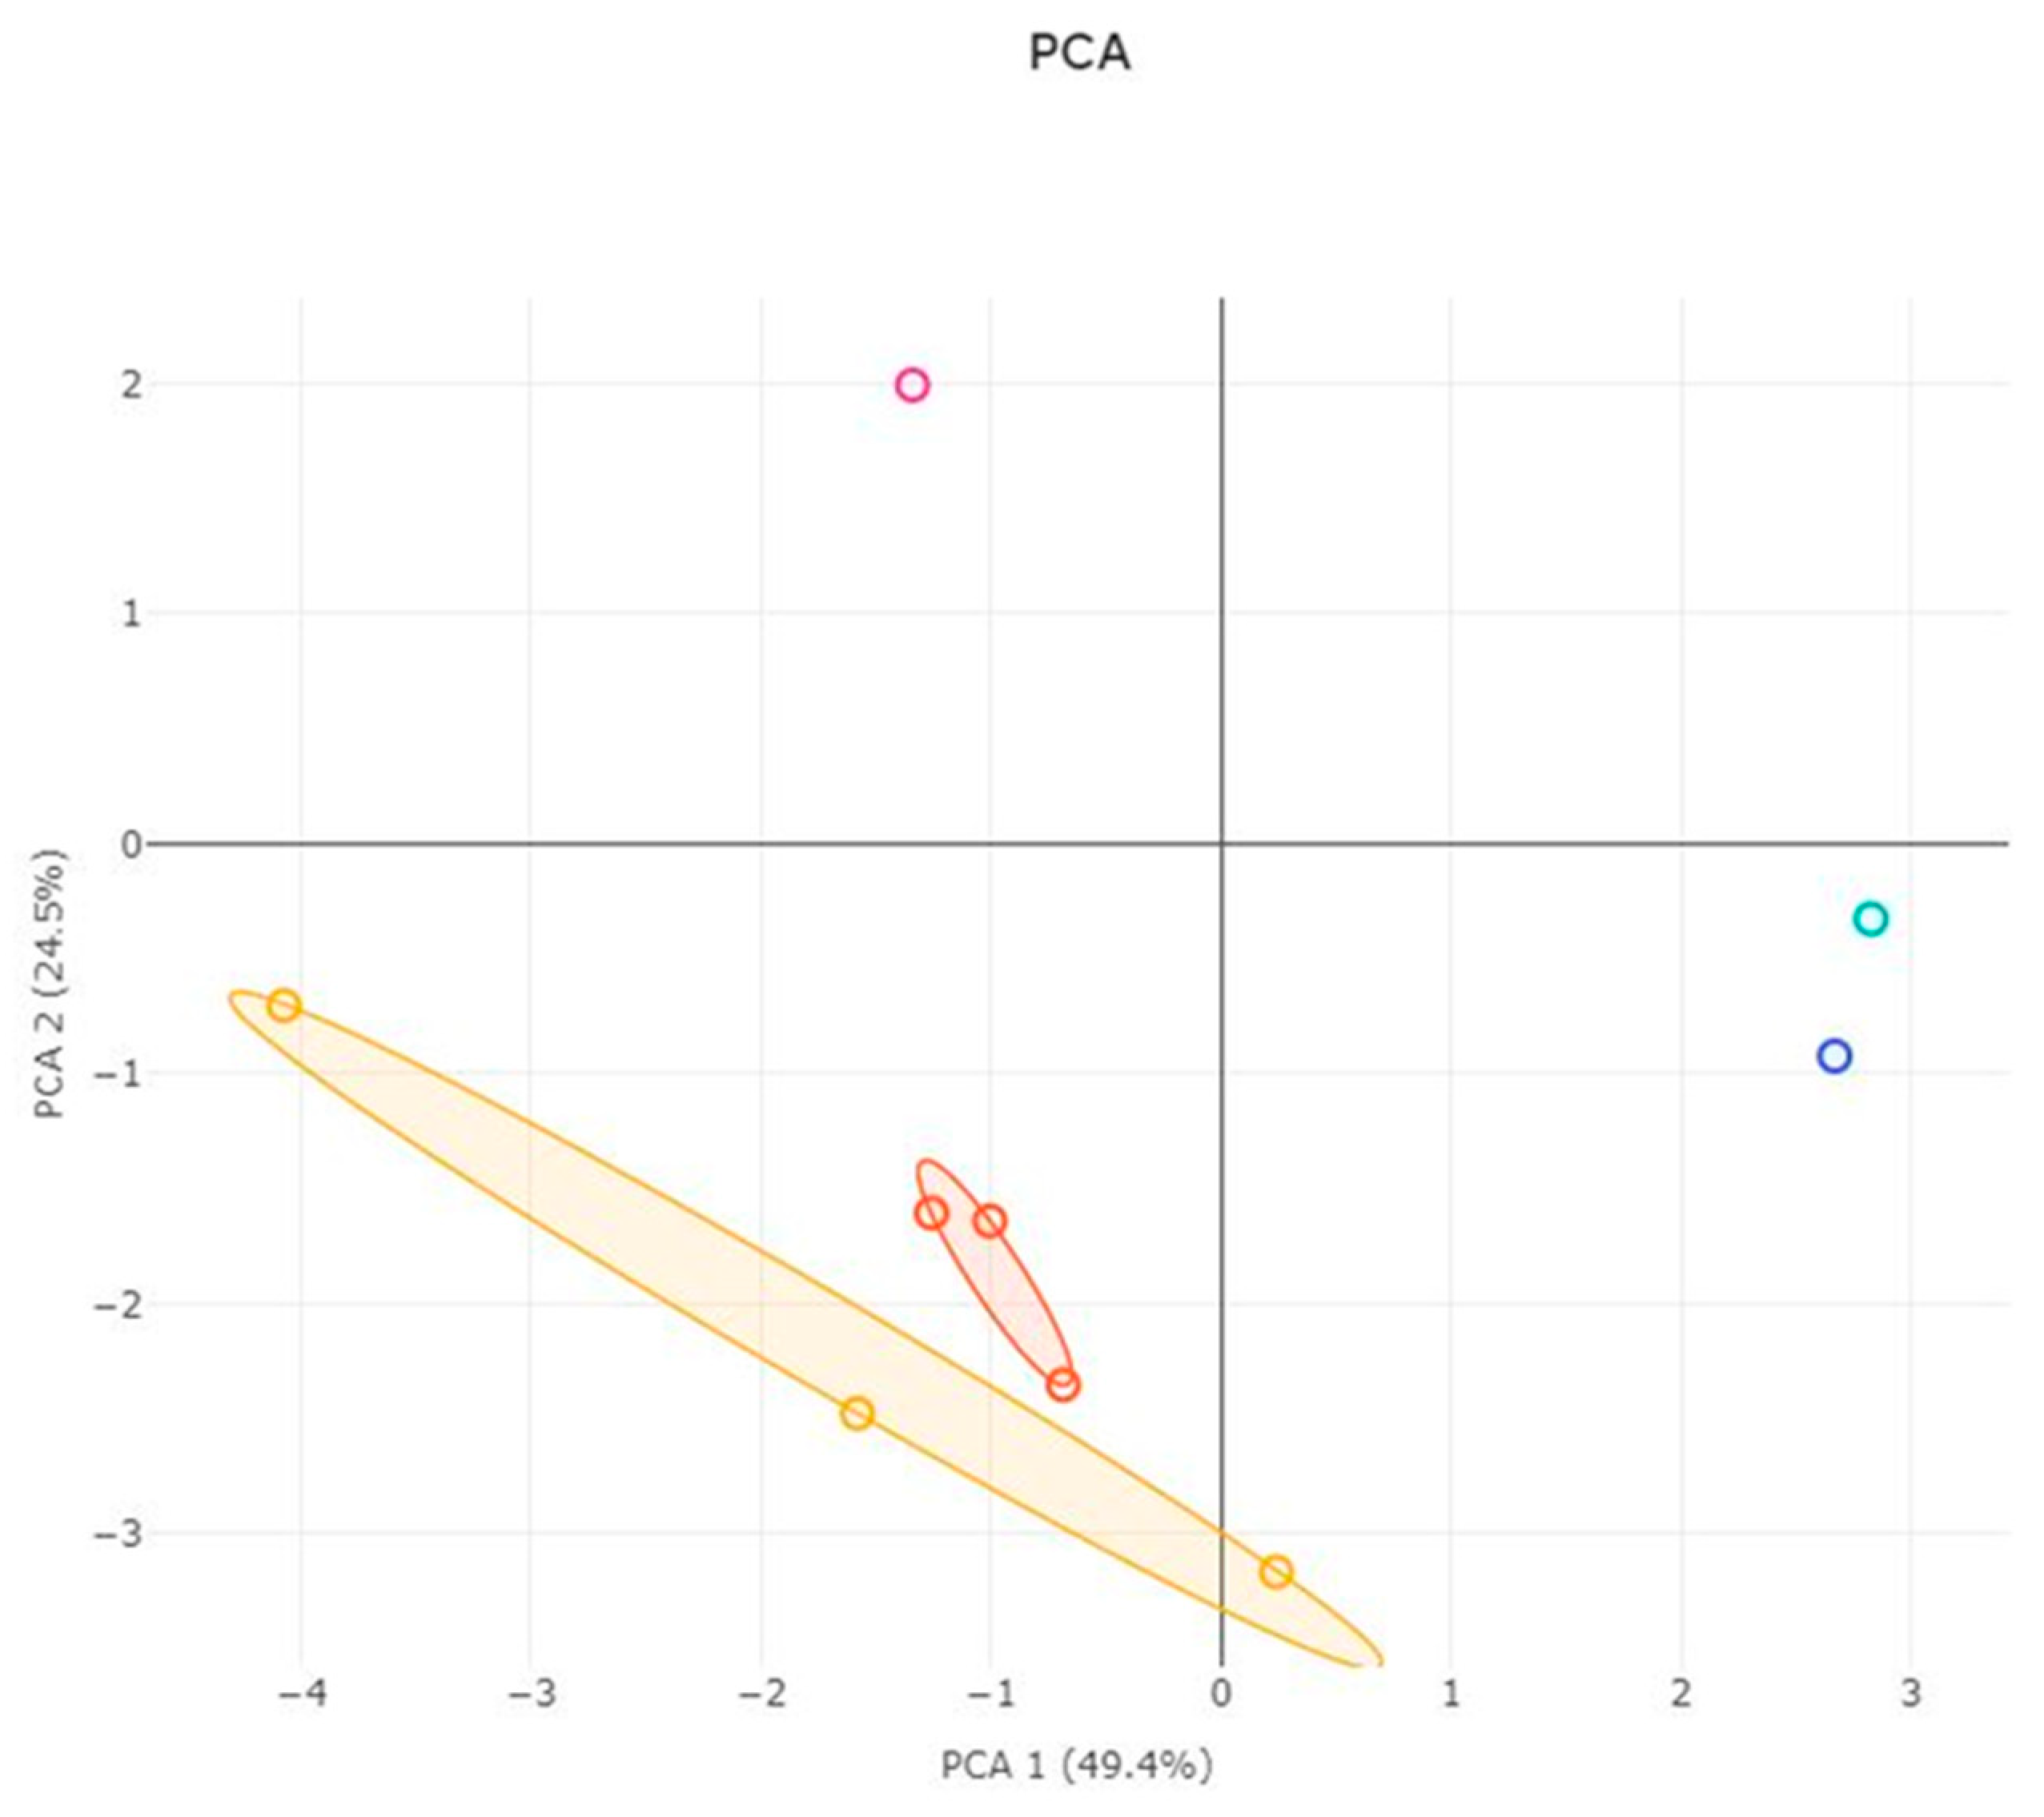
3.3. ACP Analysis
4. Discussion
5. Conclusions
Author Contributions
Funding
Data Availability Statement
Conflicts of Interest
References
- Farré-Armengol, G.; Fernández-Martínez, M.; Filella, I.; Junker, R.R.; Peñuelas, J. Deciphering the Biotic and Climatic Factors That Influence Floral Scents: A Systematic Review of Floral Volatile Emissions. Front. Plant Sci. 2020, 11, 1154. [Google Scholar] [CrossRef]
- Raffo, A.; Moneta, E.; Ferrari Nicoli, S.; Paoletti, F. GC-Olfactometric Characterisation of off-Odours in Commercially Packaged Rocket Leaves. Food Packag. Shelf Life 2020, 25, 100540. [Google Scholar] [CrossRef]
- Isleten Hosoglu, M.; Karagul-Yuceer, Y.; Guneser, O. Aroma Characterization of Heterotrophic Microalgae Crypthecodinium Cohnii Using Solid-Phase Microextraction and Gas Chromatography–Mass Spectrometry/Olfactometry during Different Growth Phases. Algal Res. 2020, 49, 101928. [Google Scholar] [CrossRef]
- Akbal, L.; Hopfgartner, G. Supercritical Fluid Chromatography–Mass Spectrometry Using Data Independent Acquisition for the Analysis of Polar Metabolites in Human Urine. J. Chromatogr. A 2020, 1609, 460449. [Google Scholar] [CrossRef] [PubMed]
- Rice, J.; Lubben, A.; Kasprzyk-Hordern, B. A Multi-Residue Method by Supercritical Fluid Chromatography Coupled with Tandem Mass Spectrometry Method for the Analysis of Chiral and Non-Chiral Chemicals of Emerging Concern in Environmental Samples. Anal. Bioanal. Chem. 2020, 412, 5563–5581. [Google Scholar] [CrossRef]
- Santerre, C.; Vallet, N.; Touboul, D. Fingerprints of Flower Absolutes Using Supercritical Fluid Chromatography Hyphenated with High Resolution Mass Spectrometry. J. Chromatogr. B 2018, 1092, 1–6. [Google Scholar] [CrossRef]
- Huang, Y.; Tang, G.; Zhang, T.; Fillet, M.; Crommen, J.; Jiang, Z. Supercritical Fluid Chromatography in Traditional Chinese Medicine Analysis. J. Pharm. Biomed. Anal. 2018, 147, 65–80. [Google Scholar] [CrossRef]
- Poulton, A.M.; Poulten, R.C.; Baldaccini, A.; Gabet, A.; Mott, R.; Treacher, K.E.; Roddy, E.; Ferguson, P. Towards Improved Characterisation of Complex Polyethylene Glycol Excipients Using Supercritical Fluid Chromatography-Evaporative Light Scattering Detection-Mass Spectrometry and Comparison with Size Exclusion Chromatography-Triple Detection Array. J. Chromatogr. A 2021, 1638, 461839. [Google Scholar] [CrossRef]
- Cunico, L.P.; Cobo, A.M.; Al-Hamimi, S.; Turner, C. Solubility and Thermal Degradation of Quercetin in CO2-Expanded Liquids. Molecules 2020, 25, 5582. [Google Scholar] [CrossRef]
- Van Meerten, S.; van Zelst, F.; Tijssen, K.; Kentgens, A. An Optimized NMR Stripline for Sensitive Supercritical Fluid Chromatography-Nuclear Magnetic Resonance of Microliter Sample Volumes. Anal. Chem. 2020, 92, 13010–13016. [Google Scholar] [CrossRef]
- Xhaferaj, M.; Naegele, E.; Parr, M.K. Ion Exchange in Supercritical Fluid Chromatography Tandem Mass Spectrometry (SFC-MS/MS): Application for Polar and Ionic Drugs and Metabolites in Forensic and Anti-Doping Analysis. J. Chromatogr. A 2020, 1614, 460726. [Google Scholar] [CrossRef] [PubMed]
- Papp, D.; Rukkijakan, T.; Lebedeva, D.; Nylander, T.; Sandahl, M.; Samec, J.S.M.; Turner, C. Single-Standard Quantification Strategy for Lignin Dimers by Supercritical Fluid Chromatography with Charged Aerosol Detection. Anal. Chem. 2022, 95, 1436–1445. [Google Scholar] [CrossRef]
- Langley, G.J.; Cancho-Gonzalez, S.; Herniman, J.M. Different Detectors Used with SFC. In Separation Science and Technology; Elsevier: Amsterdam, The Netherlands, 2022; Volume 14, pp. 299–324. [Google Scholar] [CrossRef]
- Abolhassani, M.; Guais, A.; Chaumet-Riffaud, P.; Sasco, A.J.; Schwartz, L. Carbon Dioxide Inhalation Causes Pulmonary Inflammation. Am. J. Physiol. -Lung Cell. Mol. Physiol. 2009, 296, L657–L665. [Google Scholar] [CrossRef]
- Azuma, K.; Kagi, N.; Yanagi, U.; Osawa, H. Effects of Low-Level Inhalation Exposure to Carbon Dioxide in Indoor Environments: A Short Review on Human Health and Psychomotor Performance. Environ. Int. 2018, 121, 51–56. [Google Scholar] [CrossRef]
- Wilson, A.D. Review of Electronic-Nose Technologies and Algorithms to Detect Hazardous Chemicals in the Environment. Procedia Technol. 2012, 1, 453–463. [Google Scholar] [CrossRef]
- Rambla-Alegre, M.; Tienpont, B.; Mitsui, K.; Masugi, E.; Yoshimura, Y.; Nagata, H.; David, F.; Sandra, P. Coupling Gas Chromatography and Electronic Nose Detection for Detailed Cigarette Smoke Aroma Characterization. J. Chromatogr. A 2014, 1365, 191–203. [Google Scholar] [CrossRef]
- Brenet, S.; John-Herpin, A.; Gallat, F.-X.; Musnier, B.; Buhot, A.; Herrier, C.; Rousselle, T.; Livache, T.; Hou, Y. Highly-Selective Optoelectronic Nose Based on Surface Plasmon Resonance Imaging for Sensing Volatile Organic Compounds. Anal. Chem. 2018, 90, 9879–9887. [Google Scholar] [CrossRef] [PubMed]
- Slimani, S.; Bultel, E.; Cubizolle, T.; Herrier, C.; Rousselle, T.; Livache, T. Opto-Electronic Nose Coupled to a Silicon Micro Pre-Concentrator Device for Selective Sensing of Flavored Waters. Chemosensors 2020, 8, 60. [Google Scholar] [CrossRef]
- Fournel, A.; Mantel, M.; Pinger, M.; Manesse, C.; Dubreuil, R.; Herrier, C.; Rousselle, T.; Livache, T.; Bensafi, M. An Experimental Investigation Comparing a Surface Plasmon Resonance Imaging-Based Artificial Nose with Natural Olfaction. Sens. Actuators B Chem. 2020, 320, 128342. [Google Scholar] [CrossRef]
- Faraco Filho, R.L.; De Castro, J.V.; Barino, F.O.; Campos, D.; Dos Santos, A.B. Enhanced Aroma Prediction in Coffee Fermentation through Optical Fiber Sensor Data Fusion. Sens. Actuators A Phys. 2024, 369, 115223. [Google Scholar] [CrossRef]
- Faraco Filho, R.L.; Oliveira Barino, F.; Calderano, J.; Valle Alvarenga, Í.F.; Campos, D.; Dos Santos, A.B. In-Fiber Mach–Zehnder Interferometer as a Promising Tool for Optical Nose and Odor Prediction during the Fermentation Process. Opt. Lett. 2023, 48, 3905. [Google Scholar] [CrossRef] [PubMed]
- Laplatine, L.; Fournier, M.; Gaignebet, N.; Hou, Y.; Mathey, R.; Herrier, C.; Liu, J.; Descloux, D.; Gautheron, B.; Livache, T. Silicon Photonic Olfactory Sensor Based on an Array of 64 Biofunctionalized Mach-Zehnder Interferometers. Opt. Express 2022, 30, 33955. [Google Scholar] [CrossRef]
- Maho, P.; Herrier, C.; Livache, T.; Comon, P.; Barthelmé, S. Real-Time Gas Recognition and Gas Unmixing in Robot Applications. Sens. Actuators B Chem. 2021, 330, 129111. [Google Scholar] [CrossRef]
- Maho, P.; Herrier, C.; Livache, T.; Rolland, G.; Comon, P.; Barthelmé, S. Reliable Chiral Recognition with an Optoelectronic Nose. Biosens. Bioelectron. 2020, 159, 112183. [Google Scholar] [CrossRef]
- Ashrafi, T.M.S.; Mohanty, G. Surface Plasmon Resonance Sensors: A Critical Review of Recent Advances, Market Analysis, and Future Directions. Plasmonics 2025. [Google Scholar] [CrossRef]
- Jia, B.; Chen, J.; Zhou, J.; Zeng, Y.; Ho, H.P.; Shao, Y. Passively and actively enhanced surface plasmon resonance sensing strategies towards single molecular detection. Nano Res. 2022, 15, 8367–8388. [Google Scholar] [CrossRef]
- Cho, S.H.; Choi, S.; Suh, J.M.; Jang, H.W. Advancements in surface plasmon resonance sensors for real-time detection of chemical analytes: Sensing materials and applications. J. Mater. Chem. C 2025, 13, 6484–6507. [Google Scholar] [CrossRef]
- Roy, J.N.; Changder, A.; Mukherjee, K. Design and analysis of ultralow-power all-optical EX-OR and OR logic operations with chiral Mach-Zehnder interferometer. J. Opt. 2024. [Google Scholar] [CrossRef]
- Butt, M.A. Surface Plasmon Resonance-Based Biodetection Systems: Principles, Progress and Applications—A Comprehensive Review. Biosensors 2025, 15, 35. [Google Scholar] [CrossRef]
- Stuart, D.D.; Van Zant, W.; Valiulis, S.; Malinick, A.S.; Hanson, V.; Cheng, Q. Trends in Surface Plasmon Resonance Biosensing: Materials, Methods, and Machine Learning. Anal. Bioanal. Chem. 2024, 416, 5221–5232. [Google Scholar] [CrossRef]


Disclaimer/Publisher’s Note: The statements, opinions and data contained in all publications are solely those of the individual author(s) and contributor(s) and not of MDPI and/or the editor(s). MDPI and/or the editor(s) disclaim responsibility for any injury to people or property resulting from any ideas, methods, instructions or products referred to in the content. |
© 2025 by the authors. Licensee MDPI, Basel, Switzerland. This article is an open access article distributed under the terms and conditions of the Creative Commons Attribution (CC BY) license (https://creativecommons.org/licenses/by/4.0/).
Share and Cite
Santerre, C.; Touboul, D.; Livache, T.; Herrier, C. Proof-of-Concept Study on Supercritical Fluid Chromatography Hyphenated with a Fast Optoelectronic Nose for Online Monitoring of Odorant Molecules. Processes 2025, 13, 1425. https://doi.org/10.3390/pr13051425
Santerre C, Touboul D, Livache T, Herrier C. Proof-of-Concept Study on Supercritical Fluid Chromatography Hyphenated with a Fast Optoelectronic Nose for Online Monitoring of Odorant Molecules. Processes. 2025; 13(5):1425. https://doi.org/10.3390/pr13051425
Chicago/Turabian StyleSanterre, Cyrille, David Touboul, Thierry Livache, and Cyril Herrier. 2025. "Proof-of-Concept Study on Supercritical Fluid Chromatography Hyphenated with a Fast Optoelectronic Nose for Online Monitoring of Odorant Molecules" Processes 13, no. 5: 1425. https://doi.org/10.3390/pr13051425
APA StyleSanterre, C., Touboul, D., Livache, T., & Herrier, C. (2025). Proof-of-Concept Study on Supercritical Fluid Chromatography Hyphenated with a Fast Optoelectronic Nose for Online Monitoring of Odorant Molecules. Processes, 13(5), 1425. https://doi.org/10.3390/pr13051425