1. Introduction
Shale gas, as a crucial unconventional energy source, has become a focal point in global unconventional energy development [
1,
2,
3,
4] Marine–continental transitional shale gas is an integral component of global shale gas resources [
5], with an estimated technically recoverable resource volume of 5.1 × 10
12 m
3, accounting for 23.4% of China’s total technically recoverable shale gas resources [
6], demonstrating significant resource potential. Currently, marine–continental transitional shale gas in China is at the exploration and evaluation stage. Drilling and well testing in the Qinshui Basin and the Ordos Basin have indicated gas shows, with some exploratory wells yielding industrial gas flows [
7].
The return of fracturing fluids is a key factor influencing shale gas well productivity. In recent years, numerous scholars have extensively studied the mechanisms by which return fluid rates impact well productivity, proposing methods to optimize fluid return rates to enhance well productivity. Lu (2018) [
8] and others, based on experimental and field data, found that a lower return fluid rate and a higher degree of microfractures in shale reservoirs are correlated with increased well productivity. GUO (2019) [
9] developed a comprehensive index-based model to predict return fluid rates, which can be optimized through controllable factors to fall within the range that maximizes well productivity. Lin (2020) [
10] further highlighted that the relationship between the return fluid rate and shale gas well output is not linear, as wells with high return rates may exhibit either high or low productivity. These studies primarily focused on marine or terrestrial shale reservoirs, with a noticeable gap in research on marine–continental transitional shales. The relationship between return fluid rates and well productivity in marine–continental transitional shale gas is still unclear.
Due to the unique sedimentary model of marine–continental transitional shale, these reservoirs exhibit characteristic features such as low-pressure coefficients, distinctive mineral compositions, and complex pore structures. During the fracturing process, the low-pressure coefficient (0.95–1.05) [
11] often leads to insufficient fracture propagation, resulting in substantial fluid retention within micro- and nanoscale pores or fractures, thereby reducing return fluid efficiency. Additionally, the high clay mineral content (average 55.3%) [
12] in the mineral composition can induce hydration expansion, thereby constricting fluid flow paths and reducing return fluid efficiency. Furthermore, the presence of micro–nano pore and fracture systems in marine–continental transitional shale can trap fracturing fluids, forming water locks that hinder fluid return. Thus, the interaction between mineral composition, multi-scale pore structure, and fracturing fluid is complex and unique, with existing research failing to address this gap.
The properties of fracturing fluids (such as salinity and pH) significantly influence the return fluid rate of shale gas wells. In shale gas fracturing, reservoir stimulation techniques often involve adding acid to the preflush fluid to reduce fracture pressure and enhance fracture conductivity. To improve water resource utilization, returning fluids are often reinjected and reused as new fracturing fluids [
13], a practice that alters the properties of the fracturing fluid and, consequently, impacts return fluid efficiency. In recent years, several scholars have explored the impact of fracturing fluid properties on shale gas well return rates from three perspectives: core experiments, micro-models, and mathematical models. Experimental studies by Mirzaei-Paiaman A (2012) [
14] and others revealed that the higher the fluid viscosity, the greater the flow resistance, which negatively affects fluid return efficiency and exacerbates water-phase retention. You (2019) [
15] conducted core-based experiments on fluid retention and salt precipitation damage in shale fractures, showing that salt precipitation caused by fracturing fluid can damage fracture surfaces, increase permeability impairment, and reduce return fluid efficiency. From a micro-model perspective, Zou (2023) [
16] established a micro-porous network model to analyze fracturing fluid return behavior in shale gas reservoirs. The study indicated that increasing fracturing fluid concentration leads to the accumulation of dissolved salts, causing pore blockage and severely restricting liquid-phase return rates. Wang (2016) [
17], in his mathematical model of gas–water two-phase flow, showed that the chemical potential difference between low-salinity fracturing fluid and high-salinity formation water can suppress 80% of the liquid-phase return, creating permanent water locks and reducing fluid mobility. However, existing studies do not adequately address the impact of fracturing fluid property variations on return efficiency in marine–continental transitional shale reservoirs, and no strategies specific to these reservoirs have been proposed.
Considering the multi-scale pore structure and mineral composition of shale, this study simulates the return behavior of fracturing fluids with different properties under original reservoir stress and temperature conditions. The study aims to reveal the evolution characteristics of shale physical properties and pore structures under the influence of different fracturing fluid properties, and to clarify the mechanisms by which fracturing fluid properties affect return efficiency in marine–continental transitional shale gas reservoirs. The experimental findings provide theoretical support for optimizing fracturing fluid formulations, improving return efficiency, and enhancing well productivity.
2. Materials and Methods
2.1. Shale Samples
The experimental samples were collected from the marine–continental transitional shale gas layers of the Shanxi Formation in the eastern Ordos Basin (
Table 1) [
18]. The Shanxi Formation in the study area consists of continental shelf deposits, with lithologies predominantly comprising black shale, black carbonaceous shale, gray–black mudstone, and deep-gray mudstone [
19] Some intervals also include fine sandstone, medium-grained sandstone, and coal seams [
20]. The lithological succession, from bottom to top, includes the Shan 2 and Shan 1 members [
21,
22]. Compared to the Shan 1 member, the Shan 2 member is characterized by thicker shale layers, stable lateral distribution, darker rock color, and fewer, thinner interbeds [
23]. The average thickness of a single shale layer can reach 10 m, making it the primary target for shale gas exploration in this block [
24]
.The sample depth ranges from 1945.5 to 2372.6 m, with a formation pressure coefficient of 0.93. The formation temperature and pressure are 60.0 °C and 18.6 MPa, respectively. X-ray diffraction (XRD) results indicate that the mineral composition of the marine–continental transitional shale in the study area is dominated by quartz (average 39.07%) and clay minerals (average 48.29%). Pyrite and siderite are present (average 8.13%), along with trace amounts of calcite, dolomite, and feldspar. The clay mineral content is primarily composed of illite–smectite interlayers (average 45.44%), kaolinite (average 22.11%), and illite (average 28.88%), with a minor amount of chlorite (
Table 2). The total organic carbon (TOC) content of the shale samples ranges from 1.16% to 5.21%, with an average of 2.37%. The marine–continental transitional shale cores are generally dense, with some cores exhibiting microfractures and natural fractures. Tests using an automated porosimeter show that the shale samples have a porosity range of 2.337% to 7.322%, with an average of 3.657%, and permeability ranging from 0.0004 to 16.322 mD, with a median permeability of 0.018 mD. There is a poor correlation between porosity and permeability, and the development of microfractures is the primary controlling factor affecting the shale’s flow capacity. Scanning electron microscope (SEM) observations after argon ion polishing reveal that the organic pores in the marine–continental transitional shale are underdeveloped, with the pores predominantly inorganic in nature. Nitrogen adsorption, an important method for quantitatively characterizing shale nanopores, shows that the specific surface area of the shale samples ranges from 0.199 to 7.126 m
2/g, with an average of 2.40 m
2/g, and the pore volume ranges from 0.001 to 0.01 cm
3/g, with an average of 0.005 cm
3/g.
2.2. Flowback Fluid Properties
Ion composition and concentration analysis were conducted on the fracturing flowback fluids from wells J1 and JH (
Table 3). The salinity of the J1 well is 128,461.74 mg/L, while that of the JH well is 79,790.54 mg/L. The formation water is primarily composed of NaCl and CaCl
2. According to the Sulin water type classification, the original formation water type is classified as CaCl
2 (deep marine confined water), which serves as a reliable indicator of oil and gas presence. The high chloride (Cl
−) content in the flowback fluid suggests a substantial contact area between the fracturing fluid and the shale reservoir, indicating effective fracturing. A notable difference is observed between the salinity of the fracturing fluid (slickwater) (approximately 1000 mg/L) and the flowback fluid, suggesting that the formation water has higher salinity or that the shale gas layer contains soluble solid salts. The intrusion of low-salinity fluids may cause significant reservoir damage.
2.3. Experimental Methods
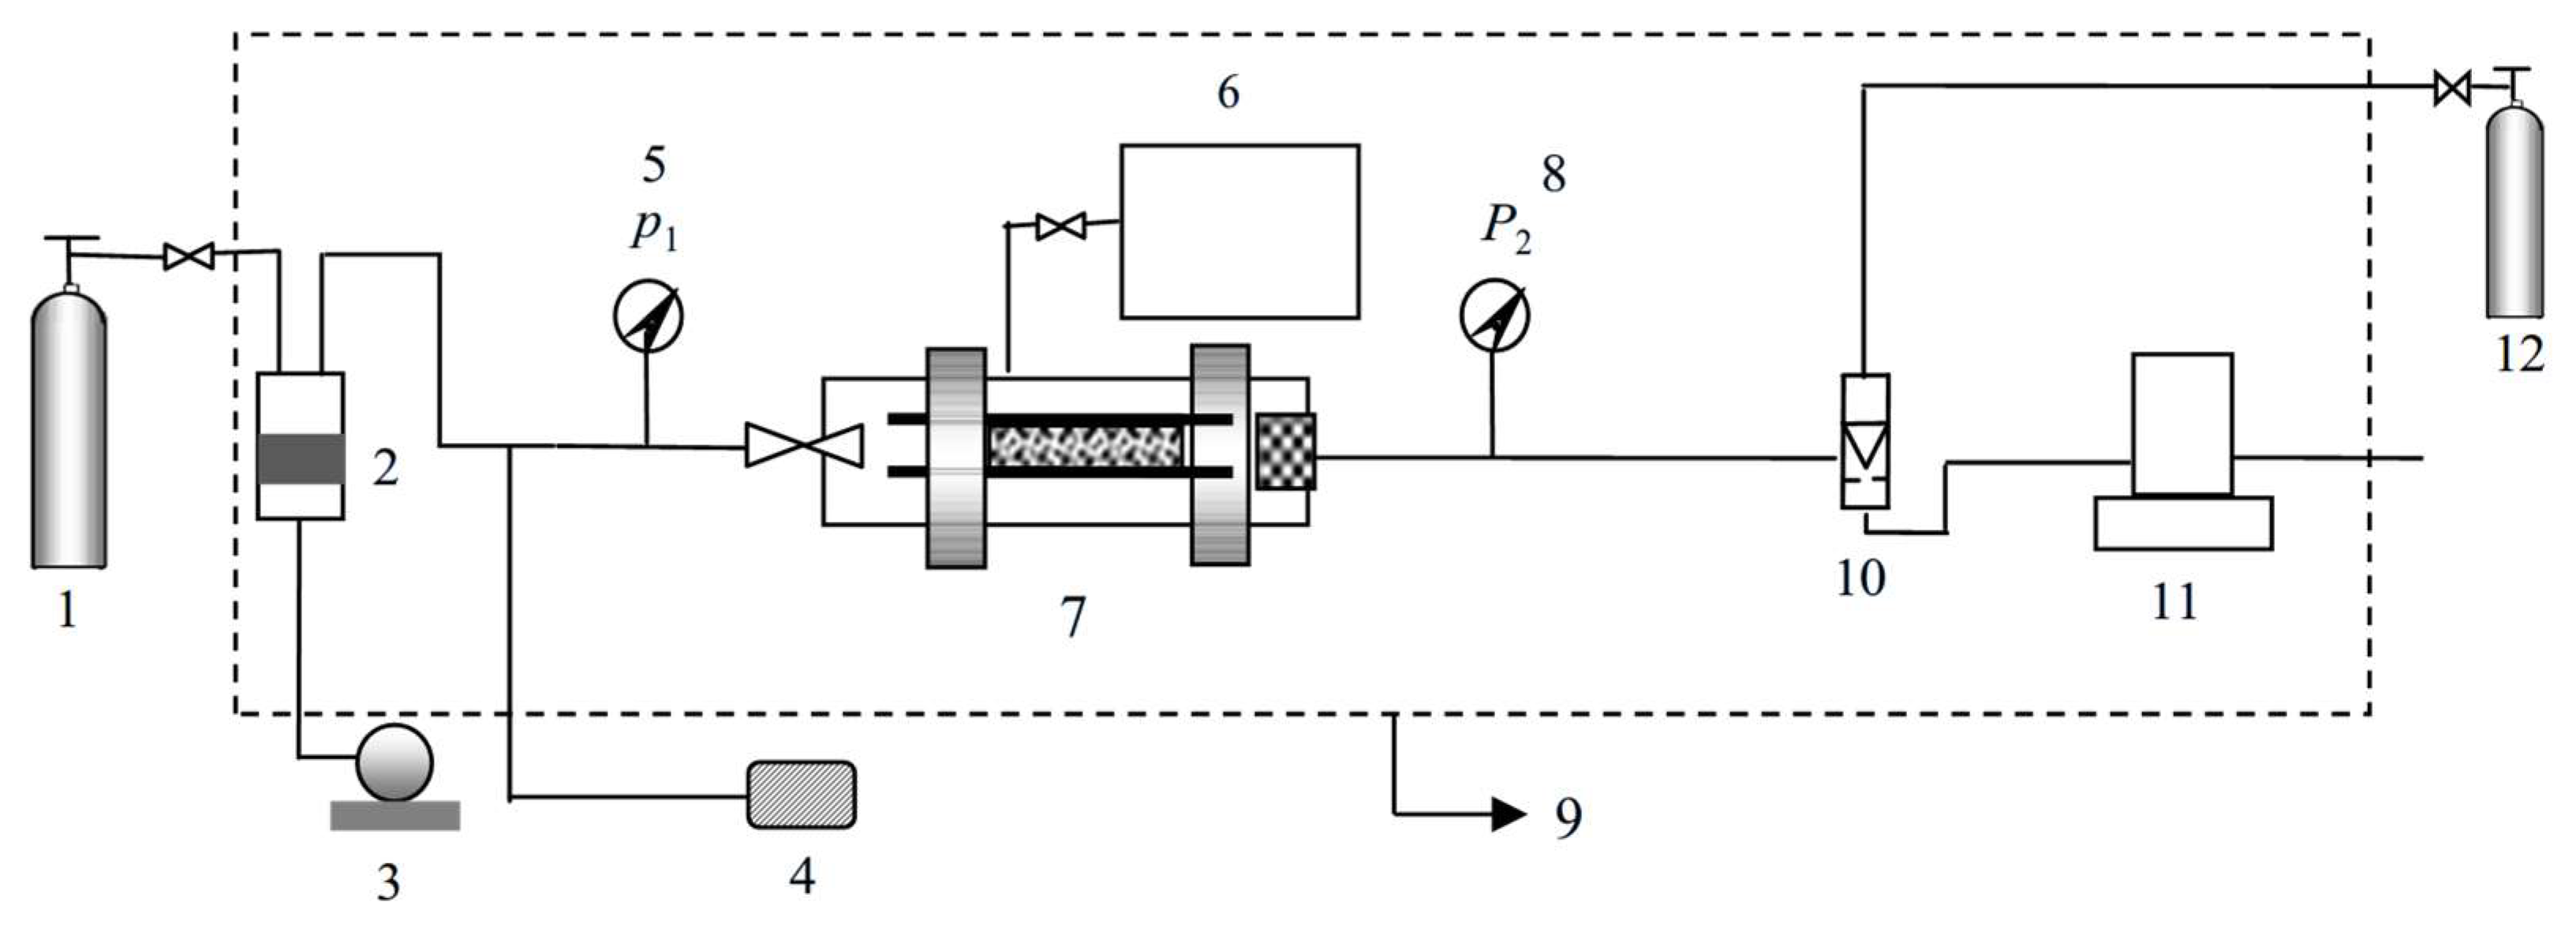
This study experimentally simulates the impact mechanisms of varying field fracturing fluid parameters (mineralization and pH) on shale liquid flowback behavior. The experimental process reveals the interaction mechanisms of fluids with different mineralization levels, as well as inorganic and organic acids, on shale mineral compositions and multi-scale pore structures. The experimental setup is depicted in
Figure 1, and the experimental procedure is as follows:
(1) Shale liquid flowback experiments under different salinity levels: ① Dry the rock samples in an oven at 60 °C for 24 h, then measure the basic parameters, including length (
L), diameter (
D0), weight (
M0), porosity (
φm), and permeability (
K0). ② After evacuating the rock samples for 4 h, saturate them with fracturing fluid under 20 MPa for 12 h. ③ After saturation, place the rock samples into a core holder and age them under a fixed confining pressure for 6 h [
25], followed by conducting a displacement flowback experiment. A fixed backpressure is applied at the outlet to simulate the formation pore pressure, with the inlet pressure as the sum of the backpressure and flowback pressure difference. Repeat the steps above for shale liquid flowback experiments using formation water, sub-formation water, and distilled water as the test fluids.
(2) Shale liquid flowback experiments with inorganic and organic acid treatments: ① Dry the rock samples in an oven at 60 °C for 24 h, then measure the basic parameters, including length (L), diameter (D0), weight (M0), porosity (φm), and permeability (K0). ② After evacuating the rock samples for 4 h, saturate them with a 5% KCl solution at 20 MPa for 12 h. Then, perform shale liquid flowback experiments before and after treatment with inorganic acid (15% hydrochloric acid solution) and organic acid (10% acetic acid solution). The flowback test fluid is a 5% KCl solution, and the experimental pressure conditions remain constant.
(3) Single Mineral–Acid Interaction Experiment. ① Seven common shale minerals, including quartz, potassium feldspar, calcite, kaolinite, montmorillonite, illite, and chlorite, were selected for the experiment. The mineral samples were ground to a powder with an approximate particle size of 200 mesh. The powdered samples were then placed in an oven and dried at 60 °C for 24 h. The initial mass of each sample (M0) was measured. ② The powdered samples were separately immersed in inorganic acid (15% hydrochloric acid solution) and organic acid (10% acetic acid solution) for a thorough reaction. Afterward, the samples were re-dried, and the mass (M₁) was measured again.
After the shale liquid flowback experiment, the shale permeability recovery rate is determined by Equation (1), and the shale liquid flowback rate is calculated using Equation (2):
In the formula,
Dk represents the shale permeability recovery rate (%);
Kn denotes the permeability of the rock sample after fracturing fluid flowback (mD);
K1 is the permeability of the rock sample saturated with fracturing fluid (mD); and
K0 is the initial dry rock sample permeability (mD).
In this equation, Fp is the shale liquid flowback rate (%); a represents the shale liquid saturation amount (g); M0 is the weight of the rock sample before fracturing fluid flowback (g); M1 is the weight of the rock sample after fracturing fluid flowback (g).
After the completion of the single mineral–acid interaction experiment, the sample dissolution rate was calculated using Equation (3).
In the equation, η represents the sample dissolution rate (%); m₀ is the sample mass before acid treatment (g); and m1 is the sample mass after acid treatment (g).
4. Discussion
4.1. Permeability Evolution for Different Fracturing Fluid Properties
The physical properties and pore structure characteristics of shale reservoirs are crucial for evaluating liquid flowback behavior [
30]. The results of porosity and permeability changes in shale before and after exposure to different fracturing fluids (
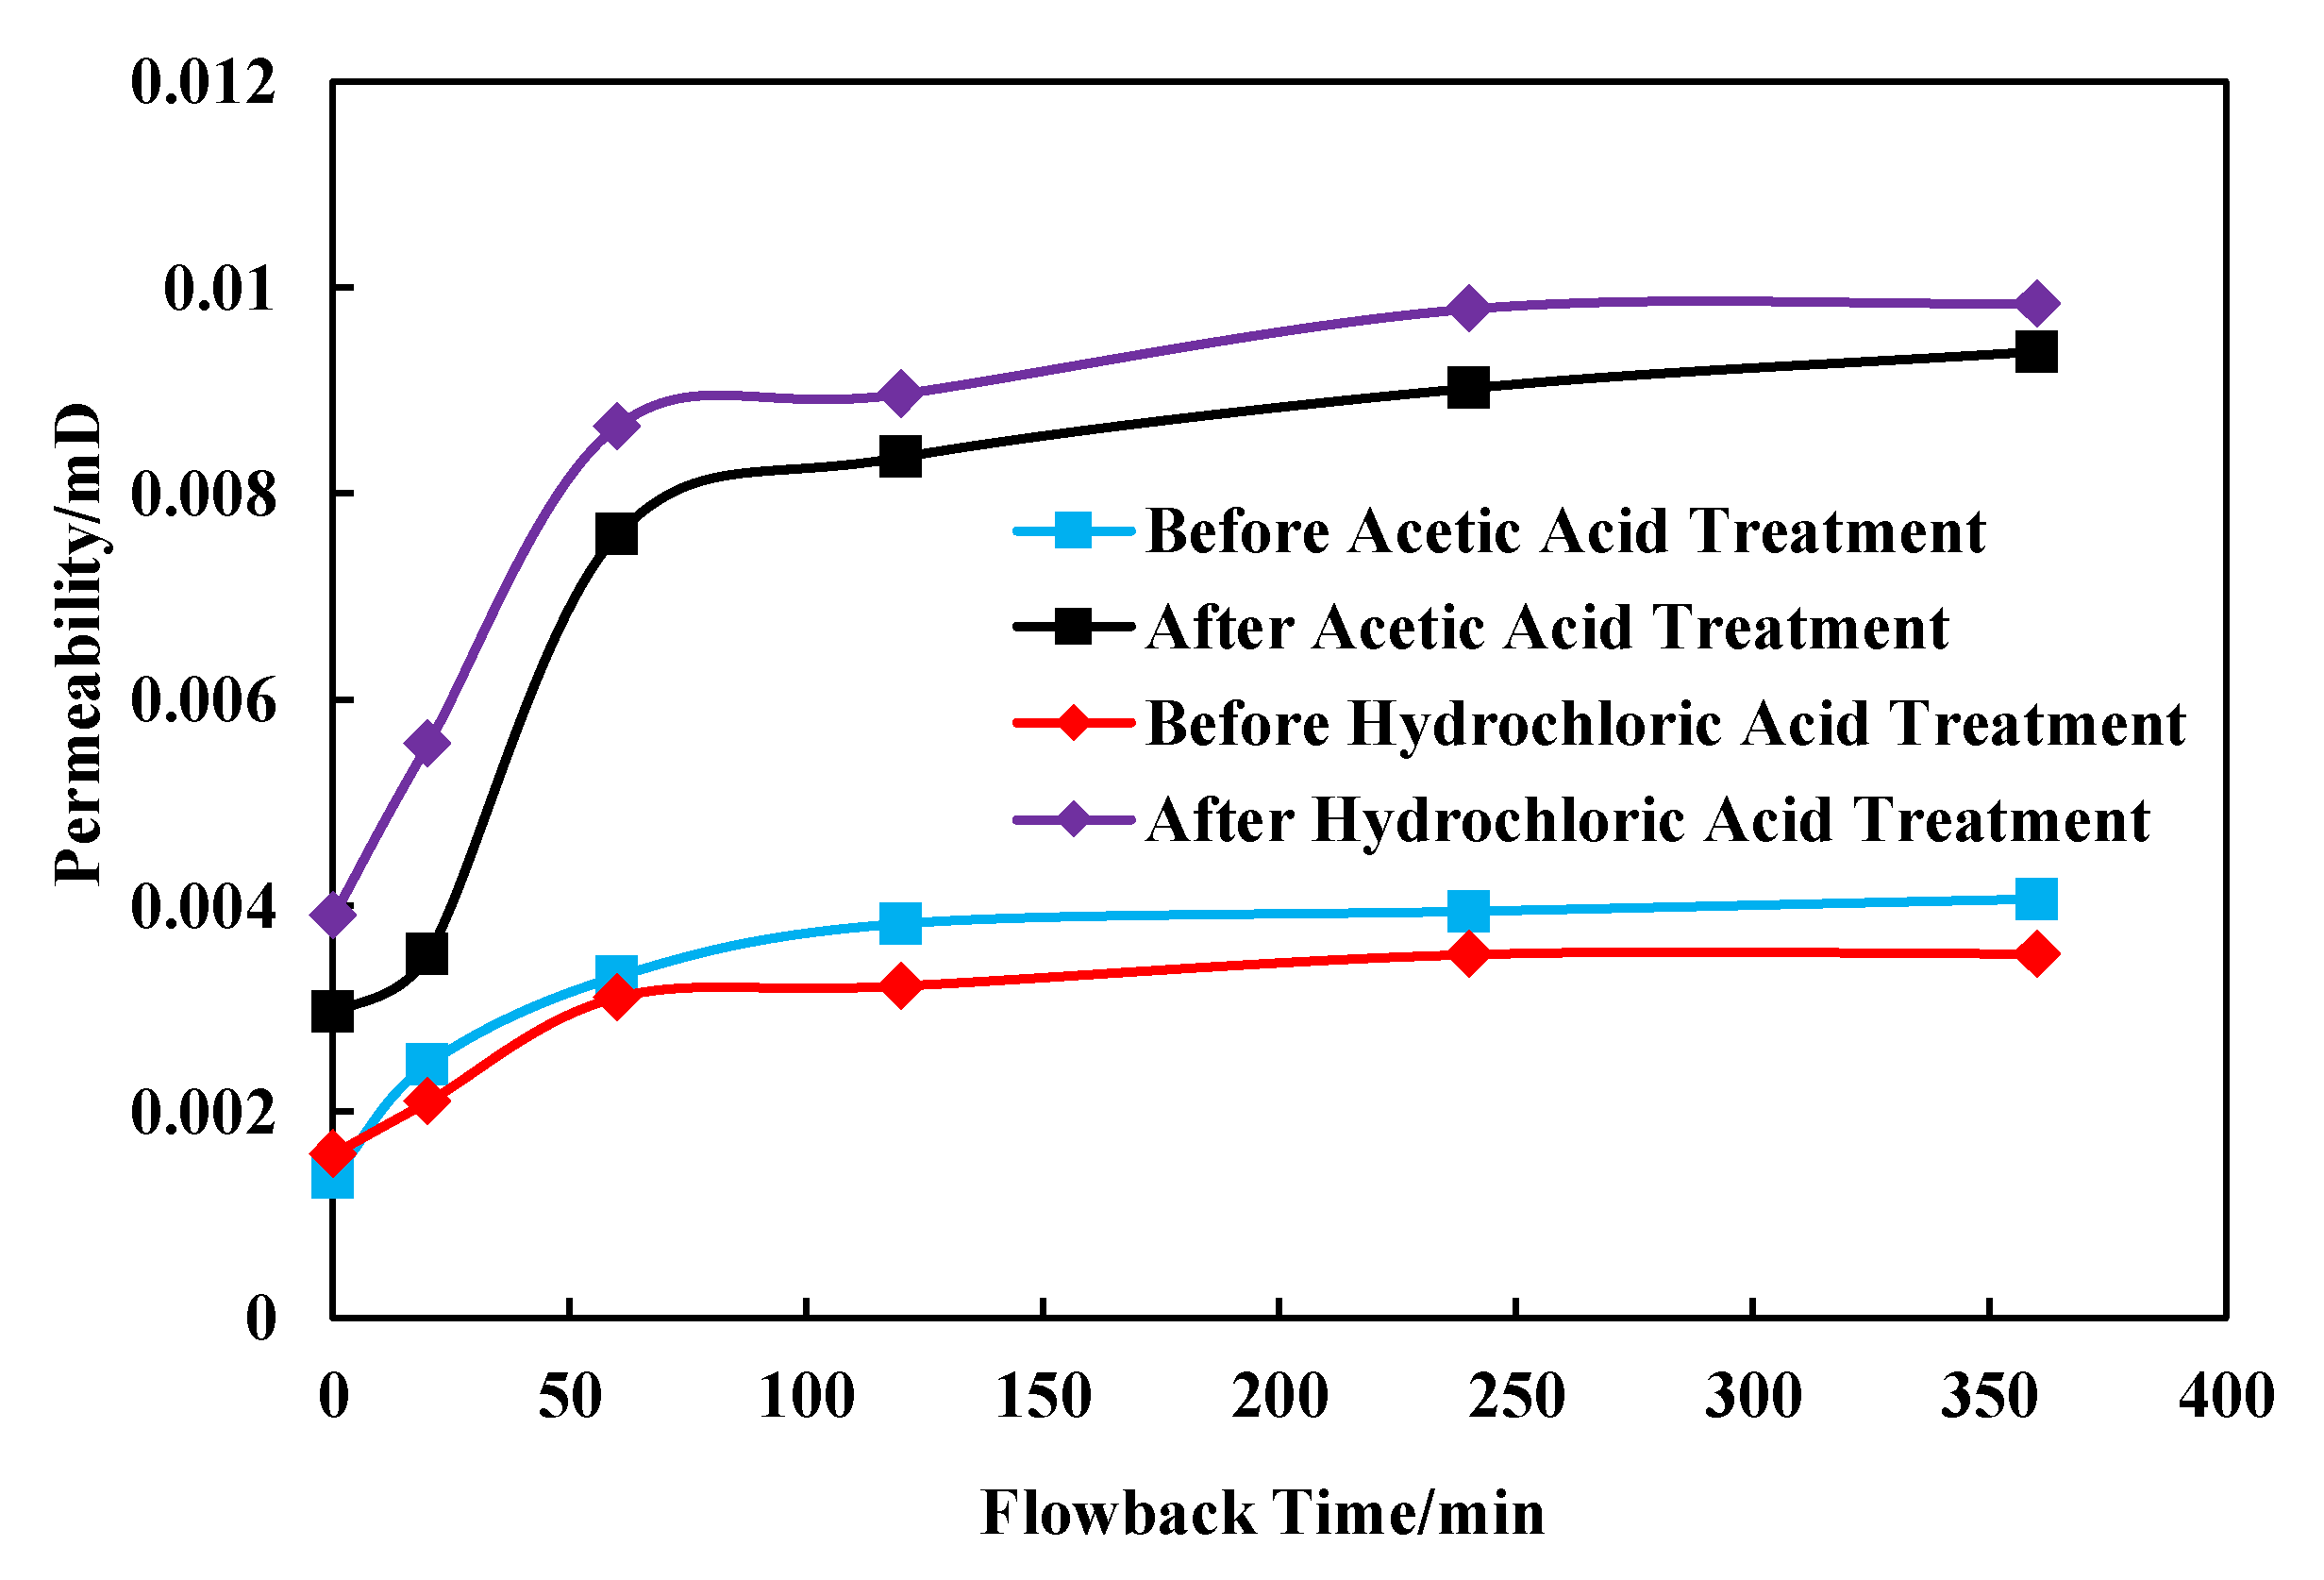
Table 7) show that as solution salinity decreases, both porosity and permeability of the rock samples decrease significantly, with porosity reducing by 41.50% to 92.26% and permeability by 31.15% to 99.96%. After acid treatment, porosity increases by 8.27% to 17.99%, and permeability increases by 395.28% to 4120.00%. After slickwater fracturing fluid treatment, porosity decreases by 46.74% and permeability decreases by 98.44%.
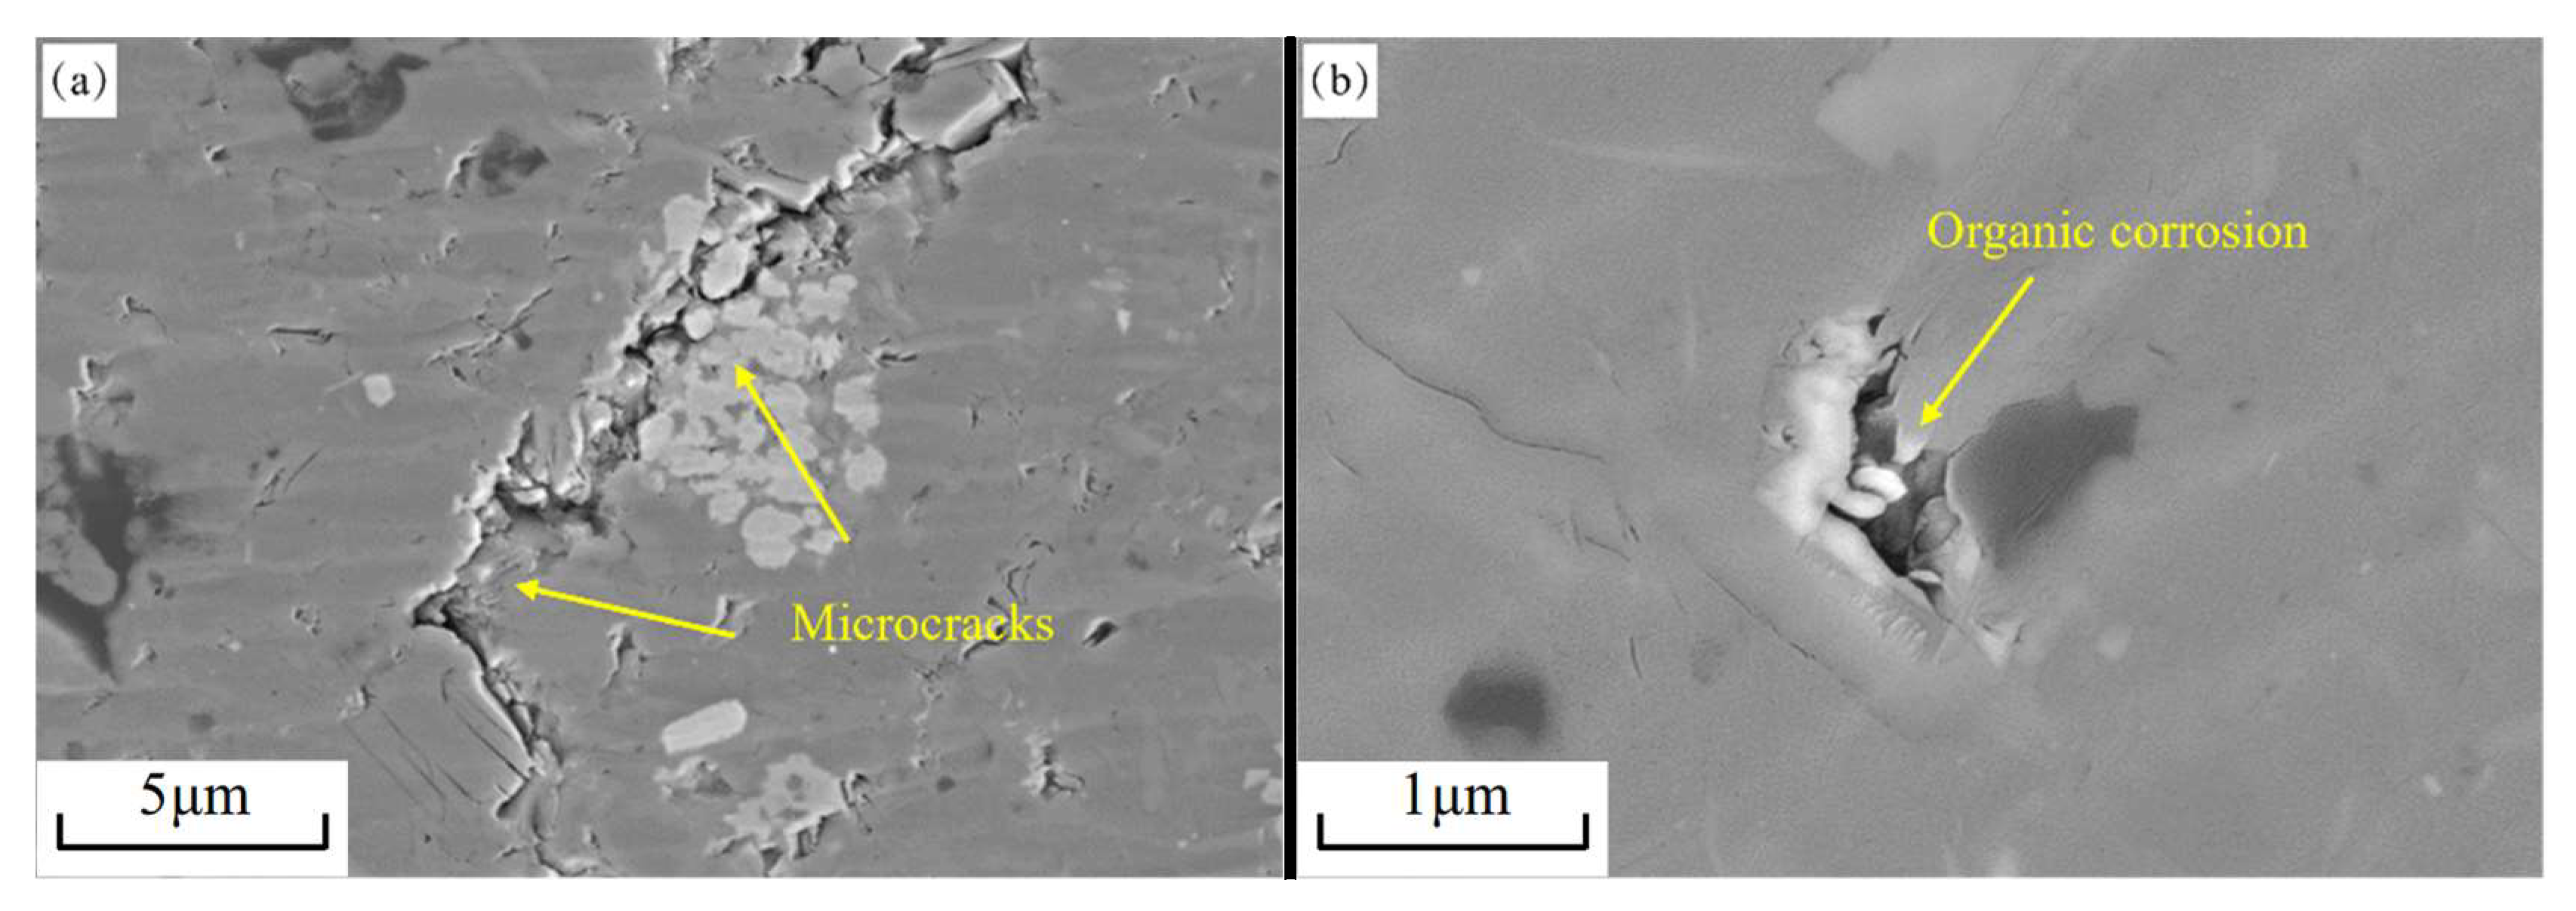
Scanning electron microscopy results (
Figure 5a,b) indicate that after low-salinity fracturing fluids enter the shale reservoir, the increased water saturation near the fracture surfaces causes water-phase trapping damage. Additionally, water–rock interactions lead to clay mineral hydration and swelling, blocking pores, which is the primary cause of the significant reduction in shale reservoir permeability. Moreover, low-salinity solutions and slickwater fracturing fluids may cause the dissolution and precipitation of clay minerals, partial dissolution of organic matter, particle dispersion, migration, deposition, adsorption, and further blockage of flow channels. This leads to the retention of large amounts of fracturing fluid in the reservoir and severely restricts the efficiency of shale liquid flowback.
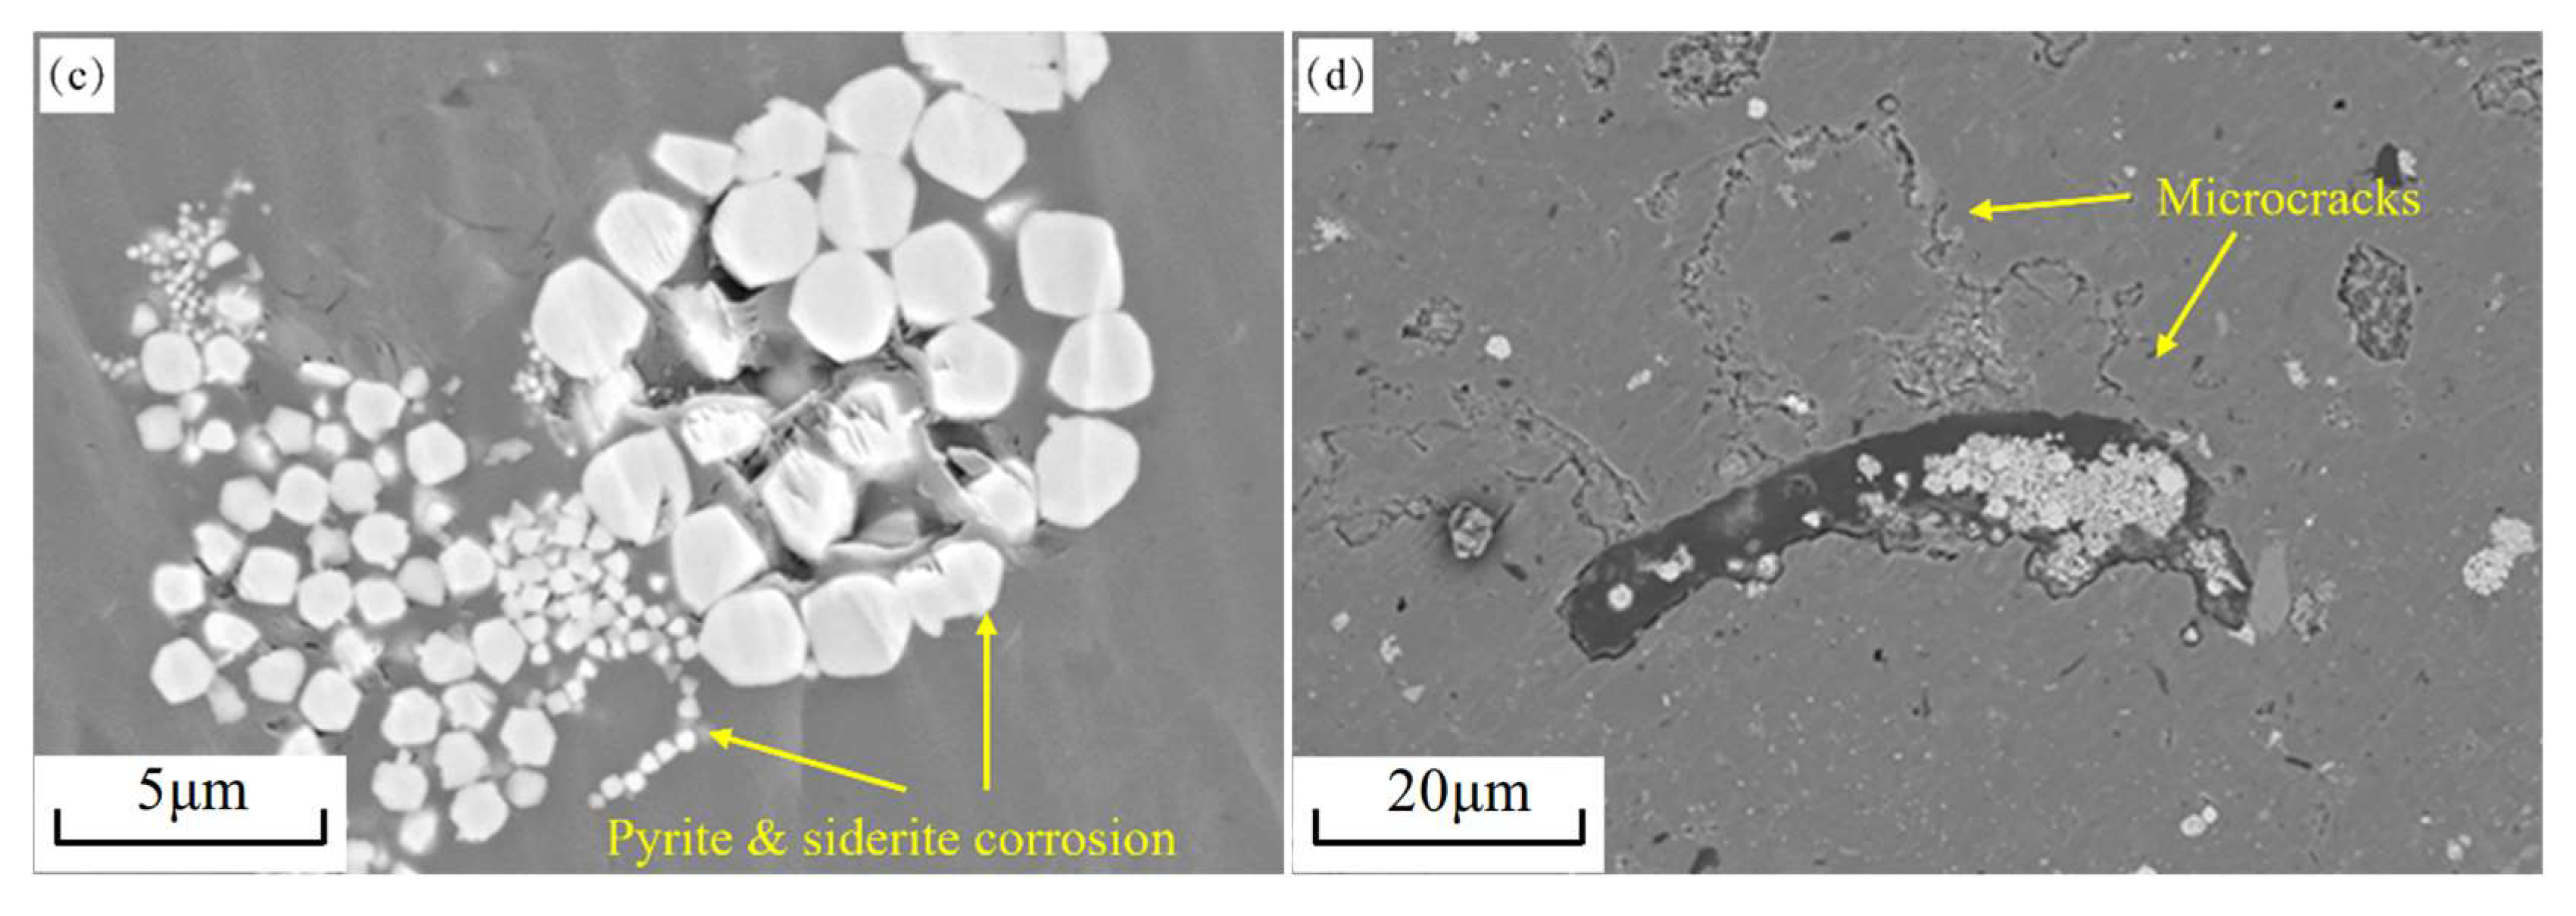
The dissolution of carbonate minerals and certain clay minerals in shale by acid fluids helps to create pores, microfractures, and flow channels (
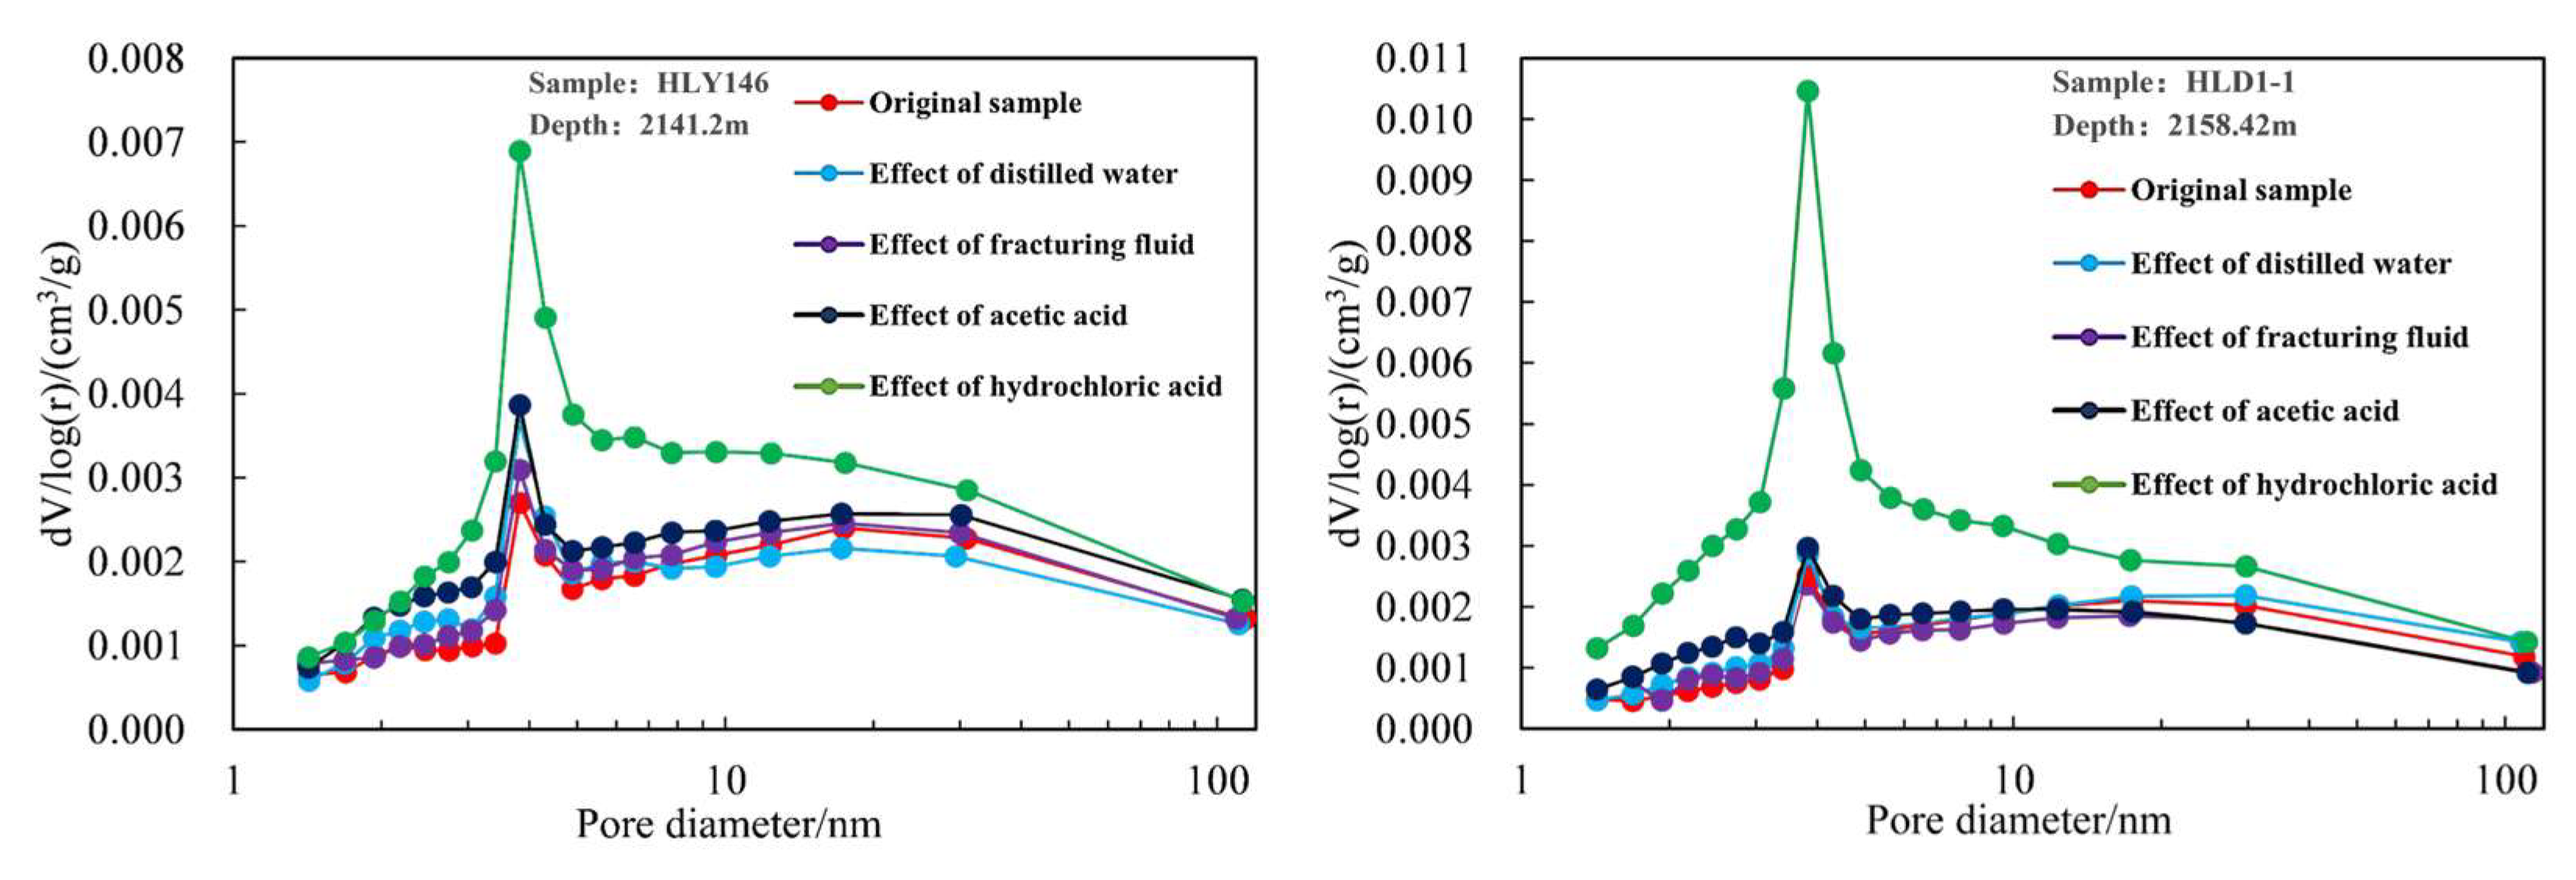
Figure 5c,d), significantly improving flow conditions and enhancing flowback efficiency, while reducing fluid retention. The nitrogen adsorption/desorption isotherms of shale pore size distribution (
Figure 6)indicate that the shale pore size is primarily centered around 4 nm. After treatment with different fracturing fluids, the pore volume of the samples generally increased. In the 1-10 nm pore size range, the sequence of pore volume size was hydrochloric acid > acetic acid > fracturing fluid > distilled water > original sample. The most significant change occurred after hydrochloric acid treatment, where the pore volume increased from 0.003 cm
3/g to 0.007 cm
3/g, generating a large number of slit-like pores with parallel walls and ink-bottle pores. After treatment with distilled water, the pore volume increased from 0.003 cm
3/g to 0.0037 cm
3/g, indicating that the hydration of clay minerals facilitates fracture induction and pore volume expansion. In the 10–100 nm pore size range, there were some differences in pore volume changes among the samples, but these differences were relatively minor.
4.2. Shale-Fracturing Fluid Interaction Mechanism
The characteristics of the marine–continental transitional shale reservoirs in the study area differ significantly from those of the marine shale reservoirs in the Sichuan Basin. These reservoirs exhibit strong heterogeneity, with the dominant organic matter type being the shell-rich group, slightly lower in content than in marine shales. The reservoirs contain low levels of brittle minerals but high levels of clay minerals, primarily kaolinite. Stratification is well-developed, while microfractures are underdeveloped. These characteristics are key factors contributing to the unique shale-fluid interaction mechanism in marine–continental transitional shales. During shale gas fracturing, the large volume of fracturing fluid injected into the shale reservoir can easily lead to clay mineral hydration and expansion. The clay mineral types are diverse, with non-expanding clay minerals (illite and kaolinite) and expanding clay minerals (illite–smectite interstratified minerals) each comprising about 50%. The clay hydration and expansion induced by low-salinity fracturing fluids exhibit both beneficial and detrimental effects (
Figure 7).
Beneficial Effect: During the flowback of fracturing fluid, when non-expanding clay minerals interact with low-salinity fluid, their interlayer bonding is relatively strong, and the absence of interlayer cation exchange, combined with a rigid crystal structure, results in minimal hydration expansion. This weak hydration effect can weaken the interparticle bonding and induce microfractures, potentially serving as a starting point for fracture initiation. This characteristic promotes fracture formation and propagation, enhancing fluid flowability within the pore structure.
Detrimental Effect: Expanding clay minerals (e.g., illite/montmorillonite interlayer minerals) possess a strong interlayer cation exchange capacity, weak interlayer bonding, and are highly susceptible to hydration. The intrusion of low-mineralized fracturing fluid easily induces double-layer expansion and cation hydration, resulting in mineral particle expansion, pore throat clogging, and flow channel obstruction, leading to water-sensitive damage. The dispersion and migration of expanding clay mineral particles further intensify rate-sensitive damage, further decreasing rock sample permeability. Following hydration expansion, pore throat channels become more fragile due to particle swelling and reduced inter-particle spacing. When external stress is applied, the pore structure is likely to undergo irreversible deformation or collapse, significantly increasing stress sensitivity damage.
The results from the single mineral–acid interaction experiments (
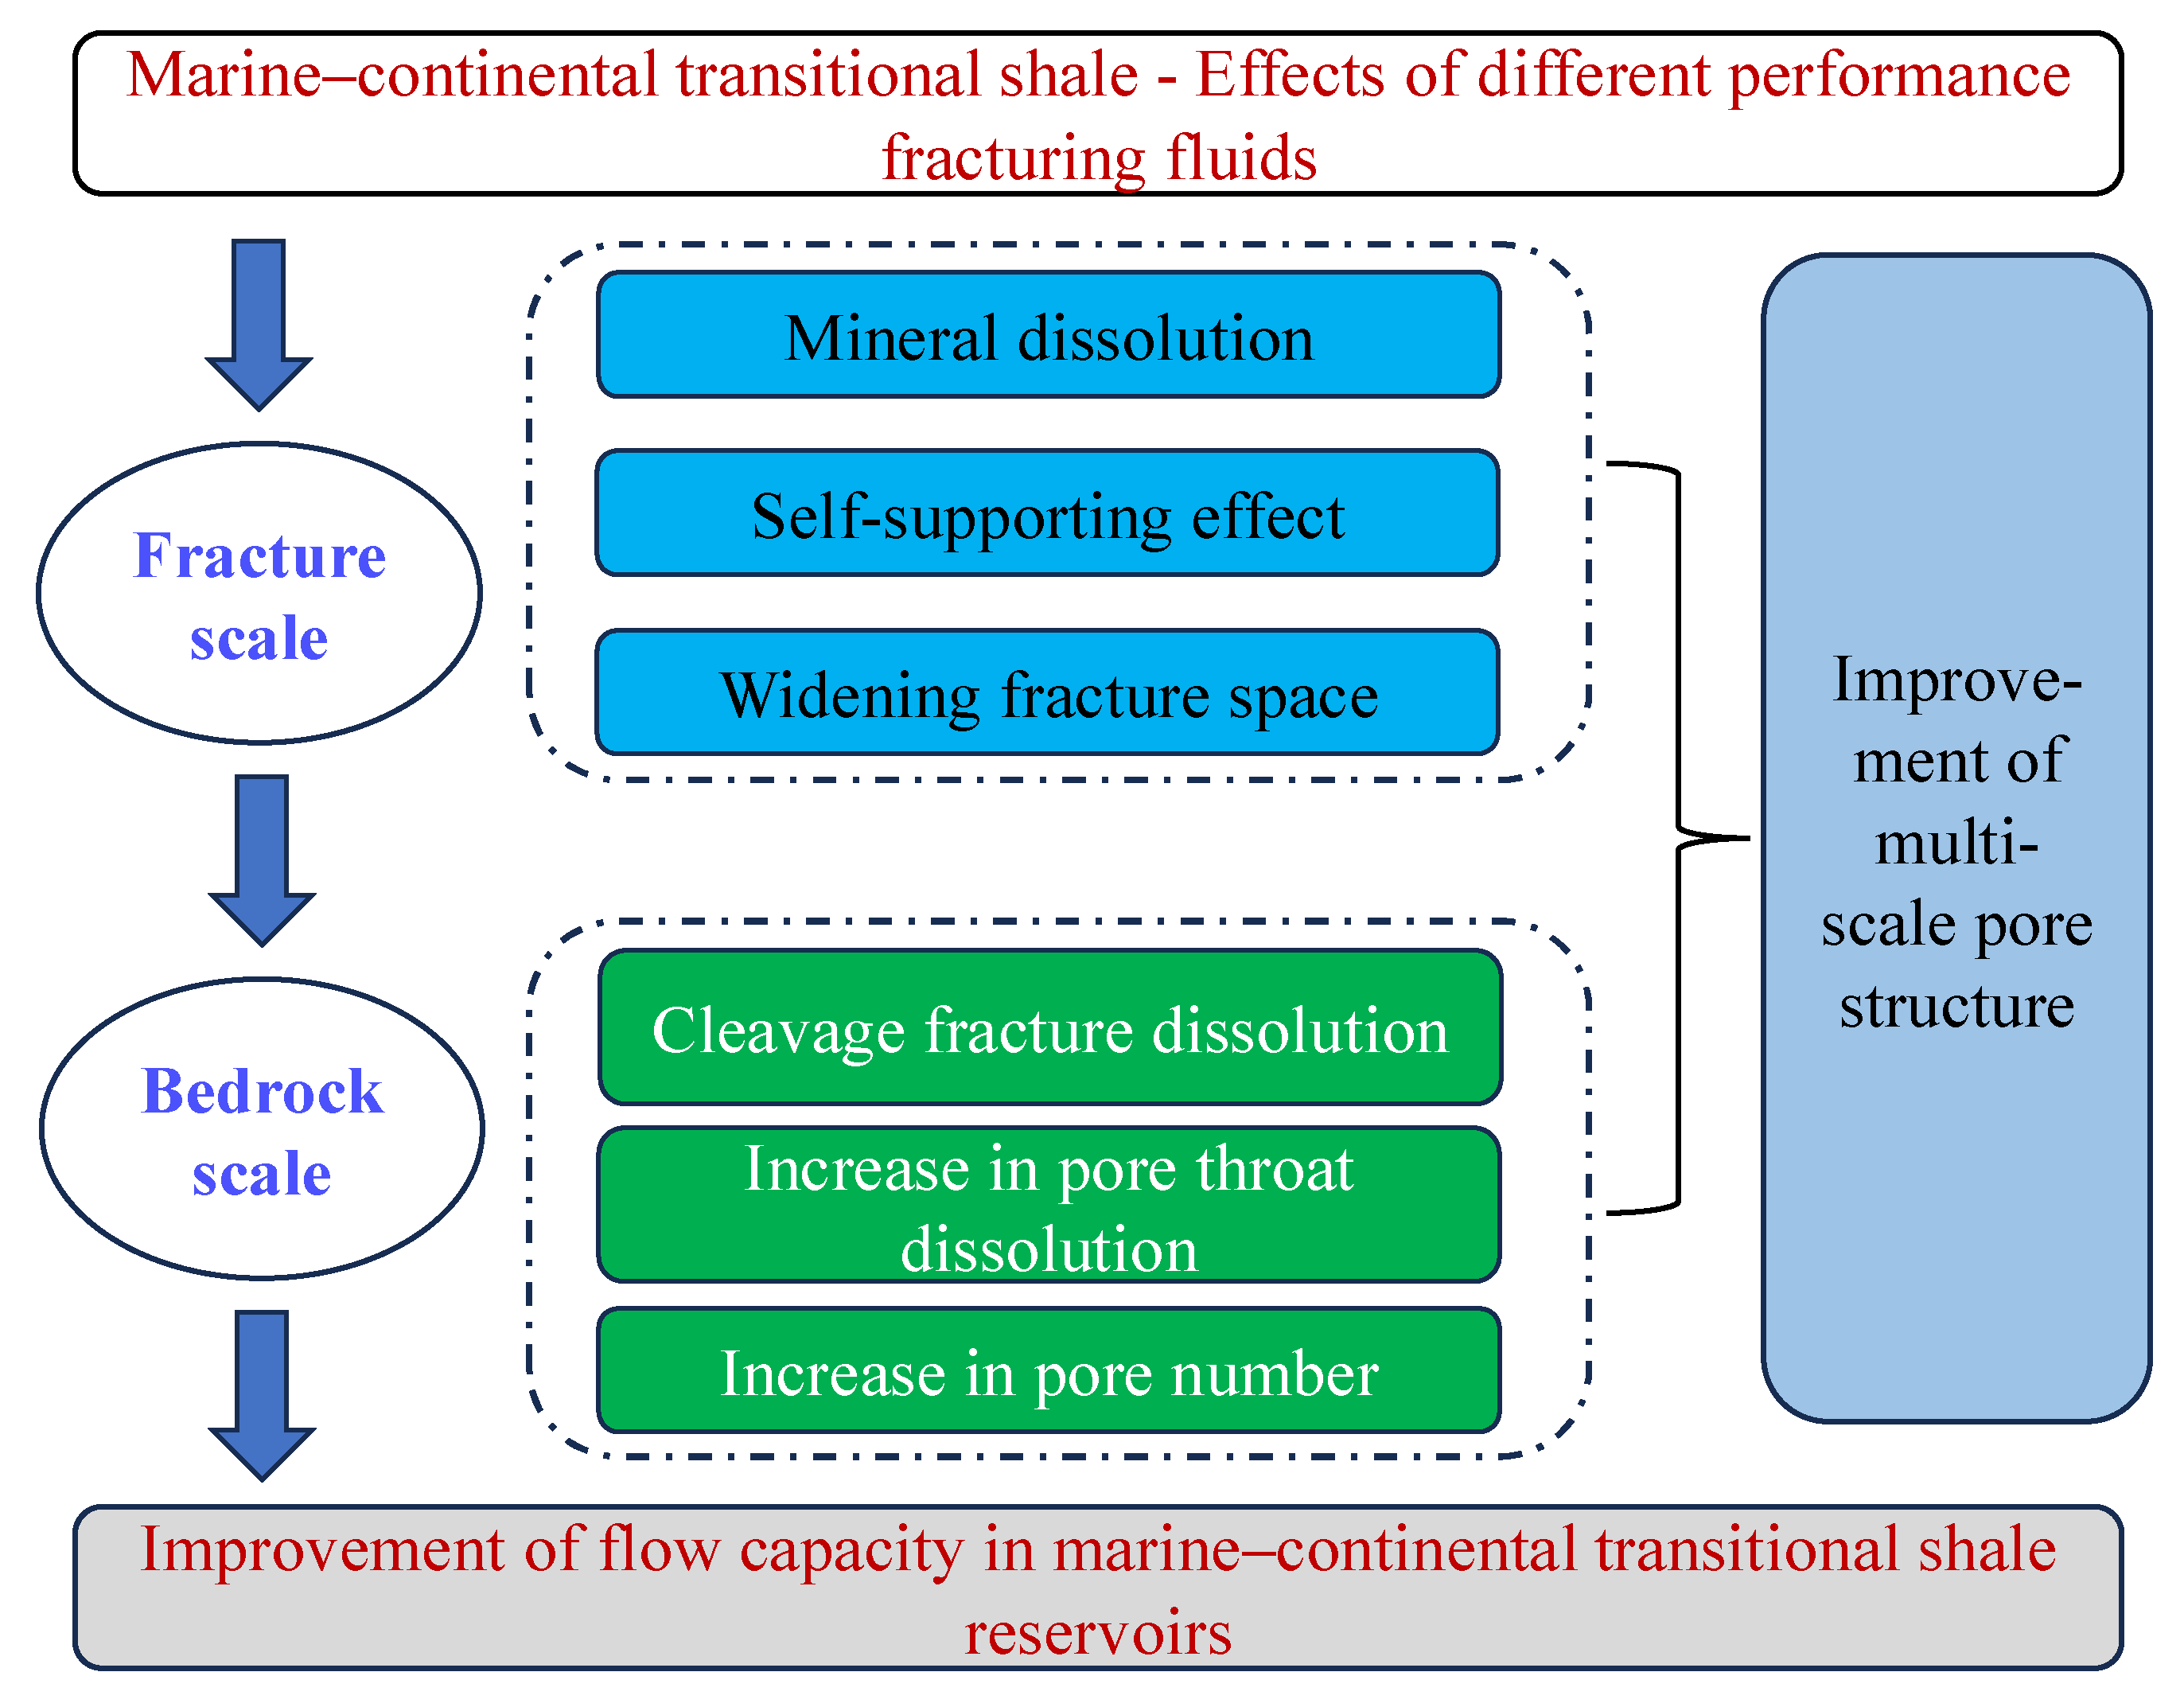
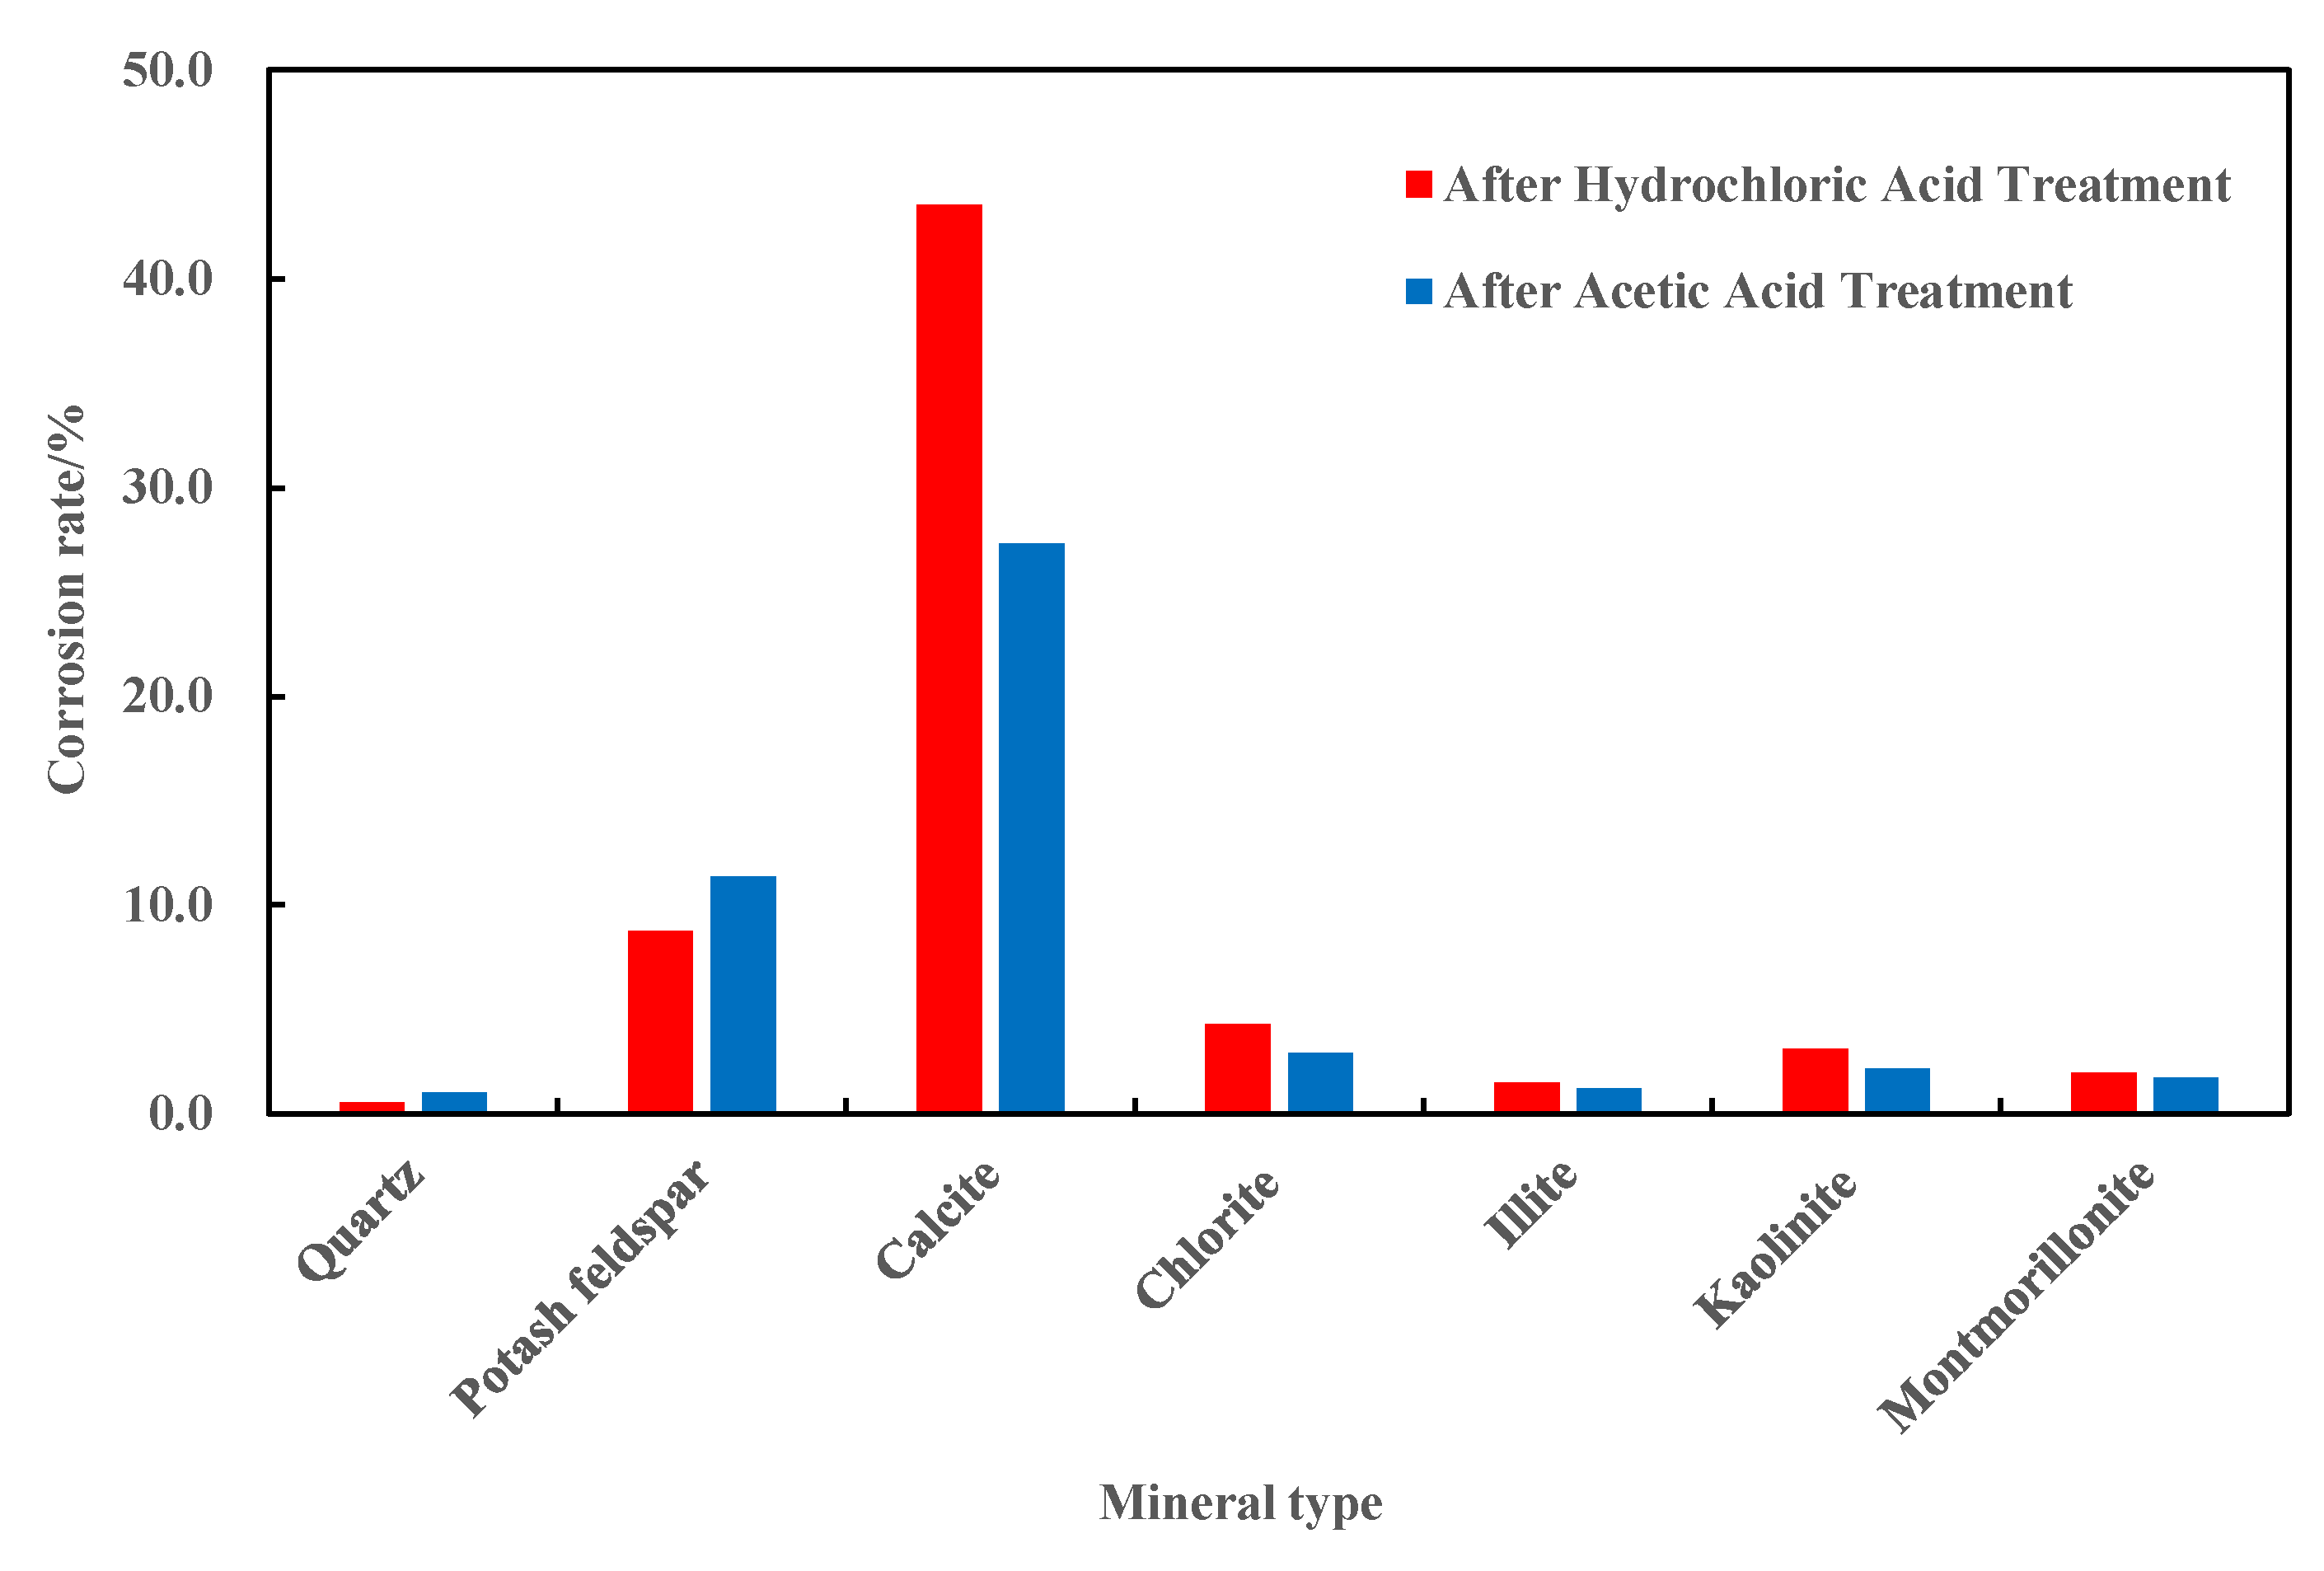
Figure 8) show that hydrochloric acid and organic acids exhibit significant selective dissolution effects. The minerals dissolved are mainly calcite and potassium feldspar, with the dissolution strength in the following order: calcite > potassium feldspar > chlorite > kaolinite > montmorillonite > illite > quartz. Quartz shows the lowest dissolution rate, with potassium feldspar dissolving between 8.74% and 11.31%, and calcite dissolving between 27.19% and 43.36%. Hydrochloric acid is more effective than acetic acid in dissolution. Therefore, leveraging the chemical differences in mineral compositions, the selective dissolution of certain minerals can be strategically applied. This process helps expand fracture space in the reservoir, increases matrix porosity, promotes the self-supporting effect of fractures, maintains high flowability, and enhances the micro–nanopore structure to improve desorption and diffusion efficiency.
4.3. Suggestions for Field Application
To meet the reservoir protection requirements during fracturing fluid flowback and production in marine–continental transitional shale reservoirs, optimizing the performance parameters of fracturing fluids, developing additives, and improving the shut-in and flowback systems should be approached through an integrated “geology–engineering” and “drilling–fracturing” methodology. This approach will ensure full-process reservoir protection, contributing to cost reduction and efficiency improvements in the development of marine–continental transitional shale gas.
(1) During the production of marine–continental transitional shale gas wells, the combined use of preflush acids (primarily hydrochloric and organic acids) and sand fracturing technology effectively reduces formation fracture pressure. Additionally, the selective dissolution of certain minerals by the acid fluid facilitates the retention of minerals, such as quartz, as natural proppants, enhancing fracture conductivity and reducing the need for proppants. The synergistic application of hydrochloric acid and organic acids ensures an optimal acid dissolution rate, increases pore and fracture connectivity, improves fluid flowback rates, and promotes hydration-induced fracturing and gas adsorption replacement, thereby mitigating water-locking damage.
(2) Marine–continental transitional shale reservoirs exhibit considerable lithological heterogeneity, resulting in significant variations in the type and content of expansive and non-expansive clay minerals. By adjusting the salinity and cation concentration of the fracturing fluid, the fracture-inducing effects of non-expansive clays can be maximized, while the hydration expansion of expansive clay minerals is minimized. Furthermore, optimizing the gas well shut-in and flowback procedures enhances the fracturing fluid’s absorption and fracture-propagation capabilities, thereby increasing gas transport pathways. Maintaining the flowback pressure differential within an optimal range prevents excessive pressure differences, thereby reducing particle migration and accumulation, enhancing liquid flowback efficiency, and ensuring sustained high production in gas wells.
5. Conclusions and Suggestions
5.1. Conclusions
This study presents shale flowback experiments with fracturing fluids of varying properties, taking into account the multi-scale pore structure and mineral composition of marine–continental transitional shale. The experimental results offer a comprehensive representation of the evolution and mechanisms of shale permeability, providing theoretical insights for optimizing fracturing fluid design, improving flowback efficiency, and enhancing gas well productivity.
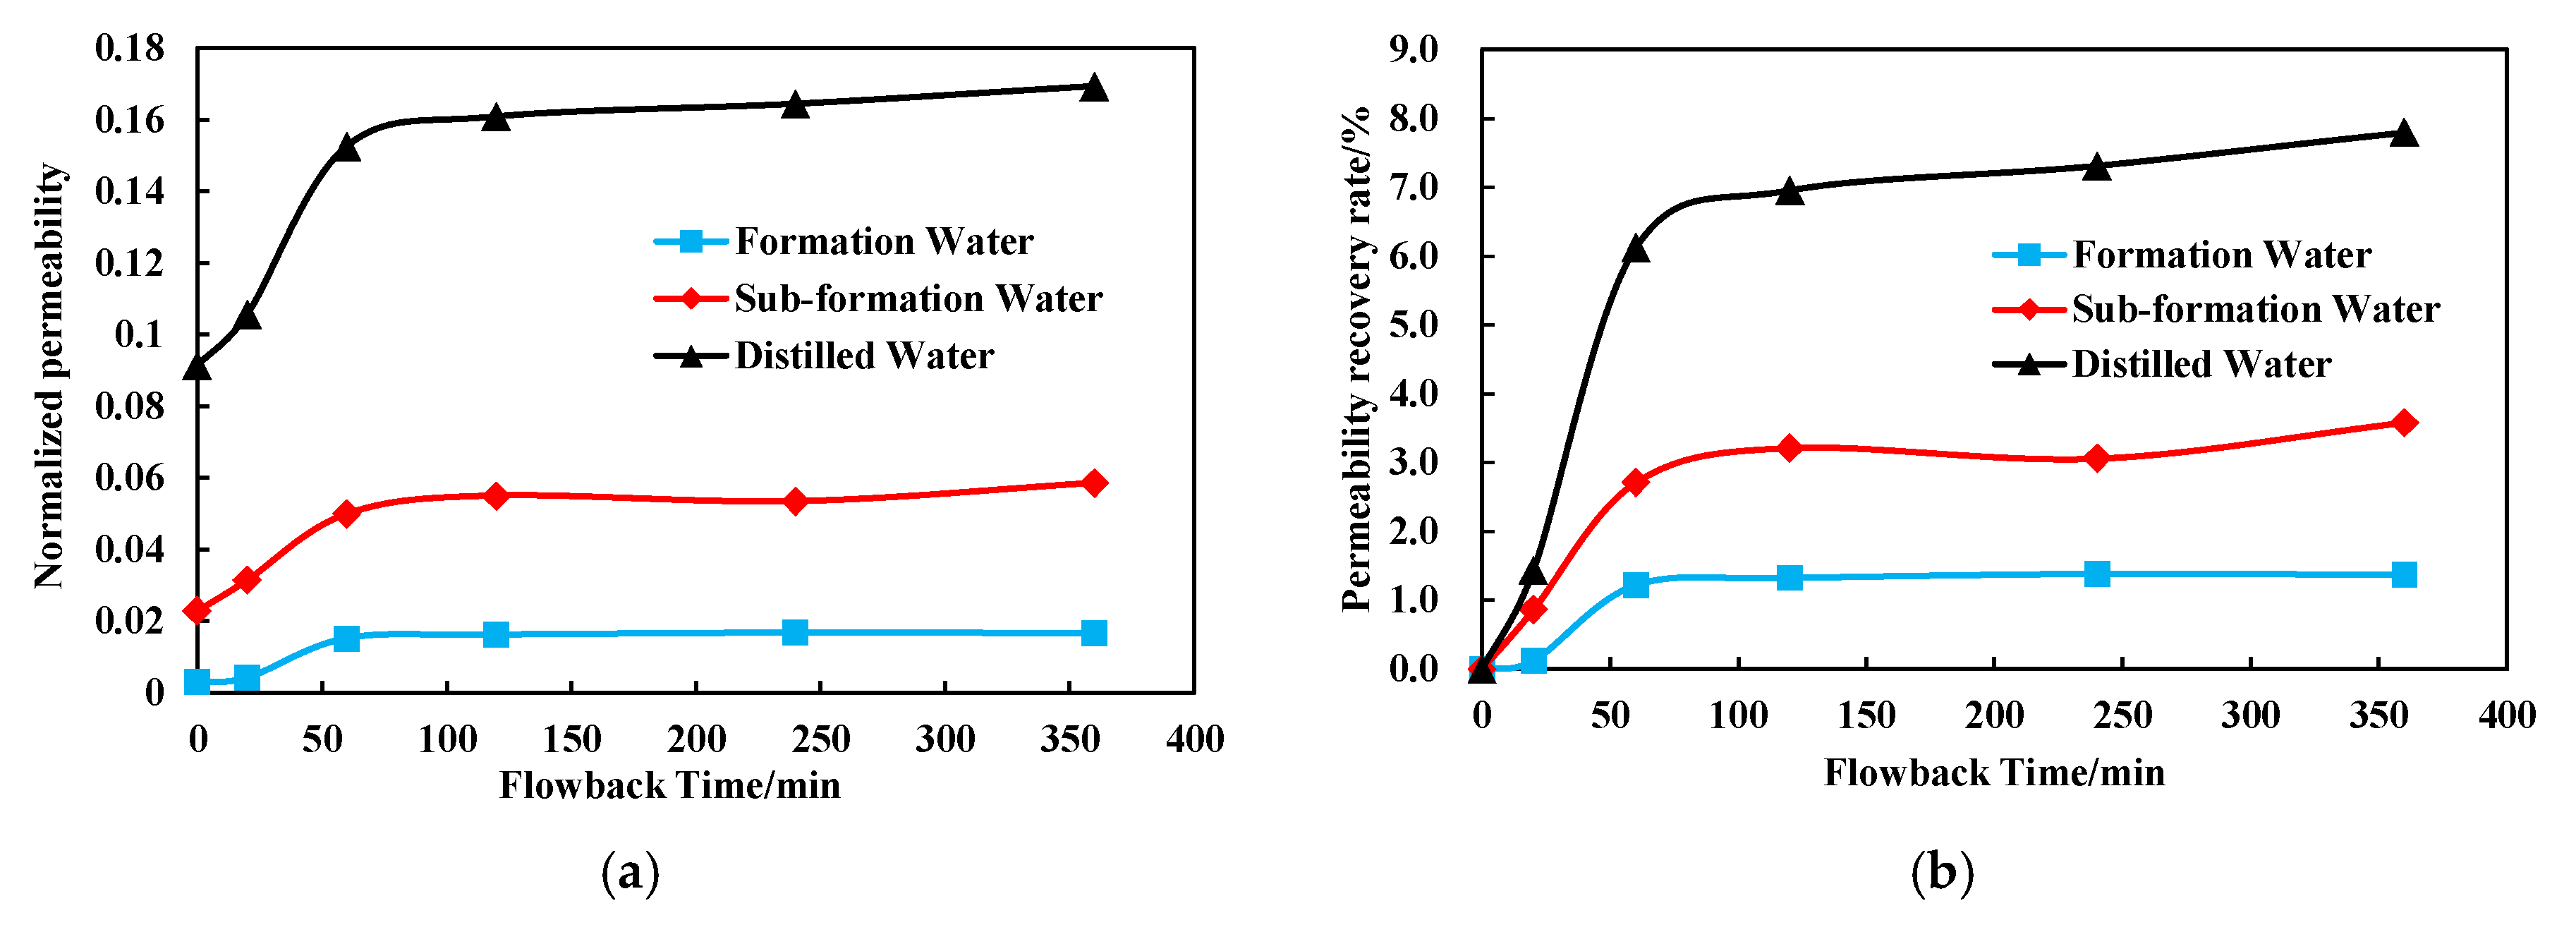
(1) Fracturing fluid performance parameters, such as mineralization and pH, are critical factors in evaluating flowback behavior in marine–continental transitional shale gas wells. The flowback rate of shale fracturing fluid decreases with a reduction in fluid mineralization; however, the corrosive effects of hydrochloric and organic acids can enhance the flowback rate by 16.42% to 22.25%.
(2) Low-mineralized fluids exhibit a dual effect on shale clay minerals. Hydration of non-swelling clay minerals promotes fracture extension and expansion, leading to an increase in pore volume from 0.003 cm3/g to 0.0037 cm3/g. In contrast, the hydration of swelling clay minerals tends to cause pore throat blockage, resulting in water-sensitive damage. This exacerbates both rate-sensitive and stress-sensitive damage, potentially reducing shale permeability by 31.15% to 99.96%.
(3) In the development of marine–continental transitional shale gas reservoirs, it is crucial to devise reservoir protection strategies that balance the fracture-inducing effects of clay mineral hydration expansion with the need to minimize water-sensitive damage. The combined use of preflush acids, primarily hydrochloric and organic acids, along with sand fracturing technology, enhances the connectivity of shale pores and fractures, thereby improving fracture conductivity and increasing flowback efficiency.
(4) Optimizing the well shut-in schedule enhances the capillary imbibition and fracture-promoting effects of the fracturing fluid, thereby increasing gas transport pathways and improving gas well productivity. By controlling the flowback pressure differential within an optimal range, excessive particle migration and accumulation can be prevented, thereby reducing liquid-phase flowback capacity and ensuring sustained high gas well production.
5.2. Suggestions
Based on the experimental results and the existing limitations in this study, the following suggestions are proposed:
Investigation of wettability after water–rock interaction: Water–rock interaction induces dynamic evolution of the shale pore structure under fracturing fluid infiltration. A quantitative evaluation of the changes in wettability after water–rock interaction and its impact on the fracturing fluid flowback rate is crucial for optimizing production schedules in shale gas wells, ensuring stable production.
Fracturing fluid flowback experimentation using nuclear magnetic resonance (NMR) technology: The multi-scale pore structure of shale is a key determinant of fracturing fluid retention and flowback efficiency. During the flowback process, the application of in situ NMR technology can quantitatively assess the impact of fracturing fluid performance parameters on different pore structures, offering practical insights for the efficient development of marine–continental transitional shale gas.


 ,
, 

