Article

An Untargeted Gas Chromatography–Ion Mobility Spectrometry Approach for the Geographical Origin Evaluation of Dehydrated Apples

by
Giuseppe Sammarco
1,2,
Chiara Dall’Asta
2 and
Michele Suman
1,3,*
1
Advanced Laboratory Research, Barilla G. e R. Fratelli S.p.A., 43122 Parma, Italy
2
Department of Food and Drug, University of Parma, 43122 Parma, Italy
3
Department for Sustainable Food Process, Catholic University Sacred Heart, 29122 Piacenza, Italy
*
Author to whom correspondence should be addressed.
Processes 2025, 13(5), 1373; https://doi.org/10.3390/pr13051373
Submission received: 20 November 2024 / Revised: 7 March 2025 / Accepted: 3 April 2025 / Published: 30 April 2025

Abstract

:
Gas chromatography–ion mobility spectrometry (GC-IMS) is an interesting candidate to face geographical origin declaration fraud in dehydrated apple samples. It allows the collection of the peculiar fingerprints of the analysed samples with the bi-dimensional separation of volatile molecules, based on their polarity and their dimension and shape. It represents a rapid, cost-effective, and sensitive solution for food authenticity issues. A design of experiment (DoE) led to robust sampling, taking into account different factors, such as harvesting year, the presence of peel, variety. The sample preparation was limited as it required only the milling of the dehydrated apple dices before the analysis. The GC-IMS analytical method permitted us to obtain of a 3D graph in 11 min, and the multivariate statistical analysis returned a clear separation between Italian and non-Italian (French, Chinese, Hungarian, Polish) samples, considering both unsupervised and supervised approaches. The statistical model, created employing a training set, was applied on a further test set, with a good overall performance. Thus, GC-IMS could play a relevant role as a tool to prevent/fight false origin declaration frauds and also, potentially, other kinds of food authenticity and safety frauds.

1. Introduction

Food quality and safety currently represent important aspects for food companies. Quality is directly related to the variety and the geographical origin of commodities. Each cultivar is indeed characterised by a composition profile that is affected by climate, soil, and agricultural practices and so by geographical origin. Variety and origin could be impactful on the commercial price of food [1]. In the European Union (EU), the apple (Malus x domestica Borkh.) is one of the most important fruits as a harvested product. In 2021, Italy ranked sixth as an apple-producing country and second as an apple exporter [2,3]. Besides their huge amount, the quality of Italian apples is guaranteed by a set of EU geographical indications (GIs). In 2003, apples from Val di Non gained the Protected Designation of Origin (PDO) label, while ones from South Tyrol and Valtellina received the Protected Geographical Indication (PGI) label, in 2005 and 2010, respectively [4]. This contributed to the higher price of Italian products, compared to those of other big producers, such as China, Chile, France, Hungary, and Poland [5]. This could lead suppliers to economically driven authenticity fraud, by blending apples from different areas and selling them as food ‘Made in Italy’. As regards the geographical origin assessment of the fresh matrix, Li et al. employed near-infrared (NIR) spectroscopy, coupled with principal component analysis (PCA), as a multivariate statistical tool and successive projection algorithm (SPA) for variable selection [6]. The NIR spectroscopy technique was also adopted by Schmutzler and Huck, who employed a novel automated surface scanning technique, which allowed the authors to lower prediction errors with Partial Least-Squares (PLS) regression, and successful multivariate clustering was achieved with the PCA [7]. Another relevant analytical strategy performed for authenticity studies is the use of the multi-isotopic ratio. A multi-element and multi-isotope approach aimed at the characterisation of PDO and PGI apples grown in northern Italy. This allowed the authors to classify samples based on their cultivation area, applying linear discriminant analysis (LDA), whose outputs demonstrated a successful sample classification; even a regional classification was achieved, due to variable selection [4]. A comprehensive study on the geographical origin of Slovenian apples took into account different approaches, multi-element analysis, multi-isotopic ratios (carbon, nitrogen, oxygen, hydrogen), and selected chemical and physical properties (fruit mass, antioxidant activity, ascorbic acid content, and total phenols). A good separation was reached thanks to the δ 18O and δ D values in water and the concentration of Rb and S in fruit juice [8]. Some works have focused on apple-based products’ geographical origin, mainly apple juice. Guo et al. exploited headspace solid-phase microextraction coupled with gas chromatography (HS-SPME-GC) to develop a geographical discrimination model according to the volatile profile of apple juice samples. Then, the compounds selected by this model were identified through gas chromatography–mass spectrometry (GC-MS) [9]. Another apple-based commodity commonly employed by food companies for several products is dehydrated apple cubes/slices, but, to the best of the authors’ knowledge, there is a lack of scientific works about the food authenticity and/or geographical origin assessment of this matrix.
One innovative, rapid, direct, and cost-effective technique that could be potentially useful for provenience discrimination is gas chromatography–ion mobility spectrometry (GC-IMS). This analytical strategy combines double separation by the gas chromatography and the ion mobility systems, permitting the detection of the volatile fingerprints of solid and liquid samples, with a limited or even inexistent sample pre-treatment. Furthermore, this technology improves analysis dimensionality, by interfacing analytical selectivity from high-resolution chromatographic separation with the analytical selectivity of IMS, which has a limit of detection (LOD) range from 0.2 µg m−3 to 2 mg m−3 [10]. Besides other applications, this approach has also been employed for food authenticity studies, focusing on geographical origin assessment. Gerhardt et al. evaluated the botanical origin of honey samples, combining resolution-optimised HS-GC-IMS with chemometric analysis, PCA, LDA, and the k-nearest neighbour (kNN) method, also demonstrating, by comparing the PCA-LDA models, the complementarity of the technique with the NMR-based profiling of honey samples [11]. Olive oil is another matrix whose geographical origin was assessed by GC-IMS. The technology was compared to the conventional isothermal capillary column (CC)-IMS system in the geographical differentiation of extra-virgin olive oil (EVOO) from Italy and Spain. GC-IMS provided superior resolving power for the non-targeted profiling of VOC fractions in a complex matrix like EVOO [12]. Subsequently, GC-IMS data were also fused with Fourier transform mid-infrared (FT-MIR) data for the authentication of olive oil and honey samples. Data fusion turned out to be an effective strategy for improving the classification performance of both techniques [13]. The technology was also recently employed for the provenience evaluation of less common commodities, such as the Molixiang grape and Sichuan pepper (Huajiao) [14,15]. The GC-IMS technology could be a relevant interface between academic and industrial contexts. It represents a fast, cost-effective, and easy-to-use strategy, preserving remarkable sensitivity. In terms of costs, in comparing this new technique with the conventional GC-MS used for volatile analyses in quality control laboratories, according to the G.A.S. Dortmund data, GC-IMS Flavourspec is cheaper than the GC-MS instrument (EUR 60k vs. EUR 75–150K). In addition, consumables and maintenance for GC-IMS analysis require less expense than those for GC-MS. Helium for GC-MS costs 50 EUR/month, whereas nitrogen can be supplied by a generator (ca. EUR 12k) for GC-IMS. Annual maintenance for GC-MS is approx. 4–5k EUR/year, and that for a vacuum pump is about EUR 10k every 5 years. GC-IMS technology only requires EUR 2k every two years, and it has no vacuum pump. Concerning the user-friendliness of this innovative technology, the sample preparation is limited or even inexistent, the two-dimensional separation allows the user to obtain a fingerprint faster, in comparison with conventional GC-MS. Manual spot picking and molecule identification can be achieved by using unique software, and even inexpert users can be rapidly trained. Once an area is set and a statistical model is developed for a specific matrix to be analysed, it is possible to automatize the controls with any particular experienced personal required.
GC-IMS could be regarded as a valuable technique as it requires easier sample preparation, the method is faster and the output is easy to interpret, and it is possible to obtain insights on the molecular structure by comparing the signals with a molecular library. On the other hand, with this analytical approach, it is not possible to perform complete molecular identification as it is not possible to gain information such as molecular weight and fragmentation, as can be achieved with tandem MS. Moreover, molecules need to be volatile to be separated through GC; therefore, a range of compounds cannot be analysed. Thus, this application has advantages and limitations, but it might a be a relevant tool for fingerprinting and information on volatile marker compounds.
Therefore, companies are motivated in investing in this type of technology, as they can rapidly screen a good number of samples, without excessive costs related to high-resolution instruments, consumables, or particular expertise.
In this scenario, this study about the geographical assessment of Italian dehydrated apple samples reports a concrete application of the GC-IMS technique in an industrial environment.

2. Materials and Methods

2.1. Dehydration Process

According to the supplier’s indications, the dehydrated samples collected underwent the treatment indicated in Figure 1 (dehydration process technological scheme).
To avoid the fruit browning before the dehydration phase, a pre-cooking step was carried out, in order to inactivate the enzymes that are responsible for the browning phenomenon (blanching). The moisture rate went from 5% (low) to 10% (normal), and the drying process was achieved by employing a hot air flow for the fruit. It is the most suitable to dry cubes or slices.
Further details about the process can be summarised in the following aspects (considering that more deep details cannot be disclosed due to intellectual property and the confidential framework of the producer):
-
Single-process steps: (i) washing, (ii) calibration and selection, (iii) de-peeling/peeling, (iv) cubing, (v) drying, (vi) packaging.
-
Shape and size in typically applied cubing/dicing process: irregular cubes ranging from 5 mm to 12.5 mm.
-
Drying temperature: <40°.
-
Average duration of drying treatment: 6–36 h (dryers created “ad hoc” in company design).
-
Final humidity after drying: 3–25%.

2.2. Sampling

A design of experiment (DoE) was conducted to have robust dehydrated apple sampling. Different factors were considered, such as the dehydration rate, presence of peeling, harvesting year, and variety. The regions of interest selected were France, China, Hungary, Poland, and Italy as the main geographical targets, since the aim was to discriminate between Italian and non-Italian samples. A training set (n = 59) was employed to build a statistical model, which was subsequently applied to a test set (n = 12). For this set, samples from the 2022 harvesting campaign were picked, as well as samples from another location (Chile) and brought to a local Italian market. Tables S1 and S2 (Supplementary Materials) list the training and test sets, respectively, and their respective factors. The 2020 and 2021 samples were analysed in different periods and stored at 2–8 °C.

2.3. Sample Preparation

Ca. 10 g dehydrated apple cubes were initially minced with the knife mill Grindomix GM 200 (Retsch, Haan-Gruiten, Germany). Samples of 0.5 g were weighed in a 20 mL headspace vial and then incubated at 60 °C for 10 min. To evaluate the method’s repeatability, each sample was double-prepared and -injected.

2.4. Instrumental Parameters

The GC-IMS instrument (FlavourSpec®, G.A.S. Dortmund, Dortmund, Germany) was equipped with a syringe and the autosampler PAL3-RSI Series II (CTC Analytics AG, Zwingen, Switzerland) for the headspace injection mode. The injection volume was 0.5 mL, and both the syringe and the injector port were at 80 °C. The chromatographic separation step was achieved with an FS-SE-54-CB-0.5 GC column (30 m length, internal diameter of 0.32 mm, film thickness of 0.5 μm), which was kept at 40 °C. Nitrogen was employed as a carrier gas. The separation was performed without a thermal ramp (isothermal conditions), while a flow ramp was adopted. The programme started at 2 mL min−1 for 5 min, and then the flow was brought to 31 mL min−1 for 4 min and then to 100 mL min−1 for 20 s; it was kept at this value for the last 2 min, for a total GC runtime of 11 min. The elute was then conveyed to the drift tube for the ion mobility separation step. Both the drift tube flow and temperature were kept constant, at 150 mL min−1 and 45 °C, respectively. The carrier gas was nitrogen, the tube length was 9.8 cm, and the drift voltage and time were 5 kV and 30 ms, with a positive ionisation mode.

2.5. Data Elaboration

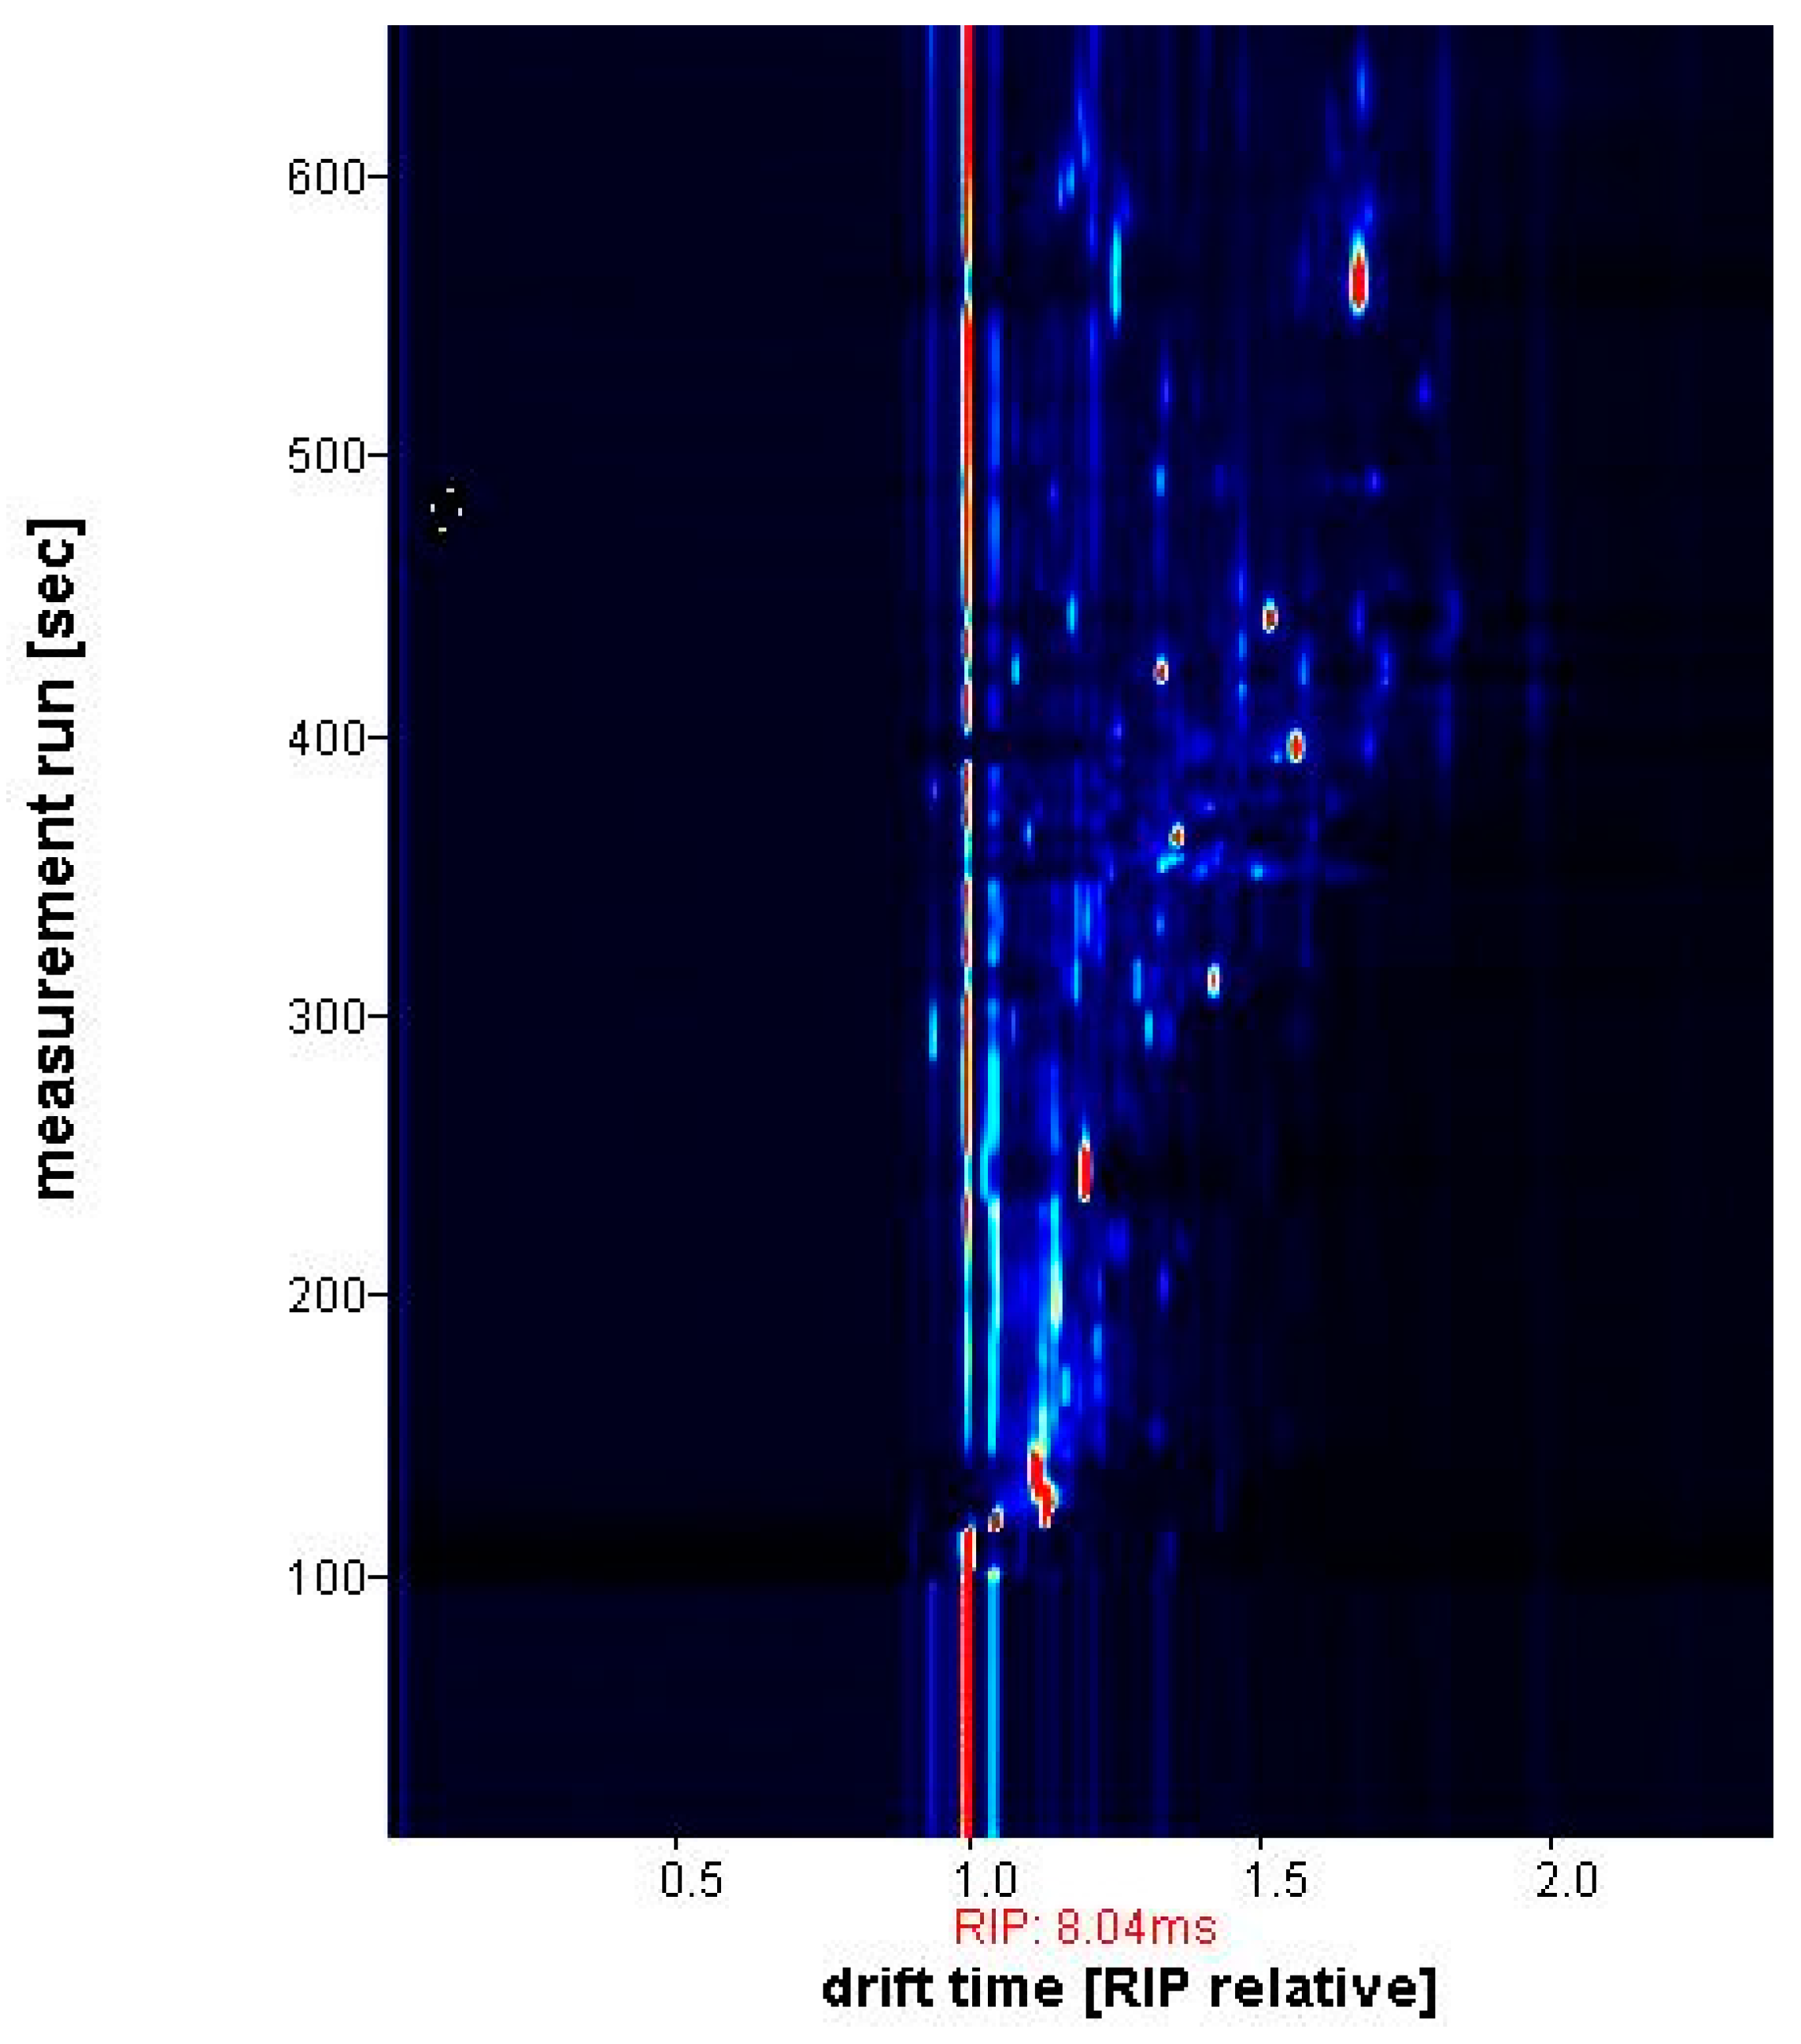
The output of the GC-IMS analysis was a 3D chromatogram; the y-axis represented the GC retention time, the x-axis was for the IM drift time, and the z-axis retuned the detector response so represented the signal intensity. To facilitate the graphical visualisation, a heat map with 2D fingerprint representation was ideal; 3D-2D conversion was carried out by transforming the z-axis into a colour signature for each spot. Therefore, the higher the response was, the more coloured the spot was [16]. An example of a dehydrated apple sample GC-IMS 2D heat map is shown in Figure 2.
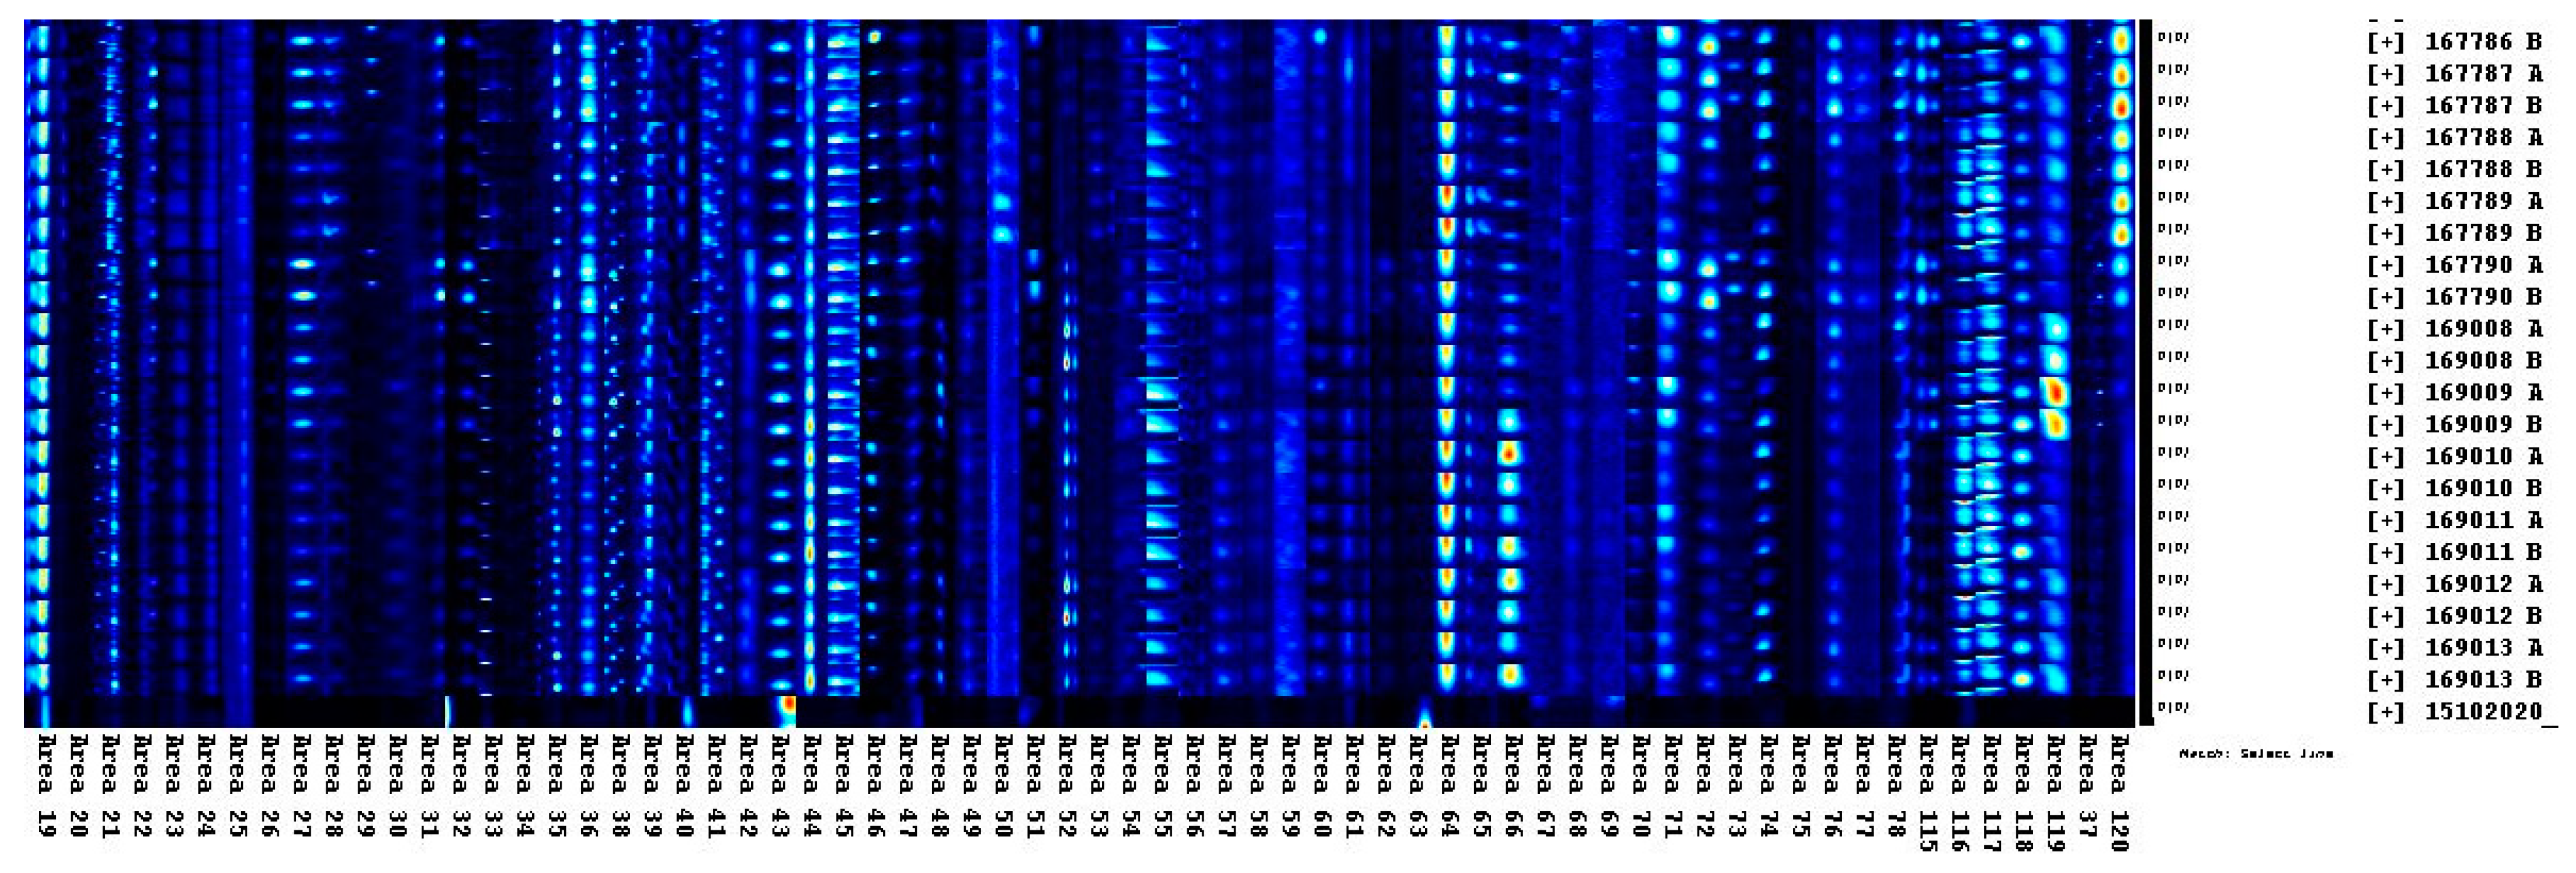
A manual area set was created through the VOCal software (version 0.1.3—G.A.S. Dortmund, Dortmund, Germany), picking all the visible spots on the heat map, and considering all the samples of the study, from both training and test sets. Table S3 reports all the area-set integration parameters.
This list of spots/areas could be visualised using a VOCal software module, named “Galerie”. The module allowed us to observe all the areas selected for the project, as also shown in Figure 3.
From this plot, spectra were exported to an Excel spreadsheet, and this generated matrix was processed by SIMCA software (Version 16.0.1, Umetrics, Umea, Sweden). For the statistical analysis and the model setup, the spectra were aligned according to the Reactant ion Peak (RIP) position, the red line in Figure 2 at the 1.0 ms drift time.

3. Results and Discussion

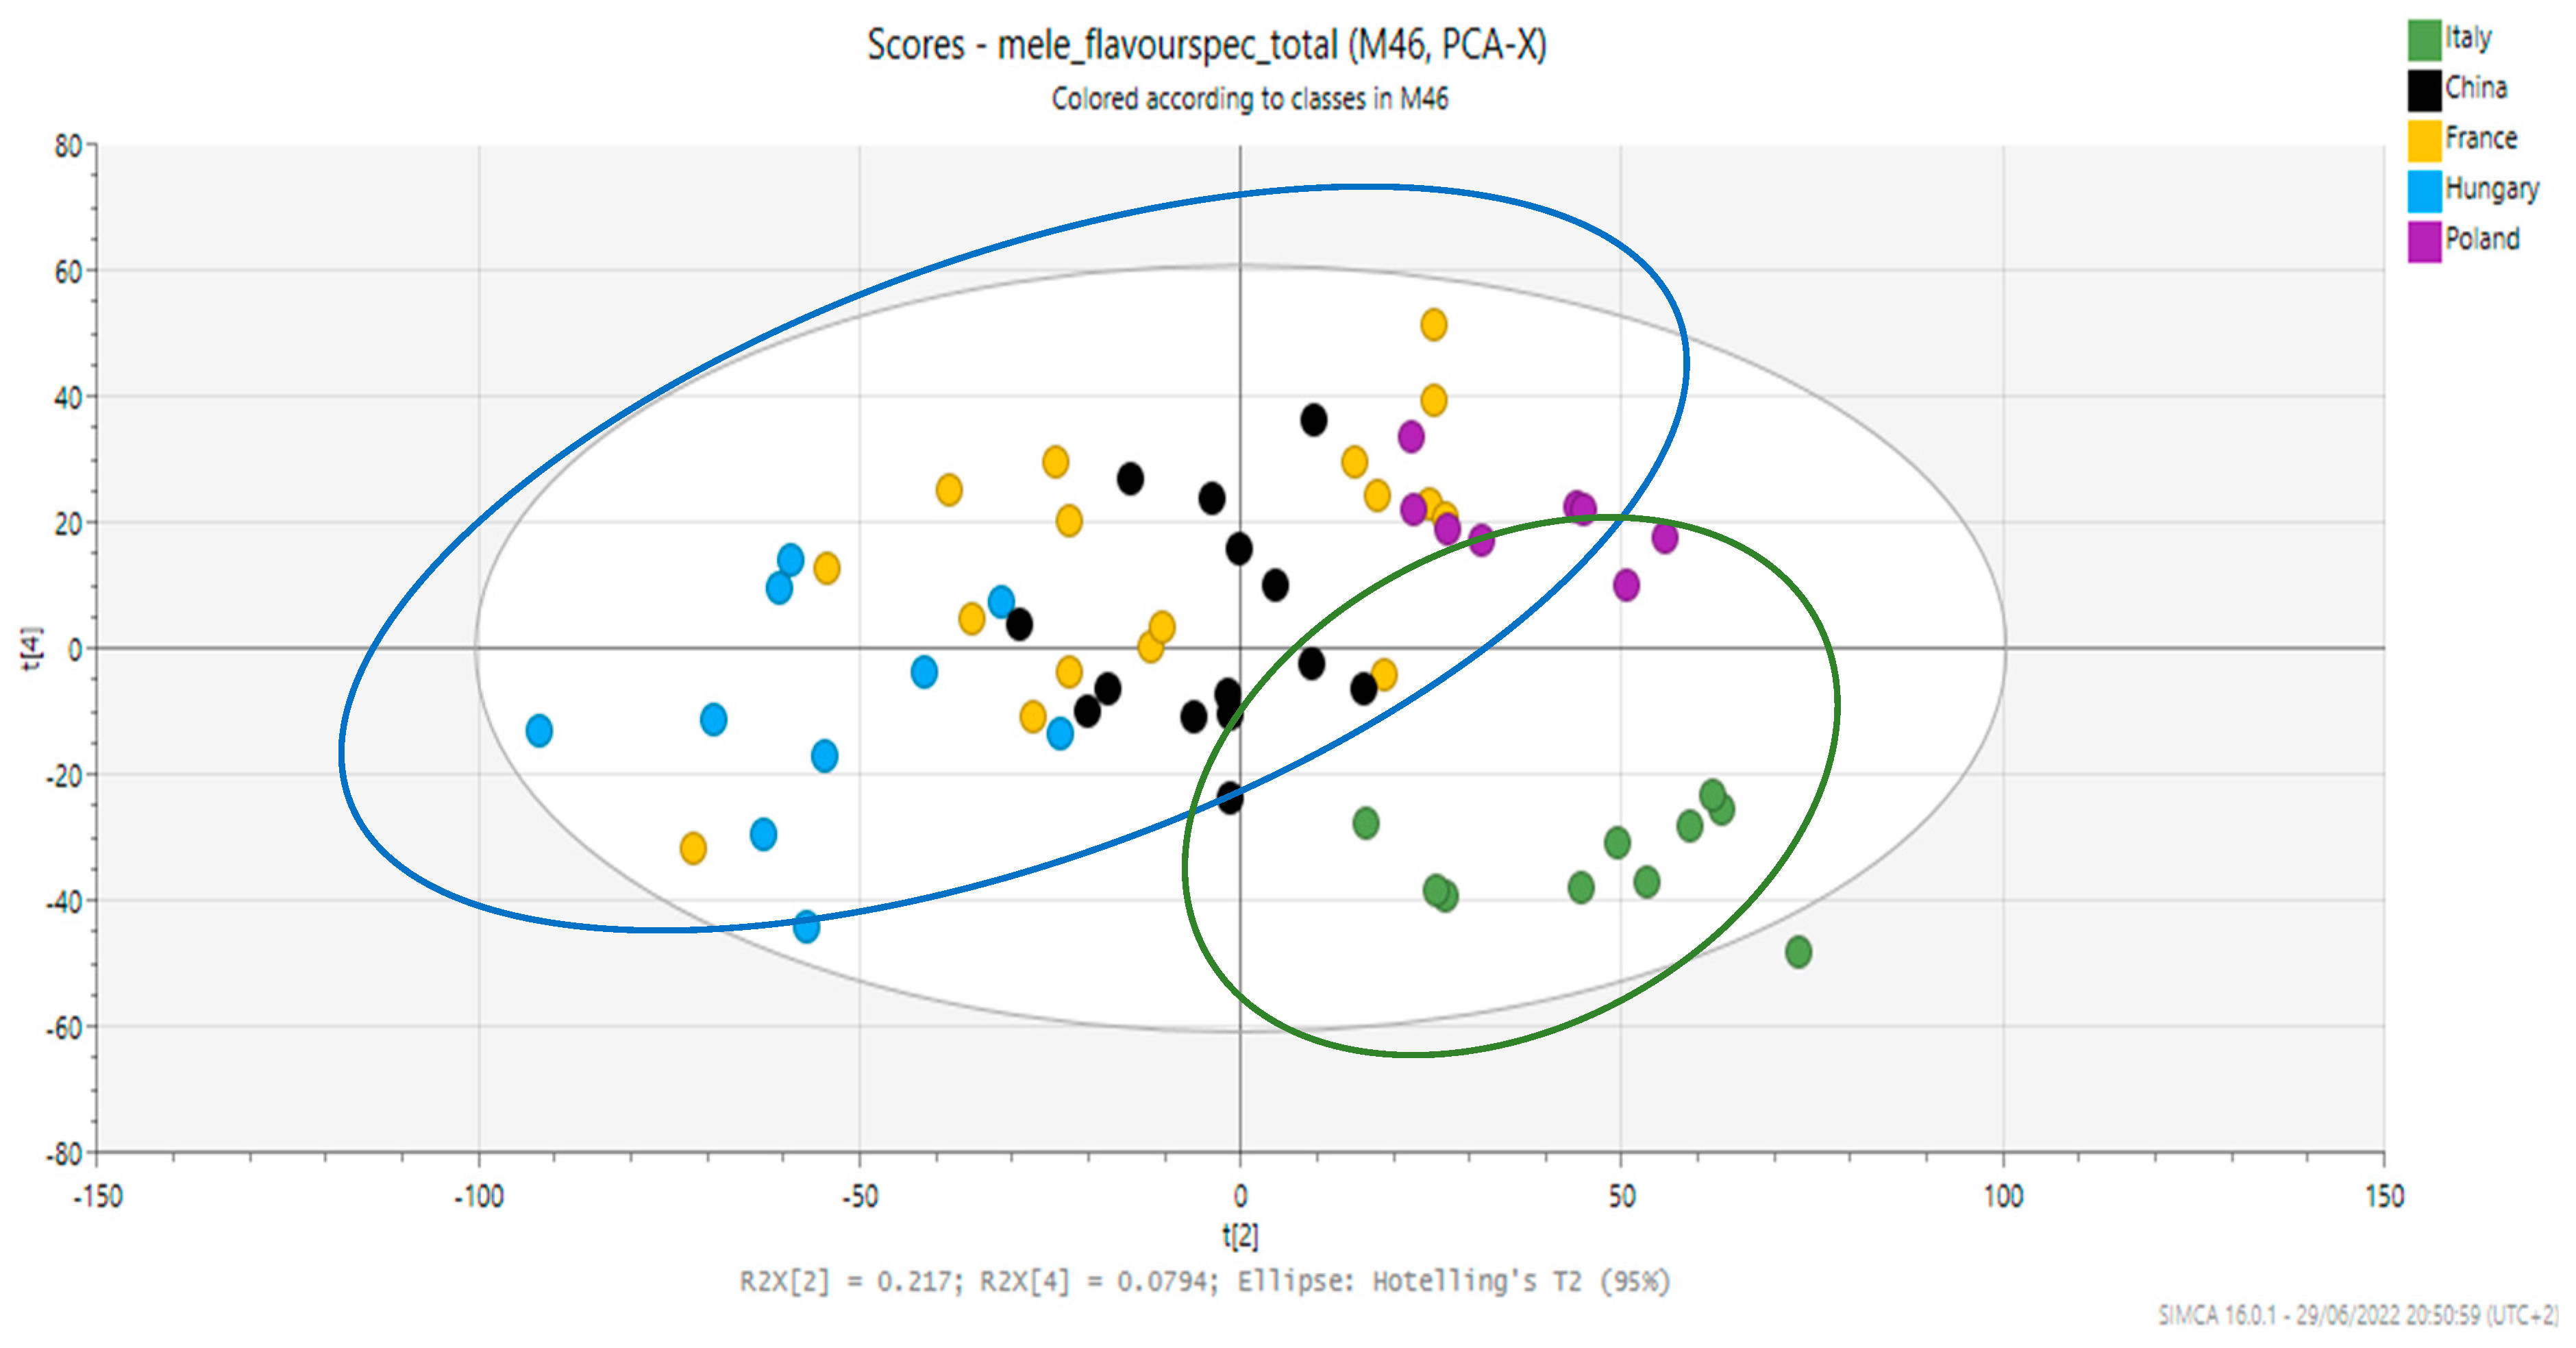
The data matrix obtained from the GC-IMS analysis contained a large number of variables; hence, multivariate statistical analysis was a valuable tool to handle and elaborate it. The workflow adopted provided for the PCA to preliminarily visualise the class clustering and evaluate the data dispersion. Figure 4 shows the PCA score plot, which highlights a good separation between Italian and non-Italian samples, considering the second and the fourth principal components. The first and the third mainly divided the samples according to the harvesting year rather than the origin; for this reason, the others were exploited. Year variability was a bigger driver of the statistical model, as it is highly probable that the VOC profile of the apple varieties varied more from year to year than according to the geographical origin of them. This is the reason why PC 1 and 2 led to clusterisation based on the harvesting year, whereas PC 2 and 4 explained the geographical origin-based separation. The explained variance is a statistical indication of how much variation in a dataset is attributed to each of the principal components created by PCA [17]. In this case, the overall explained variance was around 30%, and this pointed out data dispersion, mainly due to the relevant number of qualitative variables/DoE factors (dehydration rate, harvesting year, presence of peel, variety) related to the number of samples (59).
R2X is a coefficient that measures the goodness of fit of a model to real data, and its value is from 0 to 1 [18]. In this model, the coefficient was 0.779, highlighting a valuable goodness of fit, despite the abovementioned data dispersion. The main aim of PCA is to reduce data dimensionality, in order to make visualisation possible on a 2D plot and to extract features. It is an unsupervised method, as it does not label classes, so observations are placed on a plot only according to the variables that drive their position [19]. Supervised analysis, such as PLS-DA, by labelling groups, allows the achievement of good clusterisation, decreasing data dispersion. Figure 5 shows the PLS-DA score plot, underlining better class separation, even though it is possible to discern only between Italian vs. non-Italian groups.
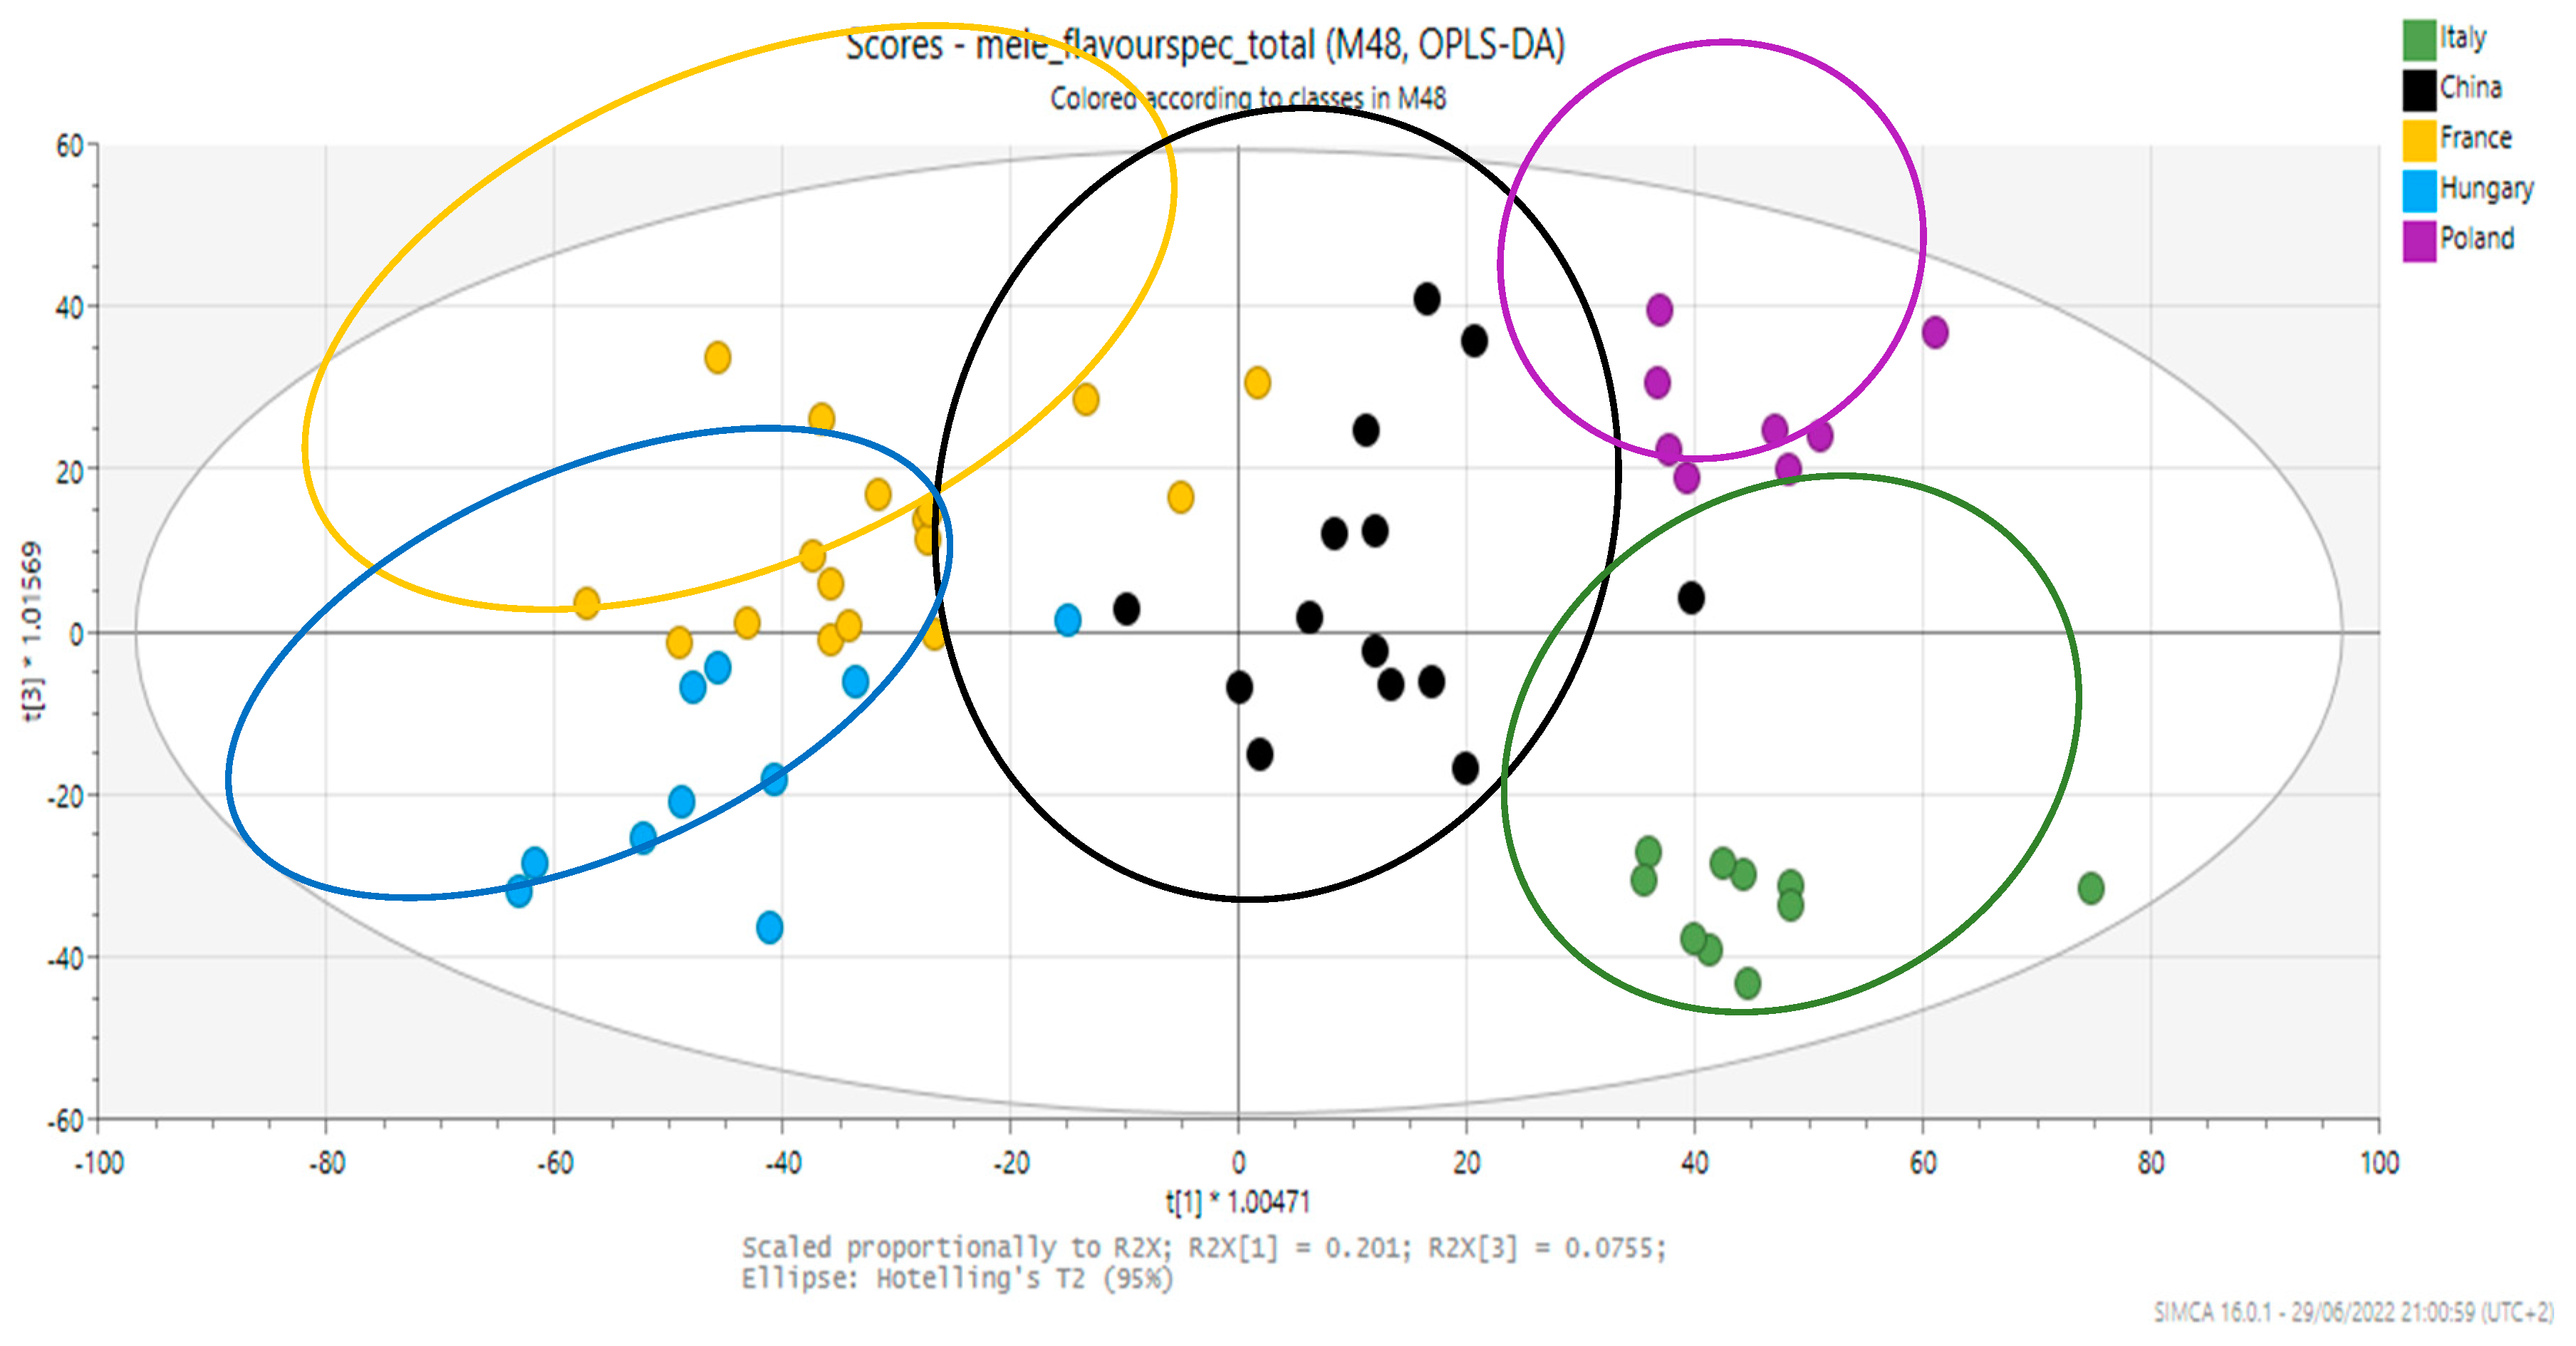
For the supervised models, another parameter had to be considered, Q2, related to the goodness of prediction or predicted variation [20]. R2 is for when a PLS built on a training set is applied to a test set. In this model, R2 was 0.716 and Q2 was 0.566. The last model applied was the Orthogonal PLS-DA (OPLS-DA), which combines Orthogonal Signal Correction (OSC) and PLS-DA. OSC removes the info from the X-block (independent variables), orthogonal to the Y-block (dependent variables) [21]. Figure 6 shows the OPLS-DA score plot, where it is possible to see a multi-class separation.
Figure 7 reports the loading plot related to the last OPLS-DA score plot. A loading plot indicates which variables are mainly involved in the separation of a class sample. In this study, the areas that drove the Italian samples’ clustering were distributed throughout the spectra (Area 1, 3, 6, 8, 37, 52, 64, 116, 117, 118, 120). Thus, no specific class of compounds was considered. The low resolution of the GC-IMS facility did not allow the authors to identify particular markers, so it was employed for an untargeted fingerprinting approach. The method developed could be applied to high-resolution techniques that permit volatile compounds’ identification, such as GC-HRMS.
Therefore, with the PCA, there was a preliminary visualisation of how the observations started to become clustered; then, the separation became finer with the supervised PLS-DA, and the OPLS-DA permitted us to discriminate even among all the geographical locations considered. In this last model, R2 was 0.764, while Q2 was 0.593. Since these models, with the class labelling and the OSC, could have forced the separation, their goodness was evaluated through a permutation test. It allowed for permuting (randomly assigning) the data to the classes, and the model was then run again. Permutation can bring about a wrong class assignment; hence, R2(cum) and Q2(cum) should be lower than the original model values [22]. Figure 8 reports the permutation plot obtained from the test to assess the OPLS-DA model goodness.
The R2 and Q2 values were, respectively, (0.0, 0.201) and (0.0, −0.418). This result confirms the validity of the supervised model, as the parameters from the permutation were considerably lower than the ones from the original model. Finally, a misclassification table was created as well. It consisted of applying the model, built on the training set, to a prediction set, to assess its accuracy. In this study, 17 samples were extracted from the training set and used as a prediction set. Only one sample was misclassified between the French and Hungarian classes, and an accuracy score of 94.12% for the supervised model was obtained. (Table 1)
To further assess the robustness of the predictive model, and also its applicability in a real situation, a test set was analysed. The workflow adopted was the same for the training set, as well as the manual area set and the matrix export (the samples were analysed in duplicate). Besides Italian samples from the 2022 campaign, some other Hungarian samples from the 2021 crop were included, and samples from a different region, Chile, were not considered in the training set. Thus, the test set was used as a prediction set but considered only the Italian and non-Italian classes. This was useful to simulate a real industrial approach, where a sample was analysed, and if it belonged to the Italian class, it was evaluated as authentic; otherwise, it was discarded or, eventually, analysed with a confirmatory/high-resolution technique. A classification list was constructed using the test set; it displayed the observations (sample IDs), the original dummy variables as YVarPS, which could range from 1 to 0, and the predicted dummy variables as YPredPS. From this value, it is possible to define the sample class [23]:
-
If <0.35: the samples did not belong to the class.
-
Between 0.35 and 0.65: the samples were borderline.
-
If >0.65: the samples belonged to the class.
In this study, only samples with a YPredPS greater than 0.65 were considered Italian. Table 2 reports the classification list outcomes, highlighting the interesting predictive ability of GC-IMS in this specific application.
All the Italian samples were correctly classified, whereas one replicate of a Chilean sample and two replicates of the same Hungarian sample were misclassified as Italian. A misclassification table was also created to evaluate the model accuracy score, which was around 78%. (Table 3) (A: first replicate, B: second replicate)
Six Chilean samples were assigned to the “No class” group. This could be due to the absence of Chilean samples in the training set; hence, it was reasonable to have borderline YPredPS values, without an authentic sample as a reference. This led to the “No class” group classification; it might have been intended as a “non-classified sample”, so it was not recognised by the trained model, as no sample like this was present in the training set. This means that it might have been considered non-Italian (this missed classification could be avoided by training the model with a higher number of samples and also including new classes). However, only three measurements were wrongly assigned, confirming the GC-IMS technology as a reliable analytical strategy for this type of matrix.

4. Conclusions

The present work describes the application of untargeted GC-IMS fingerprinting, a recent analytical approach, for the geographical origin evaluation of dehydrated apple samples. The developed method allowed us to obtain a relevant number of features, with good repeatability. The chemometric elaboration produced valuable results; Italian and non-Italian samples were well separated, employing both unsupervised and supervised models. The predictive ability was assessed using the training set and the test set as well, showing acceptable accuracy scores to screen samples for potentially further confirmatory analysis. A future follow-up study including a higher number of samples according to the number of variables and classes (i.e., 20 or more samples per class) might improve the statistical model by reducing the data dispersion. This strategy could be exploited at both industrial and academic levels, since it could be used for research purposes but also as a rapid and direct technique in routine laboratories or, potentially, online, directly in the production chain to discard anomalous samples, or to go deeper into other high-resolution approaches.

Supplementary Materials

The following supporting information can be downloaded at: https://www.mdpi.com/article/10.3390/pr13051373/s1, Table S1: Dehydrated apple samples training set, according to the DoE; Table S2: Dehydrated apple samples test set, according to the DoE.; Table S3. GC-IMS area set integration parameters.

Author Contributions

Conceptualization, M.S.; data curation, G.S. and M.S.; formal analysis, G.S.; investigation, G.S.; methodology, M.S., G.S., and C.D.; project administration, M.S.; supervision, M.S.; validation, G.S., M.S., and C.D.; writing—original draft, G.S.; writing—review and editing, G.S., M.S., and C.D. All authors have read and agreed to the published version of the manuscript.

Funding

This research received no external funding.

Informed Consent Statement

This article does not contain any studies with human participants or animals performed by any of the authors.

Data Availability Statement

The datasets generated during and/or analysed during the current study are available from the corresponding author on reasonable request.

Acknowledgments

The authors would like to strongly acknowledge Cooperativa Ortofrutticola Ve.Ba. Soc. Coop. Agricola (Ferrara, Italy), a leading company in the production of fruit and vegetable ingredients, for the fruitful collaboration and sample preparation/production within this entire project’s evolution and execution.

Conflicts of Interest

The authors declare no conflicts of interest.

References

  1. Feng, L.; Wu, B.; Zhu, S.; He, Y.; Zhang, C. Application of Visible/Infrared Spectroscopy and Hyperspectral Imaging with Machine Learning Techniques for Identifying Food Varieties and Geographical Origins. Front. Nutr. 2021, 8, 680357. [Google Scholar] [CrossRef] [PubMed]
  2. Atlas Big. World Apple Production by Country. 2021. Available online: https://au.atlasbig.com/countries-by-apple-production (accessed on 13 January 2023).
  3. World’s Top Exports. Apples Exports by Country Plus Average Prices. Top Exports. 2021. Available online: https://www.worldstopexports.com/apples-exports-by-country/ (accessed on 23 February 2021).
  4. Aguzzoni, A.; Bassi, M.; Pignotti, E.; Robatscher, P.; Scandellari, F.; Tirler, W.; Tagliavini, M. Sr isotope composition of Golden Delicious apples in Northern Italy reflects the soil 87Sr/86Sr ratio of the cultivation area. J. Sci. Food Agric. 2020, 100, 3666–3674. [Google Scholar] [CrossRef] [PubMed]
  5. Global Product Prices. Apples—Prices by Country, Around the World, June 2022. Available online: https://www.globalproductprices.com/rankings/apple_prices/ (accessed on 13 January 2023).
  6. Li, C.; Li, L.; Wu, Y.; Lu, M.; Yang, Y.; Li, L. Apple Variety Identification Using Near-Infrared Spectroscopy. J. Spectrosc. 2018, 2018, 6935197. [Google Scholar] [CrossRef]
  7. Schmutzler, M.; Huck, C. Automatic sample rotation for simultaneous determination of geographical origin and quality characteristics of apples based on near infrared spectroscopy (NIRS). Vib. Spectrosc. 2014, 72, 97–104. [Google Scholar] [CrossRef]
  8. Bat, K.; Vidrih, R.; Necemer, N.; Vodopivec, B.; Mulic, I.; Kump, P.; Ogrinc, N. Characterization of Slovenian Apples with Respect to Their Botanical and Geographical Origin and Agricultural Production Practice. Food Technol. Biotechnol. 2012, 50, 107–116. [Google Scholar]
  9. Guo, J.; Yue, T.; Yuan, Y. Feature selection and recognition from nonspecific volatile profiles for discrimination of apple juices according to variety and geographical origin. J. Food Sci. 2012, 77, 1090–1096. [Google Scholar] [CrossRef] [PubMed]
  10. Ruszkiewicz, D.; Myers, R.; Henderson, B.; Yusof, H.; Meister, A.; Moreno, S.; Thomas, C. Peppermint protocol: First results for gas chromatography-ion mobility spectrometry. J. Breath Res. 2022, 16, 036004. [Google Scholar] [CrossRef] [PubMed]
  11. Gerhardt, N.; Birkenmeier, M.; Schwolow, S.; Rohn, S.; Weller, P. Volatile-Compound Fingerprinting by Headspace-Gas-Chromatography Ion-Mobility Spectrometry (HS-GC-IMS) as a Benchtop Alternative to 1H NMR Profiling for Assessment of the Authenticity of Honey. Anal. Chem. 2018, 90, 1777–1785. [Google Scholar] [CrossRef] [PubMed]
  12. Gerhardt, N.; Birkenmeier, M.; Sanders, D.; Rohn, S.; Weller, P. Resolution-optimized headspace gas chromatography-ion mobility spectrometry (HS-GC-IMS) for non-targeted olive oil profiling. Anal. Bioanal. Chem. 2017, 409, 3933–3942. [Google Scholar] [CrossRef]
  13. Schwolow, S.; Gerhardt, N.; Rohn, S.; Weller, P. Data fusion of GC-IMS data and FT-MIR spectra for the authentication of olive oils and honeys—Is it worth to go the extra mile? Anal. Bioanal. Chem. 2019, 411, 6005–6019. [Google Scholar] [CrossRef] [PubMed]
  14. Feng, T.; Sun, J.; Song, S.; Wang, H.; Yao, L.; Sun, M.; Chen, D. Geographical differentiation of Molixiang table grapes grown in China based on volatile compounds analysis by HS-GC-IMS coupled with PCA and sensory evaluation of the grapes. Food Chem. X 2022, 15, 100423. [Google Scholar] [CrossRef]
  15. Feng, X.; Wang, H.; Wang, Z.; Huang, P.; Kan, J. Discrimination and characterization of the volatile organic compounds in eight kinds of huajiao with geographical indication of China using electronic nose, HS-GC-IMS and HS-SPME-GC–MS. Food Chem. 2022, 375, 131671. [Google Scholar] [CrossRef] [PubMed]
  16. Vera, L.; Companioni, E.; Meacham, A.; Gygax, H. Real Time Monitoring of VOC and Odours Based on GC-IMS at Wastewater Treatment Plants. Chem. Eng. Trans. 2016, 54, 79–84. [Google Scholar]
  17. Kumar, A. PCA Explained Variance Concepts with Python Example. 2023. Available online: https://vitalflux.com/pca-explained-variance-concept-python-example/ (accessed on 15 January 2023).
  18. Casella, G.; Berger, R.L. Statistical Inference, 2nd ed.; Duxbury/Thomson Learning: Pacific Groove, CA, USA, 2001. [Google Scholar]
  19. Ghojogh, B.; Crowley, M. Unsupervised and Supervised Principal Component Analysis: Tutorial. arXiv 2022, arXiv:1906.03148. [Google Scholar]
  20. Nepomuceno, G.; Cruz Junho, C.V.; Carneiro-Ramos, M.S.; da Silva Martinho, H. Partial Least Squares—Discriminant Analysis (PLS-DA); Scientific Reports; 2021; Available online: https://www.metabolon.com/bioinformatics/pls-da/ (accessed on 15 January 2023).
  21. Beckwith-Hall, B.M.; Brindle, J.T.; Barton, R.H.; Coen, M.; Holmes, E.; Nicholson, J.K.; Antti, H. Application of orthogonal signal correction to minimise the effects of physical and biological variation in high resolution 1H NMR spectra of biofluids. Analyst 2002, 10, 1283–1288. [Google Scholar] [CrossRef] [PubMed]
  22. Triba, M.N.; Le Moyec, L.; Amanthieu, R.; Goossens, C.; Bouchemal, N.; Nahon, P.; Savarin, P. PLS/OPLS models in metabolomics: The impact of permutation of dataset rows on the K-fold cross-validation quality parameters. Mol. BioSyst. 2015, 1, 13–19. [Google Scholar] [CrossRef] [PubMed]
  23. MKS Umetrics. Dynacentrix. 2015. Available online: https://www.dynacentrix.com/telecharg/SimcaP/SIMCA14_User_Guide.pdf (accessed on 15 January 2023).
Figure 1. Dehydration process technological scheme.
Processes 13 01373 g001
Figure 2. Two-dimensional GC-IMS chromatogram of dehydrated apple samples.
Processes 13 01373 g002
Figure 3. Part of the Galerie plot window, showing all the observation areas in all the samples of this project (A: first replicate, B: second replicate).
Processes 13 01373 g003
Figure 4. The PCA score plot of the dehydrated apple sample set. (Green dots: Italy; black dots: China; yellow dots: France; turquoise dots: Hungary; purple dots: Poland. Green group: Italian samples; turquoise group: non-Italian samples).
Processes 13 01373 g004
Figure 5. The PLS-DA score plot of the dehydrated apple sample set. (Green dots: Italy; black dots: China; yellow dots: France; turquoise dots: Hungary; purple dots: Poland. Green group: Italian samples; turquoise group: non-Italian samples).
Processes 13 01373 g005
Figure 6. The OPLS-DA score plot of the dehydrated apple sample set. (Green dots: Italy; black dots: China; yellow dots: France; turquoise dots: Hungary; purple dots: Poland. Green group: Italian samples; black group: Chinese samples; yellow group: French samples; turquoise group: Hungarian samples; purple group: Polish samples).
Processes 13 01373 g006
Figure 7. The OPLS-DA loading plot of the dehydrated apple sample set (blue dots represent the sample classes whereas the green dots are the variables that drive the clusterisation).
Processes 13 01373 g007
Figure 8. Permutation plot for OPLS-DA model evaluation. Number of permutations = 100 (green dots: R2Y(cum); blue squares: Q2(cum); dashed lines: intercepts on the y-axis of R2 and Q2).
Processes 13 01373 g008
Table 1. Misclassification table of selected prediction set (n = 17). (Green cell: samples correctly classified; yellow cell: samples misclassified).
MembersCorrectItalyChinaFranceHungaryPolandNo Class
Italy4100%400000
China3100%030000
France5100%005000
Hungary366.67%001200
Poland2100%000020
No class0 000000
Total1794.12%436220
Table 2. The dehydrated apple test set classification list. The numbers in the Sample ID column indicate different batches, whereas the letters indicate the replicate. (Green YPredPS value: sample belongs to class; yellow YPredPS value: sample is borderline; white YPredPS value: sample does not belong to class).
Sample IDClass IDYVarPS (ITA)YPredPS (ITA)YVarPS (NOT ITA)YPredPS (NOT ITA)
Chile 1 ANot Italy00.46510.535
Chile 1 BNot Italy00.33410.666
Chile 2 ANot Italy00.35110.649
Chile 2 BNot Italy00.56110.439
Chile 3 ANot Italy00.59810.402
Chile 3 BNot Italy00.74210.258
Chile 4 ANot Italy00.52410.476
Chile 4 BNot Italy00.60710.393
Italy 1 AItaly11.1070−0.107
Italy 1 BItaly11.0800−0.080
Italy 2 AItaly11.3060−0.306
Italy 2 BItaly11.2290−0.229
Italy 3 AItaly11.1800−0.180
Italy 3 BItaly11.2580−0.258
Italy 4 AItaly11.3170−0.317
Italy 4 BItaly11.3790−0.379
Hungary 1 ANot Italy01.1631−0.163
Hungary 1 BNot Italy00.99310.007
Hungary 2 ANot Italy00.00410.996
Hungary 2 BNot Italy0−0.04811.048
Hungary 3 ANot Italy00.10210.898
Hungary 3 BNot Italy00.11810.882
Hungary 4 ANot Italy00.16810.832
Hungary 4 BNot Italy00.14210.858
Table 3. Dehydrated apple test set misclassification table.
MembersCorrectItalyNot ItalyNo Class
Italy8100%800
Not Italy1656.25%376
No class0 000
Total1778.12%1176
Disclaimer/Publisher’s Note: The statements, opinions and data contained in all publications are solely those of the individual author(s) and contributor(s) and not of MDPI and/or the editor(s). MDPI and/or the editor(s) disclaim responsibility for any injury to people or property resulting from any ideas, methods, instructions or products referred to in the content.