1. Introduction
Nostoc sphaeroides belongs to the phylum Cyanophyta, class Cyanophyceae, and genus
Nostoc. It has a long history of being consumed as food [
1]. Not only is it rich in nutrients such as proteins, amino acids, fatty acids, polysaccharides, and vitamins [
2,
3], but it also possesses various bioactive functions, including anti-inflammatory, antibacterial, antioxidant, anticancer, and immunomodulatory properties, making it highly valuable for potentially medicinal purposes [
4,
5].
N. sphaeroides, a cyanobacterial species predominantly grown in rice paddies of Hefeng County, Hubei Province, exhibits an ordinary harvest season from March to late May. Environmental stressors have caused a dramatic decline in annual production from a historical peak of 25 tons to less than 0.5 tons in recent decades [
6], with current market values reaching USD 300–800 per kilogram of dry product. This economic context underscores the necessity for developing cost-effective cultivation methodologies.
Substantial research efforts over the past decades have focused on commercial-scale production techniques. Indoor photobioreactor systems employing artificial illumination and aerated cultures achieved monthly yields of 38.30–293.70 kg fresh biomass per cubic meter [
7]. However, the prohibitive operational costs and labor-intensive nature of these systems limit their commercial feasibility [
8]. Raceway pond cultivation demonstrated peak productivity of 5.12 g dry weight·m
−2·day
−1 [
9], yet practical implementation faces challenges, including significant biomass fragmentation, inconsistent yields, and failure to meet commercial size specifications (5–8 mm colony diameter) [
10]. Traditional paddy field cultivation benefits from low management requirements and operational costs [
11], but remains vulnerable to microbial contamination, pest infestations, and logistical constraints in harvesting and processing, compounded by strict thermal requirements (10–20 °C).
This study systematically investigates two critical optimization parameters: (1) long-term growth responses to varied inoculation densities, and (2) seasonal variations in the nutritional composition (protein, polysaccharide, and phycobiliprotein content) and textural properties (elasticity and hardness) of algal colonies. Our findings provide essential data for optimizing harvest timing based on target bioactive compounds while addressing the urgent need for standardized cultivation protocols [
12]. The proposed methodology offers practical solutions to three persistent challenges in
N. sphaeroides aquaculture: production cost reduction, yield stabilization, and quality control [
13]. This research advances both fundamental understanding and commercial application potential, with particular relevance to regional agricultural development and specialized crop cultivation initiatives [
14,
15].
3. Results and Analysis
3.1. The Changes in Light Intensity at 12:00 PM, Temperature, and Dissolved Oxygen Levels During the Cultivation Period
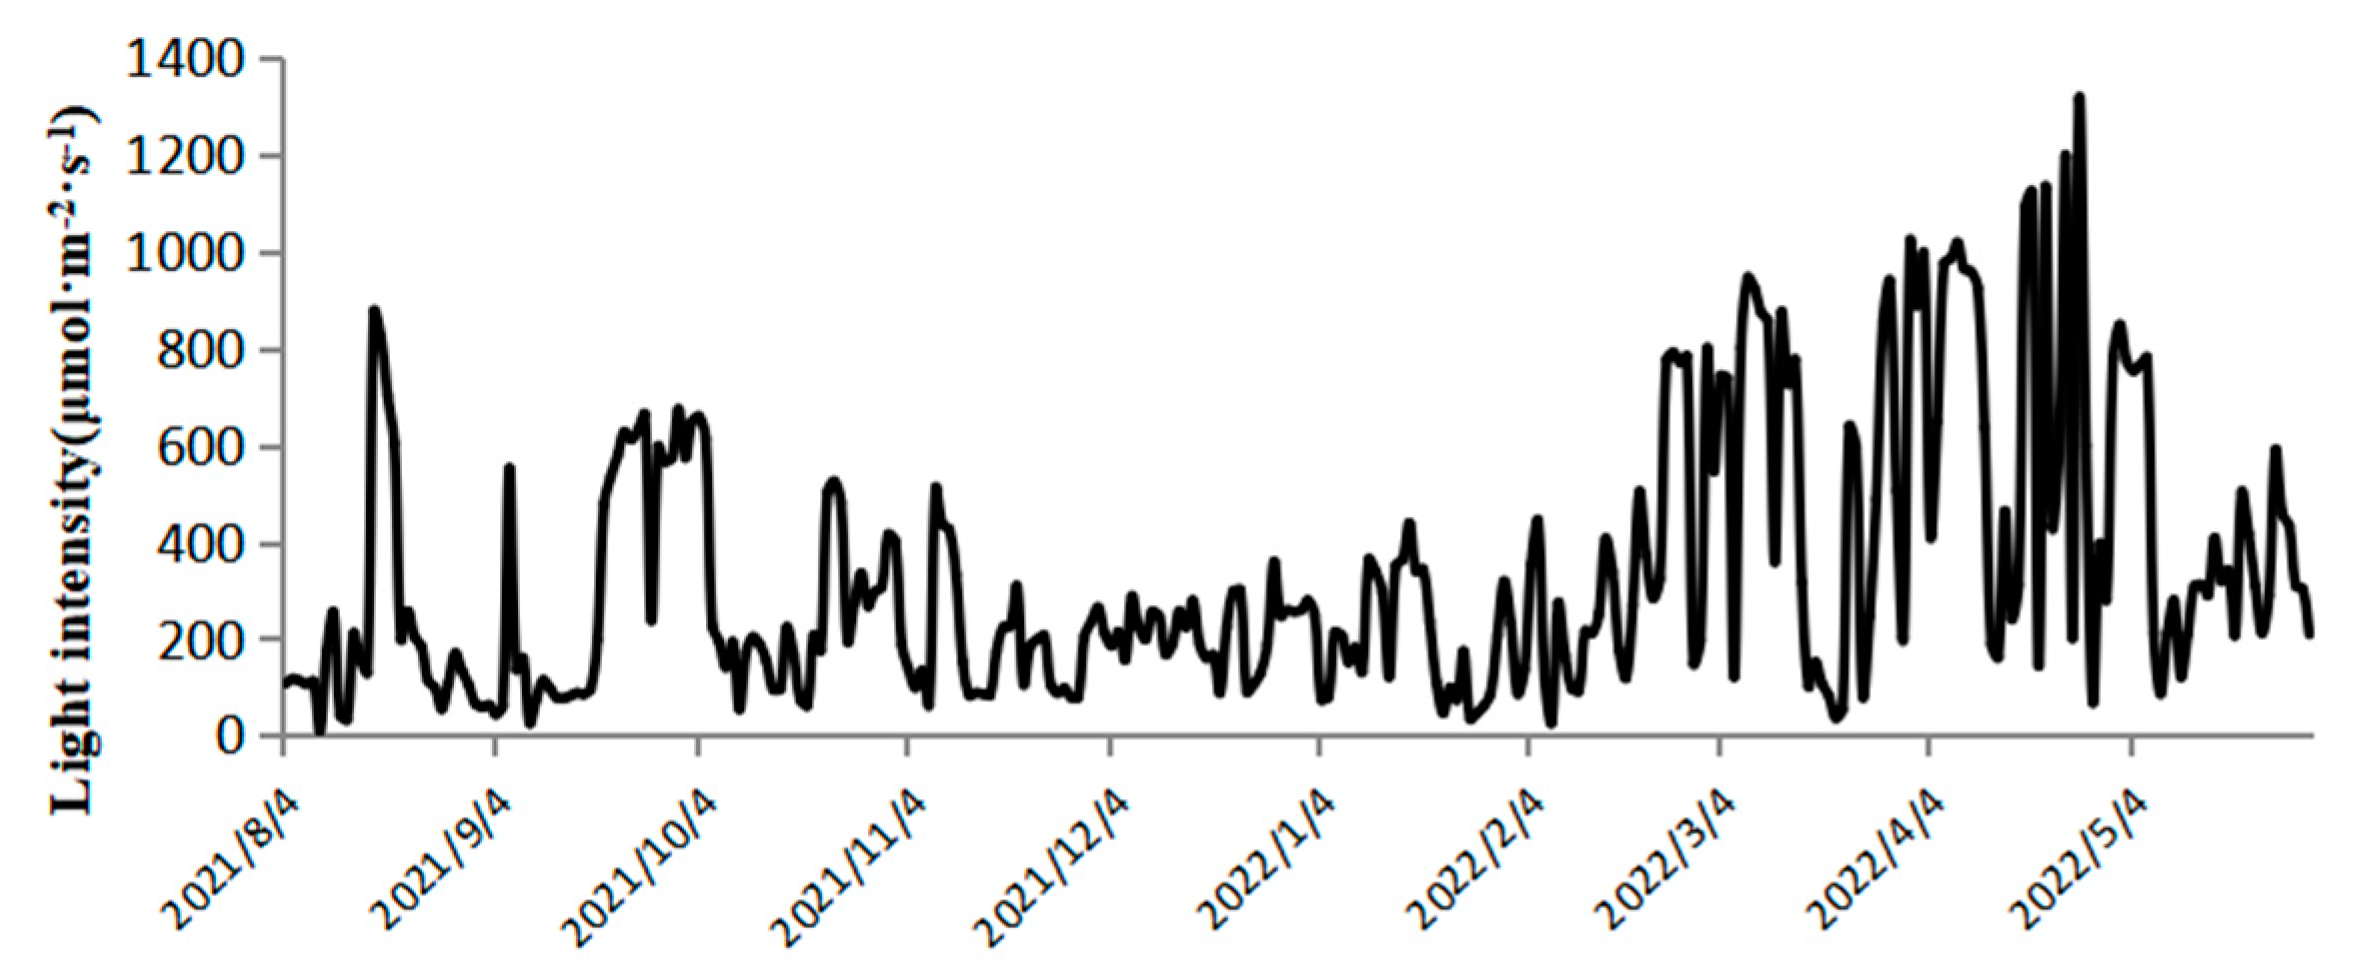
As shown in
Figure 2, the light intensity at 12:00 during outdoor cultivation varied significantly across seasons. In summer, it ranged from 9.9 to 876.3 μmol·m
−2·s
−1; in autumn, from 63.3 to 510.7 μmol·m
−2·s
−1; in winter, from 26.2 to 946.2 μmol·m
−2·s
−1; and in spring, from 68.7 to 1316.2 μmol·m
−2·s
−1. From August to October, shading nets were used, resulting in lower light intensity above the plastic bioreactors compared to spring. However, during cloudy or rainy days, the shading nets were removed to ensure sufficient light intensity [
25]. In late February, the light intensity remained above 600 μmol·m
−2·s
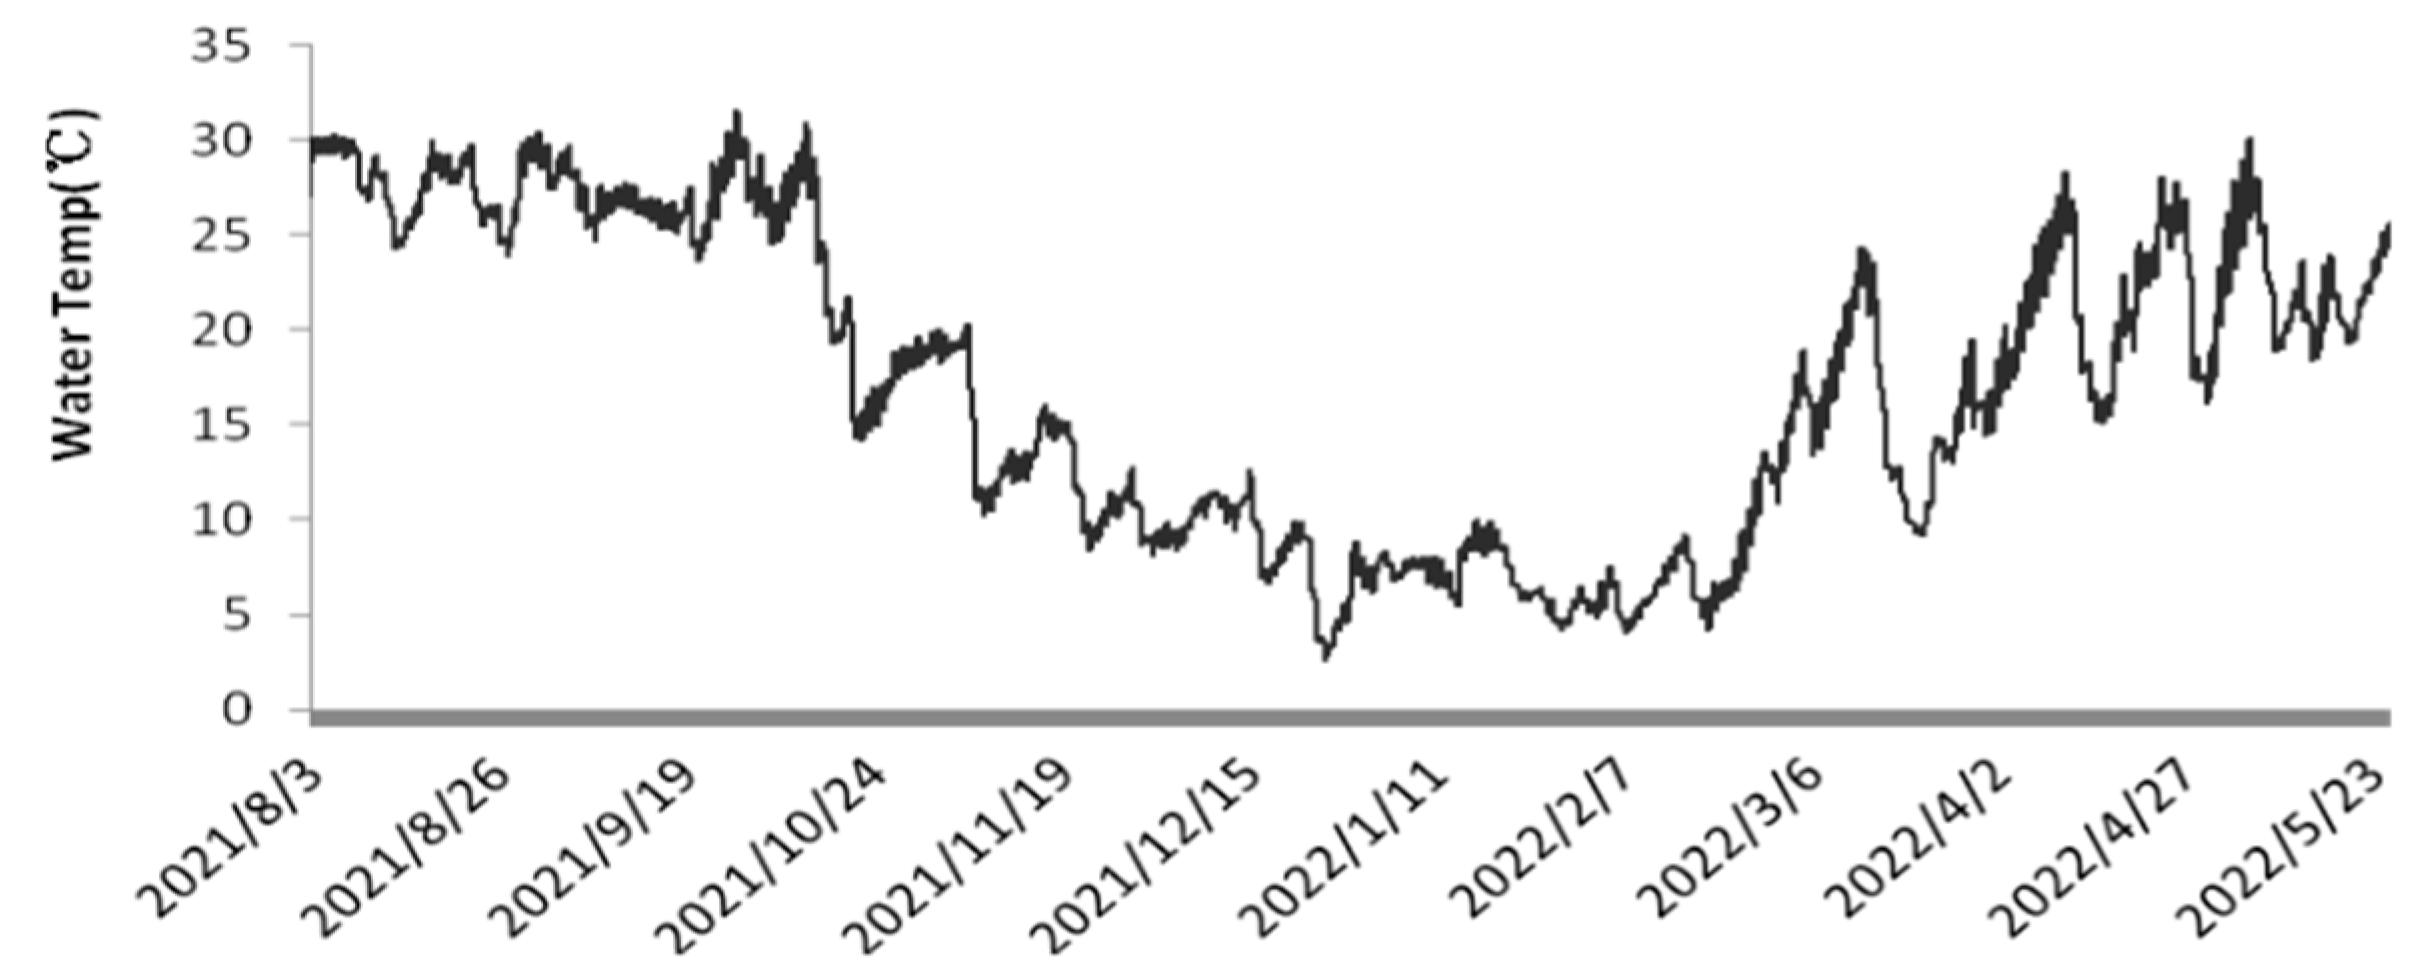
−1 for most of the time. As illustrated in
Figure 3, the temperature of the culture medium in the plastic bioreactors fluctuated with seasonal and diurnal variations [
26]. The temperature ranged from 23.7 to 31.3 °C in summer, 7.1 to 19.9 °C in autumn, 3.7 to 23.8 °C in winter, and 15.2 to 29.6 °C in spring.
As shown in
Figure 4, the dissolved oxygen levels ranged from 6.0 to 9.1 mg·L
−1 during August to October, 6.7 to 13.3 mg·L
−1 during November to December, 8.1 to 15.2 mg·L
−1 during January to March, and 6.8 to 11.1 mg·L
−1 during April to May. The relatively low dissolved oxygen values observed from August to October were due to high temperatures, with the lowest recorded at 6.0 mg·L
−1. Similarly, the fluctuating light intensity and unstable temperatures in April to May also contributed to lower dissolved oxygen levels. As shown in
Figure 5, the pH values during the cultivation of
N. sphaeroides fluctuated between 7 and 10, with an average of approximately 8.5. This indicates that the outdoor cultivation environment for
N. sphaeroides was slightly alkaline.
3.2. Productivity Under Different Seasons and Inoculation Densities
As shown in
Table 1, the highest yields in May were observed at inoculation densities of 5 g·L
−1, 10 g·L
−1, and 15 g·L
−1, with values of 0.91 g·L
−1·d
−1, 1.28 g·L
−1·d
−1, and 1.28 g·L
−1·d
−1, respectively. From August to October and November to December, the highest average fresh weight productivity per unit volume was achieved at an inoculation density of 10 g·L
−1, with values of 0.26 g·L
−1·d
−1 and 0.31 g·L
−1·d
−1, respectively. From January to March and April to May, the highest average fresh weight productivity was observed at an inoculation density of 15 g·L
−1, with values of 0.52 g·L
−1·d
−1 and 1.40 g·L
−1·d
−1, respectively. Therefore, the optimal inoculation density for summer and autumn is 10 g·L
−1, while for winter and spring, it is 15 g·L
−1.
3.3. The Changes in the Increase of Colony Diameter at Different Seasons and Inoculation Densities
As shown in
Figure 6, from August to October, for the group with an inoculation density of 5 g·L
−1, the largest proportion of colony size was 5–6 mm, accounting for 42.07%; for the group with an inoculation density of 10 g·L
−1, the largest proportion was 3–4 mm, accounting for 50.92%; for the group with an inoculation density of 15 g·L
−1, the largest proportions were 2–3 mm and 3–4 mm, both accounting for 45.18%.
From November to December, for the group with an inoculation density of 5 g·L−1, the largest proportion of colony size was 5–6 mm, accounting for 35.77%; for the group with an inoculation density of 10 g·L−1, the largest proportion was 5–6 mm, accounting for 39.71%; for the group with an inoculation density of 15 g·L−1, the largest proportion was 4–5 mm, accounting for 54.78%.
From January to March, for the group with an inoculation density of 5 g·L−1, the largest colony size was 7–8 mm, accounting for 69.58%; for the group with an inoculation density of 10 g·L−1, the largest colony size was 6–7 mm, accounting for 48.88%; for the group with an inoculation density of 15 g·L−1, the largest colony size was 6–7 mm, accounting for 48.87%.
From April to May, there was no significant difference in colony diameter growth between the groups with inoculation densities of 5 g·L−1, 10 g·L−1, and 15 g·L−1, and the largest proportion of colony size was 4–5 mm, accounting for 60.81%, 66.67%, and 61.82%, respectively.
The results demonstrate that the colony diameter of N. sphaeroides varies with both season and inoculation density. During the summer, winter, and spring, increasing inoculation density leads to smaller colony sizes, while in spring, the inoculation density does not significantly affect the growth rate of the colonies. These findings suggest that while inoculation density can influence colony size in most seasons, other environmental factors, such as temperature and light, play a critical role in determining growth patterns, especially in spring.
3.4. The Fv/Fm Values at the End of Each Cultivation Cycle
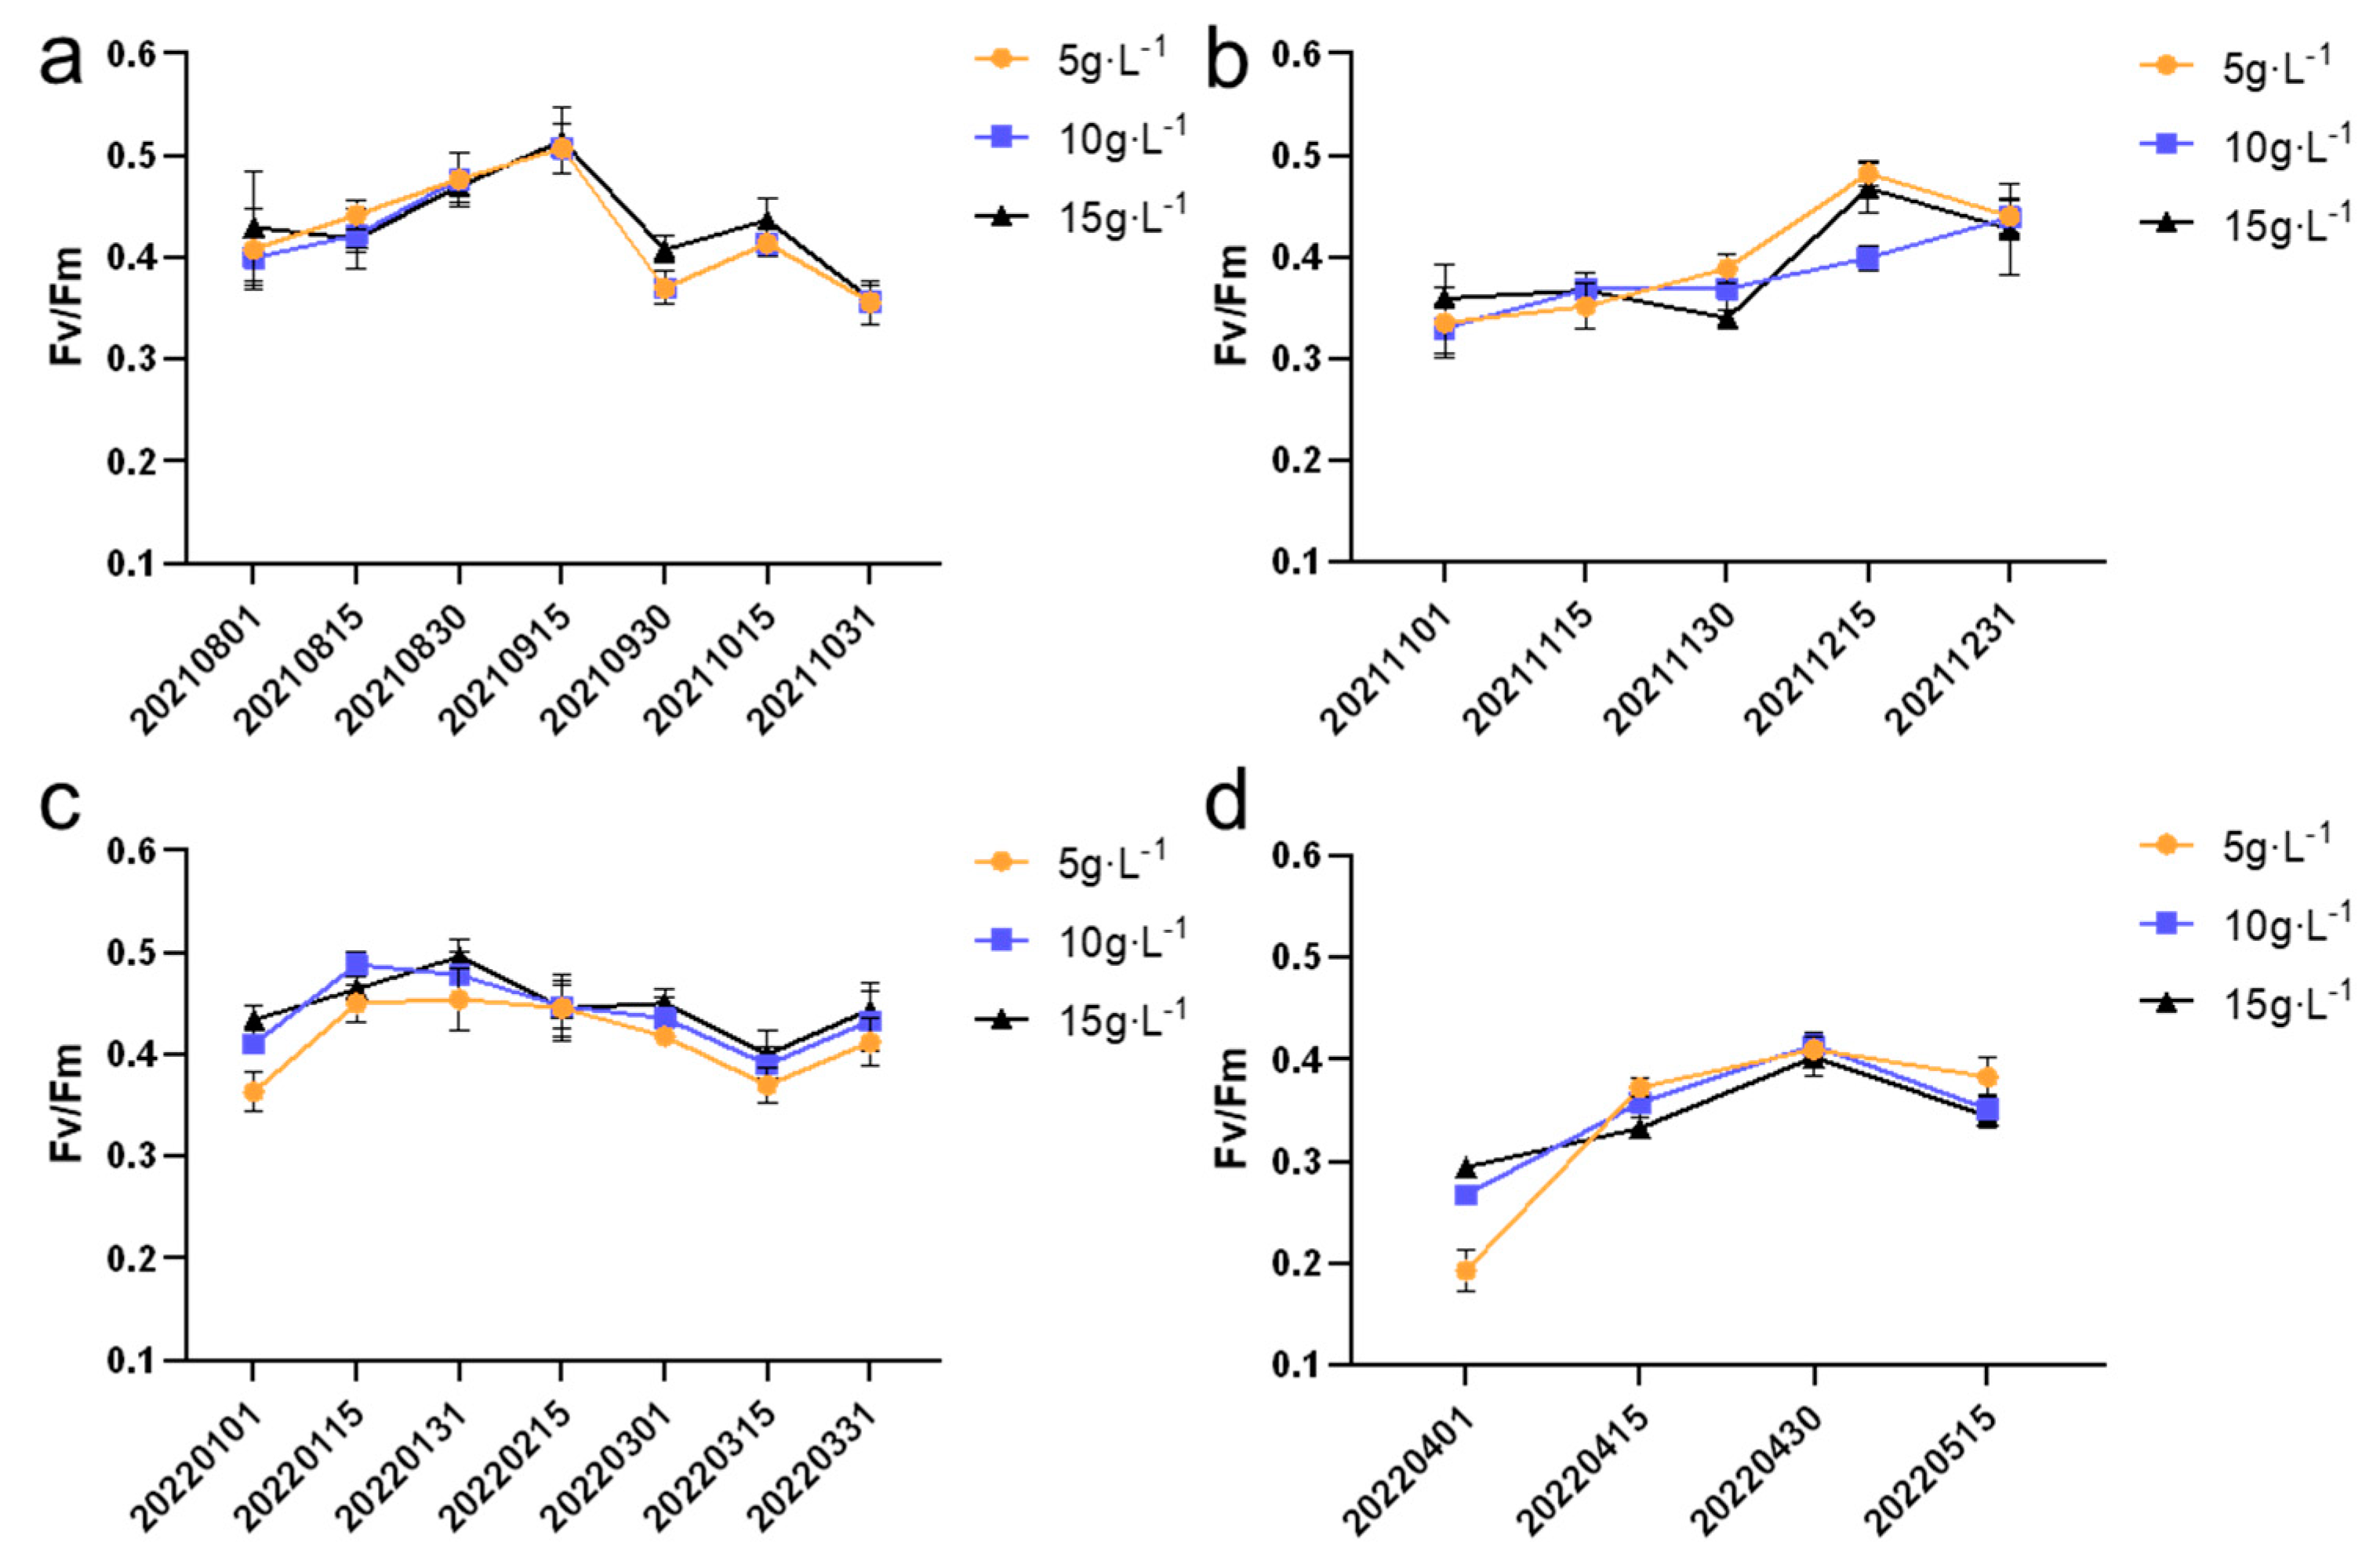
Fv/Fm is the chlorophyll fluorescence parameter used to assess the efficiency of photosynthesis. As shown in
Figure 7, during the entire experimental period, different cultivation densities had varying degrees of impact on the Fv/Fm values of
N. sphaeroides colonies. From August to October and from January to March, the highest Fv/Fm values were observed in the group with an inoculation density of 15 g·L
−1, with values of 0.51 ± 0.03 and 0.50 ± 0.02, respectively. These values suggest that higher inoculation densities may promote optimal photosynthetic efficiency during these periods.
In contrast, from November to December and from April to May, the highest Fv/Fm values were observed in the group with an inoculation density of 5 g·L−1, with values of 0.48 ± 0.01 and 0.37 ± 0.01, respectively. These results indicate that lower inoculation densities may be more favorable for maintaining better photosynthetic efficiency during these colder months, possibly due to environmental factors such as lower light intensity and temperature fluctuations.
Overall, the findings highlight the influence of inoculation density on the photosynthetic performance of N. sphaeroides, with varying effects depending on the season. These observations underscore the importance of optimizing cultivation conditions to maximize the photosynthetic efficiency of the species under different environmental conditions. The Fv/Fm (maximum quantum yield of photosystem II) values exhibited statistically significant differences (p < 0.05) across three inoculation densities (5, 10, and 15 g·L−1) during six sampling periods: 30 November 2021; 1 January 2022; 15 January 2022; 1 March 2022; 1 April 2022; and 15 April 2022.
3.5. The Growth Curve and Fv/Fm Values of a Cycle in Different Seasons
As shown in
Figure 8, during the summer, autumn, and winter seasons, the growth rates at different inoculation densities were relatively similar, with biomass increasing at a slow pace. In contrast, the growth rate during the spring season was the fastest. In spring, the growth rates of colonies at different inoculation densities remained steady during the first six days, but starting from the sixth day, the growth rate for the 5 g·L
−1 and 15 g·L
−1 groups began to increase rapidly. Meanwhile, for the 10 g·L
−1 group, the growth rate started to accelerate around day nine. This suggests that spring provides an optimal environment for growth, particularly as the inoculation density increases, indicating a possible seasonal variation in the response to cultivation density. In
Figure 8a, the summer inoculation density of 5 g·L
−1 showed significant differences (
p < 0.05) between samples 20210815 and 20210803. In
Figure 8b, the autumn inoculation density of 5 g·L
−1 exhibited significant differences (
p < 0.05) in the growth curve of
N. sphaeroides between 20211115 and 20211103. For the 10 g·L
−1 inoculation density, significant differences (
p < 0.05) were observed in the growth curve of
N. sphaeroides at 20211103, 20211109, 20211112, and 20211115, while the 15 g·L
−1 inoculation density showed significant differences (
p < 0.05) at 20211103, 20211109, and 20211115. In
Figure 8c, the autumn inoculation density of 5 g·L
−1 displayed significant differences (
p < 0.05) in the growth curve of
N. sphaeroides at 20211115 compared to the preceding five time points. For the 10 g·L
−1 inoculation density, significant differences (
p < 0.05) were observed at 20211103 and 20211115, while the 15 g·L
−1 inoculation density showed no significant differences. In
Figure 8d, all three inoculation densities exhibited significant differences (
p < 0.05) across the six time points.
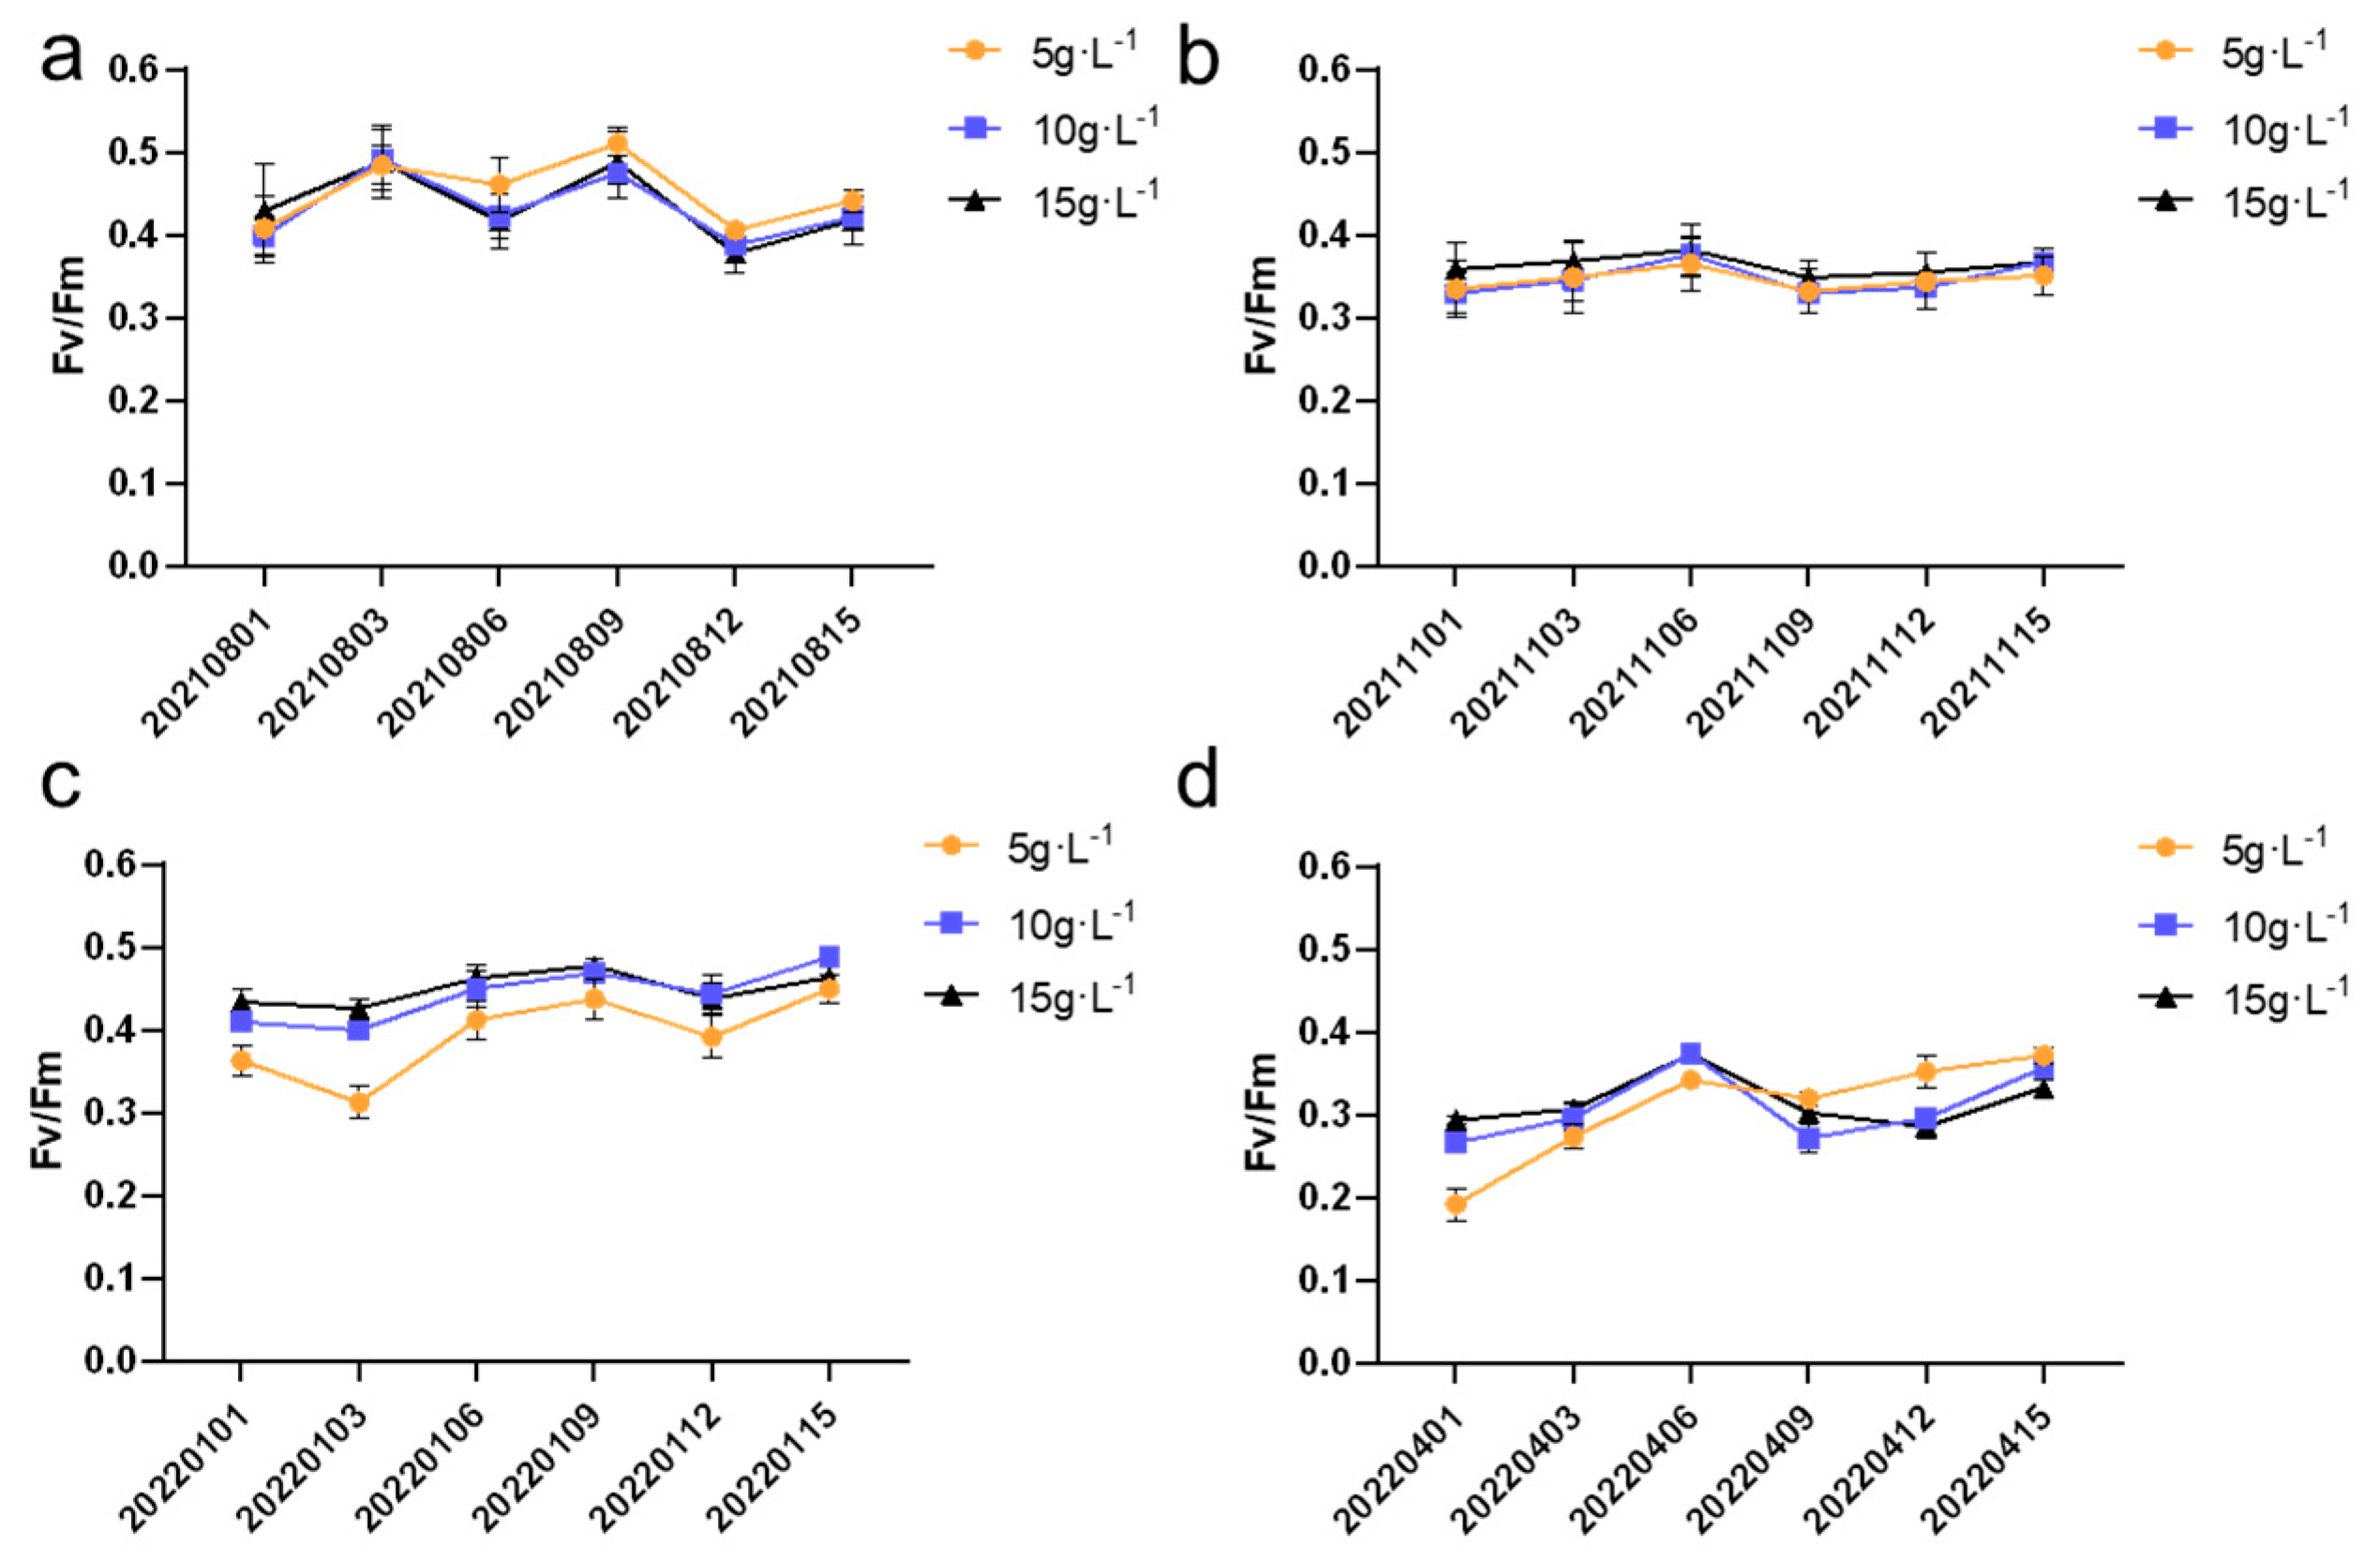
As shown in
Figure 9, the highest Fv/Fm values were observed in the summer, while the lowest values occurred in the spring. During the summer, due to higher light intensity and more stable temperatures, the Fv/Fm values peaked around 0.5, indicating optimal photosynthetic efficiency. In contrast, during the spring, fluctuations in light intensity and temperature instability led to a decrease in photosynthetic efficiency, with the lowest Fv/Fm values dropping to around 0.2. These findings highlight the significant seasonal variations in both the growth rate and photosynthetic efficiency of
N. sphaeroides, emphasizing the importance of seasonal factors in optimizing cultivation conditions for improved productivity. The Fv/Fm values at the six time points (20220101, 20220103, 20220401, 20220403, 20220409, and 20220415) showed significant differences (
p < 0.05) under three different inoculation densities.
3.6. Nutritional Analysis
3.6.1. The Dry-to-Wet Weight Ratio for Different Seasons and Inoculation Densities
As shown in
Figure 10, during the summer (a), autumn (b), and winter (c) seasons, the highest dry-to-wet weight ratio of
N. sphaeroides was observed at an inoculation density of 5 g·L
−1, with values of 2.15%, 1.76%, and 1.54%, respectively. These results suggest that, in these seasons, a lower inoculation density favors a higher dry-to-wet weight ratio, indicating efficient biomass accumulation relative to the wet weight of the colonies.
In contrast, during the spring (d) season, the highest dry-to-wet weight ratio was observed at an inoculation density of 10 g·L−1, with a value of 1.13%. This implies that, in spring, a higher inoculation density leads to better biomass accumulation efficiency, possibly due to more favorable growth conditions for N. sphaeroides under these conditions, such as improved light intensity and temperature.
These findings highlight the seasonal variations in the dry-to-wet weight ratio of N. sphaeroides and the influence of inoculation density on biomass efficiency, suggesting that optimal inoculation densities may vary with the season to maximize the growth potential of N. sphaeroides under different environmental conditions. Statistical analysis demonstrated significant differences (p < 0.05) in dry weight content of N. sphaeroides among the three inoculation densities during summer cultivation. In spring, while distinct variations (p < 0.05) were observed between the 15 g·L−1 group and both the 5 g·L−1 and 10 g·L−1 inoculation densities, no statistically significant divergence (p > 0.05) was detected between the 5 g·L−1 and 10 g·L−1 treatment groups.
3.6.2. Comparison of Chlorophyll and Carotenoid Contents Across Seasons and Inoculation Densities
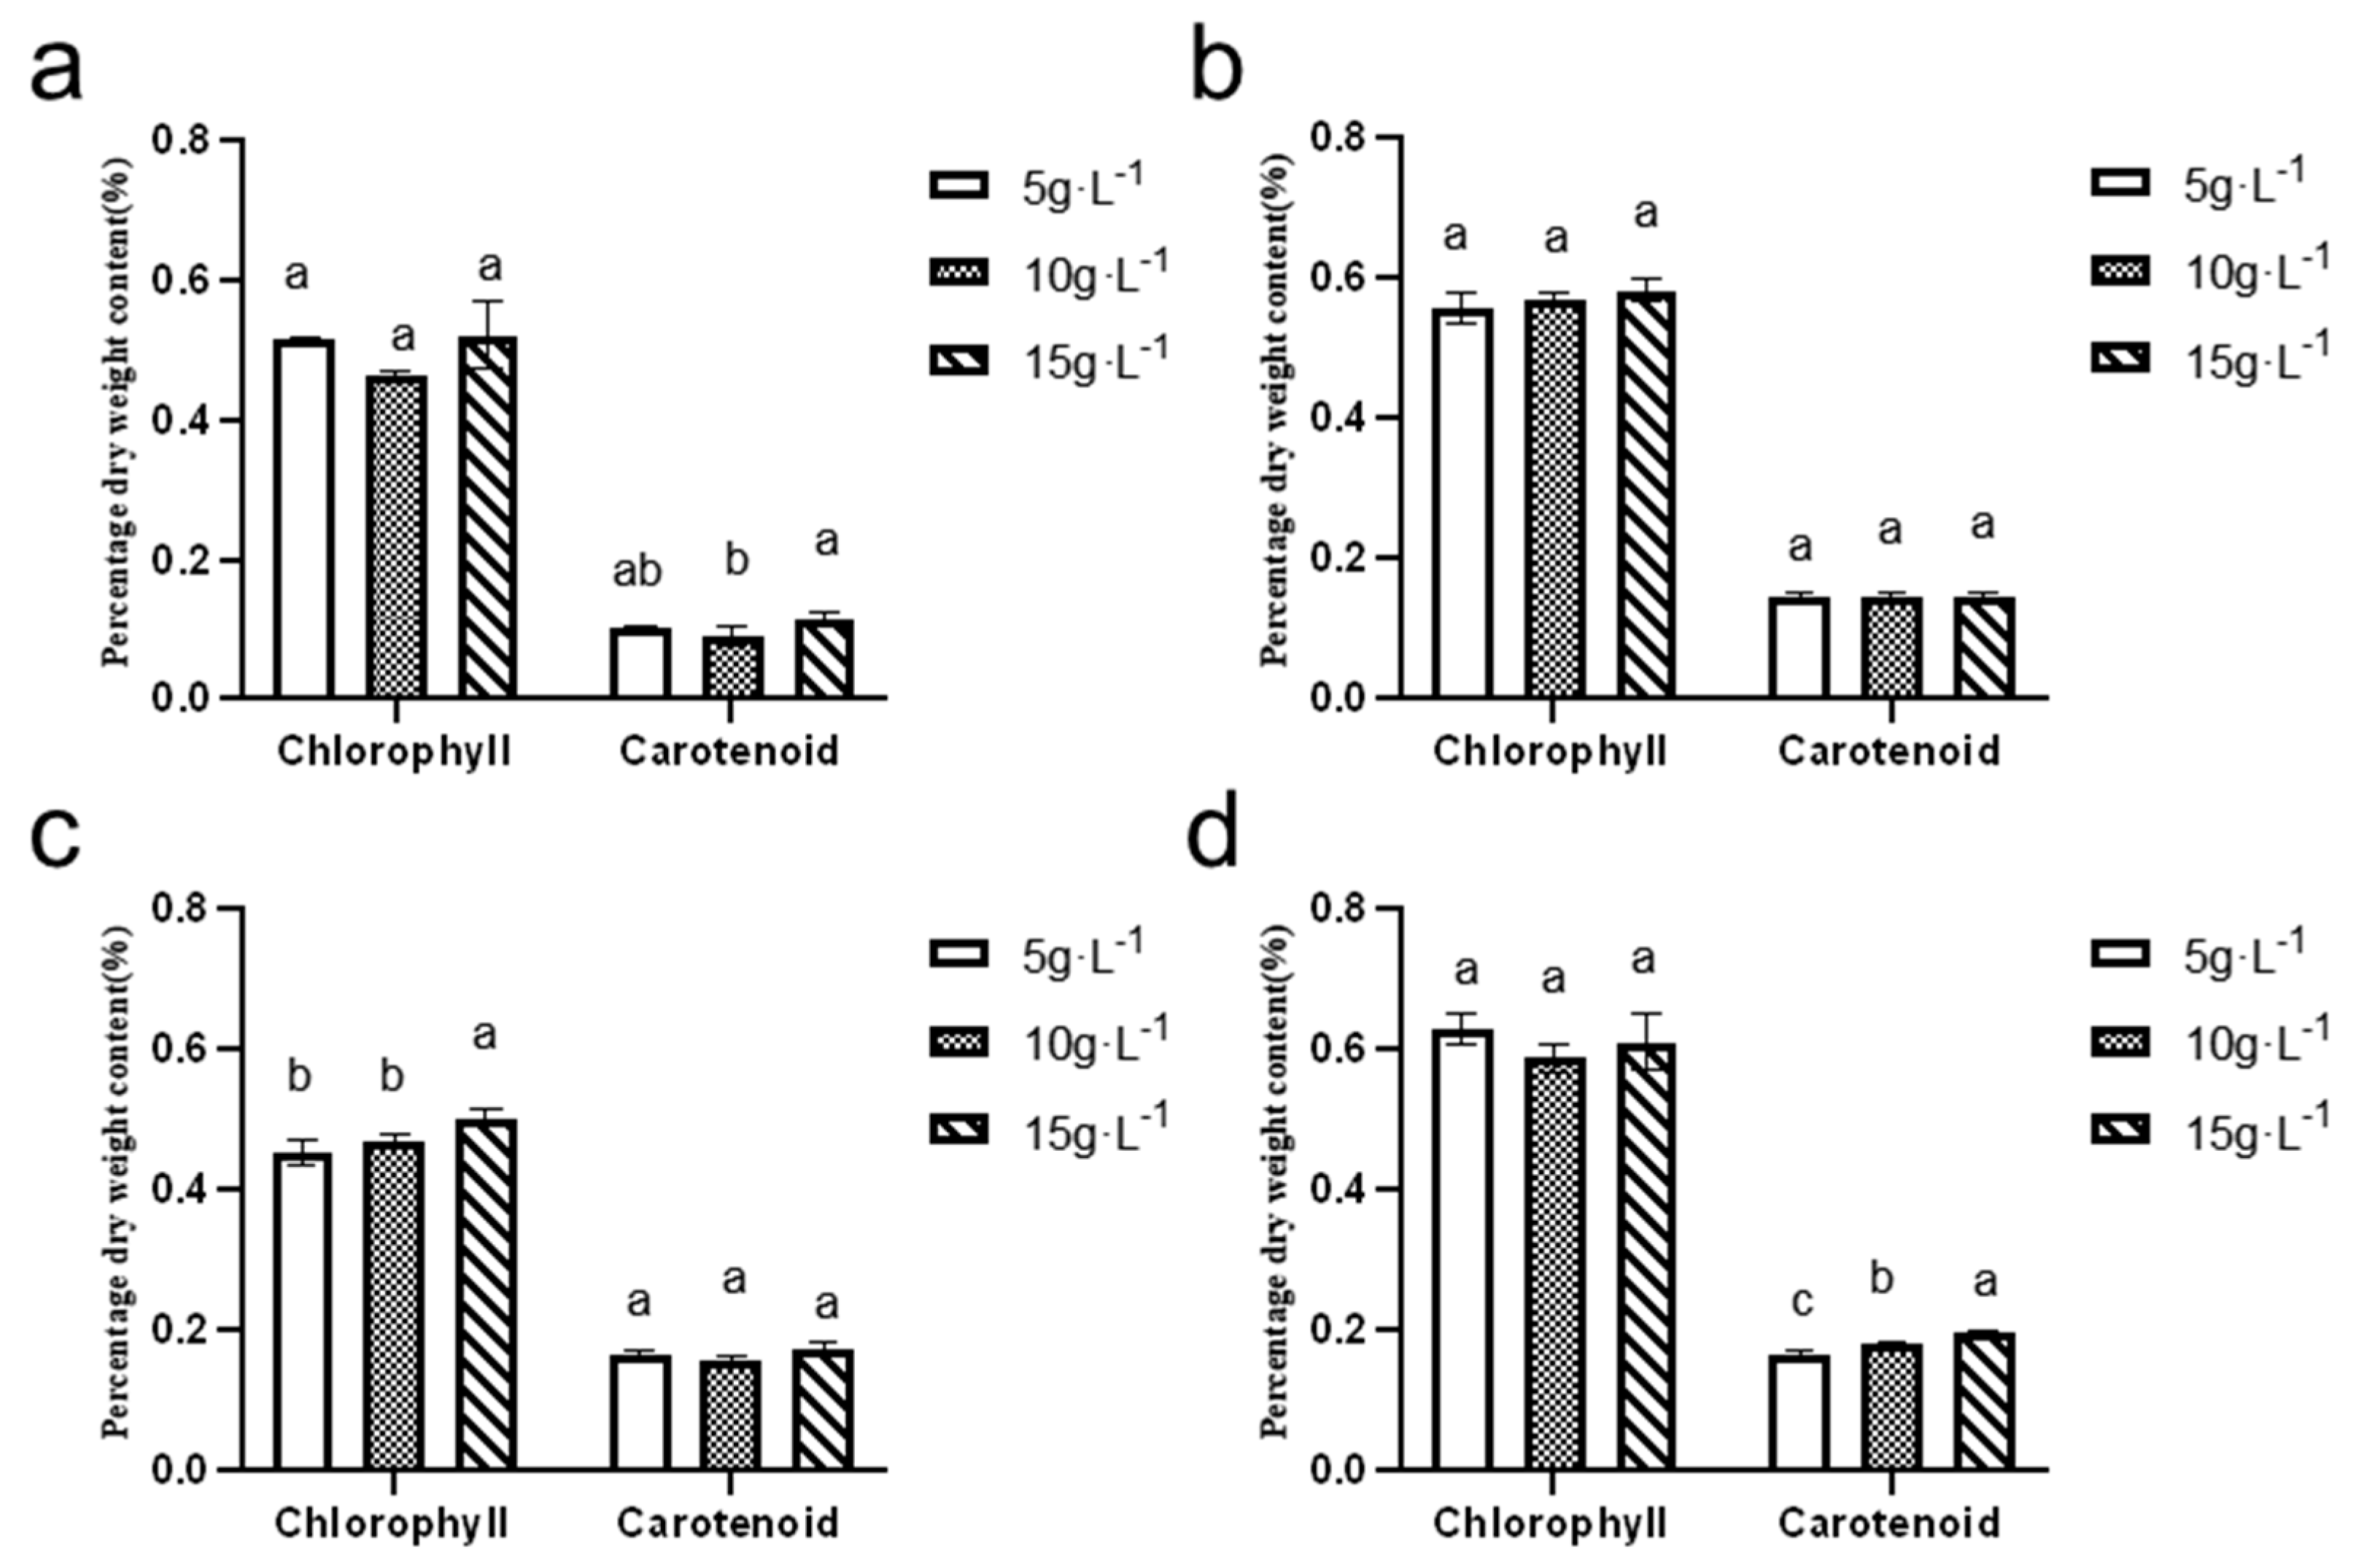
As depicted in
Figure 11, the chlorophyll content in
N. sphaeroides ranged from 0.40% to 0.60%, while the carotenoid content remained below 0.20%. The highest levels of both chlorophyll and carotenoids were observed during the spring season, suggesting that the environmental conditions during this period, including factors such as light intensity and temperature, are particularly favorable for the production of these pigments.
The maximum chlorophyll content was recorded at an inoculation density of 5 g·L−1, with a value of 0.63 ± 0.02%. This indicates that, at this inoculation density, N. sphaeroides achieved optimal chlorophyll synthesis during spring. On the other hand, the highest carotenoid content was observed at an inoculation density of 15 g·L−1, with a value of −0.20 ± 0.61%. This suggests that at higher inoculation densities, the algae might have adapted to optimize carotenoid production, possibly as a protective mechanism against environmental stressors such as high light intensity.
These results emphasize the influence of both season and inoculation density on the production of key pigments in N. sphaeroides, with specific conditions favoring higher pigment synthesis. This information can help optimize cultivation conditions for enhanced pigment production, potentially benefiting applications such as natural colorants or bioactive compounds. Statistical analysis revealed significant seasonal variations in pigment accumulation of N. sphaeroides: Chlorophyll dry weight content exhibited statistically distinct differences (p < 0.05) between 15 and 5, or 10 g·L−1 during winter cultivation. Summer carotenoid content showed significant divergence (p < 0.05) between the 10 g·L−1 and 15 g·L−1 treatment groups, whereas spring cultivation demonstrated statistically significant variations (p < 0.05) in carotenoid dry weight content across all tested inoculation densities (5, 10, and 15 g·L−1).
3.6.3. Comparison of Phycobiliprotein Contents Across Seasons and Inoculation Densities
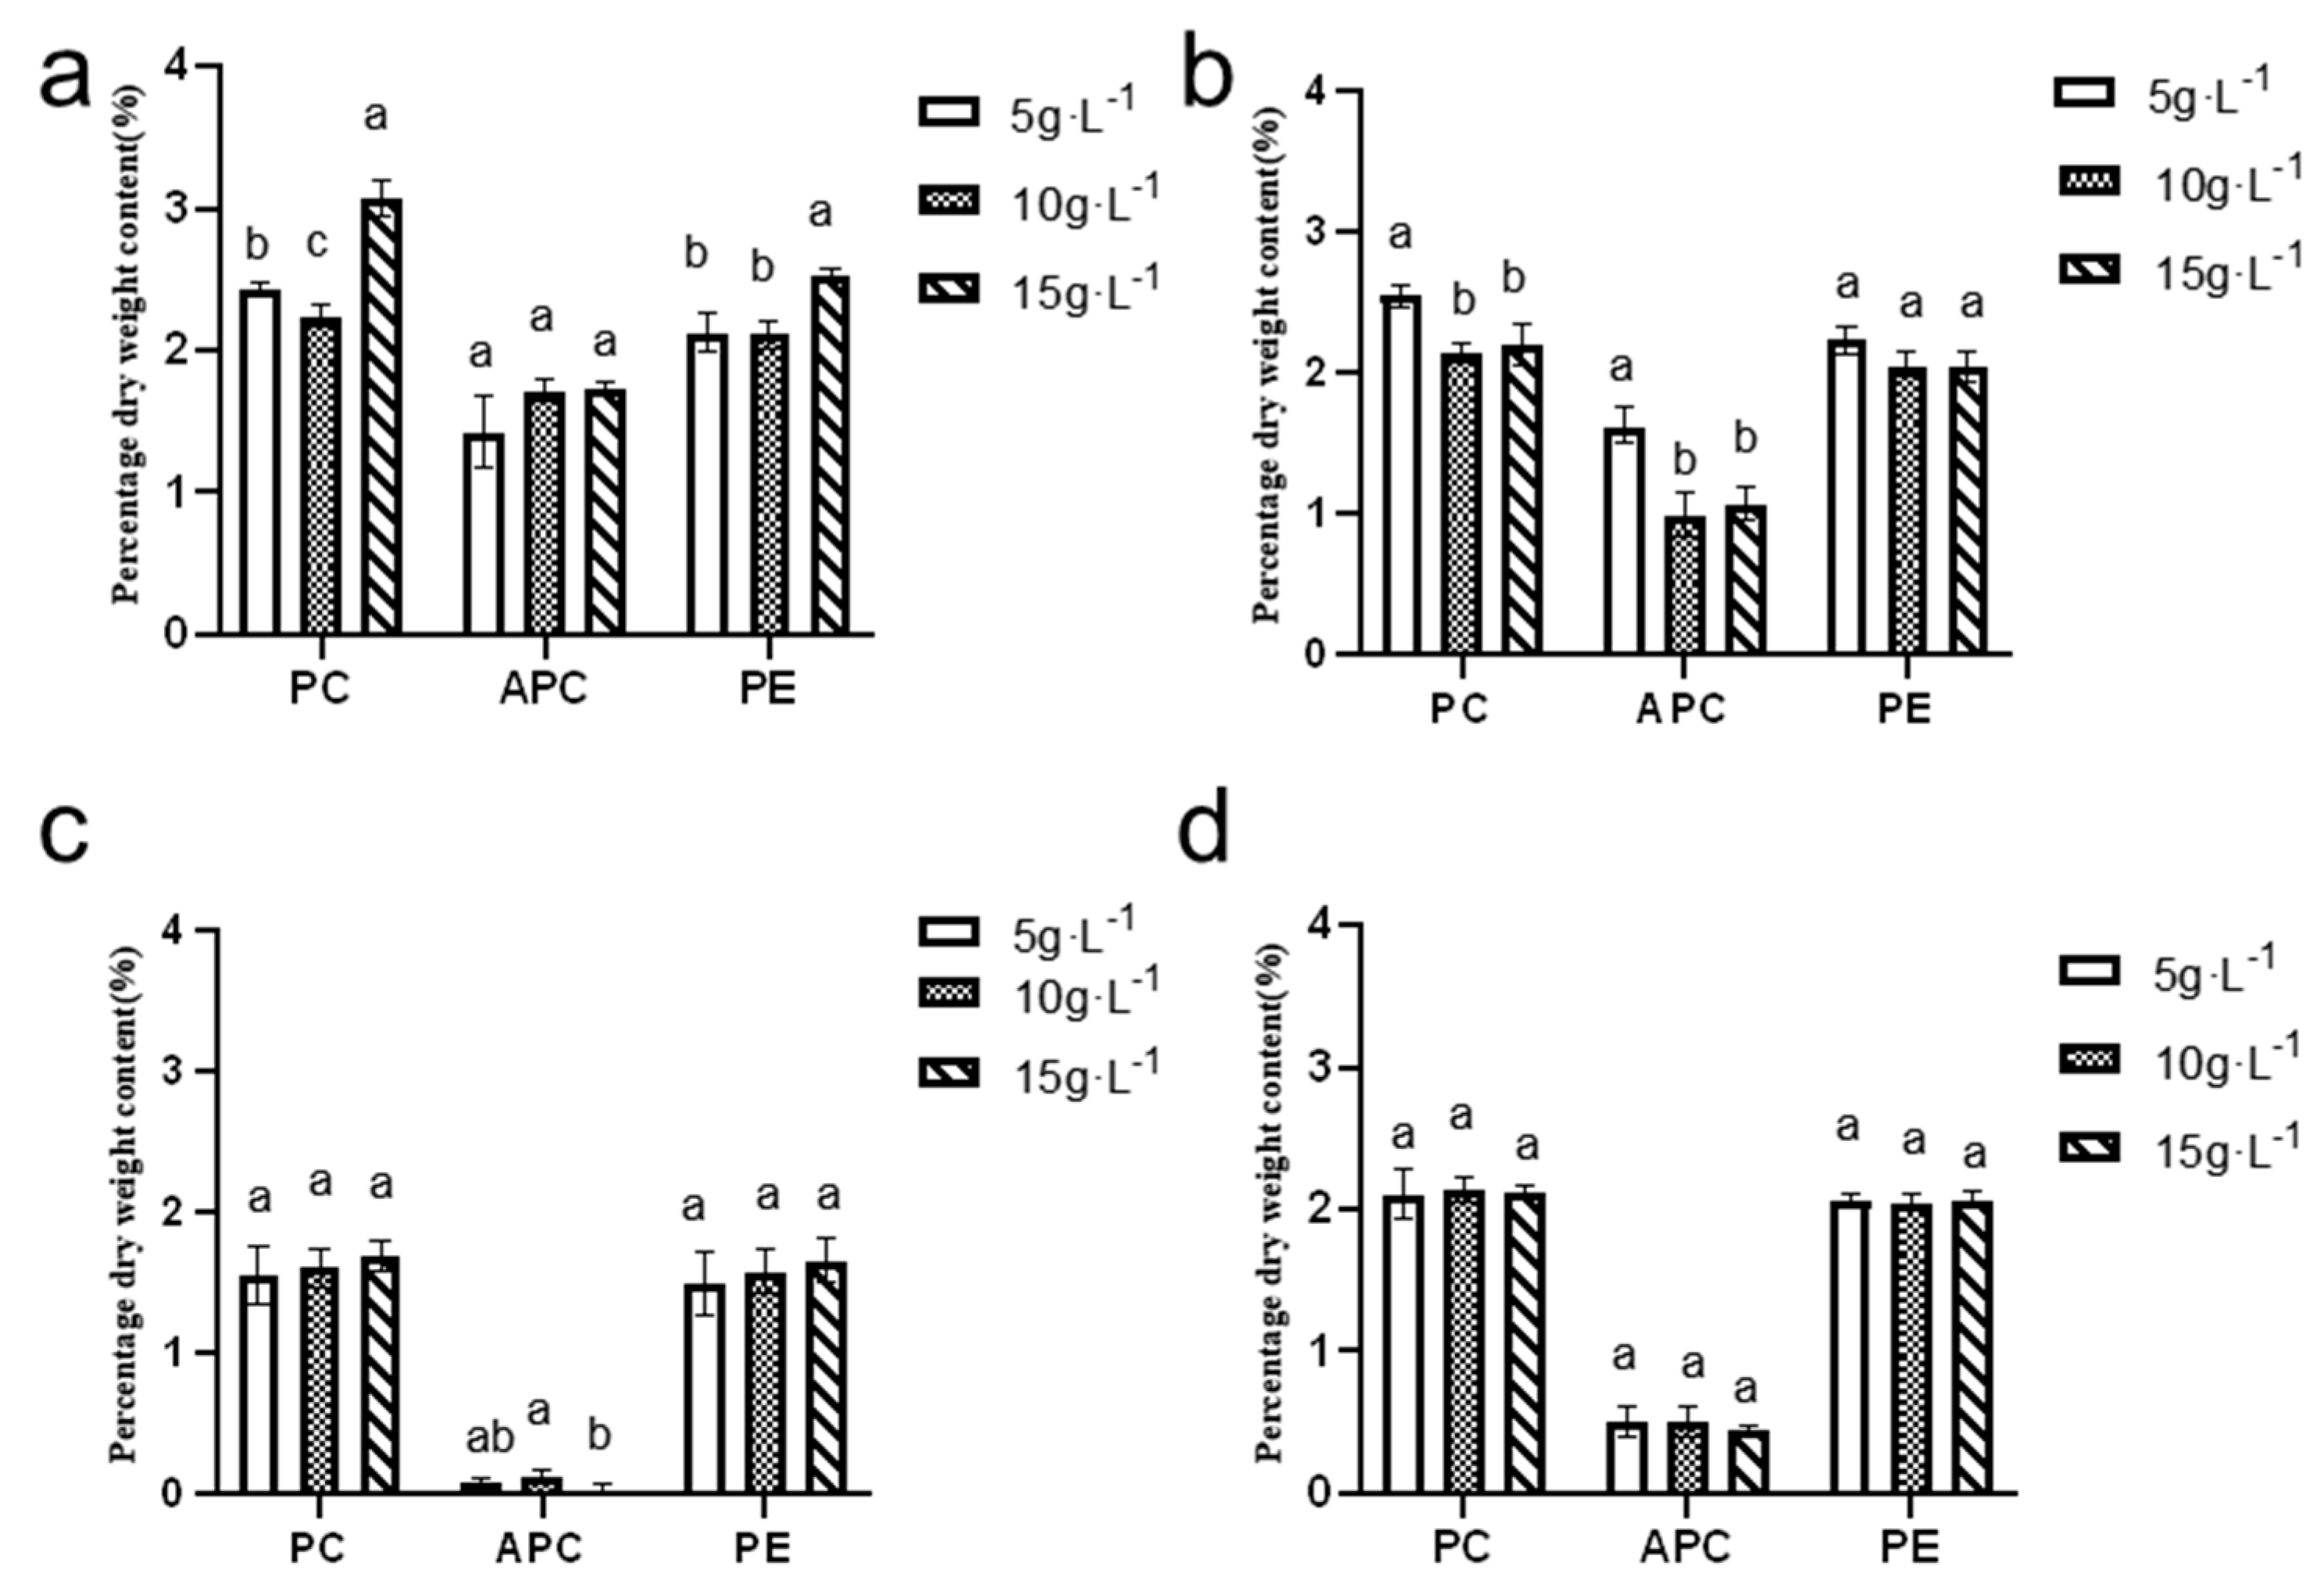
Figure 12 illustrates that the dry weight content of phycocyanin and phycoerythrin during the summer and autumn seasons ranged from 2% to 3%, while the allophycocyanin content varied between 1% and 2%. In contrast, during the winter and spring seasons, the dry weight content of phycocyanin and phycoerythrin ranged from 1% to 2.2%, and the allophycocyanin content remained below 1%.
The highest levels of phycocyanin, allophycocyanin, and phycoerythrin were observed in the summer season, with maximum values recorded at an inoculation density of 15 g·L−1. Specifically, the phycocyanin content reached 3.07 ± 0.11%, the allophycocyanin content was 1.73 ± 0.03%, and the phycoerythrin content was 2.54 ± 0.03%.
These findings highlight the seasonal variation in pigment content and the significant influence of inoculation density on pigment production. Summer conditions, combined with a higher inoculation density, appear to favor the production of these valuable pigments, potentially enhancing the overall quality and yield of N. sphaeroides for various industrial and research applications. Statistical analysis indicated significant seasonal-dependent variations in pigment accumulation profiles: Summer phycocyanin content demonstrated statistically distinct differences (p < 0.05) across all three inoculation densities (5, 10, and 15 g·L−1), while autumn phycocyanin exhibited significant divergence (p < 0.05) among 5, 10, and 15 g·L−1 treatments, though no statistical significance (p > 0.05) was detected between the 10 and 15 g·L−1 groups. Autumn allophycocyanin accumulation showed significant differences (p < 0.05) between 5 and 10, or 15 g·L−1, contrasting with winter patterns where significant variations (p < 0.05) were restricted to the 10–15 g·L−1 density comparison. Summer carotenoid content displayed significant differentiation (p < 0.05), specifically between 10 and 15 g·L−1 treatments. Phycoerythrin accumulation during summer cultivation revealed significant differences (p < 0.05) among 5, 10, and 15 g·L−1 groups, though no statistical distinction (p > 0.05) emerged between the 5 and 10 g·L−1 inoculation densities.
3.6.4. Comparison of Total Protein and Polysaccharides Across Seasons and Inoculation Densities
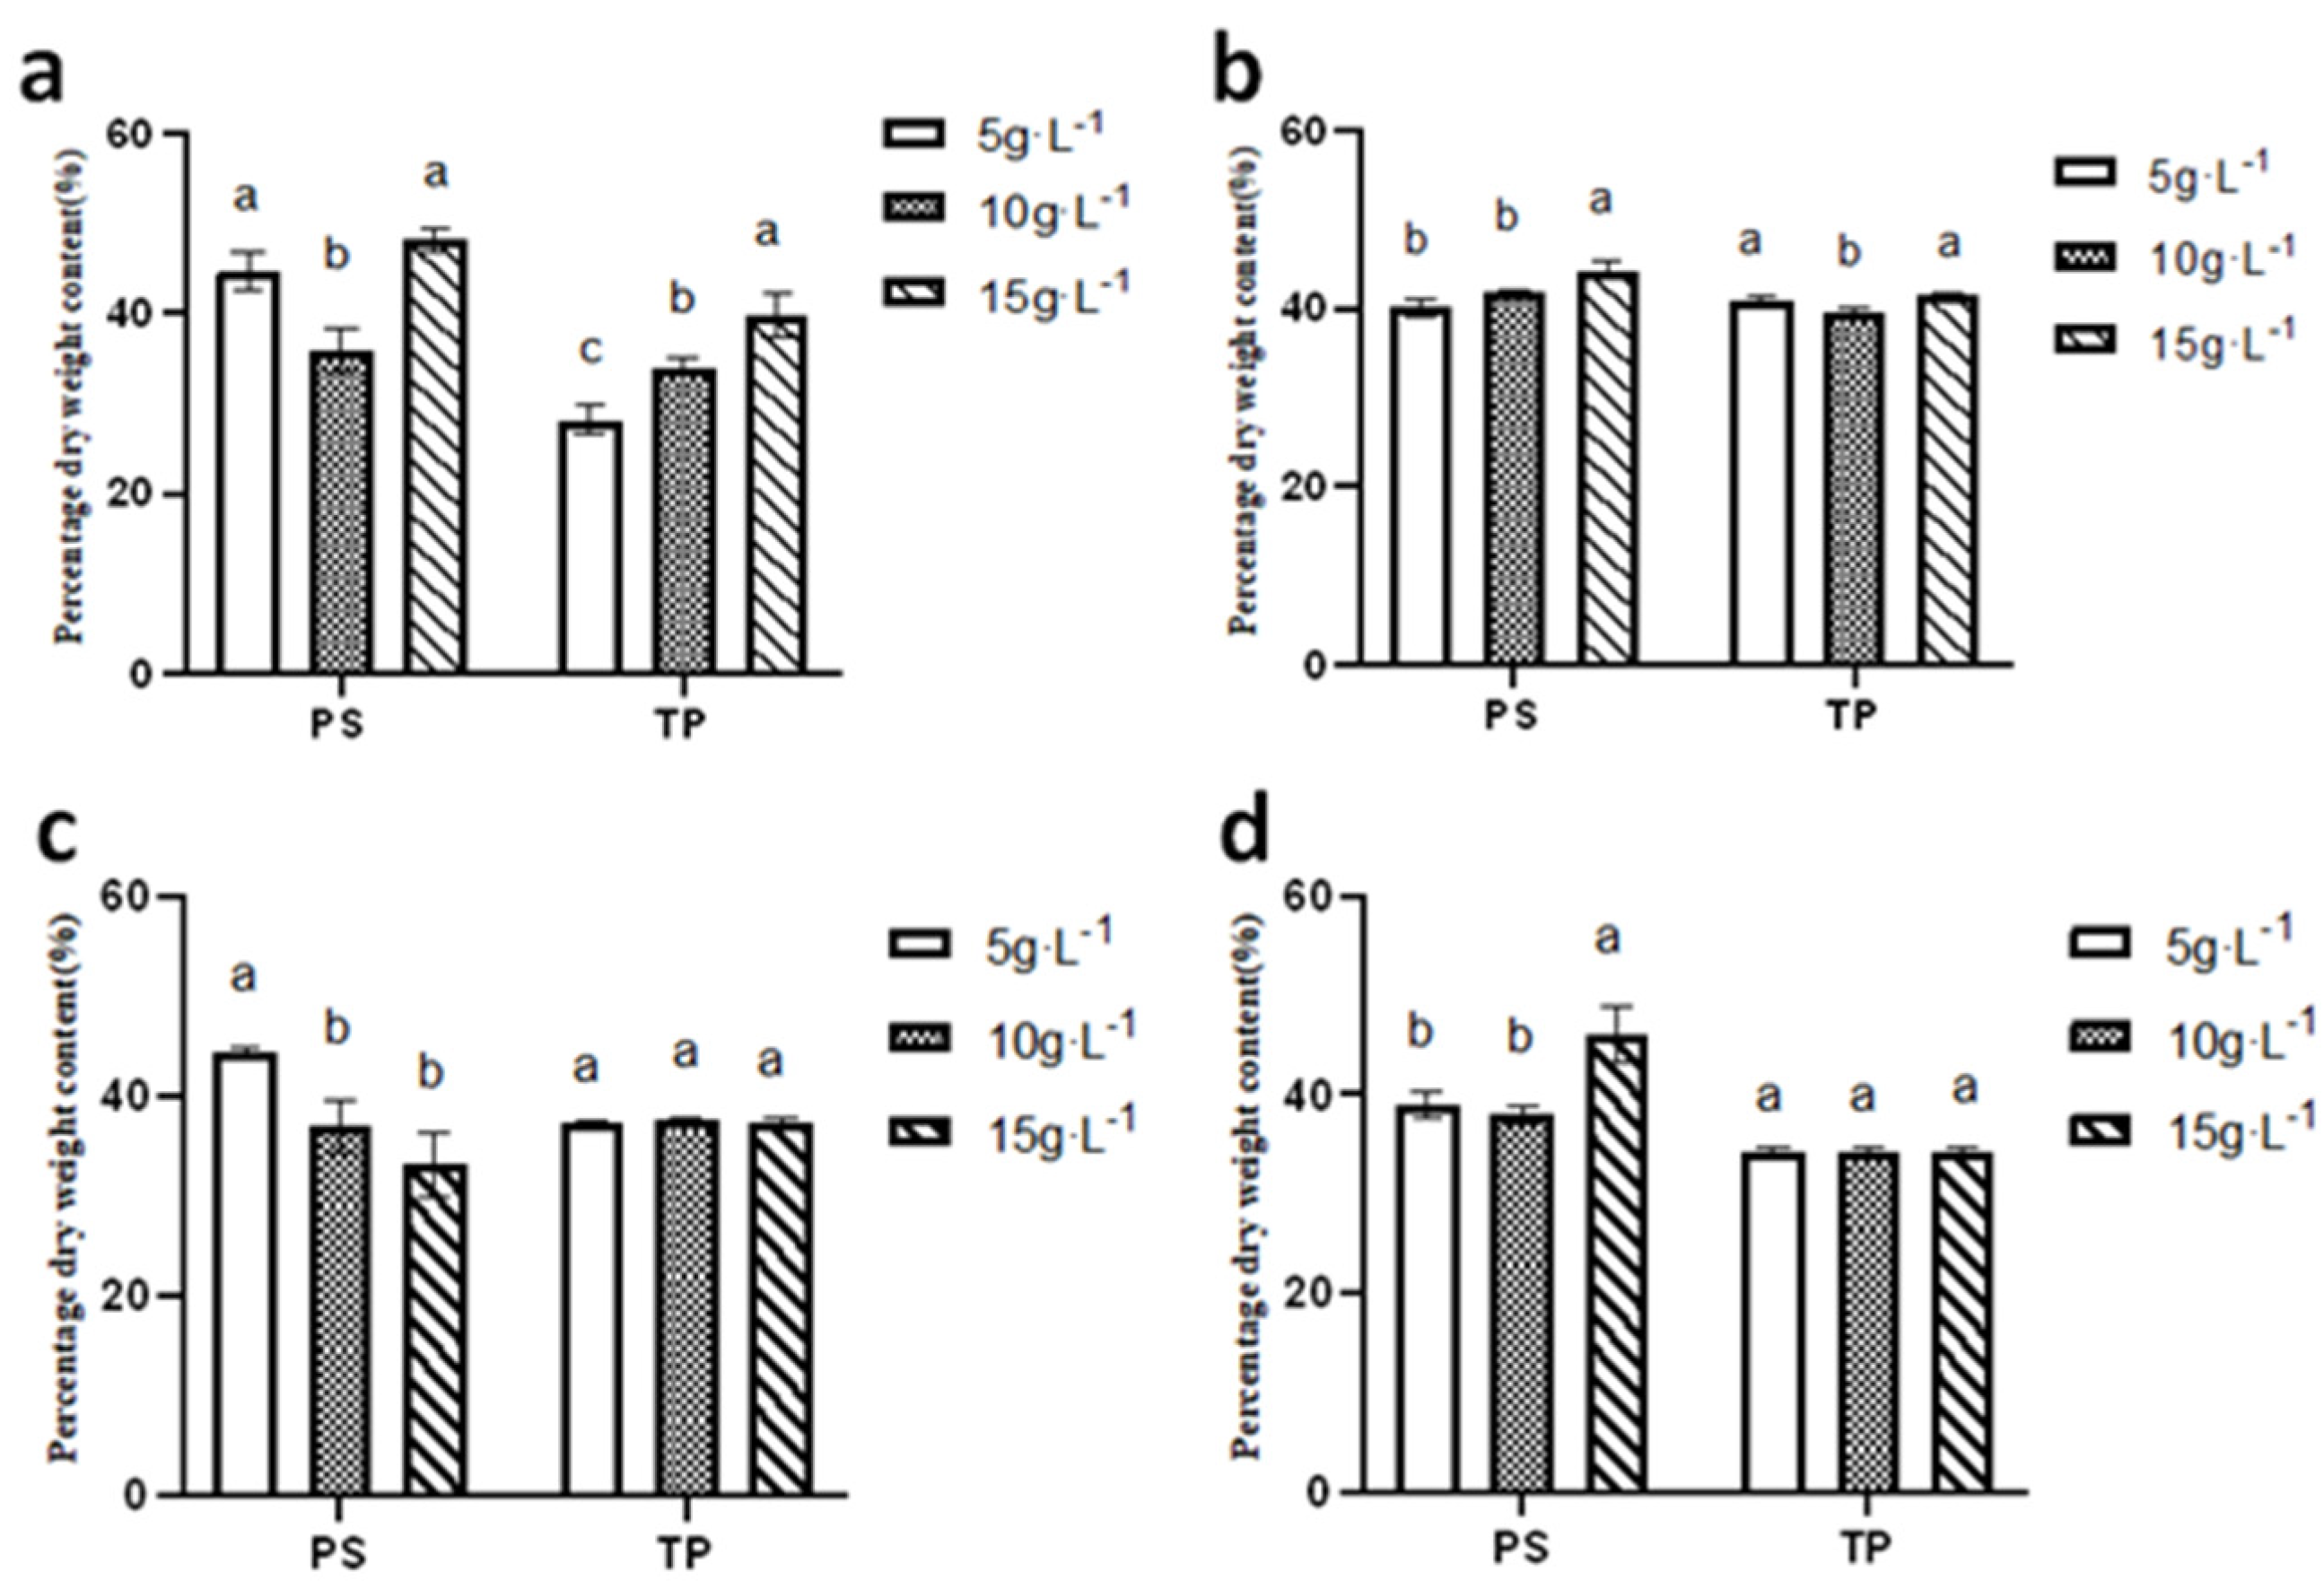
As illustrated in
Figure 13, the polysaccharide content of
N. sphaeroides at inoculation densities of 5 g·L
−1 and 15 g·L
−1 was notably higher in the summer compared to the spring, autumn, and winter seasons, with recorded values of 42.83 ±1.68% and 48.23 ± 1.17%, respectively. In contrast, the highest polysaccharide content at an inoculation density of 10 g·L
−1 was observed in autumn, with a value of 41.79 ± 0.29%.
When considering protein content, the highest levels were observed in autumn across all inoculation densities, with values of 40.87 ± 0.41%, 39.66 ±−0.31%, and 41.44 ± 0.16% for inoculation densities of 5 g·L−1, 10 g·L−1, and 15 g·L−1, respectively. This indicates that autumn conditions are favorable for protein accumulation in N. sphaeroides.
These findings suggest that seasonal variations and inoculation densities significantly influence the biochemical composition of N. sphaeroides, with summer conditions favoring polysaccharide, while autumn conditions support higher protein content. This information is essential for optimizing cultivation conditions to enhance the desired biochemical yields in different applications. Statistical analysis demonstrated season-dependent variations in biochemical composition under different inoculation densities: summer polysaccharide content exhibited significant differences (p < 0.05) among all three densities (5, 10, and 15 g·L−1), while autumn and spring polysaccharides showed distinct divergence (p < 0.05) between the 15 g·L−1 group and lower-density treatments (5 and 10 g·L−1). Winter polysaccharides displayed significant differentiation (p < 0.05) between the 5 g·L−1 group and higher-density groups (10 and 15 g·L−1). Total protein accumulation in summer revealed statistically significant variations (p < 0.05) across all densities, whereas autumn total protein content exhibited significant differences (p < 0.05) between 5 g·L−1 and both 10 g·L−1 and 15 g·L−1 treatments.
3.6.5. Comparison of Texture Properties Across Inoculation Densities and Seasons
As shown in
Table 2, the highest hardness of
N. sphaeroides was observed in autumn at inoculation densities of 5 g·L
−1 and 15 g·L
−1, with values of 153.96 ± 6.02 g and 146.88 ± 3.87 g, respectively. At an inoculation density of 10 g·L
−1, the highest hardness was recorded in spring, with a value of 109.67 ± 6.19 g.
Regarding texture properties, the elasticity and chewiness of N. sphaeroides was highest in spring across all inoculation densities. The elasticity values were 2.86 ± 0.50, 2.54 ± 0.48, and 2.09 ± 0.66 for inoculation densities of 5 g·L−1, 10 g·L−1, and 15 g·L−1, respectively. Similarly, the chewiness values were 112.36 ± 15.73, 120.67 ± 33.62, and 75.96 ± 29.98 for the same inoculation densities.
These findings indicate that seasonal factors, as well as inoculation density, play an important role in determining the texture characteristics of N. sphaeroides, with autumn promoting the highest hardness and spring enhancing elasticity and chewiness. This information is valuable for understanding how different environmental conditions and cultivation strategies influence the textural properties of this organism, potentially impacting its use in various applications. Texture analysis revealed significant seasonal and density-dependent variations in biomechanical properties: N. sphaeroides colonies at 5 and 10 g·L−1 inoculation densities exhibited significant differences (p < 0.05) in hardness across all four seasons, while the 10 g·L−1 group demonstrated distinct seasonal hardness patterns (summer/winter vs. autumn/spring; p < 0.05). Elasticity in spring cultivation showed significant divergence (p < 0.05) from other seasons across all three densities. Adhesiveness variations displayed density-specific seasonality: 5 g·L−1 colonies exhibited significant differences (p < 0.05) between summer/spring and autumn/winter, whereas 10 g·L−1 and 15 g·L−1 groups showed spring- and autumn-specific adhesiveness differentiation (p < 0.05), respectively. Chewiness profiles universally demonstrated significant spring-specific enhancement (p < 0.05) across all inoculation densities compared to other seasons.
3.7. Comparison of Different Methods on the Preservation of N. Sphaeroides
N. sphaeroides harvested in spring was stored for one week under several preservation conditions, including vacuum sealing with aluminum foil and plastic packaging, direct storage at 4 °C, and storage at 4 °C after a 10-min blanching treatment. Additionally, potassium sorbate was added to some of the samples as a preservative to assess its impact on the preservation process (
Figure 14).
After the blanching treatment, the color of N. sphaeroides shifted from dark green to a lighter green. Under the 4 °C storage condition, N. sphaeroides that were directly stored or subjected to blanching showed a noticeable difference in water loss depending on the type of packaging. In both pre-blanching and post-blanching states, the samples packed in aluminum foil exhibited less water loss compared to those packed in plastic. However, when potassium sorbate was introduced, a shift was observed. In this case, the samples stored directly at 4 °C with plastic packaging had a reduced appearance of water loss on the surface, contrasting with the samples in aluminum foil packaging, which appeared to lose more moisture.
When comparing the two types of packaging after blanching, the exterior appearance of N. sphaeroides in both aluminum foil and plastic packaging was quite similar, regardless of whether the preservative was applied. However, a distinct difference in color was noted: the samples in plastic packaging appeared to retain a greener hue than those in aluminum foil. This suggests that the plastic packaging may have better preserved the visual quality of N. sphaeroides, especially in terms of color.
Overall, these findings indicate that the type of packaging material, the application of potassium sorbate, and the blanching treatment all play significant roles in influencing the water loss, color retention, and overall appearance of N. sphaeroides during preservation. These factors could potentially guide future storage strategies for enhancing the shelf life and quality of this organism.
4. Discussion
Throughout the experimental period, the light intensity at 12:00 ranged from 9.9 to 1316.2 μmol·m
−2·s
−1, and the culture temperature fluctuated between 3.7 and 31.3 °C. Wild
N. sphaeroides typically grows between November and May of the following year, with an average temperature of approximately 12.2 °C during this period [
27]. The temperature of the culture medium fluctuated between 3.7 °C and 31.3 °C, while the pH value varied between 7 and 10. During the summer and spring seasons, the dissolved oxygen levels were generally lower, which can be attributed to the higher temperatures in these seasons. The elevated temperatures led to a reduction in dissolved oxygen concentrations, particularly in the warmer months of spring and summer. Under periodic continuous cultivation,
N. sphaeroides is more challenging to cultivate between August and October [
28]. This is because the light intensity and temperature during this period are relatively high, with light intensity ranging from 9.9 to 876.3 μmol·m
−2·s
−1 and temperature ranging from 23.7 to 31.3 °C. Although shading nets can reduce light intensity, the high temperature may cause some colonies to rupture, and water evaporation can reduce the habitable environment. Therefore, it is essential to replenish the culture medium promptly during the cultivation period [
29].
In summer and autumn, the highest average fresh weight productivity per unit volume was achieved at an inoculation density of 10 g·L
−1, with values of 0.26 g·L
−1·d
−1 and 0.31 g·L
−1·d
−1, respectively. In winter and spring, the highest average fresh weight productivity was observed at an inoculation density of 15 g·L
−1, with values of 0.52 g·L
−1·d
−1 and 1.40 g·L
−1·d
−1, respectively. Therefore, the optimal inoculation density for summer and autumn is 10 g·L
−1, while for winter and spring, it is 15 g·L
−1.
N. sphaeroides can maintain photosynthetic activity at temperatures ranging from 5 to 45 °C, but cells will die once the temperature reaches 50 °C. Additionally,
N. sphaeroides can adapt to low-temperature environments, with temperatures around 0 °C. In cultivation experiments,
N. sphaeroides exhibited good growth when the culture temperature was between 10 and 30 °C [
30]. High temperatures are unfavorable for the growth of
N. sphaeroides, which explains why the highest average fresh weight productivity in summer (0.26 g·L
−1·d
−1 at 10 g·L
−1) was the lowest among the four seasons, while the highest average fresh weight productivity in spring (1.40 g·L
−1·d
−1 at 15 g·L
−1) was the highest. The ability of
N. sphaeroides to adapt to a wide range of cultivation temperatures is an advantage for outdoor cultivation. The growth of
N. sphaeroides varied with different inoculation densities. During the summer, winter, and spring seasons, the average colony size decreased with increasing inoculation density. However, in spring, the inoculation density did not lead to a significant increase in the slow growth of the colony diameter. The Fv/Fm values clearly demonstrated that both the inoculation density and the season of cultivation had a noticeable impact on the overall health of the colonies. In summer, the Fv/Fm values were the highest, while in spring, they were the lowest. The higher light intensity and stable temperature in summer contributed to better colony health, with the Fv/Fm value reaching approximately 0.5. In contrast, in spring, the unstable light intensity and temperature led to lower Fv/Fm values, which were as low as 0.2 in some cases.
During the continuous cultivation process, the dry weight content of chlorophyll and carotenoids in
N. sphaeroides was highest in spring. The maximum chlorophyll content was recorded at an inoculation density of 5 g·L
−1, with a value of 0.63 ± 0.02%, while the highest carotenoid content was observed at an inoculation density of 15 g·L
−1, with a value of 0.20 ± 0.61%. This is because shading nets were used in summer, resulting in lower light intensity compared to spring. Light intensity significantly affects the photosynthetic efficiency of algae [
31], thereby influencing the synthesis of photosynthetic products such as sugars and other organic compounds, including proteins and photosynthetic pigments [
32,
33]. The dry weight content of phycocyanin, allophycocyanin, and phycoerythrin was highest in summer, with the maximum values recorded at an inoculation density of 15 g·L
−1, reaching 3.07 ± 0.11%, 1.73 ± 0.03%, and 2.54 ± 0.03%, respectively. Although the light intensity on sunny days in summer was reduced due to shading nets, the nets were opened on cloudy days, and the higher summer temperatures resulted in the highest Fv/Fm values, leading to the highest phycobiliprotein content [
34,
35].
In summer, the polysaccharide content of
N. sphaeroides at inoculation densities of 5 g·L
−1 and 15 g·L
−1 was higher than in spring, autumn, and winter, with values of 42.83 ± 1.68% and 48.22 ± 1.17%, respectively. However, the polysaccharide content at an inoculation density of 10 g·L
−1 in summer was lower than in the other three seasons, with a value of 35.98 ± 2.01%. The highest protein content was recorded in autumn across all inoculation densities, with values of 40.87 ± 0.41%, 39.66 ± 0.31%, and 41.44 ± 0.16% for 5 g·L
−1, 10 g·L
−1, and 15 g·L
−1, respectively. The combined content of protein and polysaccharides in
N. sphaeroides ranged between 70% and 80% across the four seasons, indicating that these are the primary components of its dry matter [
36]. The highest hardness of
N. sphaeroides was observed in autumn at inoculation densities of 5 g·L
−1 and 15 g·L
−1, with values of 153.96 ± 6.02 g and 146.88 ± 3.87 g, respectively. At an inoculation density of 10 g·L
−1, the highest hardness was recorded in spring, with a value of 109.67 ± 6.19 g. The elasticity and chewiness of
N. sphaeroides was highest in spring across all inoculation densities, with elasticity values of 2.86 ± 0.50, 2.54 ± 0.48, and 2.09 ± 0.66 and chewiness values of 112.36 ± 15.73, 120.67 ± 33.62, and 75.96 ± 29.98 for 5 g·L
−1, 10 g·L
−1, and 15 g·L
−1, respectively. Overall,
N. sphaeroides exhibits better texture in spring [
37].
For the preservation of N. sphaeroides, direct storage at 4 °C showed that aluminum foil packaging performed better than plastic packaging. However, when preservatives were added, plastic packaging proved to be more effective than aluminum foil packaging. This indicates that the preservation method, as well as the type of packaging, can significantly impact the quality and moisture retention of the N. sphaeroides during storage, with the addition of preservatives altering the outcome in favor of plastic packaging.


