Article

Thermal Transformation of Coal Molecular Structures and Their Impact on Reactivity in Metallurgical-Grade Silicon Production

1
Faculty of Metallurgical and Energy Engineering, Kunming University of Science and Technology, Kunming 650093, China
2
The Silicon Industry and Engineering Research Center of Yunnan Province, Kunming University of Science and Technology, Kunming 650093, China
3
State Key Laboratory of Complex Nonferrous Metal Resources Clean Utilization, Kunming University of Science and Technology, Kunming 650093, China
*
Author to whom correspondence should be addressed.
Processes 2025, 13(5), 1371; https://doi.org/10.3390/pr13051371
Submission received: 2 April 2025 / Revised: 27 April 2025 / Accepted: 28 April 2025 / Published: 30 April 2025
(This article belongs to the Section Chemical Processes and Systems)

Abstract

:
Coal has been widely used as a reducing agent for metallurgical-grade silicon (MG-Si). As a crucial raw material, the coal selection process represents one of the most critical steps in MG-Si production. However, due to the inherent complexity of coal, there is currently a lack of efficient and accurate methods for screening highly reactive coal in industrial production. This deficiency leads to significant carbon loss and excessive CO2 emissions, ultimately reducing the overall efficiency of industrial processes. To address this challenge, this study selected three types of bituminous coal with different performance characteristics from an MG-Si production plant for investigation. The aliphatic structures of the three coals were 69.85, 43.87, and 37.44%, respectively. The carbon-to-hydrogen ratio (C/H) of the coals exhibited an increasing trend with temperatures over the range of 0–1600 °C. The C/H of the No. 3 coal was the highest at different temperatures, with the highest degree of dehydrocyclization. The degree of ordering also increased with temperature for all three coals. The higher proportion of aliphatic structures in the No. 1 coal led to a long-range disordered microcrystalline structure. The No. 2 and No. 3 coals had higher percentages of aromatic structures and showed short-range ordered spikes. This study systematically investigated the correlation between stacking height (Lc), crystallite diameter (La), and C/H ratio. These results showed that C/H was positively correlated with the degree of ordering, and the correlation coefficient (R2) for La reached 0.87. Additionally, CO2 reactivity tests revealed a significant negative correlation between reactivity and both degree of ordering and C/H. These findings provided insights into the efficient utilization of coal for MG-Si production.

Graphical Abstract

1. Introduction

With the continuous development of silicon alloys, organosilicons, photovoltaics, and other industries, the demand for MG-Si as a basic raw material has been steadily increasing [1,2]. MG-Si is produced through a carbothermic reduction process in submerged arc furnaces, using silica and carbonaceous reductants as the primary raw materials. The overall reaction can be expressed as shown in the following Equation (1):
SiO2 + 2C→Si + 2CO
Coal is widely utilized as a reducing agent in MG-Si production because of its superior reactivity and cost-effectiveness [3]. Coal still accounts for 1/3 of the world’s energy resources and has been widely used in metallurgy [4]. However, owing to the wide variety of coal types, their qualities are inconsistent. The use of low-quality coal results in significant energy losses during smelting, wasting resources and increasing greenhouse gas emissions [5]. Therefore, in the metallurgical industry, optimizing the coal selection process represents an effective approach to achieving cost reduction and efficiency improvement [6,7].
It has been shown that the degree of ordering affects the actual production efficiency of MG-Si by influencing the reactivity of coal [8,9]. With increasing temperature, coal amorphous carbon decreases, aromaticity and average microcrystalline size increase, and reactivity decreases [10,11,12]. Differences in the coal ordering degree are fundamentally due to differences in the molecular structure. Consequently, these two aspects hold equal importance in reactivity research. The degree of ordering is usually characterized by X-ray diffraction analysis (XRD) [13]. XRD is a reliable technique for characterizing carbonaceous materials with microcrystalline structures [14]. Wang et al. [15] studied the growth of the microcrystalline structure of coal semi-coke with respect to temperature. Appiah et al. [16] explained the increase in aromaticity and orderliness of coal during the heating process. Yao et al. [17] determined the microcrystalline structural parameters and degree of graphitization before and after coal pyrolysis using XRD. XRD is suitable for characterizing the degree of orderliness of coal after pyrolysis, but there are limitations in distinguishing raw coal by XRD due to its disorder. Nuclear magnetic resonance (13C-NMR) spectroscopy can effectively characterize the molecular structure of coal [18]. 13C-NMR effectively quantifies the chemical structure of coal using the CPMAS method [19]. This is an essential method for studying the molecular structure of coal and constructing molecular models [20,21,22]. The atomic ratio of hydrogen to carbon can reflect the molecular composition of coal to a certain extent [23]. It is important for evaluating and predicting the physical and chemical properties of coal. Liu et al. [24] quantified the individual carbon components of coal’s molecular structure and corrected the hydrogen and carbon atom ratios. This revealed a connection between the organic elements and molecular composition. Chelgani et al. [25,26] established a connection between organic elements and some structural parameters using multivariate regression.
In this study, three types of coal exhibiting distinct performance characteristics for MG-Si production were selected for investigation. Characterization of the molecular structures of three coals using 13C-NMR was performed. The pyrolysis processes of the three coal samples were investigated using thermogravimetry–differential scanning calorimetry (TG–DSC). This study investigated the variation patterns of carbon (C) and hydrogen (H) content as well as the C/H atomic ratio in coal using EA. The degree of ordering of the three coals after treatment at different temperatures was determined by XRD. Finally, the reactivity of the three coals was verified based on the reactivity of coal to CO2. This finding provides a new perspective for the characterization of the degree of ordering and the evaluation of the reactivity of coals.

2. Materials and Methods

2.1. Materials

In this study, the three coal samples were obtained from a mining area in Guizhou, China, all classified as bituminous coal, and were utilized by a factory for MG-Si production. The three selected coal samples demonstrated a performance trend in the actual yield of MG-Si in the order of 1 > 2 > 3. Proximate and final analyses of the three raw coal samples are presented in Table 1.

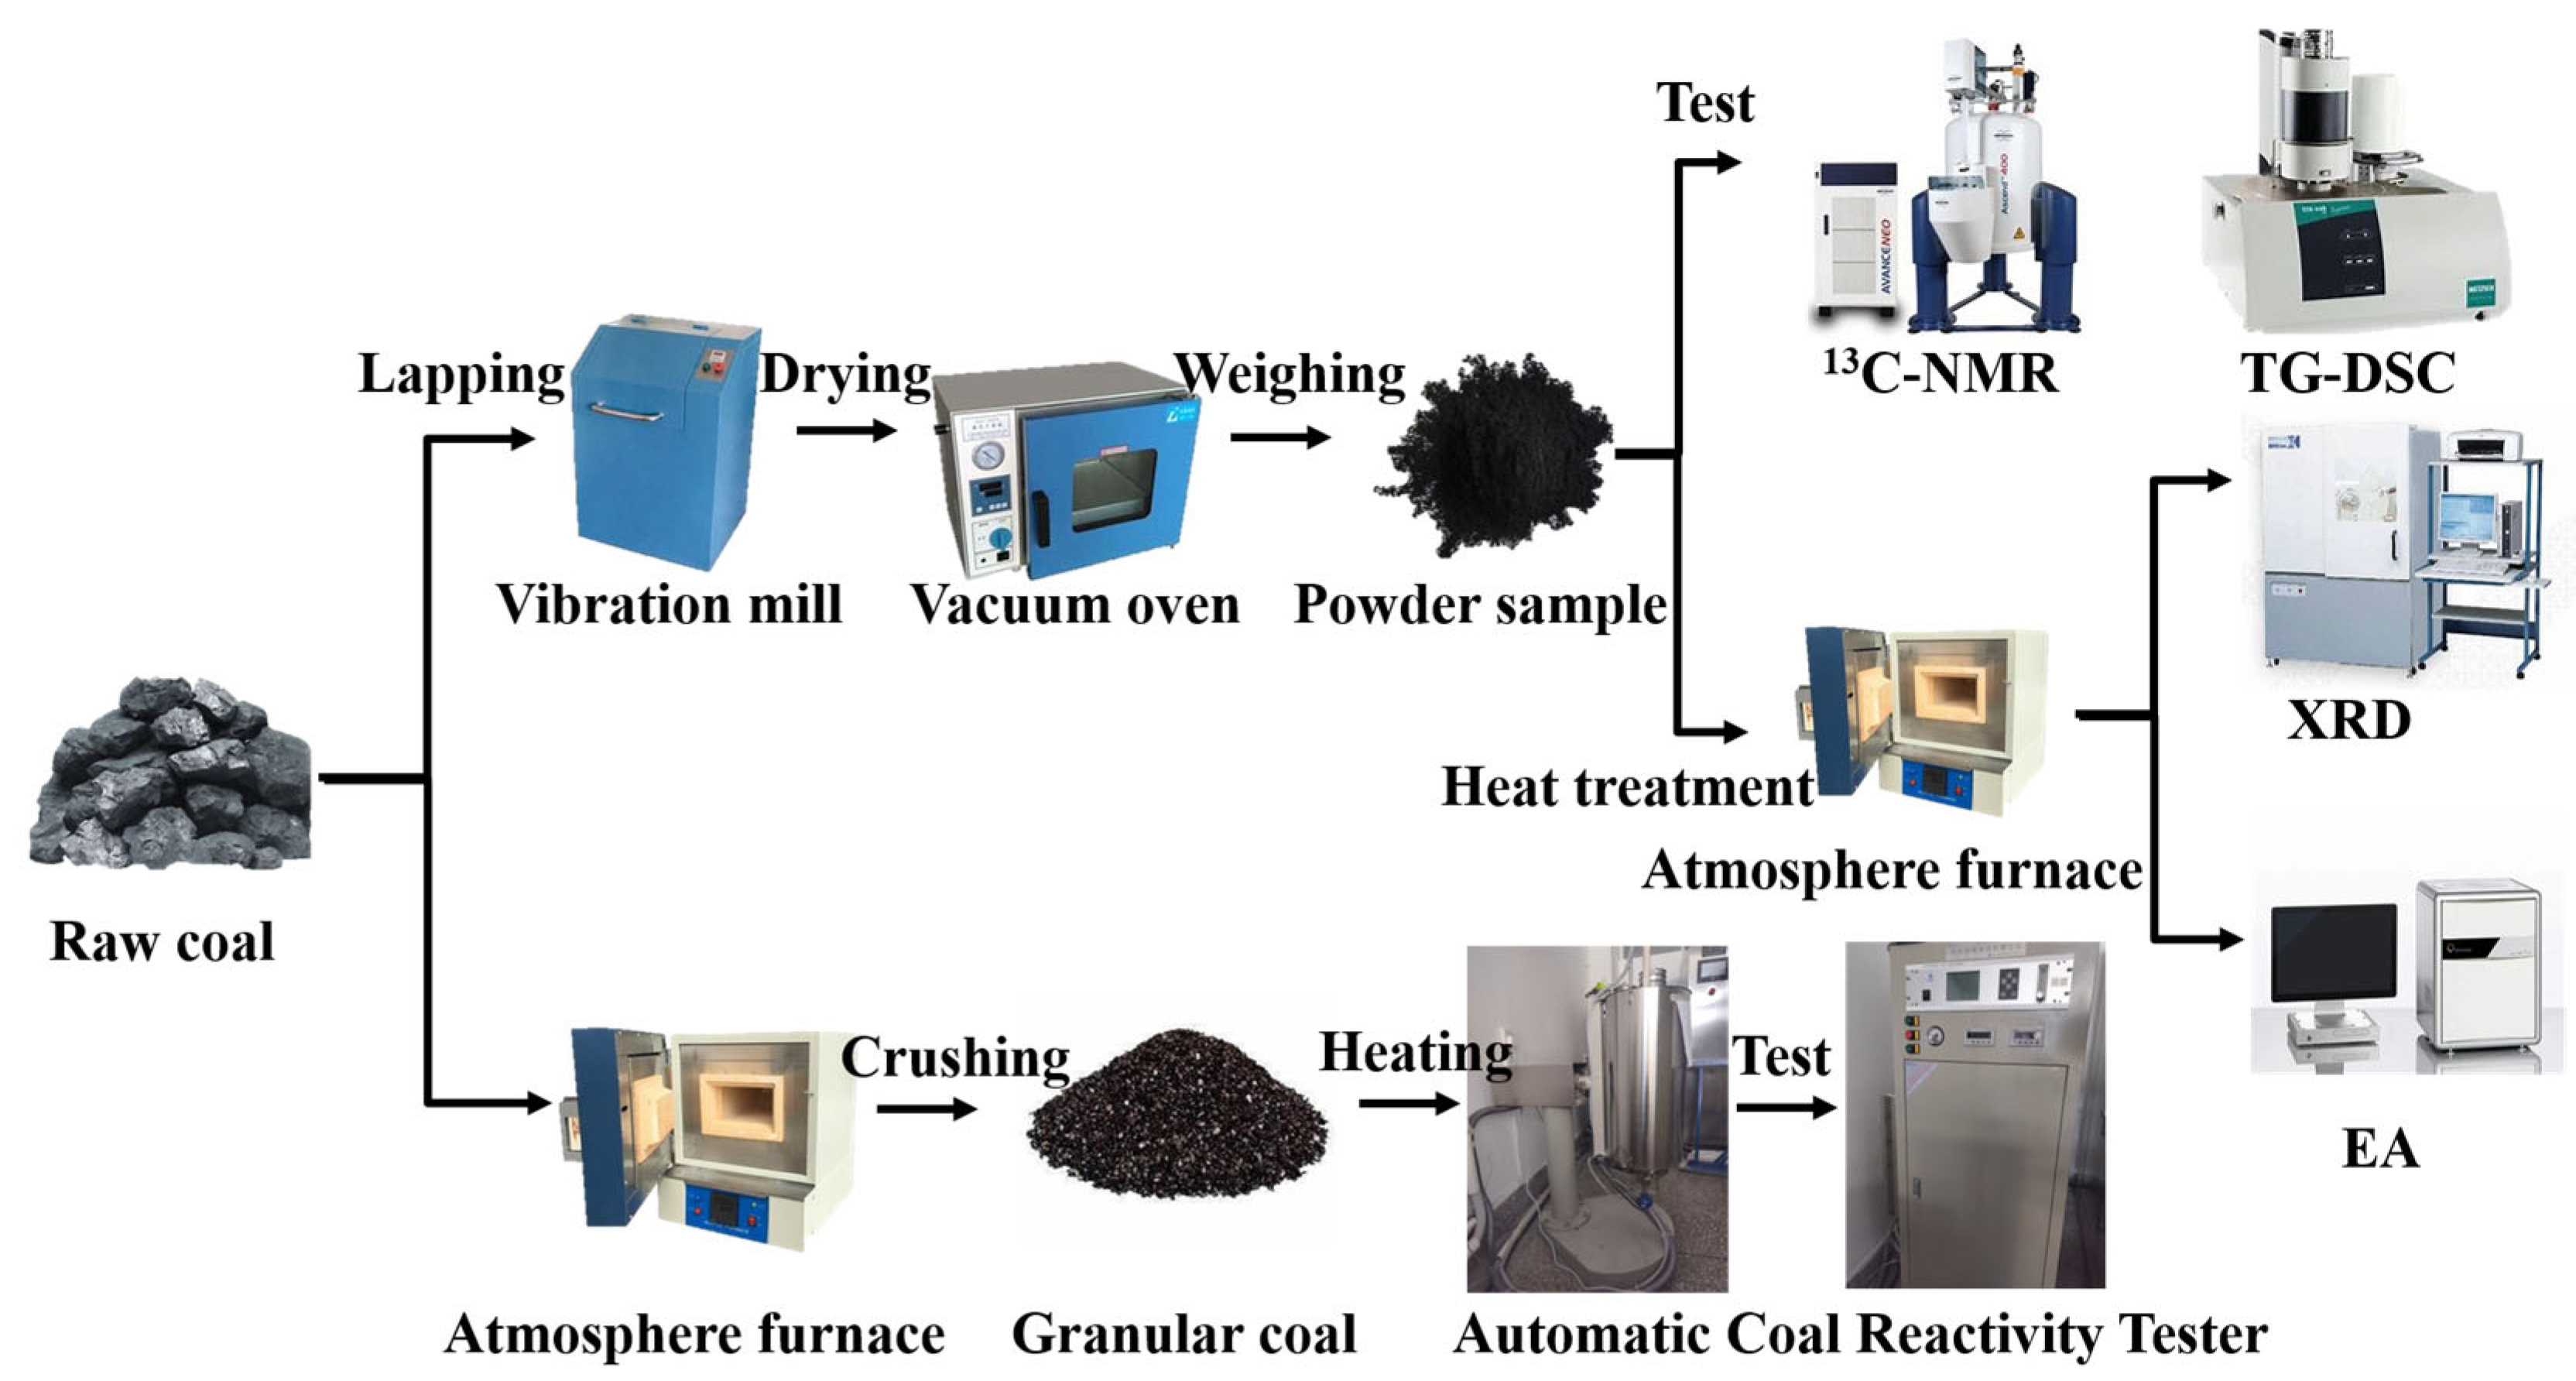
2.2. Experimental Procedure

The experimental procedure is schematically illustrated in Figure 1. Raw coal samples were initially processed through mechanical pulverization and oven drying at 120 °C to obtain powder samples. A subset of these powdered samples was directly subjected to analytical characterization. Another portion underwent programmed thermal treatment in an atmosphere furnace prior to subsequent analyses. Furthermore, selected thermally treated samples were mechanically crushed and sieved to obtain granular samples (3–6 mm particle size distribution). The reactivity of these granular coal specimens was systematically evaluated using an Automatic Coal Reactivity Tester.

2.3. Analysis and Characterization

Particle size has a significant influence on the physicochemical properties of coal. Three experimental coal samples were obtained through a standardized process of crushing, grinding, and precise sieving (125–147 μm) during sampling. This approach was adopted to minimize the impact of particle size variability on the experimental results.

2.3.1. 13C-NMR

A solid-state cross-polarization/magic angle spinning (CP/MAS) experiment was carried out using an Agilent 600 DD2 spectrometer (Agilent (Santa Clara, CA, USA)), magnetic field strength 14.1 T) with a Larmor frequency of 150.72 MHz for 13C. The experiment used a 4 mm double-resonance 1H-X MAS probe with an MAS frequency of 8 kHz and proton decoupling (TPPM) during acquisition. The experiment used a relaxation delay of 3 s, a cross-polarization (CP) contact time of 2 ms, an approximately 90-degree pulse (4.2 us), and 1024 scans. The 13C signal of Adamantane at 38.4 and 29.5 ppm was used as the reference of 13C chemical. The spectral data were deconvoluted using Origin (v2021) software to resolve overlapping peaks, followed by the semi-quantitative analysis of carbon-specific structural indices derived from the fitting parameters.

2.3.2. TG–DSC

The thermogravimetric–differential thermal properties of the three coals were analyzed using a simultaneous thermal analysis device TG–DSC, Netzsch (Selb, Bavaria, Germany) STA449 F3. The three coals were heated up to 1500 °C at a heating rate of 10 °C·min−1 under argon atmosphere. Given the progressive nature of coal pyrolysis, a controlled heating rate of 10 °C·min−1 was employed to significantly reduce measurement uncertainties.

2.3.3. EA

Elemental analysis of the three coals was performed using an Elementar (Hanau, Germany) Vario EL cube organic elemental analyzer (EA). The analysis mode was the CNHS mode. Before conducting EA, all coal samples were preconditioned through vacuum drying at 120 °C for 12 h to achieve complete moisture removal. This rigorous dehydration procedure significantly reduced measurement uncertainties associated with water interference. The EA test was conducted using a repeated measure design, and the final result was derived from the mean value of two independent measurements.

2.3.4. XRD

The coal samples were examined using a Rigaku (Tokyo, Japan) SmartLab SE X-ray diffractometer. The structural heterogeneity of coal results in significant interference from disordered aliphatic γ-bands on the (002) diffraction peak. The peak deconvolution technique in Origin was employed to isolate the disordered γ-band. The peak positions, intensities, and full width at half maximum (FWHM) were determined through multiple peak-fitting procedures. These parameters were subsequently utilized to calculate the following structural characteristics as shown in Equations (2)–(4) [27]:
d002 = λ/2 sinθ002
La = 1.84λ/(β100cosθ100)
Lc = 0.89λ/(β002cosθ002)
where d002 is the shortest distance between two neighboring carbon atoms in the same carbon layer. La is the average width of the graphite crystal direction, and Lc is the thickness of the stacked graphite crystal direction. The wavelength of the X-rays (λ) is 0.15405 nm, and θ002 and θ100 are the diffraction angles corresponding to the positions of the 002 and 100 peaks, respectively. β002 and β100 are the full width at half maximum (FWHM) corresponding to the 002 and 100 peaks, respectively.

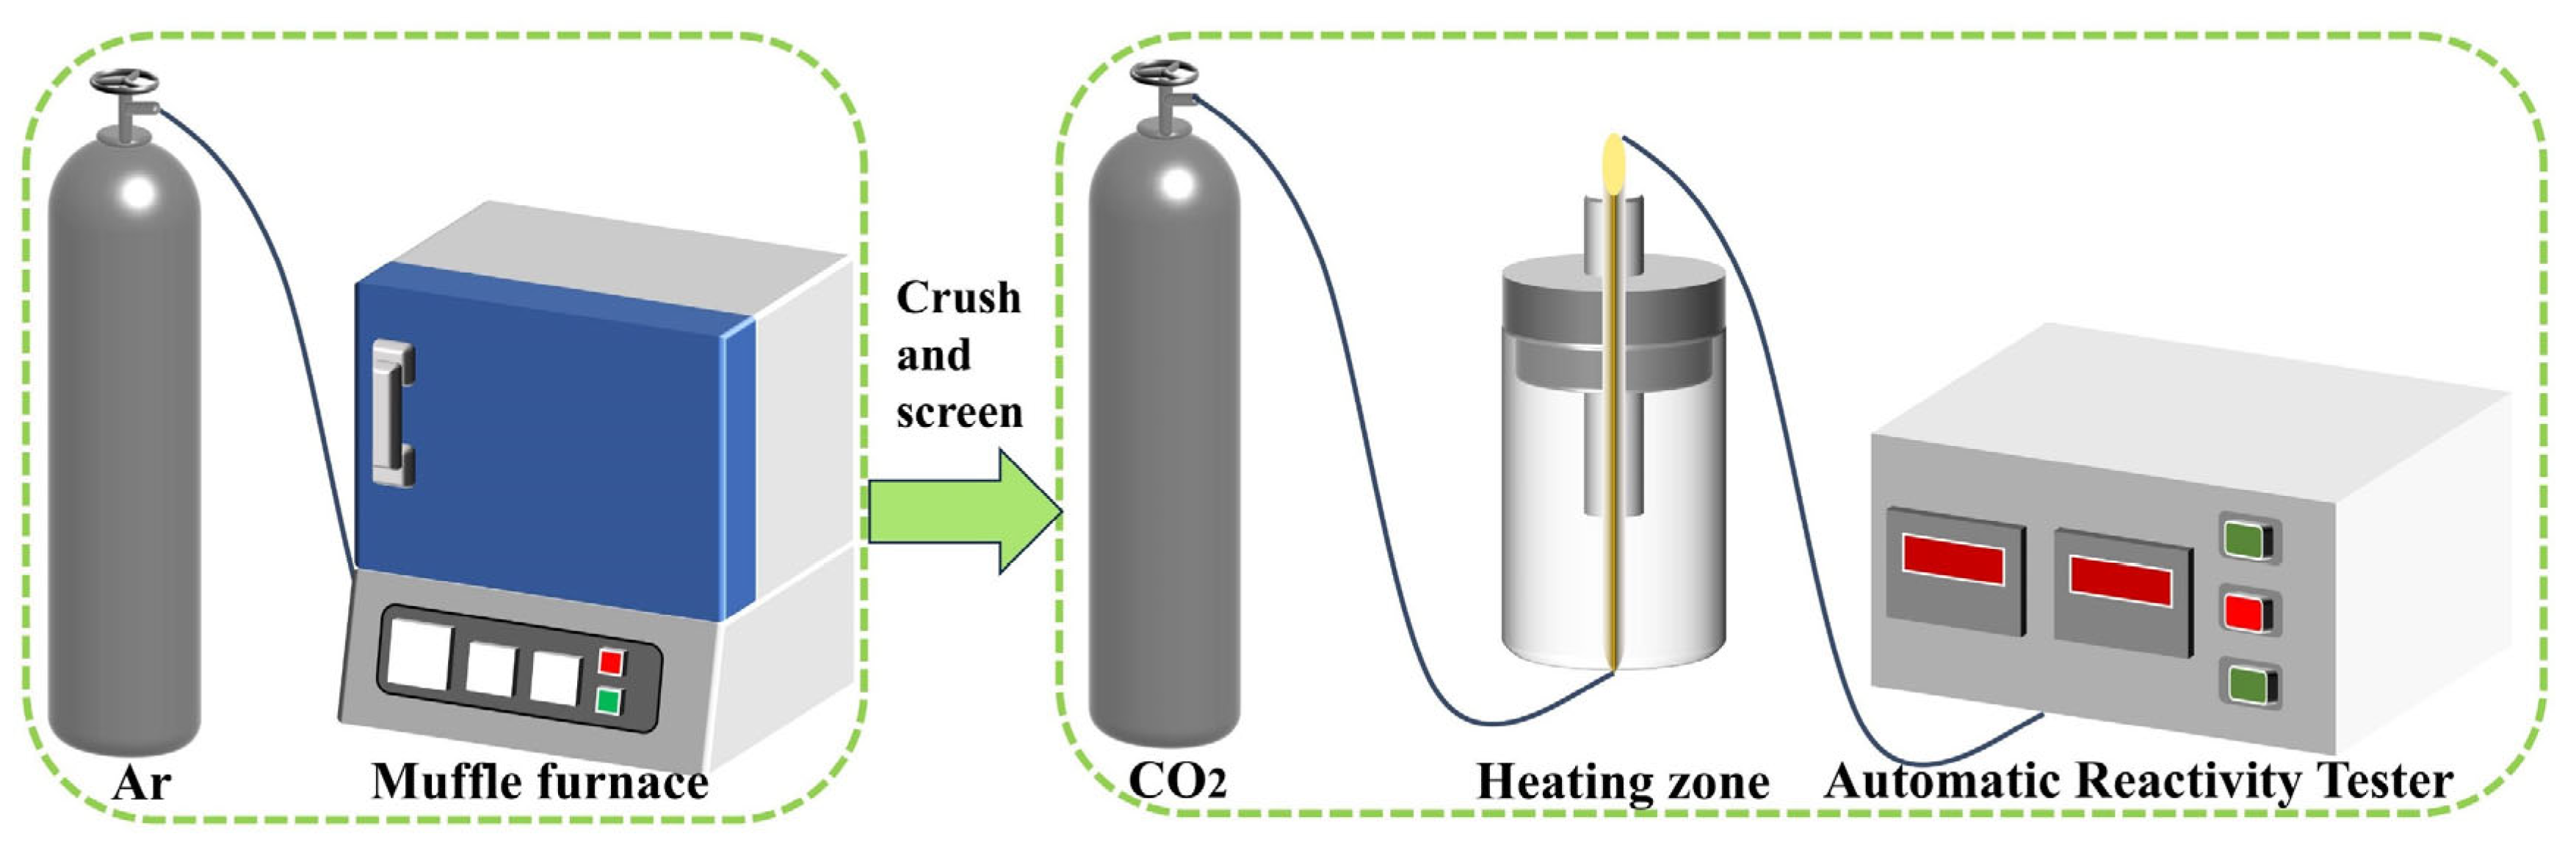
2.4. Experiments for Measuring the Reactivity of Coal to CO2

The reactivity of coal can be expressed by the rate of reduction of CO2 by C under specific conditions [1,28], as shown in the following Equation (5):
C + CO2 →CO
The experimental steps are illustrated in Figure 2. Since carbonaceous reductants participate in reactions at approximately 1567 °C during metallurgical-grade silicon (MG-Si) production [29]. A temperature of 1600 °C was selected as the maximum experimental temperature in this study. The coal samples were thermally treated in a muffle furnace (argon atmosphere) at temperatures of 900 °C, 1300 °C, and 1600 °C for 1 h, respectively, to remove volatile matter and produce coal char. After crushing and sieving, coal coke samples with particle size of 3–6 mm were obtained. The particle size of each type of coal was strictly controlled within the range of 3–6 mm to eliminate the influence of particle size on reactivity. We loaded 20 g coal samples into the heating zone of a TMH-0305 Automatic Coal Reactivity Tester’s tube furnace and packed corundum fragments into the remaining tube space. The concentration V (%) of CO2 in the reacted gas was determined by passing CO2 at a constant rate of 500 mL·min−1 for 2.5 min at intervals of 50 °C within 750–1300 °C. The conversion of CO2 at this temperature, α (%), was calculated using the following Equation (6):
A = [100 × (100 − q − V) × (100 − q)−1 × (100 + V)−1] × 100
where q is the impurity gas content in the CO2 cylinder, and q = 0.001 in this study.

3. Results and Discussion

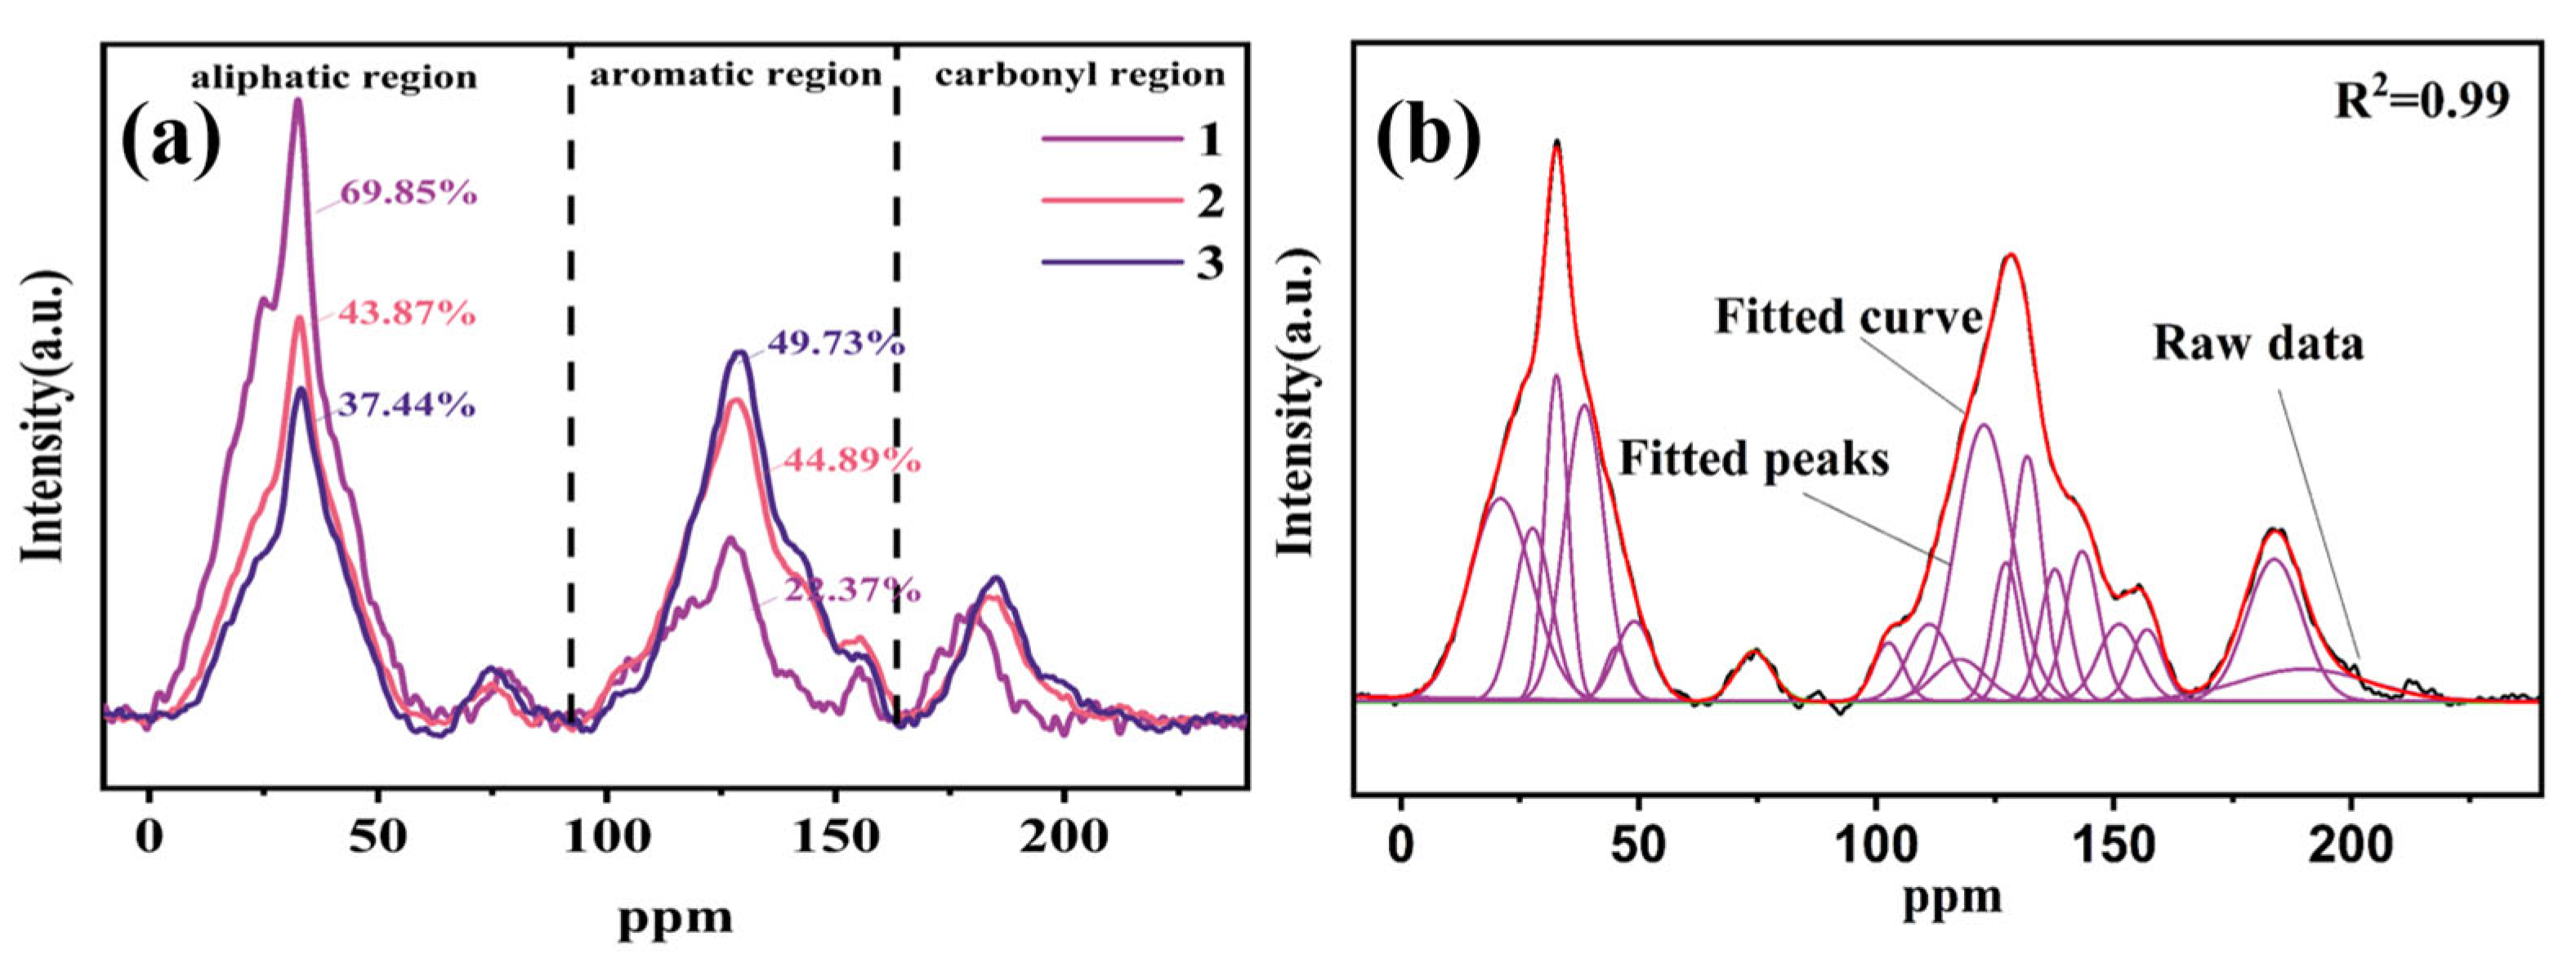
3.1. 13C-NMR Studies on the Molecular Structure of Coal

13C-NMR is an effective method for characterizing the molecular structure of coal. The 13C-NMR spectra of the three raw coal samples are shown in Figure 3a. There were three obvious absorption peaks in the spectra, as follows: (1) 0–90 ppm corresponds to the absorption peaks of aliphatic carbon; (2) 100–165 ppm corresponds to the absorption peaks of aromatic carbon; and (3) 165–225 ppm corresponds to the absorption peaks of carboxyl and carbonyl groups. There were no significant differences in the carbonyl and carboxyl peaks between the three coals. The difference was mainly in the aliphatic and aromatic peaks, with the ratio of aliphatic being 1 > 2 > 3 and the ratio of aromatics being 3 > 2 > 1. Coal No. 1 had the lowest aromaticity and was the most abundant aliphatic group. Because coal is a non-homogeneous and complex macromolecular substance, the 13C-NMR spectra of the three coals were fitted to the peaks. Figure 3b and Table 2 show the peak distributions for Coal No. 2 and some of the important structures of the three coals. The aliphatic structures of the three coal samples accounted for 69.85, 43.87, and 37.44%, respectively. This indicated that the organic composition of the No. 1 coal contains a more developed aliphatic structure, while the No. 2 and No. 3 coals have higher aromaticity.
The forms of all the organic carbon elements present in the coal were obtained by 13C-NMR measurements. All carbon-containing structures were analyzed according to the results in Table 2. The elemental H content influences the molecular composition of coal. Among the functional groups related to the composition of elemental H, hydroxyl groups account for approximately 50% of oxygenated carbon [30], and aldehyde groups account for approximately 50% of fC=O [31]. The following relationship between C and H atoms in coal exists, as shown in Equation (7) [24]:
H = 3 (fal3 + far3) + 2 fal2 + (fal1+ fαH) + (falO+ fC=O)/2
where fal3 is aliphatic methyl; far3 is aromatic methyl; fal2 is methylene; fal1 is methyne; fαH is protonated aromatic carbon, and falO is oxy-aliphatic carbon.
The C/H ratios (C/H) were calculated to be 0.59, 0.87, and 1.03 for the No. 1, No. 2, and No. 3 coals, respectively. The results indicated that the No. 1 coal had a lower C/H, with an average of more hydrogen atoms on each carbon, which is related to the well-developed aliphatic structure. Coal No. 3 had the largest C/H ratio and highest degree of aromaticity. The composition of organic elements can reflect the organic structure of coal to some extent. The relative contents of C and H reflected the aromaticity of coal to a certain extent, which may affect the degree of ordering and reactivity during coal pyrolysis.

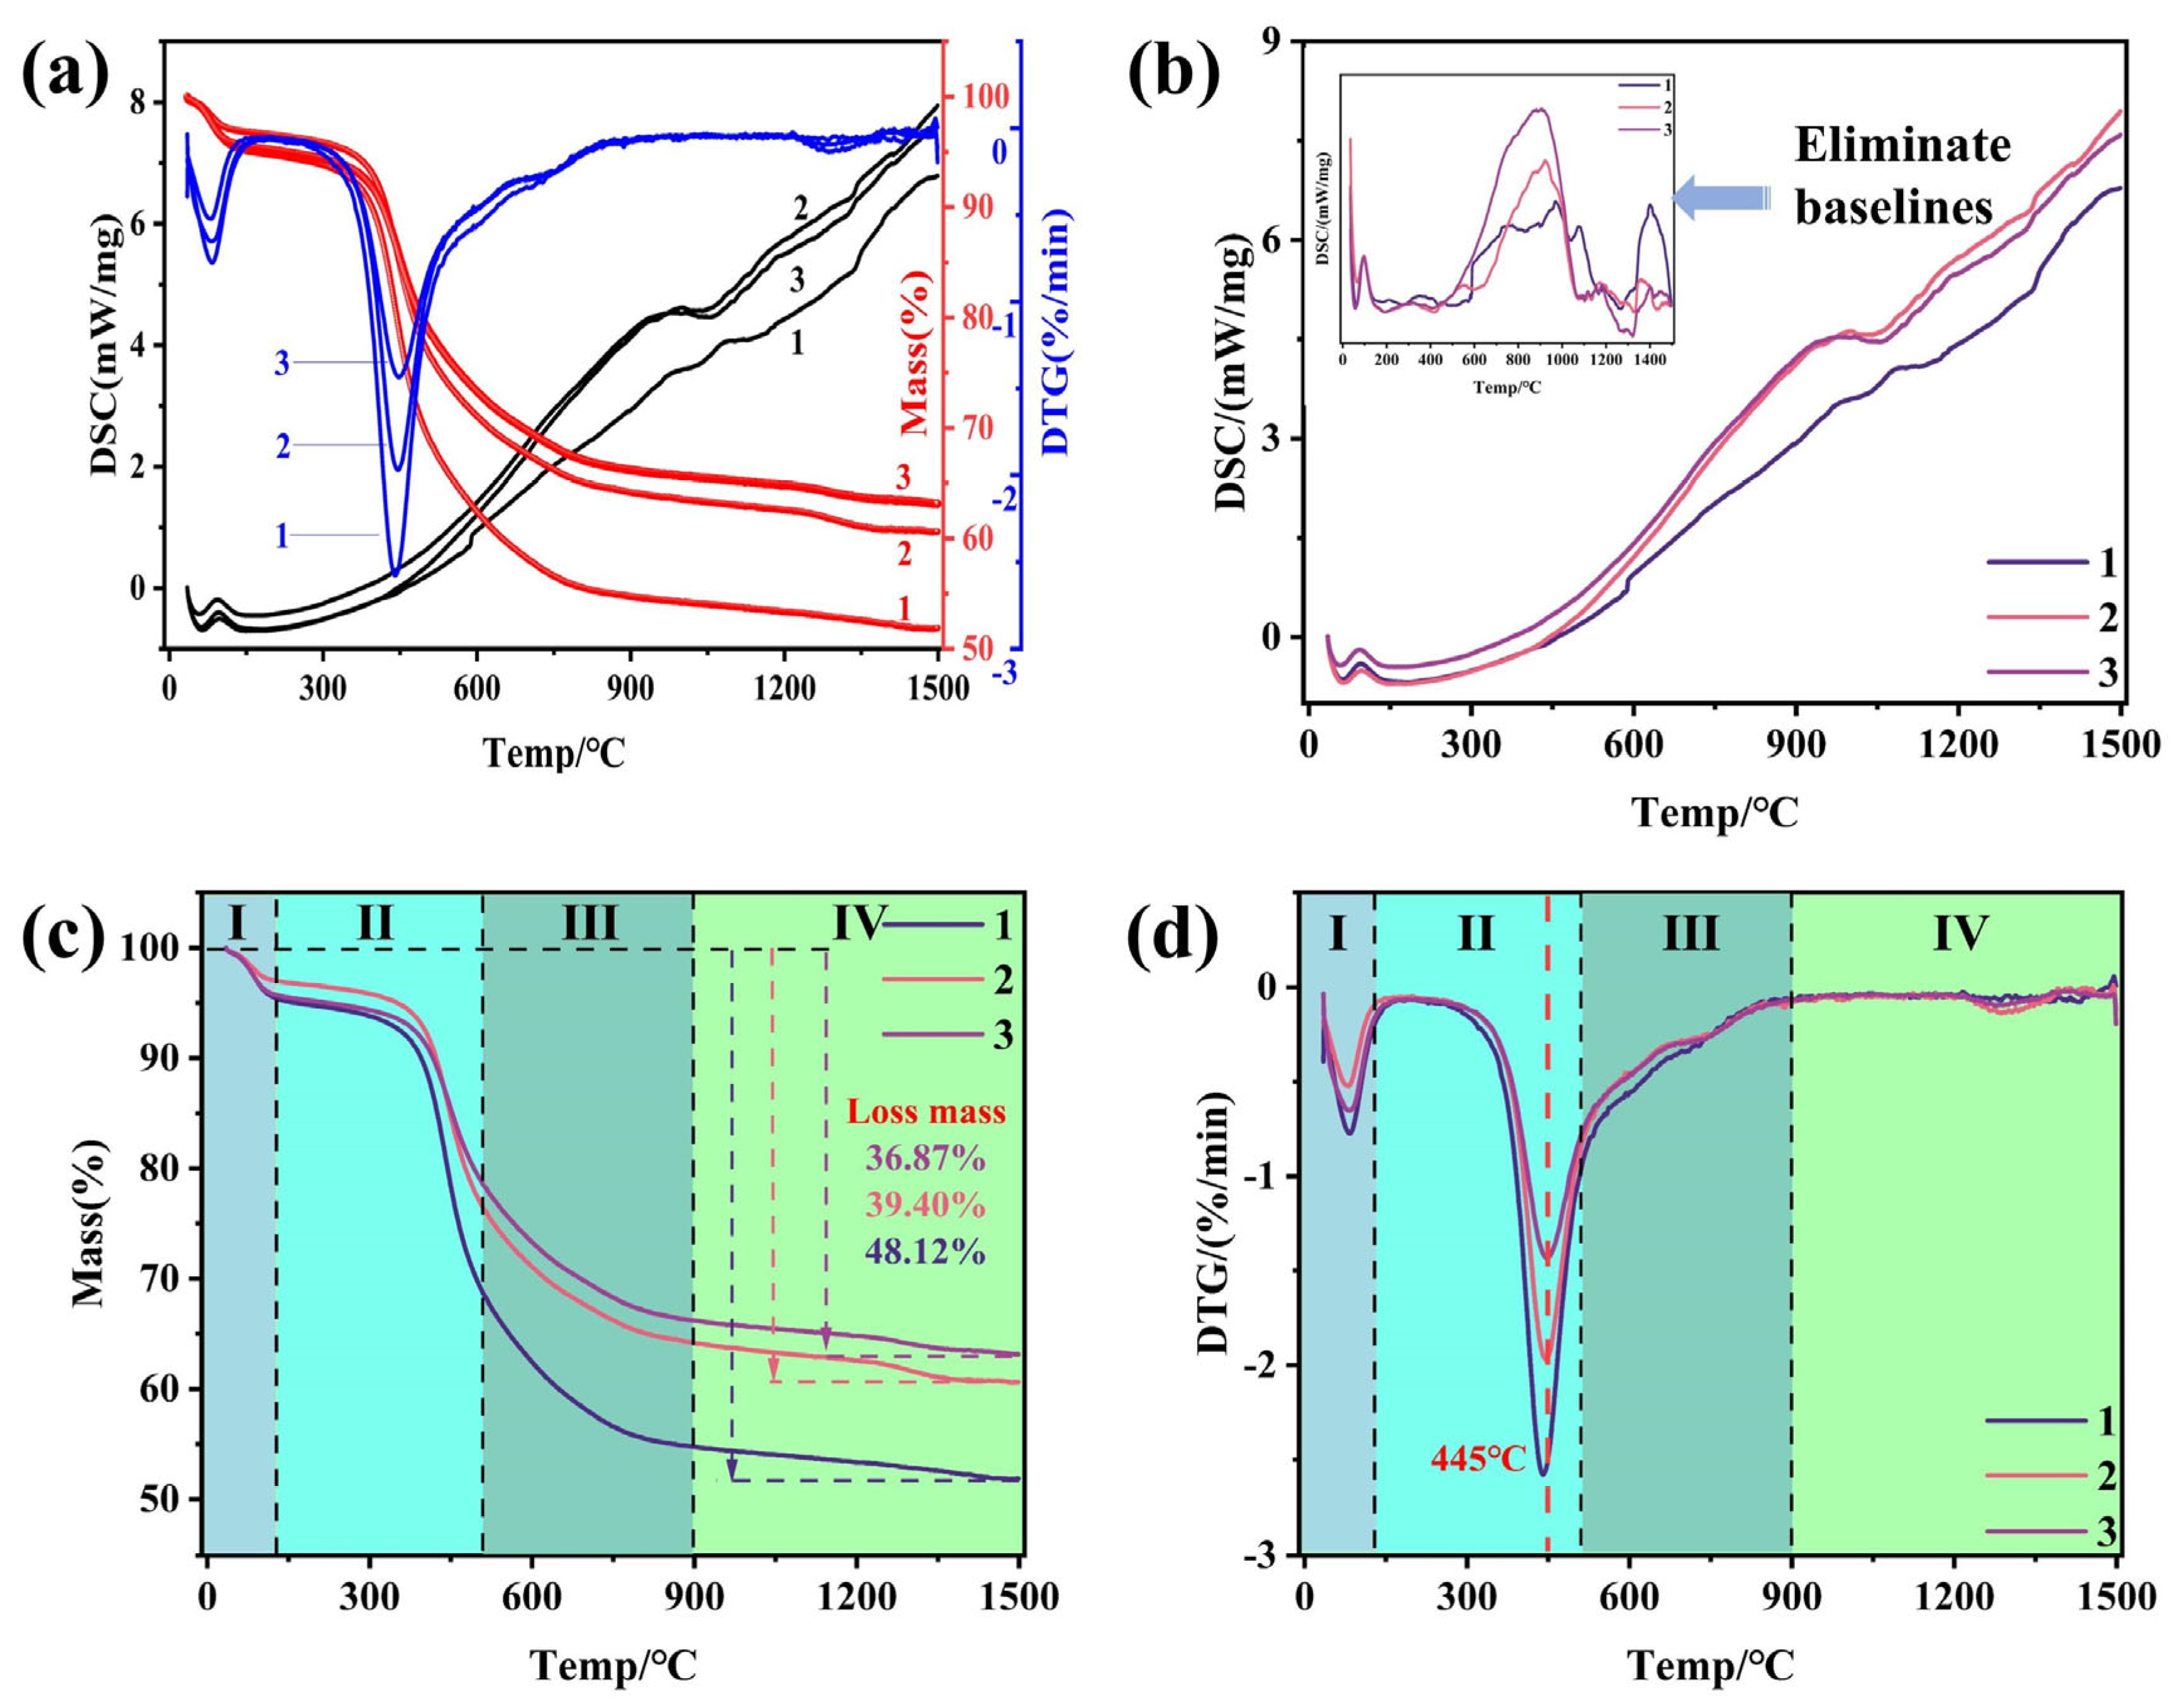
3.2. The Pyrolysis Process of Coal

Because MG-Si production is carried out at high temperatures, processes such as pyrolysis and graphitization of the coals occur with increasing temperature. This significantly affected the physicochemical properties and production results. In order to study the differences in the pyrolysis processes of the three coals, the TG–DSC test was performed under the same conditions, and the results are shown in Figure 4. The DSC curves of coal fluctuated throughout the pyrolysis process. After removing the baseline, different peaks appeared at various temperatures owing to pyrolysis and the reaction of coal during heating. The coal pyrolysis process can be divided into four stages, which are represented by I, II, III, and IV in Figure 4c,d. The first stage was the water removal stage, and the DSC also exhibited an endothermic dehydration peak in this stage [32]. The main pyrolysis stage of coal occurs around 500 °C, which removes small molecules from coal at a high speed [33]. Obviously, the pyrolysis rate and weight loss of the No. 1 coal were higher than those of the No. 2 and No. 3 coals. The third stage is 500–900 °C. At this stage, pyrolysis of residual small molecules and partial polycondensation reactions occur [34]. The differences in the pyrolysis curves of the three coal samples at this stage further expanded. The weight loss rates of the three coal samples were significantly reduced after 900 °C, indicating that the coal had basically removed volatile matter at 900 °C. The fourth stage was 900–1500 °C, as the high-temperature pyrolysis stage of coal, the condensation reaction mainly occurred in the coal. The weight loss peak around 1300 °C might be related to the removal of small molecules such as H2 and CH4 [35]. Simultaneously, the coal underwent graphitization. The degree of ordering increased rapidly, and the change in weight during this process was small. The total weight loss rates of the three coals were 48.12, 39.4, and 36.8%, respectively. The weight loss rate of the No. 1 coal was significantly higher than those of the No. 2 and No. 3 coals.

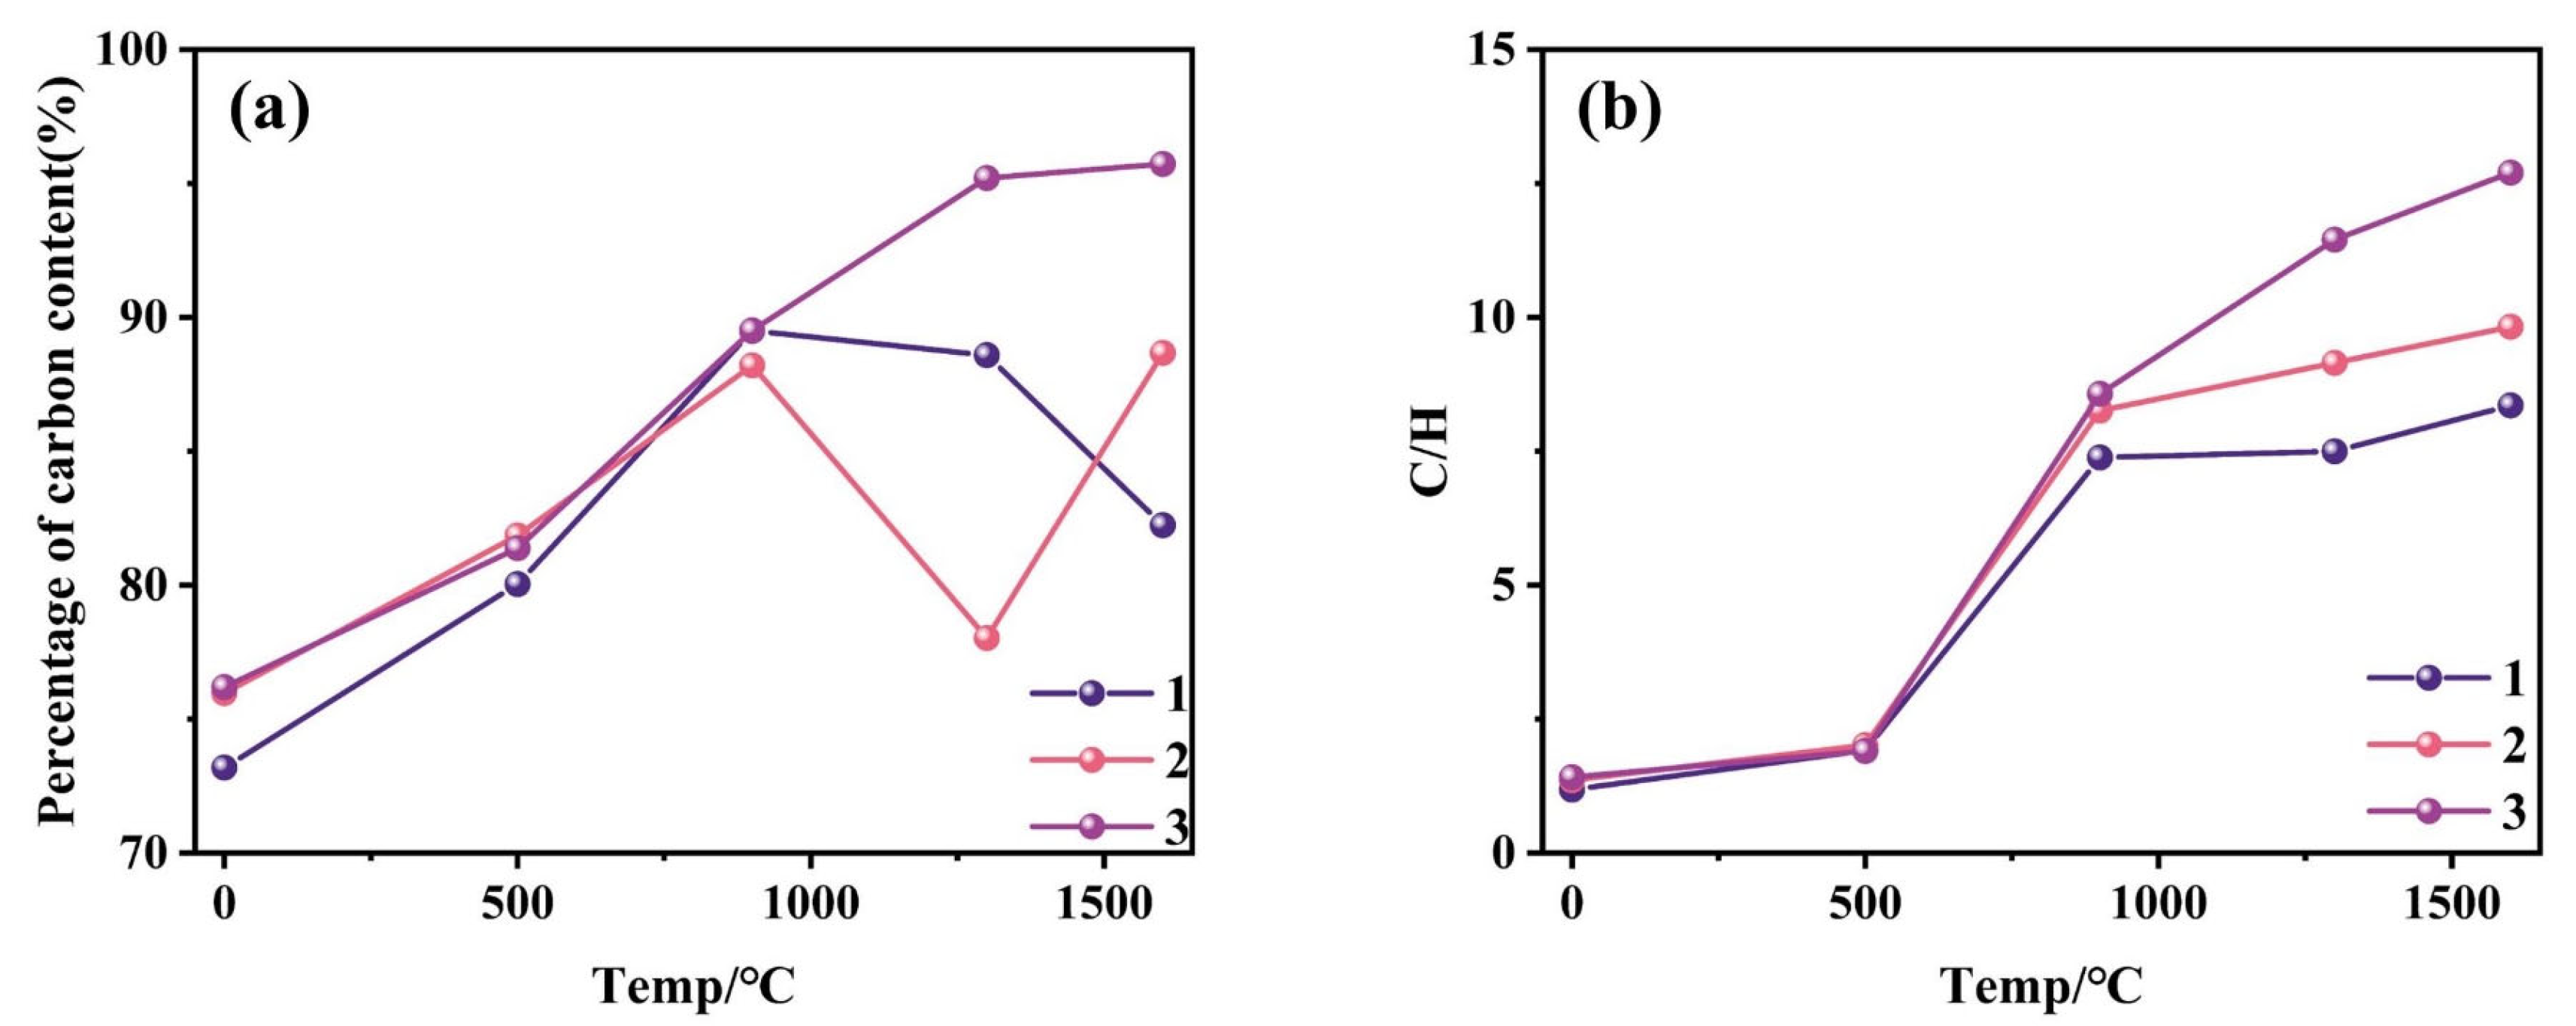
3.3. Organic Elemental Composition of Coal

Characteristic temperature points were selected according to the TG–DSC results. The organic element analysis was carried out after heat treatment to determine the contents of C and H, and the results are shown in Table 3. Hydrogen exhibited a decreasing trend with increasing temperature. Carbon content showed an increasing trend with temperature. However, the percentage of C and H fluctuated after the high-temperature treatment because the coal powder used for the test contained different degrees of ash and other elements. In general, the increase in C and decrease in H were mainly due to the fact that the pyrolysis process of coal is a continuous process of aromatization and the removal of small molecules. The organic elemental analysis results for the raw coal included the volatile fraction that was pyrolyzed. It contained a large number of small molecules such as alkanes; thus, the H content of the raw coal was high. After heat treatment at 500 °C, some volatile matter was removed first, and the content of H in the remaining matrix decreased. The removal of volatile matter was basically completed at 900 °C [36]. Therefore, the decrease in H content between 900 °C and 1600 °C was low, and the decrease in the H element in this stage was mainly related to aromatization.
The percentage of C and the variation in C/H with the temperature of the three coals are shown in Figure 5a,b. The percentage of C showed an increasing trend with temperature. However, owing to the influence of ash and other elements, the percentage of C fluctuated to a certain extent. All three coal samples C/H were positively correlated with temperature, and the trends of C/H with temperature were very similar for the three coal samples. Although carbon was affected by the fluctuation, the same effect on hydrogen made C/H less affected, resulting in a more stable C/H pattern. All water and some volatiles were removed at 0–500 °C, and C/H showed an increasing trend. In the 500–900 °C stage, the coal underwent pyrolysis to remove volatile matter, and all three coals showed a sharp increase in C/H. The growth trends of the No. 2 and No. 3 coals were slightly higher than that of the No. 1 coal. In the 900–1600 °C stage, the graphitization reaction of dehydrocyclization occurred, the C/H increased, and the C/H growth rate of the No. 3 coal was always higher than that of the No. 1 coal. This finding confirmed that the three coals had different trends of dehydrocyclization, and the No. 3 coal was more likely to form a larger graphitoid system with a higher degree of ordering.

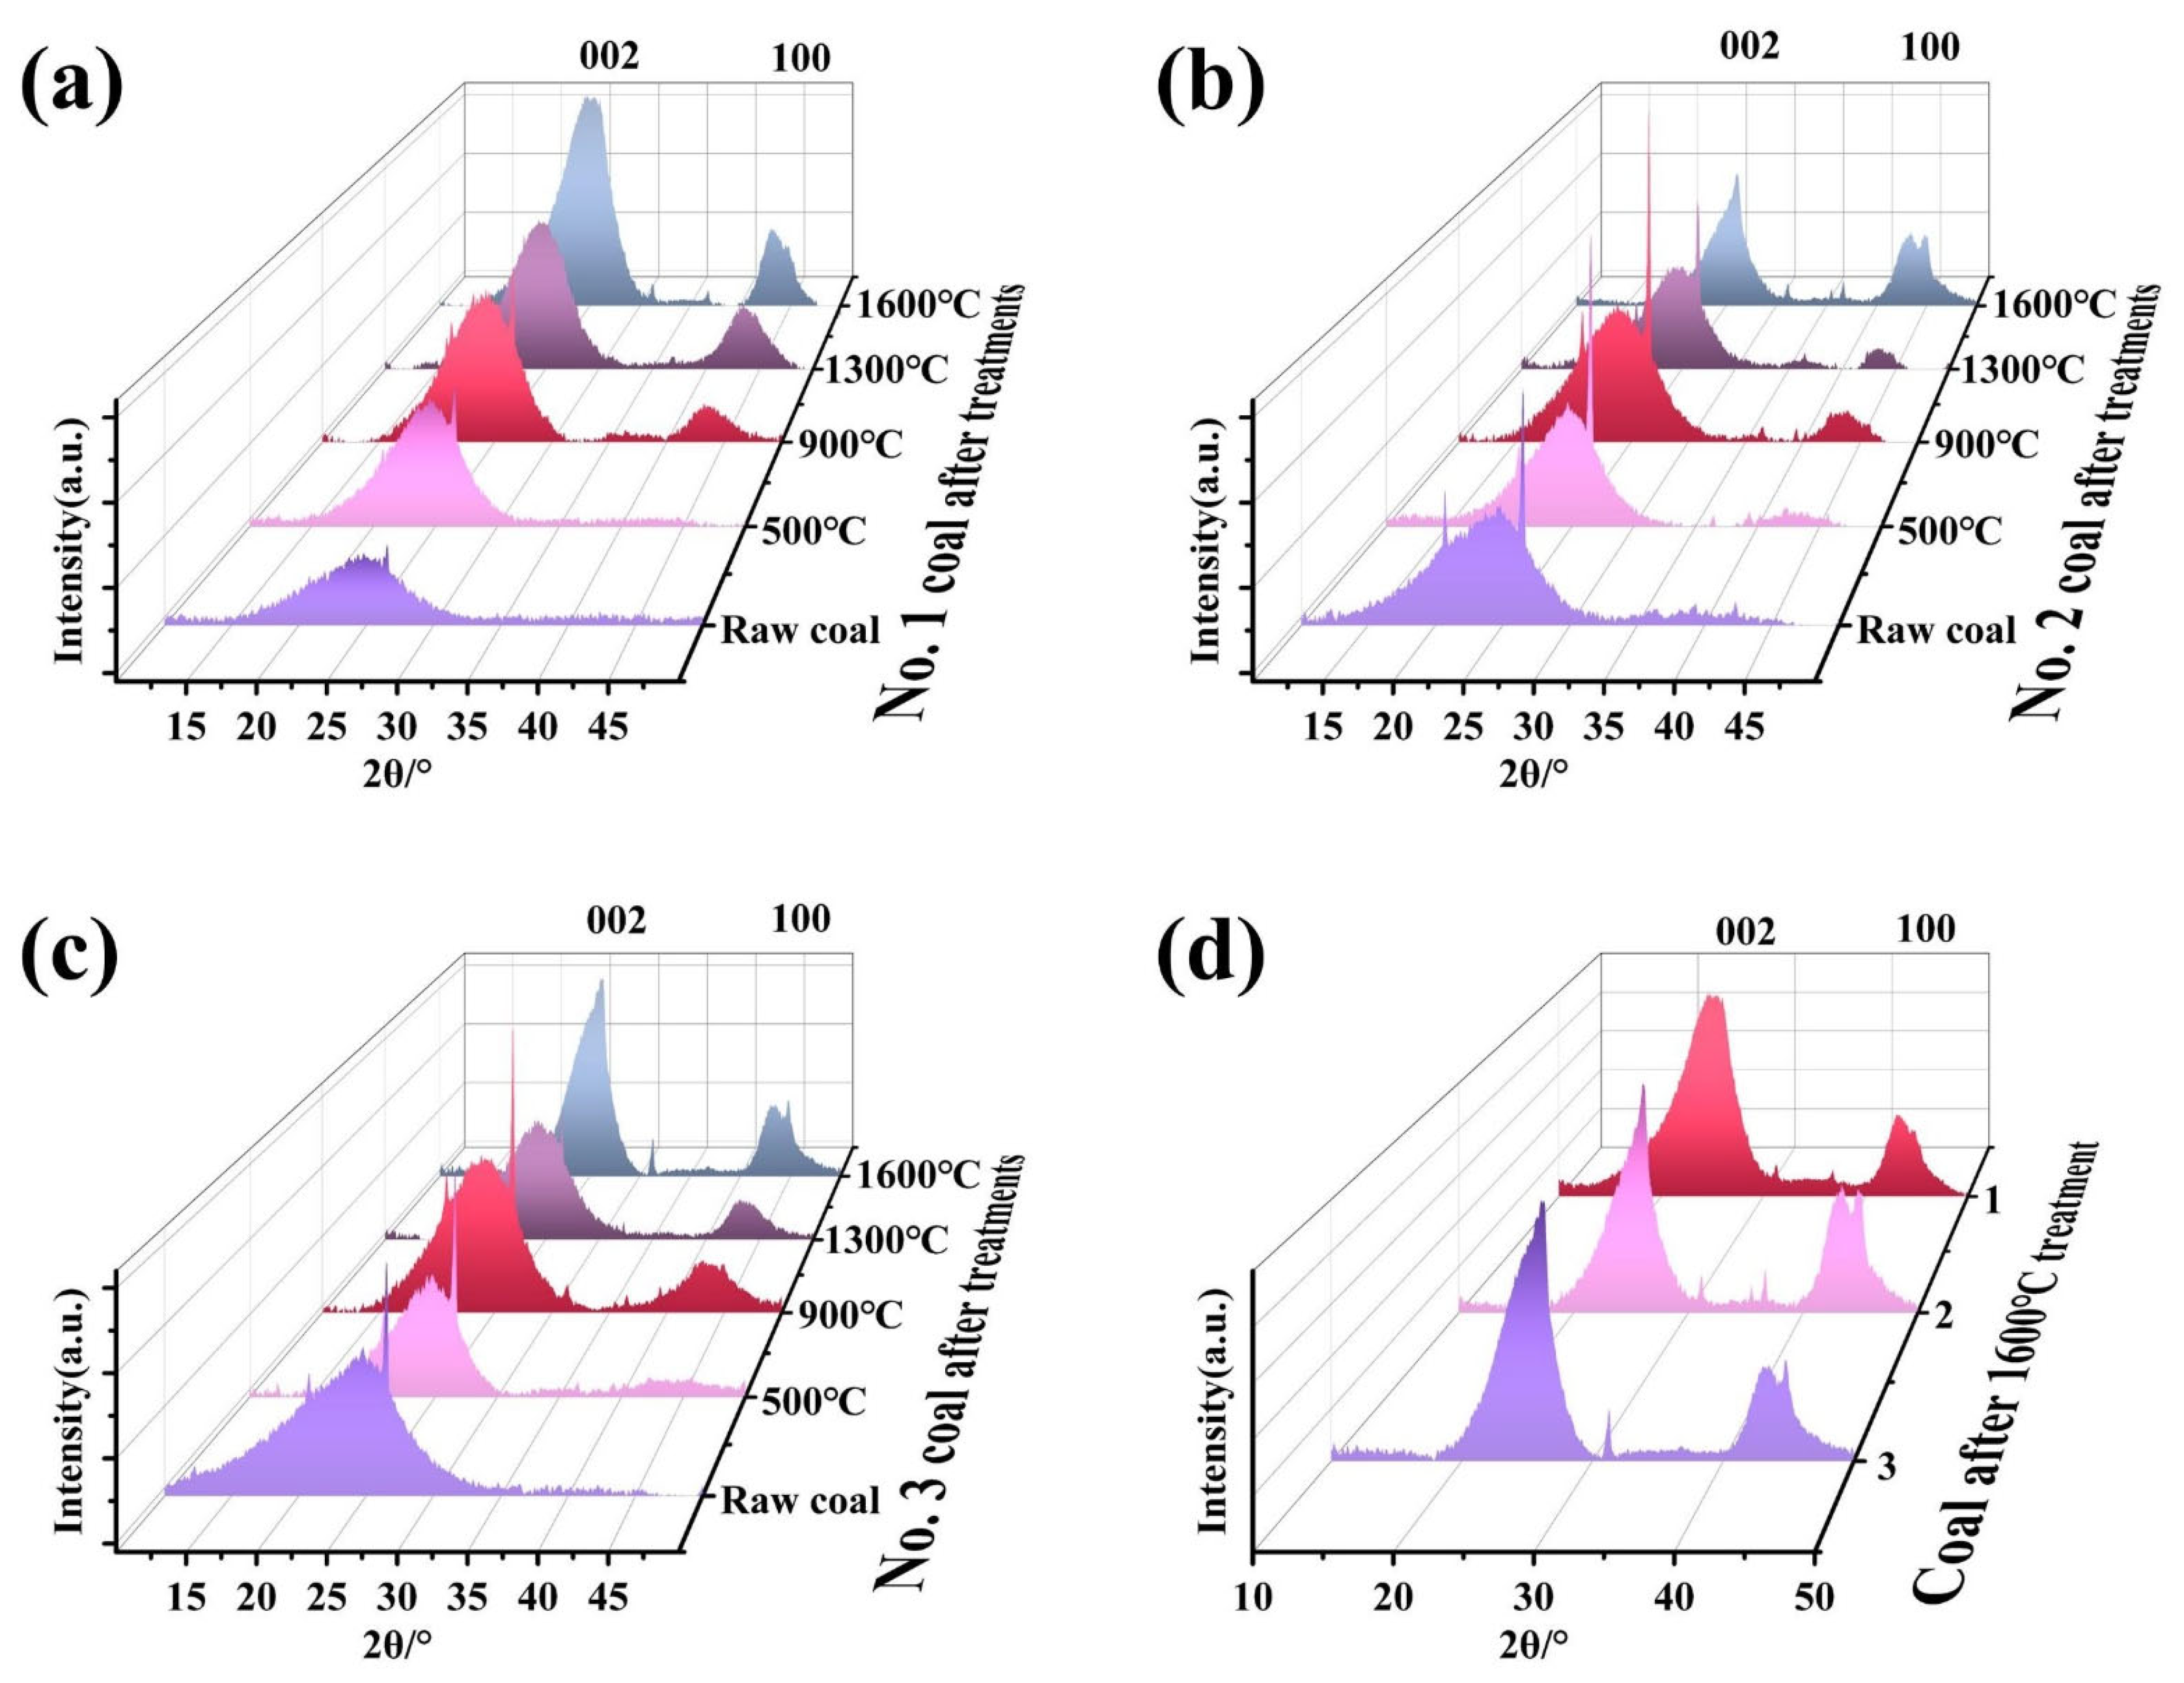
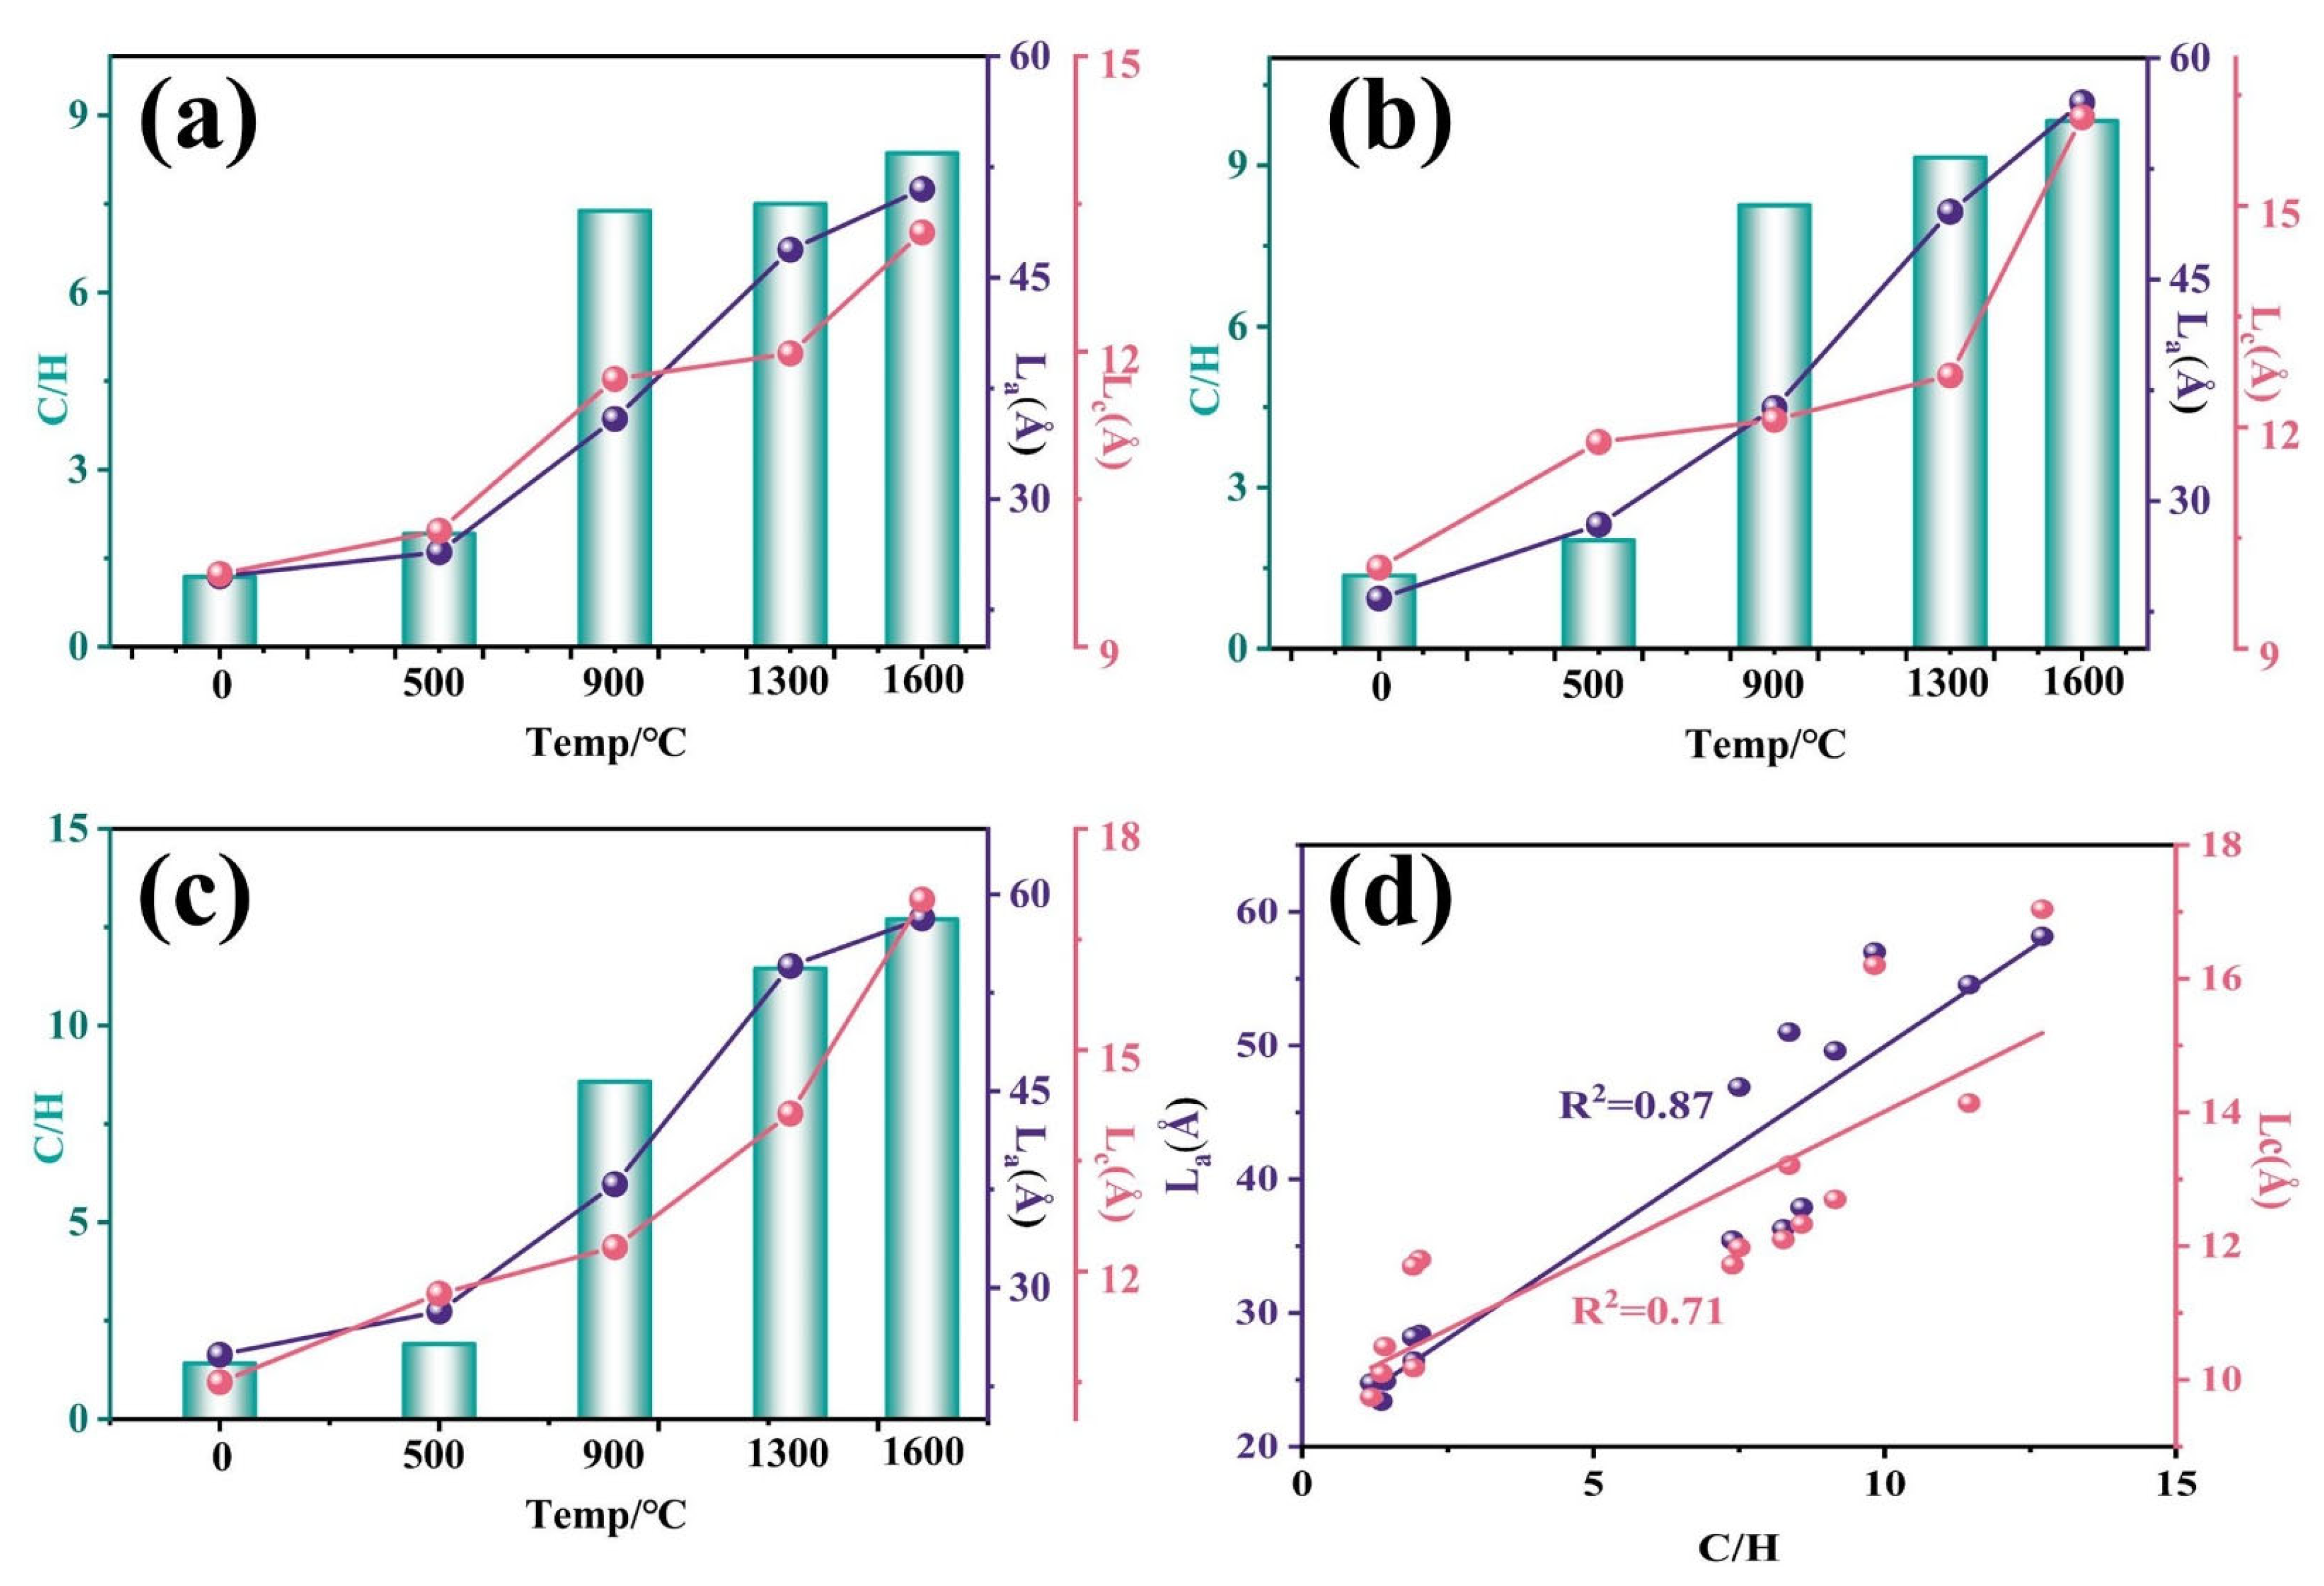
3.4. Thermal Transformation of Microcrystalline Structures

During the heating process, the microcrystalline structure of coal changed. The XRD results for the three coals after heat treatment at different temperatures are shown in Figure 6. There were two obvious bands, the 002 band between 20 and 30° and the 100 band between 40 and 50°. The 002 peak reflected the layered structure of the carbon material and the degree of stacking. The higher the degree of stacking, the more ordered the structure. The positional offset of the 002 peak determined the interlayer distance in the stacked crystalline carbon. With an increase in temperature, the coal removed volatile matter, and the cross-linking reaction promoted the arrangement of the carbon layers. With a further increase in temperature, dehydrogenation and aromatization further enhanced the stacking and ordering of the carbon layers [37]. In Figure 6d, it is shown that all three coal samples underwent obvious crystalline growth and stacking changes in the layer structure after the high temperature treatment at 1600 °C. The sharp peaks with short-range ordering appeared in No. 2 and No. 3 coals, indicating that No. 2 and No. 3 coals showed graphitic-like phenomena. The 002 peaks of the No. 1 coal showed a microcrystalline structure with a long-range disorder. The 100 peaks reflected the planar arrangement of the carbon atoms. With increasing temperature, all three coals showed 100 peaks. This indicated that the coals showed two-dimensional structure ordering and crystal growth with an increase in temperature.
The microcrystalline structural parameters of the three coals at different temperatures were statistically and computationally obtained, as listed in Table 4. As the temperature increased, the layer spacing d002 decreased, indicating that the microcrystalline structure had a tendency for graphitization in the pyrolysis process. La and Lc both increased with increasing temperature, which indicates that the coal was gradually ordered during the pyrolysis process. With an increase in temperature, the decomposition of aliphatic groups and rearrangement of aromatic structures in the coal led to the accumulation of microcrystalline flakes. The increase in stacking degree caused an increase in Lc. The three raw coals and their 500 °C treated coals did not have a significant 100 peak, and the increase was small in this temperature interval, while a large increase occurred at high temperatures. This is mainly due to the fact that, at high temperatures, the free radical fragments formed by coal pyrolysis are captured by the coal macromolecules. The dehydrocondensation cyclization reaction occurs, further aromatization of the coal occurs, and the diameter of the microcrystals increases [38].
Coal No. 1 consistently exhibited highly disordered peaks in the 002 band. Coals No. 2 and 3 exhibited partially short-range ordered microcrystalline structures at 1600 °C. At the same temperature, the microcrystalline stacking height Lc of coal No. 1 was always smaller than those of coal No. 2 and 3. Especially at 1600 °C, the difference in Lc between No. 1, No. 2, and No. 3 further increased. The microcrystalline stacking degree of the No.1 coal was lower than those of the No. 2 and No. 3 coals. The difference in the average microcrystalline size La of the three raw coals was smaller. However, after heat treatment at different temperatures, the La of the No. 1 coal was smaller than those of the No. 2 and No. 3 coals.
Both La and Lc can be used as indicators of the degree of coal ordering, which is positively correlated with La and Lc. The relationships between La, Lc, C/H, and temperature are shown in Figure 7a–c. The three coal samples, La, and Lc were positively correlated with temperature. The relationships between La, Lc, and C/H and the fitting results are shown in Figure 7d. The correlation coefficient between C/H and La was 0.87, while the correlation coefficient with Lc was 0.71. Compared to Lc, C/H had a higher correlation and better fitting effect with La. This is mainly due to the fact that La is correlated with the aromatic core size. The method for coal to obtain a larger aromatic core size is to undergo aromatization by removing the H element. Coal with a higher degree of aromatization has a higher C/H and larger microcrystalline size La. Therefore, C/H showed a higher correlation with the microcrystalline size of La.

3.5. Coal Reactivity Verification Experiment

The higher ordering of coal reduces the reactivity of coal and thus affects the productivity of MG-Si. Coal is mainly involved in reactions at high temperatures during the production of MG-Si. Therefore, the reactivity at high temperatures is more reflective of the actual conditions of the coal. In this study, coal coke treated at 900, 1300, and 1600 °C was selected for reactivity determination. The results are shown in Figure 8a–c. The reactivity of coal coke treated at 900 °C, 1300 °C, and 1600 °C was 1 > 2 > 3, which was consistent with the degree of coal ordering. The variation in the reactivity with temperature for the three coals is shown in Figure 8d. All three coals exhibited a decrease in reactivity with increasing treatment temperature. This was mainly due to the increasing degree of coal ordering and decreasing reactivity with increasing treatment temperature. The reactivity curves of the No. 3 coal at 1300 °C and its reactivity curve at 1600 °C were very close to each other and almost coincided. This indicated that No. 3 coal has a significantly ordered structure after 1300 °C treatment, resulting in lower reactivity than No. 1 and No. 2 coals.
The CO2 reduction rate α at each temperature from 750 to 1300 °C for each coal was averaged as the average reactivity α0 from 750 to 1300 °C. It was used as an index to quantify coal reactivity. The correlation between the microcrystalline size La of the three coals and their average reactivity α0 are shown in Figure 9a. The results showed a significantly negative correlation and a correlation coefficient of 0.94, indicating that coal with a lower degree of ordering has better reactivity. This result is also consistent with that of Yu et al. [9]. To verify the relationship between C/H and reactivity, Figure 9b shows the average reactivity α0 versus C/H of coal at each temperature. Owing to the large differences in both temperature and reactivity between 900 °C and 1300–1600 °C, the results were divided into two regions. In the higher temperature region of 1300–1600 °C, the C/H of coal was negatively correlated with the average reactivity α0 with a correlation coefficient of 0.84. In the lower temperature region of 900 °C, the C/H of coal was also negatively correlated with the average reactivity α0 with a correlation coefficient of 0.99. This means that C/H is correlated with reactivity, and the correlation is more significant in the low-temperature region.

4. Conclusions

In studying the effect of the thermal transformation of the molecular composition and microcrystalline structure on reactivity, the following conclusions were drawn:
(1) The aliphatic compositions of the three types of raw coal are 69.85, 43.87, and 37.44%, respectively, and the aromatic compositions are 22.37, 44.89, and 49.73%, respectively. Coal No. 1 had the most developed aliphatic structure, and Coal No. 3 had the most developed aromatic structure. The C/H values of the three coals were consistent with their degrees of aromatization, which were 3 > 2 > 1. The results confirm that the C/H ratio can effectively characterize the molecular structure of coal, particularly its degree of aromatization.
(2) The degree of coal ordering increased with increasing temperature. The degree of ordering of the three coal samples was 3 > 2 > 1. The correlation analysis between La and C/H reached 0.87, indicating that C/H can indeed reflect, to some extent, the degree of coal ordering. C/H was negatively correlated with reactivity. This can be used as a reference index for evaluating the reactivity of the coals used in the smelting of MG-Si.

Author Contributions

All authors contributed to the study conception and design. Z.D.: conceptualization, formal analysis, validation, data curation, writing–original draft, writing–review and editing. W.G.: resources, visualization. L.H.: data curation, funding acquisition. All authors have read and agreed to the published version of the manuscript.

Funding

This work was supported by the Colleges and universities in Yunnan Province, who serve key industrial science and technology projects [FWCY-BSPY2024039].

Data Availability Statement

All data can be provided as required.

Conflicts of Interest

The authors declare no conflicts of interest.

References

  1. Xu, C.; Wei, K.; Du, Z.; Ma, W. Effect of particle size on the properties of biomass gasification residue pellets used as a MG-Si reducing agent. Powder Technol. 2024, 435, 119406. [Google Scholar] [CrossRef]
  2. Xie, R.; Chen, Z.; Ma, W.; Gan, X.; Wang, X.; Tao, C. Study on using waste biomass as carbon reducing agent in industrial silicon smelting. J. Clean. Prod. 2024, 472, 143468. [Google Scholar] [CrossRef]
  3. Tao, C.; Chen, Z.; Ma, W.; Wang, X. Comparative Study on the Graphitization Index of Carbonaceous Reducing Agents Used in Silicon Smelting. Silicon 2024, 16, 3121–3139. [Google Scholar] [CrossRef]
  4. Song, Y.; Wang, N. Exploring temporal and spatial evolution of global coal supply-demand and flow structure. Energy 2019, 168, 1073–1080. [Google Scholar] [CrossRef]
  5. Qu, Y.; Song, S.; Zou, Z.; Shao, L. Mathematical modeling for the process of smelting reduction ironmaking integrated with hydrogen-rich coal gasification. Processes 2024, 12, 370. [Google Scholar] [CrossRef]
  6. Hower, J.C.; Finkelman, R.B.; Eble, C.F.; Arnold, B.J. Understanding coal quality and the critical importance of comprehensive coal analyses. Int. J. Coal Geol. 2022, 263, 104120. [Google Scholar] [CrossRef]
  7. Zhang, C.; Vladislav, L.; Xu, R.; Sergey, G.; Jiao, K.; Zhang, J.; Li, T.; Aleksei, T.; Wang, C.; Wang, G. Blast furnace hydrogen-rich metallurgy-research on efficiency injection of natural gas and pulverized coal. Fuel 2022, 311, 122412. [Google Scholar] [CrossRef]
  8. Chen, Z.; Zhang, H.; Ma, W.; Wu, J. High efficient and clean utilization of coal for the carbothermic reduction of silica. Sustain. Energy Technol. Assess. 2022, 53, 102602. [Google Scholar] [CrossRef]
  9. Tao, C.; Chen, Z.; Ma, W. Analysis of Microstructural Change Mechanism During High-Temperature Pyrolysis of Carbonaceous Reducing Agents for Silicon Smelting. Silicon 2024, 16, 647–663. [Google Scholar] [CrossRef]
  10. Yu, J.; Guo, Q.; Ding, L.; Gong, Y.; Yu, G. Studying effects of solid structure evolution on gasification reactivity of coal chars by in-situ Raman spectroscopy. Fuel 2020, 270, 117603. [Google Scholar] [CrossRef]
  11. Asadullah, M.; Zhang, S.; Min, Z.; Yimsiri, P.; Li, C.Z. Effects of biomass char structure on its gasification reactivity. Bioresour. Technol. 2010, 101, 7935–7943. [Google Scholar] [CrossRef]
  12. Lu, L.; Kong, C.; Sahajwalla, V.; Harris, D. Char structural ordering during pyrolysis and combustion and its influence on char reactivity. Fuel 2002, 819, 1215–1225. [Google Scholar] [CrossRef]
  13. Li, K.; Liu, Q.; Cheng, H.; Hu, M.; Zhang, S. Classification and carbon structural transformation from anthracite to natural coaly graphite by XRD, Raman spectroscopy, and HRTEM. Spectrochim. Acta Part A: Mol. Biomol. Spectrosc. 2021, 249, 119286. [Google Scholar] [CrossRef]
  14. Li, J.; Qin, Y.; Chen, Y.; Shen, J.; Song, Y.; Wang, Z. Structural characteristics and evolution of meta-anthracite to coaly graphite: A quantitative investigation using X-ray diffraction, Raman spectroscopy, and high-resolution transmission electron microscopy. Fuel 2023, 333, 126334. [Google Scholar] [CrossRef]
  15. Wang, Y.; Zhong, X.; Zhao, H.; Li, J.; He, J.; Yang, Y.; Yan, L. Comparative study of the composition and microstructural properties of semi-coke from microwave and conventional pyrolysis of low rank coal. J. Energy Inst. 2024, 116, 101752. [Google Scholar] [CrossRef]
  16. Appiah, J.; Tian, L.; Dou, J.; Chen, Y.; Chen, X.; Xu, X.; Yu, J. Investigation into the impact of coal blending on the carbon structure of chars obtained from Chinese coals during coking. J. Anal. Appl. Pyrolysis 2024, 179, 106504. [Google Scholar] [CrossRef]
  17. Yao, Q.; Ma, M.; Liu, Y.; Ma, D.; Chen, H.; Hao, Q.; Sun, M.; Ma, X. The structural and pyrolysis characteristics of vitrinite and inertinite from Shendong coal and the gasification performance of chars. J. Anal. Appl. Pyrolysis 2022, 164, 105519. [Google Scholar] [CrossRef]
  18. Liu, Y.; Zhu, Y.; Liu, S.; Chen, S.; Li, W.; Wang, Y. Molecular structure controls on micropore evolution in coal vitrinite during coalification. Int. J. Coal Geol. 2018, 199, 19–30. [Google Scholar] [CrossRef]
  19. Kuang, Y.; Xie, W.; Wu, H.; Liu, X.; Sher, F.; Qiu, S.; Dang, J.; Zhang, S. Molecular structure of coal macerals and thermal response behavior of their chemical bonds obtained by structural characterizations and molecular dynamics simulations. Energy 2024, 301, 131735. [Google Scholar] [CrossRef]
  20. Cui, X.; Yan, H.; Zhao, P.; Yang, Y.; Xie, Y. Modeling of molecular and properties of anthracite base on structural accuracy identification methods. J. Mol. Struct. 2019, 1183, 313–323. [Google Scholar] [CrossRef]
  21. Ping, A.; Xia, W.; Peng, Y.; Xie, G. Construction of bituminous coal vitrinite and inertinite molecular assisted by 13C NMR, FTIR and XPS. J. Mol. Struct. 2020, 1222, 128959. [Google Scholar] [CrossRef]
  22. Li, Y.; Dai, C.; Meng, S.; Wu, J. Molecular structure characterization of coal with different coalification degrees: A combined study from FT-IR, Raman, 13C NMR spectroscopy and modelling. J. Mol. Struct. 2024, 1310, 138354. [Google Scholar] [CrossRef]
  23. Medina, O.E.; Gallego, J.; Nassar, N.N.; Acevedo, S.A.; Cortés, F.B.; Franco, C.A. Thermo-oxidative decomposition behaviors of different sources of n-C7 Asphaltenes under high-pressure conditions. Energy Fuels 2020, 34, 8740–8758. [Google Scholar] [CrossRef]
  24. Liu, P.; Zhang, Y.; Pan, T.; Zhang, D.; Chen, L.; Sun, C. Accurately quantifying carbon structural types and predicting pyrolysis behavior of coal using solid 13C NMR Cp/MAS spectra. Fuel 2022, 327, 125092. [Google Scholar] [CrossRef]
  25. Chelgani, S.C.; Mesroghli, S.; Hower, J.C. Simultaneous prediction of coal rank parameters based on ultimate analysis using regression and artificial neural network. Int. J. Coal Geol. 2010, 83, 31–34. [Google Scholar] [CrossRef]
  26. Chelgani, S.C.; Hower, J.C.; Jorjani, E.; Mesroghli, S.; Bagherieh, A.H. Prediction of coal grindability based on petrography, proximate and ultimate analysis using multiple regression and artificial neural network models. Fuel Process. Technol. 2008, 89, 13–20. [Google Scholar] [CrossRef]
  27. Lu, L.; Sahajwalla, V.; Kong, C.; Harris, D. Quantitative X-ray diffraction analysis and its application to various coals. Carbon 2001, 39, 1821–1833. [Google Scholar] [CrossRef]
  28. Lampropoulos, A.; Binas, V.D.; Zouridi, L.; Athanasiou, C.; Montes-Morán, M.A.; Menéndez, J.A.; Konsolakis, M.; Marnellos, G.E. CO2 Gasification Reactivity and Syngas Production of Greek Lignite Coal and Ex-Situ Produced Chars under Non-Isothermal and Isothermal Conditions: Structure-Performance Relationships. Energies 2022, 1, 679. [Google Scholar] [CrossRef]
  29. Tian, J.; Wei, K.; Deng, X.; Ma, W. A Study of the Effect of Quartz-to-Cristobalite Transformation on SiC Generation in MG-Si Production. Silicon 2024, 16, 3155–3164. [Google Scholar] [CrossRef]
  30. Bailey, N.T.; Ikejiani, A.O.; Lawson, G.J.; Monsef-Mirzai, P. Measurement of hydroxyl groups in coals of different rank by acetylation with ketene and other reagents. Fuel 1992, 71, 45–52. [Google Scholar] [CrossRef]
  31. Yang, H.; Xiong, Y.; Xie, Z.; Xi, L.; Li, Y.; Yang, J.; Hu, H. Quantitative characterization of coal structure by high-resolution CP/MAS 13C solid-state NMR spectroscopy. Proc. Combust. Inst. 2021, 38, 4161–4170. [Google Scholar] [CrossRef]
  32. Rosenvold, R.J.; Dubow, J.B.; Rajeshwar, K. Thermal analyses of Ohio bituminous coals. Thermochim. Acta 1982, 53, 321–332. [Google Scholar] [CrossRef]
  33. Zhu, Y.; Wen, W.; Li, Y.; Lu, L.; Yang, J.; Xu, M.; Pan, Y. Pyrolysis study of Huainan coal with different particle sizes using TG analysis and online Py-PI-TOF MS. J. Energy Inst. 2020, 93, 405–414. [Google Scholar] [CrossRef]
  34. Zhao, Y.; Liu, L.; Qiu, P.H.; Xie, X.; Chen, X.Y.; Lin, D.; Sun, S.Z. Impacts of chemical fractionation on Zhundong coal’s chemical structure and pyrolysis reactivity. Fuel Process. Technol. 2017, 155, 144–152. [Google Scholar] [CrossRef]
  35. Zhang, X.; Ren, D.; Fu, X.; Lu, W.; Yuan, S. A novel dual-way inference modeling method for coal coking: Predicting H2 and CH4 concentrations in coke oven gas and inferring optimal reaction conditions. Fuel 2025, 381, 133325. [Google Scholar] [CrossRef]
  36. Liu, C.; Lu, J.; Zheng, F.; Lyu, W. Molecular structure model construction and pyrolysis mechanism study on low-rank coal by experiments and ReaxFF simulations. J. Anal. Appl. Pyrolysis 2024, 178, 106387. [Google Scholar] [CrossRef]
  37. Abdelsayed, V.; Shekhawat, D.; Smith, M.W.; Link, D.; Stiegman, A.E. Microwave-assisted pyrolysis of Mississippi coal: A comparative study with conventional pyrolysis. Fuel 2018, 217, 656–667. [Google Scholar] [CrossRef]
  38. Huang, Y.B.; Zhao, Y.P.; Qiu, L.L.; Wu, F.P.; Liang, J.; Xiao, J.; Liu, F.J.; Cao, J.P. Pyrolysis behaviors of lump sub-bituminous coal. Part 1: Structural evolution of chars both at particle surface and center. Fuel 2024, 376, 132709. [Google Scholar] [CrossRef]
Figure 1. Experimental flowchart.
Processes 13 01371 g001
Figure 2. Process for determining the reactivity of coal to CO2.
Processes 13 01371 g002
Figure 3. (a) 13C-NMR results of three raw coals; (b) peak fitting of coal 2.
Processes 13 01371 g003
Figure 4. (a) TG–DSC of three coals; (b) DSC; (c) TG; (d) DTG.
Processes 13 01371 g004
Figure 5. (a) The relationship between carbon content and temperature; (b) the relationship between C/H and temperature.
Processes 13 01371 g005
Figure 6. XRD results of three coals: (ac) are the results for 1, 2, and 3 coals at different temperatures, respectively; (d) is the result for the three coals treated at 1600 °C.
Processes 13 01371 g006
Figure 7. The relationship between C/H and the degree of ordering after treatment at different temperatures; (ac) for coal No. 1, 2, and 3, respectively; (d) the correspondence between C/H and the degree of ordering.
Processes 13 01371 g007
Figure 8. Coal reactivity to CO2 after different temperature treatments: (a) 900 °C, (b) 1300 °C, (c) 1600 °C, and (d) all results.
Processes 13 01371 g008
Figure 9. Correlation between reactivity and structure: (a) correlation between the average reactivity α0 and La of coal; (b) correlation between the average reactivity α0 and C/H of coal.
Processes 13 01371 g009
Table 1. Sample composition analysis (wt.%).
SampleProximate Analysis (wt.%)Ultimate Analysis (wt.%)
MadAadVadFCadCHON
18.684.4538.7648.1173.195.1520.531.13
27.394.1232.3756.1275.984.6518.620.75
37.403.4230.1359.0576.204.4818.520.80
FCad is fixed carbon, Aad is air-dried basis ash, Vad is air-dried basis volatiles, Mad is air-dried basis moisture, and the elemental oxygen content is calculated by difference.
Table 2. Attribution information for each carbon structure.
TypeSymbolChemical Shift (ppm)123
Area Percent (%)Area Percent (%)Area Percent (%)
Aliphaticfal0–10069.8543.8737.44
Aromaticfα100–16522.3744.8949.73
C=OfC=O165–2207.7711.2412.79
fal, aliphatic carbon; fα, aromatic carbon; fC=O, carboxyl carbon and carbonyl carbon.
Table 3. Ultimate analysis of coal after heat treatment at different temperatures.
SampleRaw Coal500 °C900 °C1300 °C1600 °C
CHC/HCHC/HCHC/HCHC/HCHC/H
173.195.151.1880.043.481.9289.51.017.3888.590.997.582.240.828.36
275.984.651.3681.863.382.0288.210.898.2678.030.719.1588.670.759.83
376.24.481.4281.383.561.989.520.878.5795.210.6911.4595.730.6312.7
Table 4. XRD peak information.
Sampled002 (Å)La (Å)Lc (Å)d002 (Å)La (Å)Lc (Å)d002 (Å)La (Å)Lc (Å)
123
Raw 3.6424.779.743.6223.4410.063.5924.9210.48
500 °C3.6326.4110.183.6128.4311.763.5828.2111.67
900 °C3.6235.4411.723.6036.2512.143.5637.9012.33
1300 °C3.5946.8911.983.5649.6012.673.5654.5514.14
1600 °C3.4951.0013.213.4156.9716.193.4258.1717.04
Disclaimer/Publisher’s Note: The statements, opinions and data contained in all publications are solely those of the individual author(s) and contributor(s) and not of MDPI and/or the editor(s). MDPI and/or the editor(s) disclaim responsibility for any injury to people or property resulting from any ideas, methods, instructions or products referred to in the content.

