3.1. Influence of Temperature on Evaporation of Ionic Solutions
The molecular dynamics simulations represented in
Figure 1 offer a detailed visual account of the evaporation process of an ionic solution under two distinct thermal conditions. The temperature effect on the evaporation is evident when comparing the series of simulation snapshots at 400 K (left) and 700 K (right). At the lower temperature of 400 K, the sequence of images illustrates a relatively steady configuration of the solution with marginal reductions in volume as the simulation progresses. The snapshots from the initial to the final stages reveal a gradual decrease in the number of liquid molecules, corresponding to a measured rate of evaporation. This observation is consistent with the lower kinetic energy available to the molecules at 400 K, which only permits a fraction of molecules, those with sufficient energy, to escape the liquid phase.
Conversely, the simulation conducted at 700 K (right in
Figure 1) presents a starkly different scenario. Early in the sequence, there is a noticeable increase in the activity within the vapor phase, indicative of a heightened rate of molecular evaporated from the liquid surface. As time progresses, there is a clear and significant reduction in the liquid bulk, emphasizing the accelerated rate of evaporation at this elevated temperature. The increased kinetic energy at 700 K facilitates a larger proportion of molecules to acquire the requisite energy to overcome intermolecular attractions and transition into the gas phase.
The effect of temperature on the evaporation process can be further dissected by examining the density and distribution of molecules in the gas phase. At 400 K, the vapor above the liquid surface remains sparsely populated throughout the simulation, suggesting a balance between the evaporation and condensation processes. However, at 700 K, there is a dense and progressively expanding collection of molecules in the vapor phase, signifying a dominant evaporation process with reduced condensation, consistent with the Clausius–Clapeyron relation, which describes the exponential increase of vapor pressure with temperature.
Furthermore, a detailed analysis of the simulation at 700 K reveals the onset of a rapid depletion of the liquid phase, accompanied by the formation of a non-uniform concentration of ions in the residual liquid. This non-uniformity may be indicative of complex interactions between the evaporating solvent and the solute, which can lead to a heterogeneous distribution of ions and potentially the initiation of nucleation sites for crystal formation.
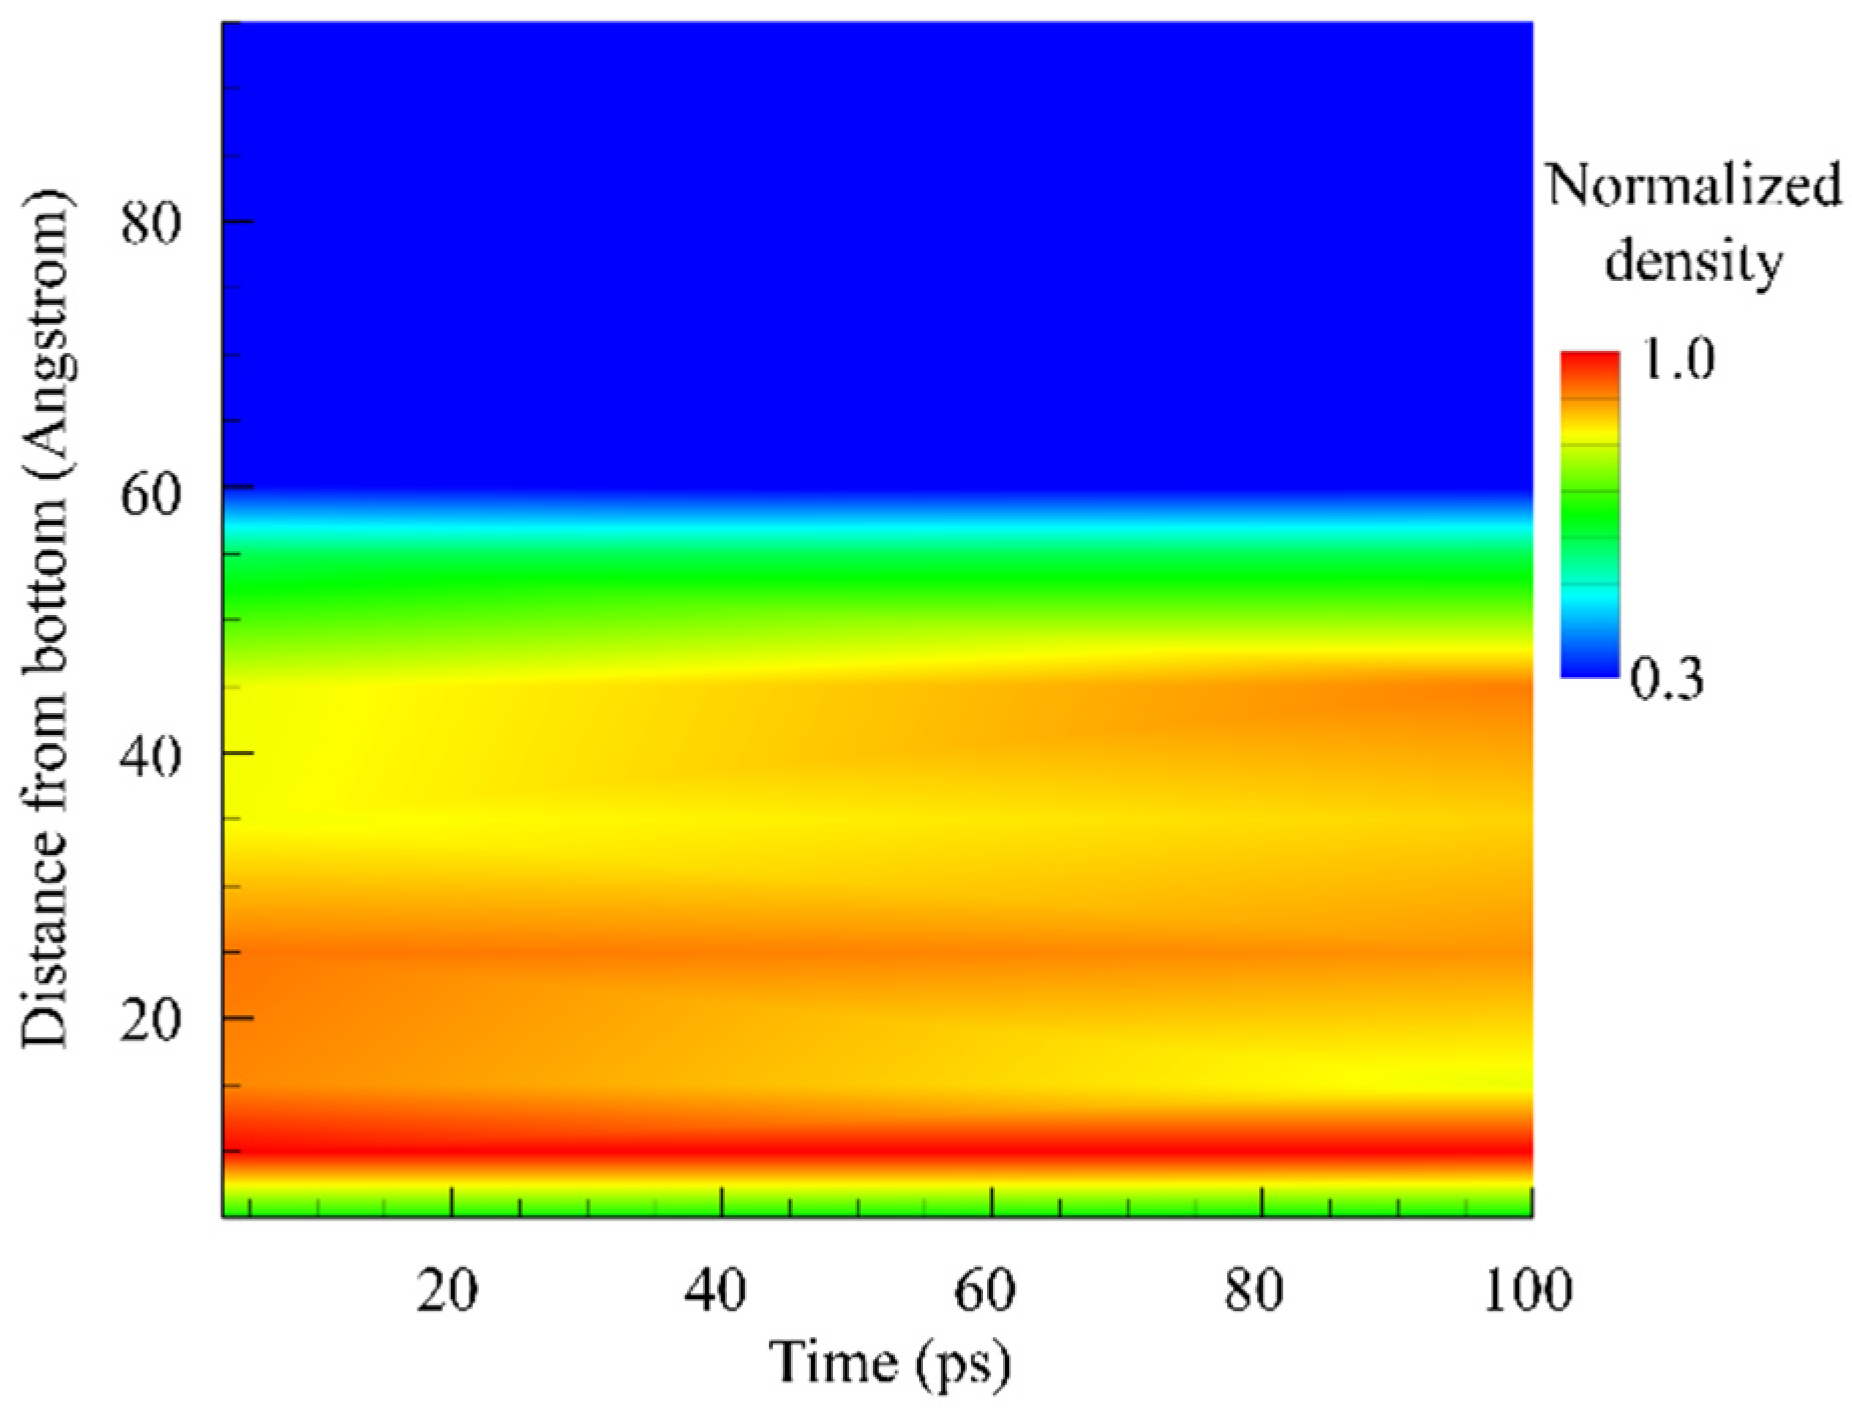
Figure 2 provides a density contour plot which represents the density evolution of an ionic solution during the evaporation process over time, with the horizontal axis marking time in picoseconds (ps), and the vertical axis representing the height of the solution (angstroms). The color gradient indicates the density of the solution normalized to the maximum of the solution density, ranging from low density (blue) to high density (red).
At the start of the evaporation process (left side of the plot), the density is uniformly high across the solution height, as indicated by the consistent warm colors. This uniformity suggests that, initially, the solution is in a stable state with a homogenous distribution of ions and solvent molecules. As time progresses to the right, we observe a gradient forming from top (blue) to bottom (red), which indicates that the density at the top of the solution decreases, while it remains higher at the bottom. The transition from warm to cool colors in the upper portion of the contour plot illustrates the reduction in density as the solvent molecules evaporate. This effect creates a density gradient due to the loss of the more volatile components, presumably the solvent, from the surface of the solution.
The gradual shift in color towards the middle section of the contour from a uniform warm color to a stratified pattern of warm and cool colors indicates a continuous evaporation process, with the solution becoming less dense at the top due to the solvent molecules leaving the liquid phase. The persistence of high density at the bottom suggests that the ions and possibly some solvent molecules remain, potentially leading to a supersaturated region or the formation of a concentrated solution or even precipitate. Towards the end of the simulation (far right), the density at the top has significantly decreased, as indicated by the broad blue region, which suggests that the rate of solvent loss is high and that a substantial amount of solvent has evaporated. The warm colors confined to the bottom of the plot indicate that a small, highly dense portion of the solution remains, possibly a brine or saturated solution, where no further evaporation can occur without the removal of solute or an increase in temperature or other conditions to re-initiate the evaporation.
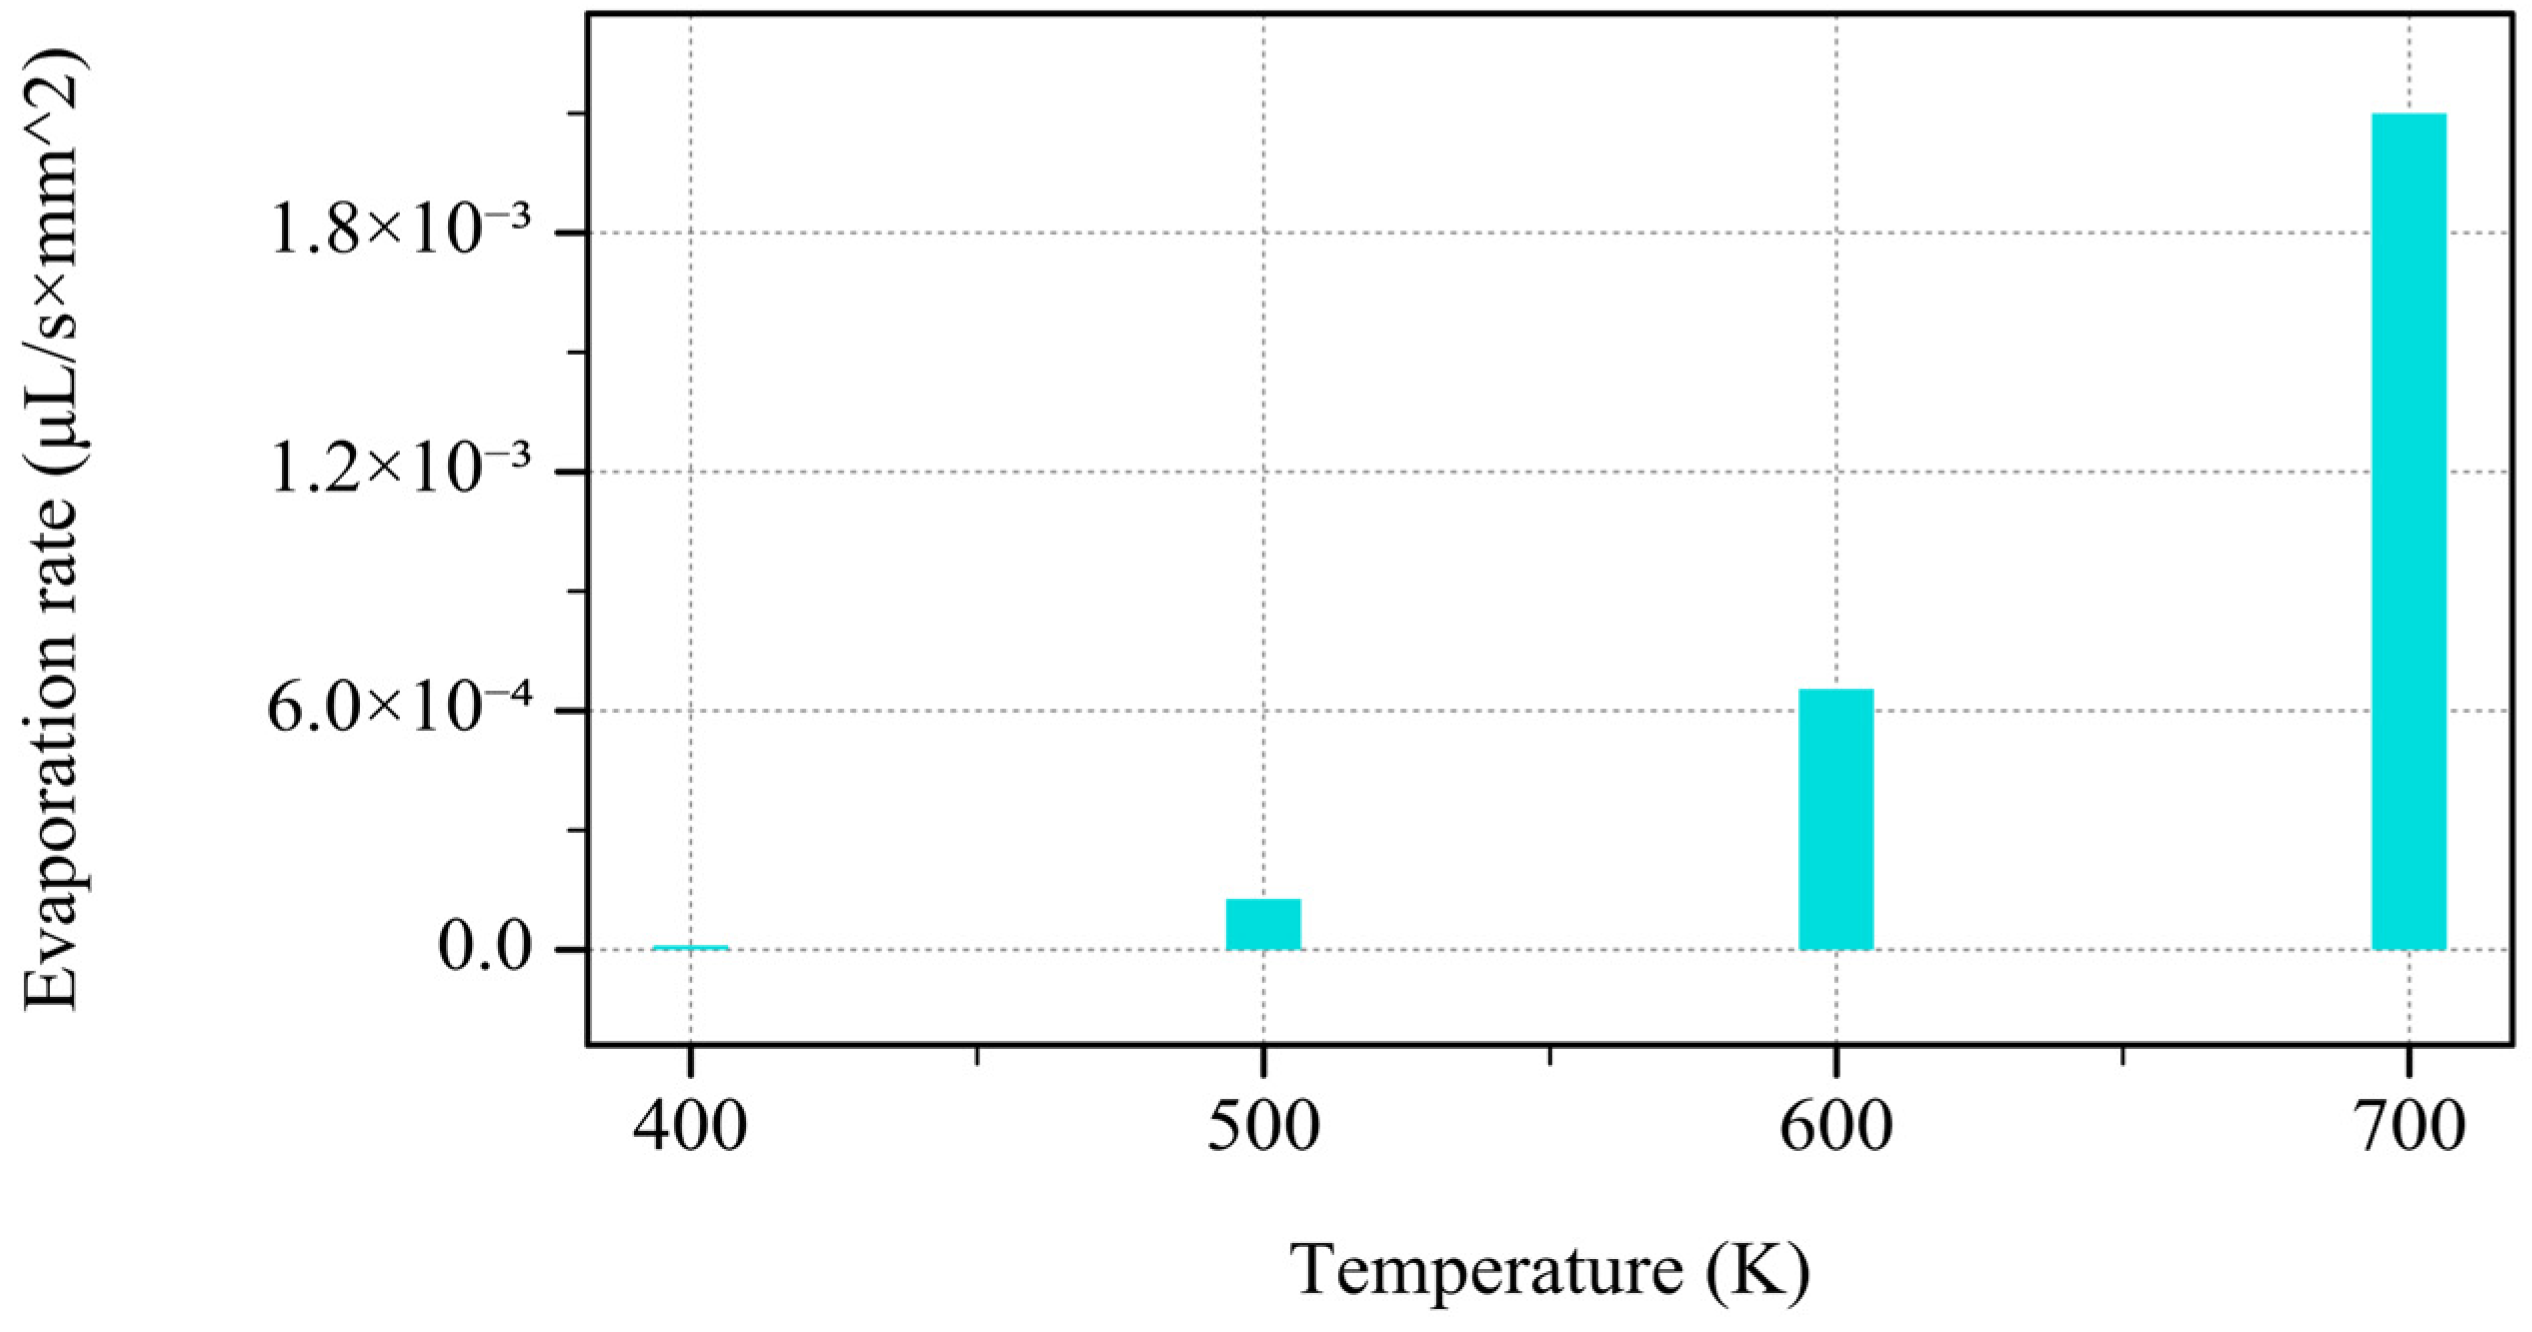
Figure 3 illustrates the effect of temperature on the evaporation rate (measured in
). The evaporation rate increases with the rising temperature, as depicted by the bar chart. At lower temperatures (400 K and 500 K), the evaporation rate is negligible, but at 600 K, it begins to rise significantly. By 700 K, the evaporation rate shows a marked increase, indicating a rapid rise as the temperature escalates. As the temperature increases, the exponential dependence of the equation predicts a rapid increase in vapor pressure. Since the evaporation rate is directly influenced by the vapor pressure (higher vapor pressure leads to faster evaporation), the steep rise in the evaporation rate at higher temperatures (600 K to 700 K) aligns with this principle. The graph illustrates the non-linear nature of this relationship, as predicted by the Clausius–Clapeyron equation.
The above simulations provide compelling visual evidence for the substantial influence of temperature on the evaporation dynamics of ion solutions. At the elevated temperature of 700 K, the process is markedly more vigorous, resulting in a faster transition of the solution to the gaseous phase. These results underscore the importance of temperature as a pivotal factor in the evaporation process.
3.2. Effect of Concentration on Evaporation
The relationship between the solute concentration and the evaporation rate in the saline solution is critical in understanding the behavior of such systems, particularly when considering the formation of solid residues post-evaporation and the efficiency of processes such as crystal growth and material drying.
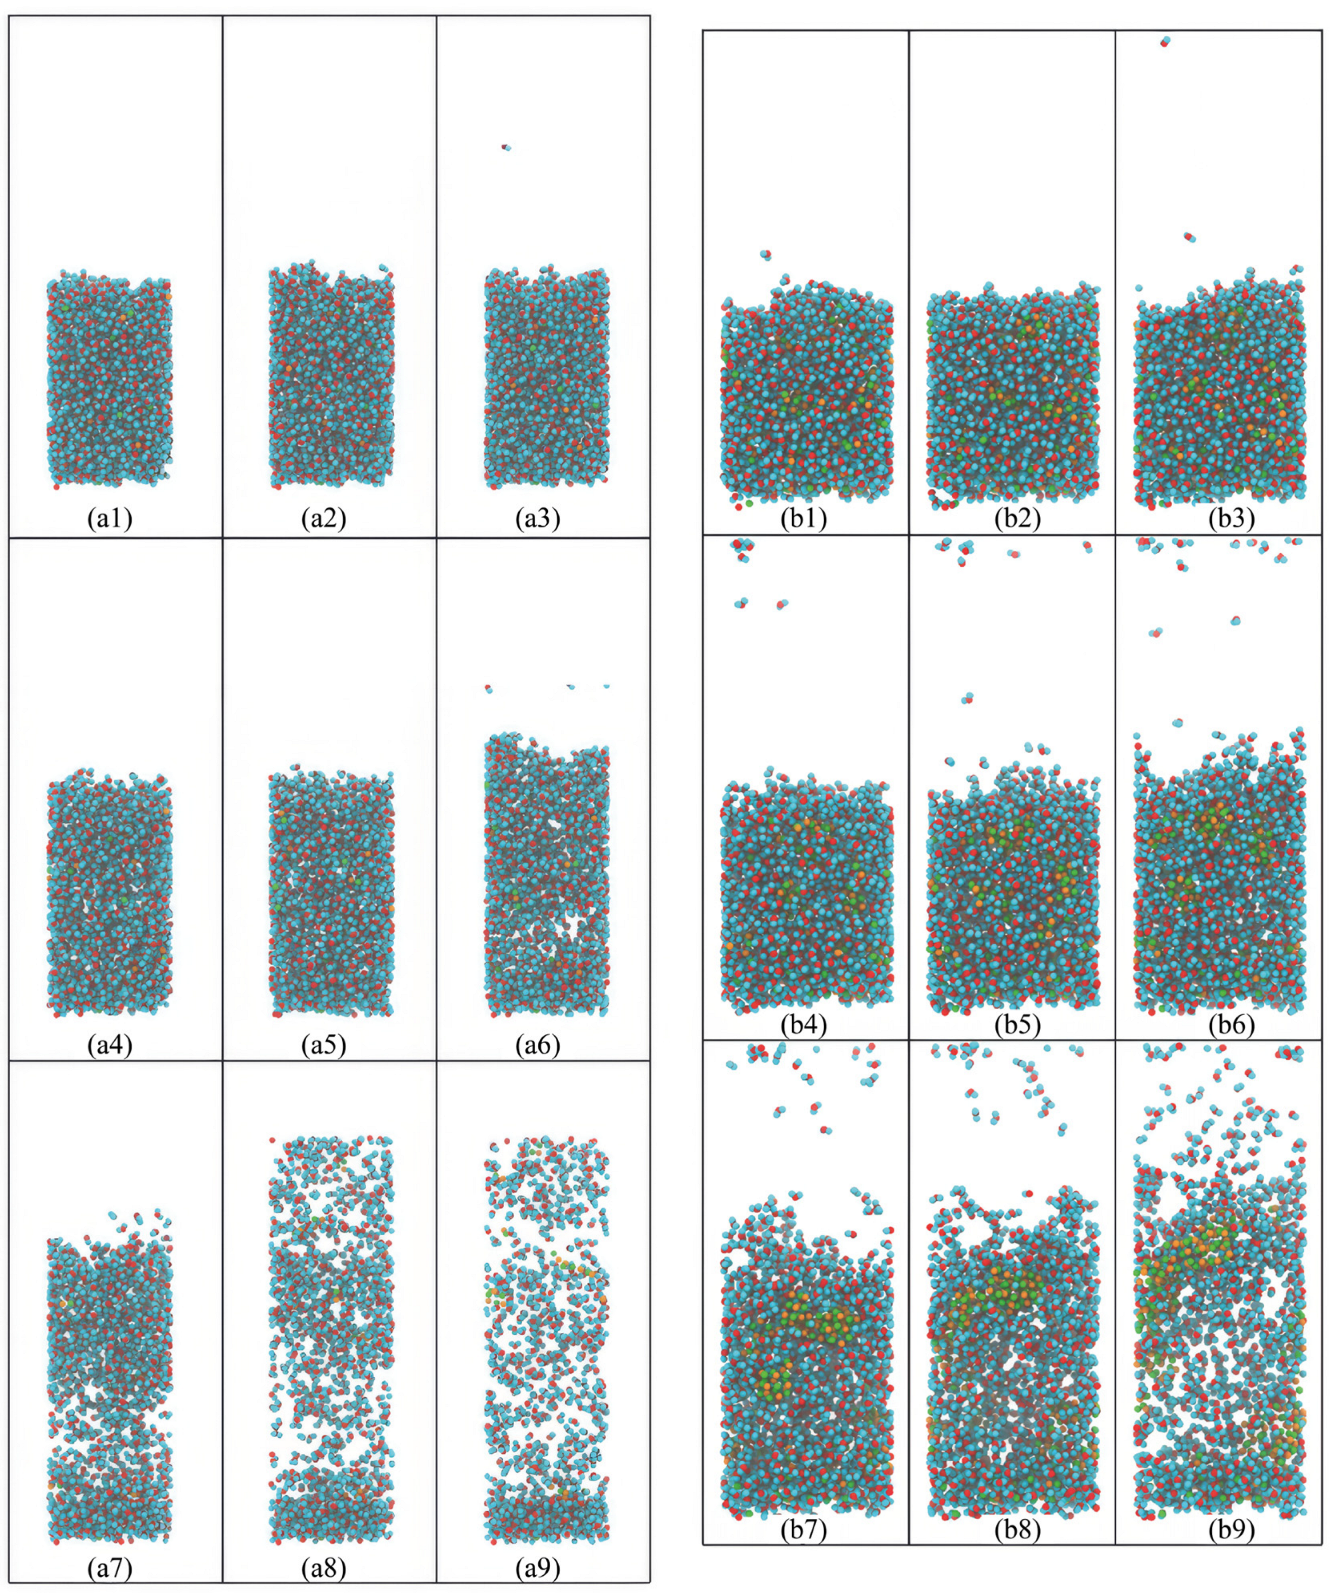
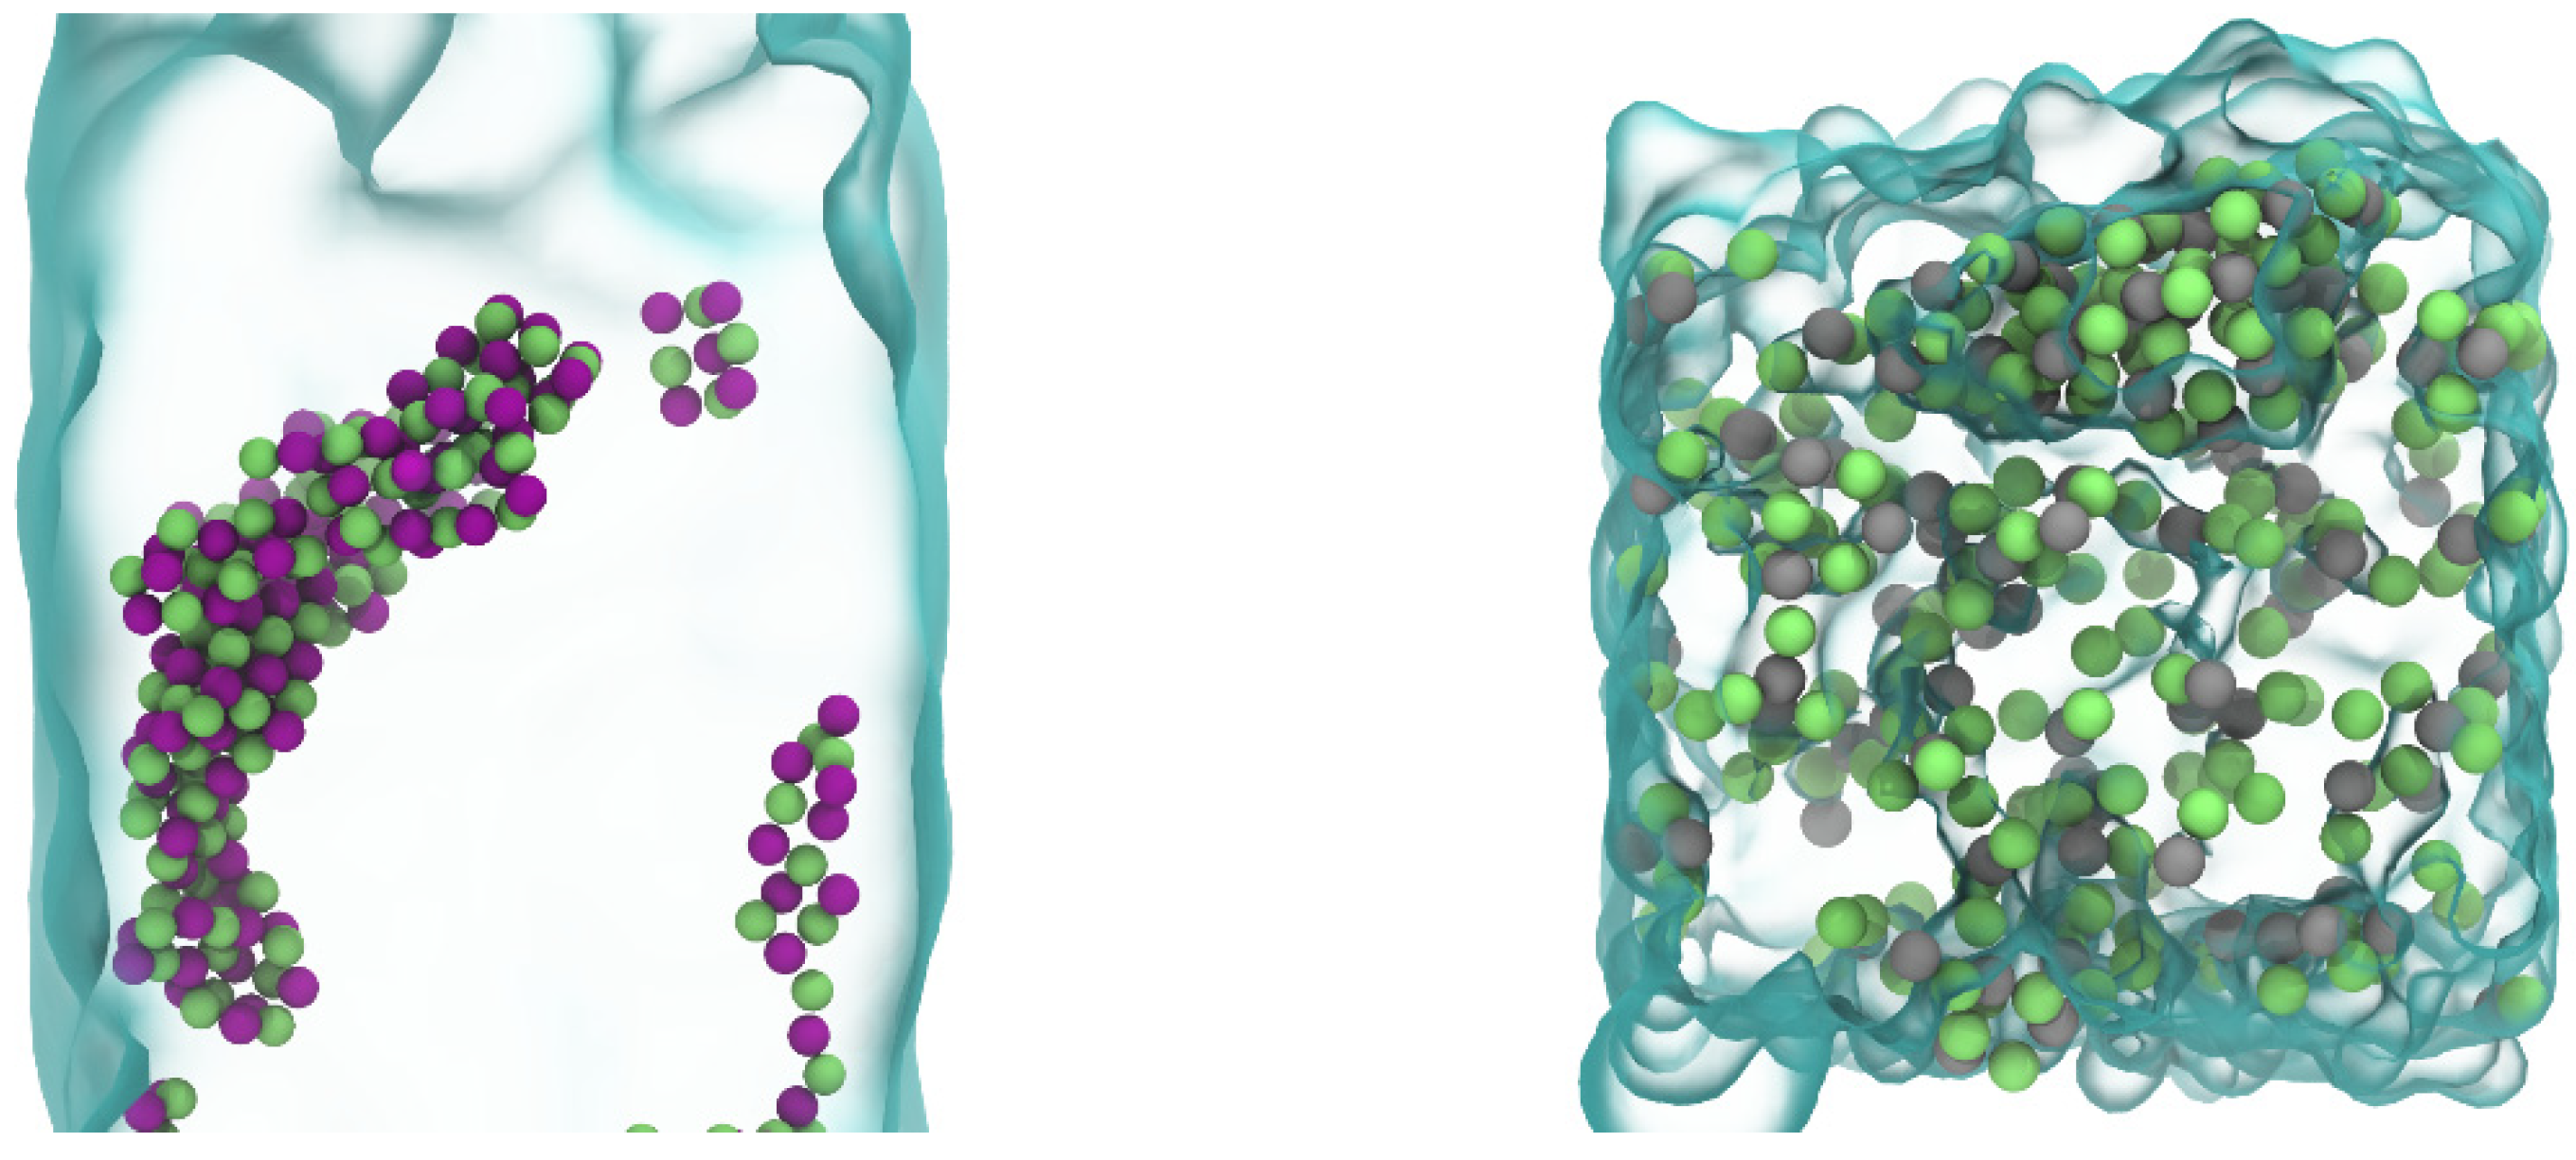
Figure 4 provides a visual representation of the evaporation process at different CuCl
2 concentrations. In the dilute CuCl
2 solution (
Figure 4, left side), ions are uniformly dispersed, allowing the evaporation process to proceed evenly, resulting in a uniformly distributed residue. By contrast, the denser CuCl
2 solution (
Figure 4, right side) exhibits significant ion clustering as the solvent evaporates, leading to the formation of distinct ion-rich regions. These clusters suggest that interactions between the ions become more pronounced at higher concentrations, which not only affects the rate of evaporation but leads to an uneven distribution of the remaining solid residue. The formation of ion clusters and a concentrated layer at the air–solution interface may also hinder further solvent transport and evaporation, as evidenced by the snapshots that show the evolution of these clusters over time.
The clustering observed in denser solutions may also lead to the formation of a concentrated layer at the air–solution interface, which could act as a barrier to evaporation and solvent transport. This barrier effect becomes more evident in the snapshots from the dense solution, where the formation of large clusters and the resulting crust can be seen as the process progresses. These observations highlight the complexity of the evaporation process in ionic solutions, where factors such as ion concentration not only influence the rate of evaporation but dictate the distribution and morphology of the salt residue. Such an understanding has significant implications for the optimization of industrial drying processes and the manufacturing of materials where the control of crystal size and morphology is essential.
The results from
Figure 4 underscore the importance of controlling solution conditions to achieve desired outcomes in evaporation processes. They also suggest that, beyond a certain concentration threshold, the evaporation rate is hampered, which is crucial information for industries where drying and crystallization processes are fundamental, such as in the production of pharmaceuticals or desalination technologies. Further research is necessary to quantitatively describe these observations and to incorporate them into predictive models for the evaporation of ionic solutions.
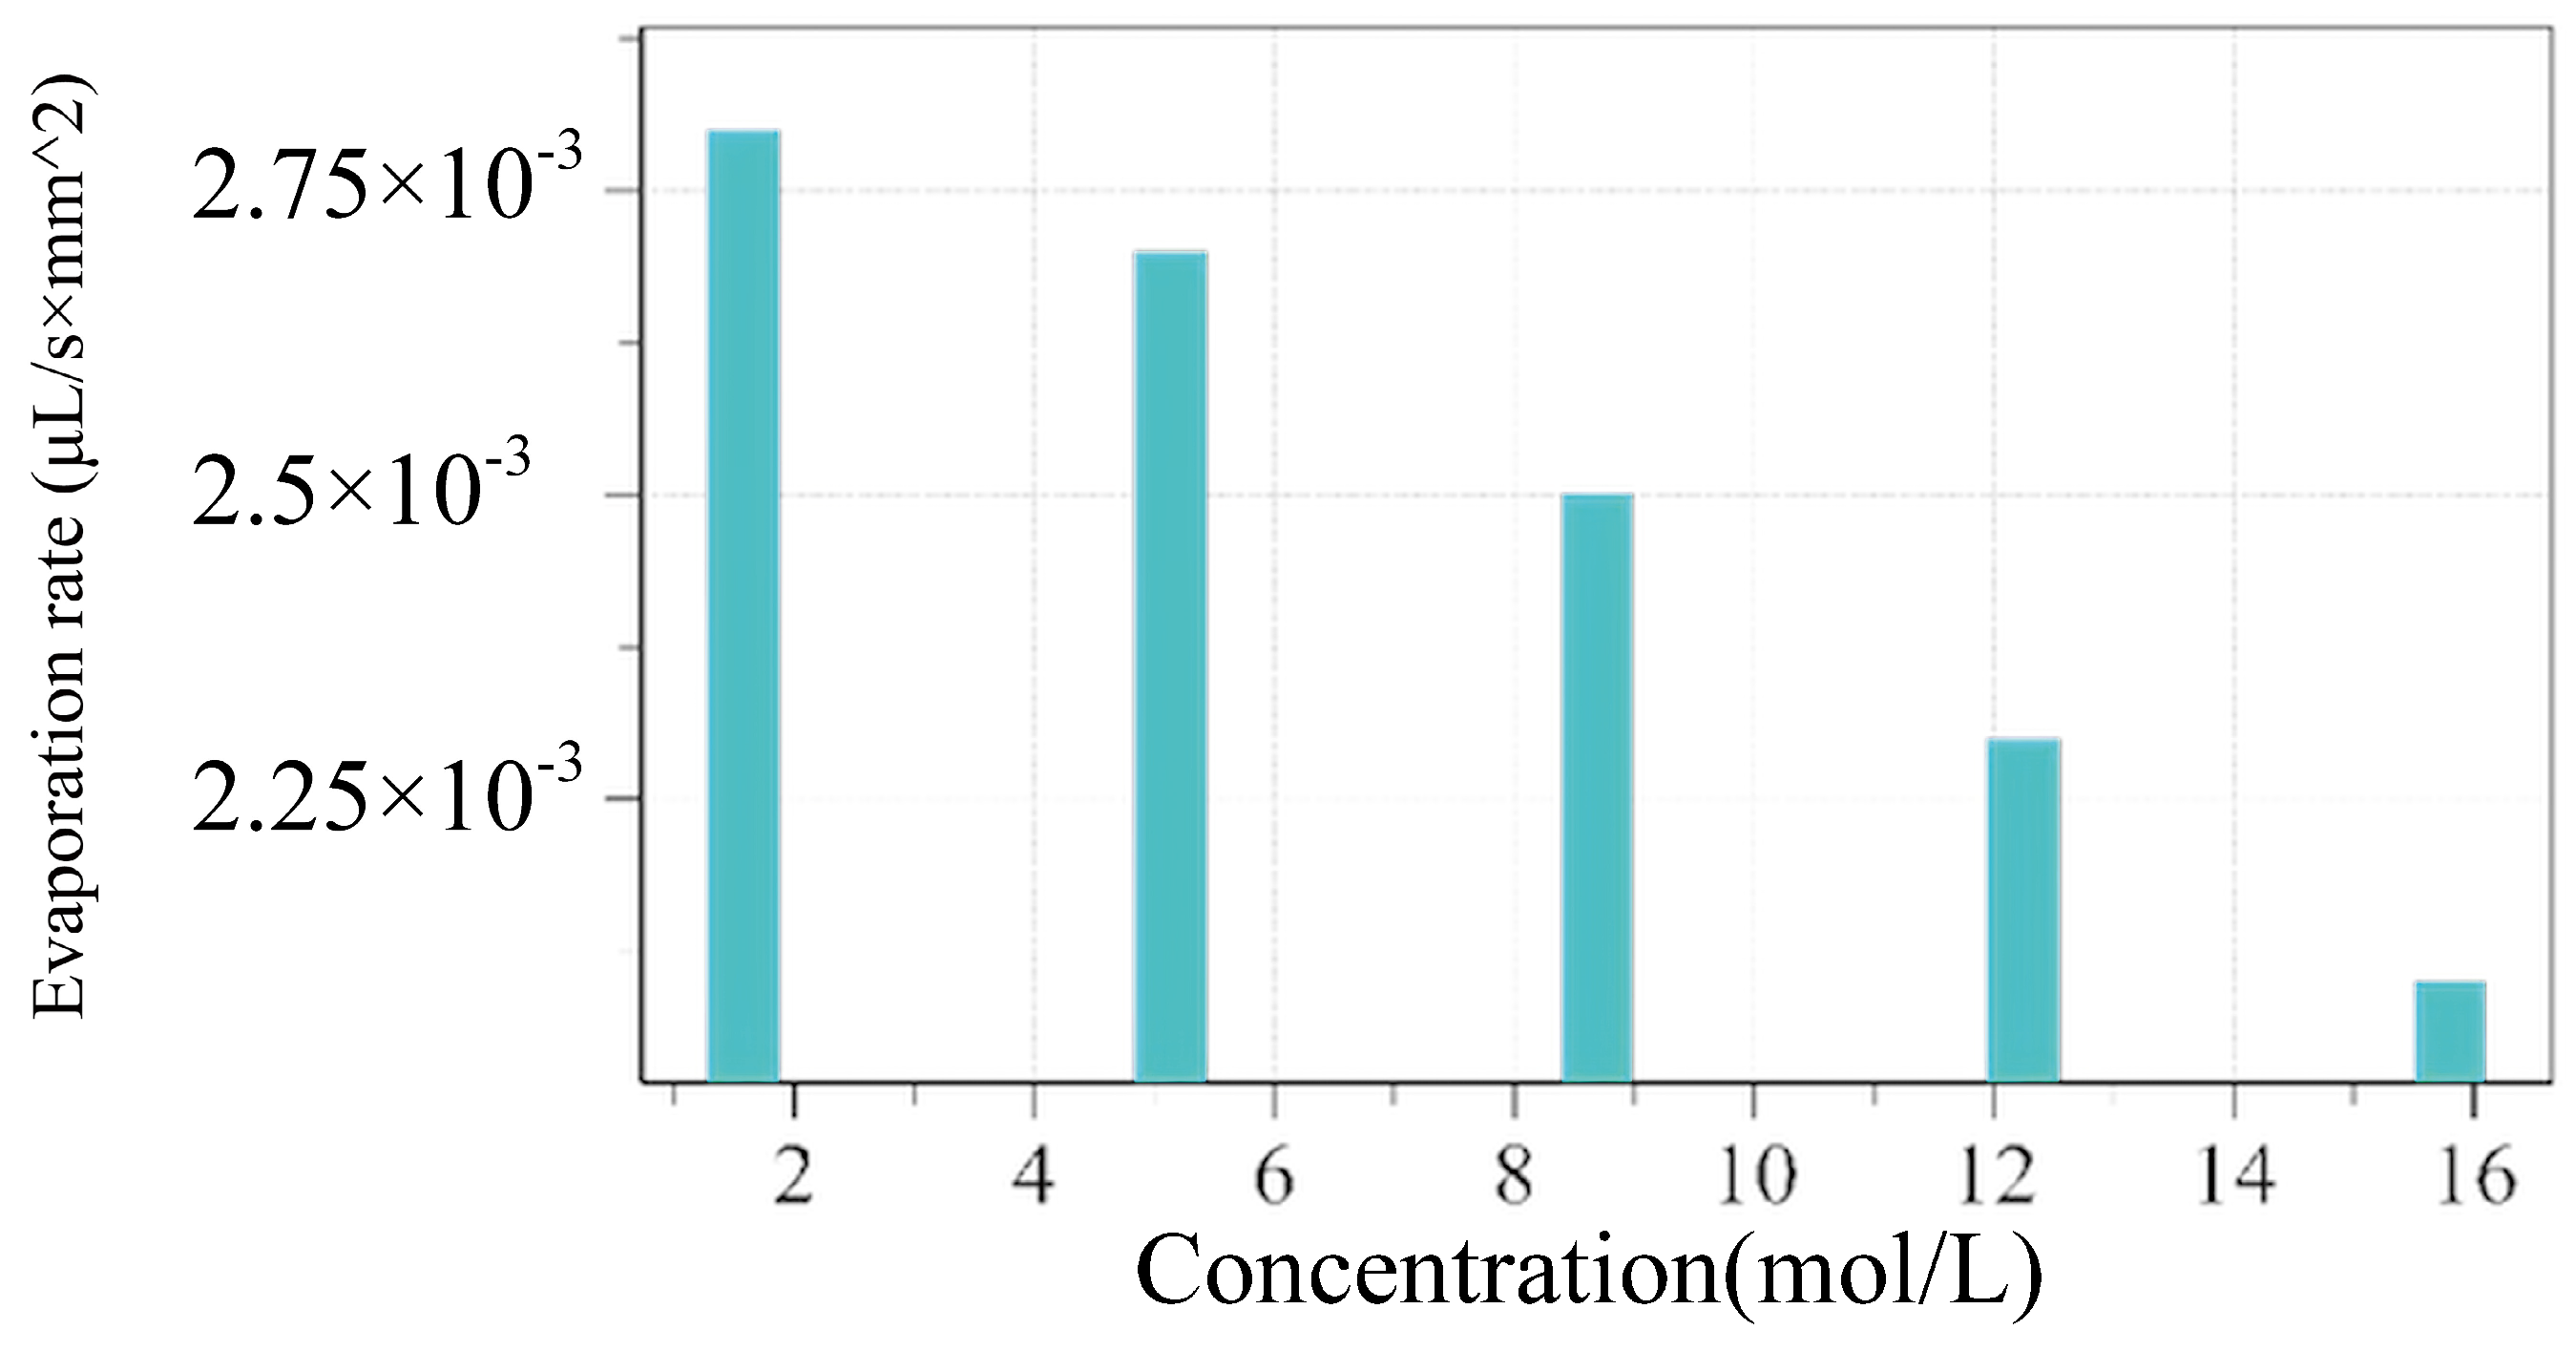
The results in
Figure 5 reveal a clear inverse relationship between the NaCl concentration and the evaporation rate. At low concentrations, the evaporation rate is highest. However, as the concentration increases, the evaporation rate decreases significantly. This trend highlights how higher NaCl concentrations hinder water evaporation. This behavior is explained by the vapor pressure lowering, a colligative property. Dissolved NaCl ions interact with water molecules, forming hydration shells that reduce the number of free water molecules available for evaporation. As the concentration increases, these ion–water interactions intensify, further suppressing evaporation. The nonlinear nature of the decline, particularly at higher concentrations, reflects the cumulative effects of hydration and the increasing density of the dissolved ions. The temperature and concentration effect on the evaporation is close to the experimental study [
19].
3.3. Effects of Ions on Solution Evaporation
The evaporation of ionic solutions is a critical phenomenon with profound implications for various scientific and industrial processes. The molecular dynamics simulations depicted in the provided figures serve as a cornerstone for examining the impact of ionic species on the evaporation process.
Figure 6 offers a sequential view of the evaporation progression for both salts at a consistent temperature of 700 K.
The evaporation process captured in
Figure 6 elucidates the dynamic behavior of these ionic solutions under thermal stress. Initially, both solutions present a homogeneous mixture of ions and solvent. As the temperature sustains at 700 K, solvent molecules progressively vacate the system, leaving behind an increasing concentration of ions. The snapshots distinctly show that CuCl
2 experiences a more dramatic structural evolution during evaporation than NaCl. This can be attributed to the stronger hydration shells formed around the Cu
2+ ions, which require more substantial energy input to disassemble, slowing down the rate of evaporation and leading to a higher propensity for the formation of clusters.
The intricacies of these clusters reveal much about the non-uniform distribution of ions in the evaporating CuCl2 solution, suggesting a departure from the ideal solution behavior expected in dilute conditions. Such deviations have considerable ramifications for the understanding of nucleation and crystal growth processes, particularly in industrial settings where the purity and form of crystalline products are paramount.
In assessing the final products after evaporation, as shown in
Figure 7, it is apparent that the nature of the ions involved profoundly influences the morphology of the resulting structures. The NaCl structure displays a relatively open and regular lattice, reflecting the simplistic and symmetric ionic interactions characteristic of monovalent ions. Conversely, the CuCl
2 structure exhibits a more compact and disordered arrangement, likely due to the increased Coulombic interactions associated with divalent Cu
2+ ions. These interactions not only lead to a denser ion pack but may result in a more complex crystal lattice, as ions navigate a landscape of potential energy that is substantially altered by the presence of a multivalent cation.
The investigation of the evaporation behavior of ionic solutions through MD simulations provides valuable perspectives on the role of ionic species in dictating the kinetics and morphology of crystal formation. The ability to predict and control such processes is instrumental in advancing both theoretical understanding and practical applications in materials science and environmental technology. The academic significance of these findings lies in their potential to refine the theoretical framework that describes the evaporation of ionic solutions. In practice, the insights gained from these molecular dynamics simulations can inform the optimization of processes like the fabrication of nanomaterials and thin films, where control over the evaporation stage is crucial to achieving the desired material properties. Additionally, these results highlight the necessity of considering the individual characteristics of ions in environmental models, where the evaporation of saline waters can influence ecosystem dynamics.
3.4. Shape Effect on the Solution Evaporation
The shape of nanostructures significantly impacts boiling by enhancing the heat transfer, thereby controlling the bubble dynamics. They also influence nucleation, promoting stable bubble formation and reducing dry-out risks. These effects are crucial for improving boiling efficiency and stability in advanced thermal systems, making shape-engineered nanostructures vital for applications like heat exchangers, electronics cooling, and energy systems. In this subsection, we investigate the shape effects of nanostructures on the evaporation, as shown in
Figure 8.
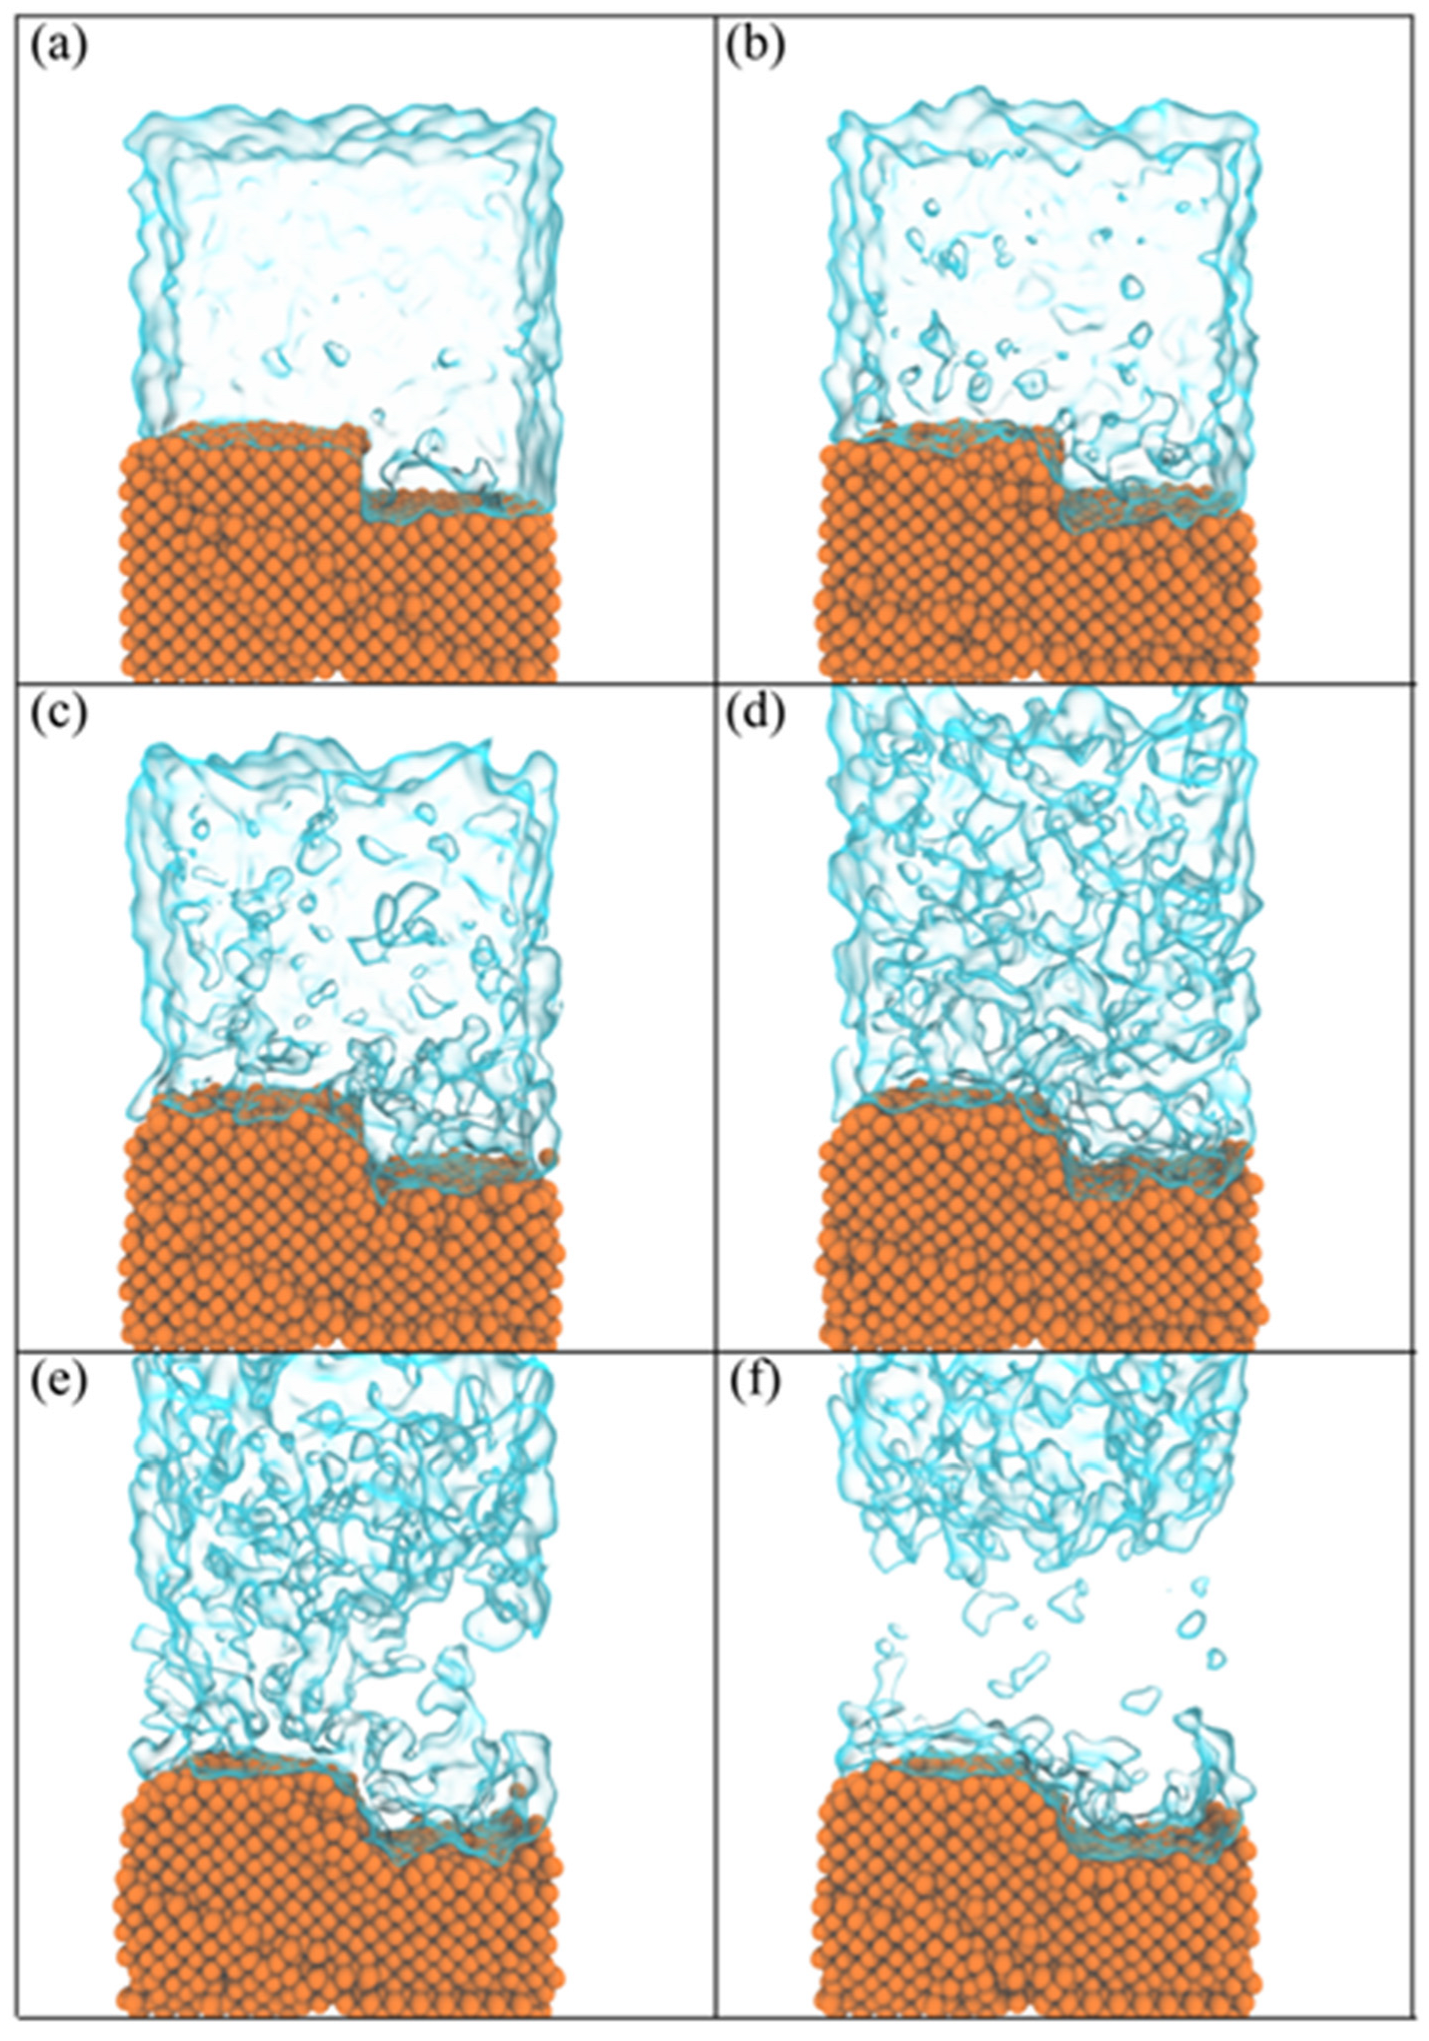
The molecular dynamics simulation results depicted in
Figure 8 illustrate the thin-film boiling process on a nanostructured surface, shedding light on the atomistic mechanisms of bubble nucleation, growth, and vapor formation. At the initial stage, as shown in
Figure 8a, the liquid layer, rendered as transparent, remains stable atop the nanostructured substrate (orange). At this point, the system is in equilibrium, and thermal energy has not yet overcome the intermolecular forces binding the liquid molecules, resulting in negligible vapor formation. The nanostructured surface begins to exert its influence by enhancing localized thermal gradients and providing preferential sites for nucleation due to its increased surface area and irregular geometry.
As the simulation progresses to
Figure 8b, the influence of the nanostructured substrate becomes evident as thermal energy input initiates bubble nucleation near the solid–liquid interface. Atoms in close proximity to the nanostructures experience higher localized temperatures due to the efficient transfer of heat from the substrate. The atomistic mechanism involves the weakening of intermolecular forces between the liquid molecules, particularly at high-energy contact points with the nanostructure, where nanoscale cavities and peaks act as nucleation sites. These irregularities lower the energy barrier for phase transition, allowing vapor cavities to form in the liquid.
By
Figure 8c,d, bubble growth becomes increasingly pronounced as the vapor phase expands. The nanostructure promotes rapid heat transfer, accelerating the evaporation process. The cavities and peaks enhance the surface wettability and capillary forces, facilitating liquid replenishment and sustaining nucleation sites. At the molecular level, atoms in the liquid near the substrate gain sufficient kinetic energy to overcome cohesive forces and escape into the vapor phase. This leads to a rapid phase transition and the formation of interconnected vapor pathways, as observed in the simulations. The nanostructured geometry supports the separation of bubbles and minimizes the coalescence of vapor pockets, ensuring a more uniform vapor distribution.
At the later stages, depicted in
Figure 8e,f, the vapor phase dominates the liquid film as boiling intensifies. The nanostructure’s role in enhancing boiling efficiency becomes clear: its geometric features not only provide abundant nucleation sites but sustain efficient heat transfer due to the intimate contact between the solid and liquid phases. The formation of a vapor layer near the nanostructure reduces thermal resistance, allowing heat to propagate rapidly into the liquid film. Simultaneously, the nanostructure’s surface texture aids in disrupting the formation of insulating vapor layers, thereby maintaining high heat flux.
The atomistic mechanism underlying this process is closely tied to the thermal motion of atoms and their interactions at the solid–liquid interface. Nanostructures amplify localized heating effects, reducing the activation energy required for evaporation. The snapshots in
Figure 8 demonstrate the progressive destabilization of the liquid film, where vapor continuously replaces liquid molecules in the high-energy zones. The combined effects of nanostructure-enhanced nucleation, the rapid vapor phase propagation, and the efficient heat transfer account for the observed boiling behavior.
In summary, the results highlight the critical role of nanostructures in thin-film boiling. Their ability to lower nucleation barriers, enhance heat transfer, and sustain liquid replenishment creates an ideal environment for efficient boiling. This study provides valuable insights into the atomistic mechanisms governing phase transitions and underscores the potential of nanostructured surfaces for thermal management applications, such as heat exchangers and electronic cooling systems.
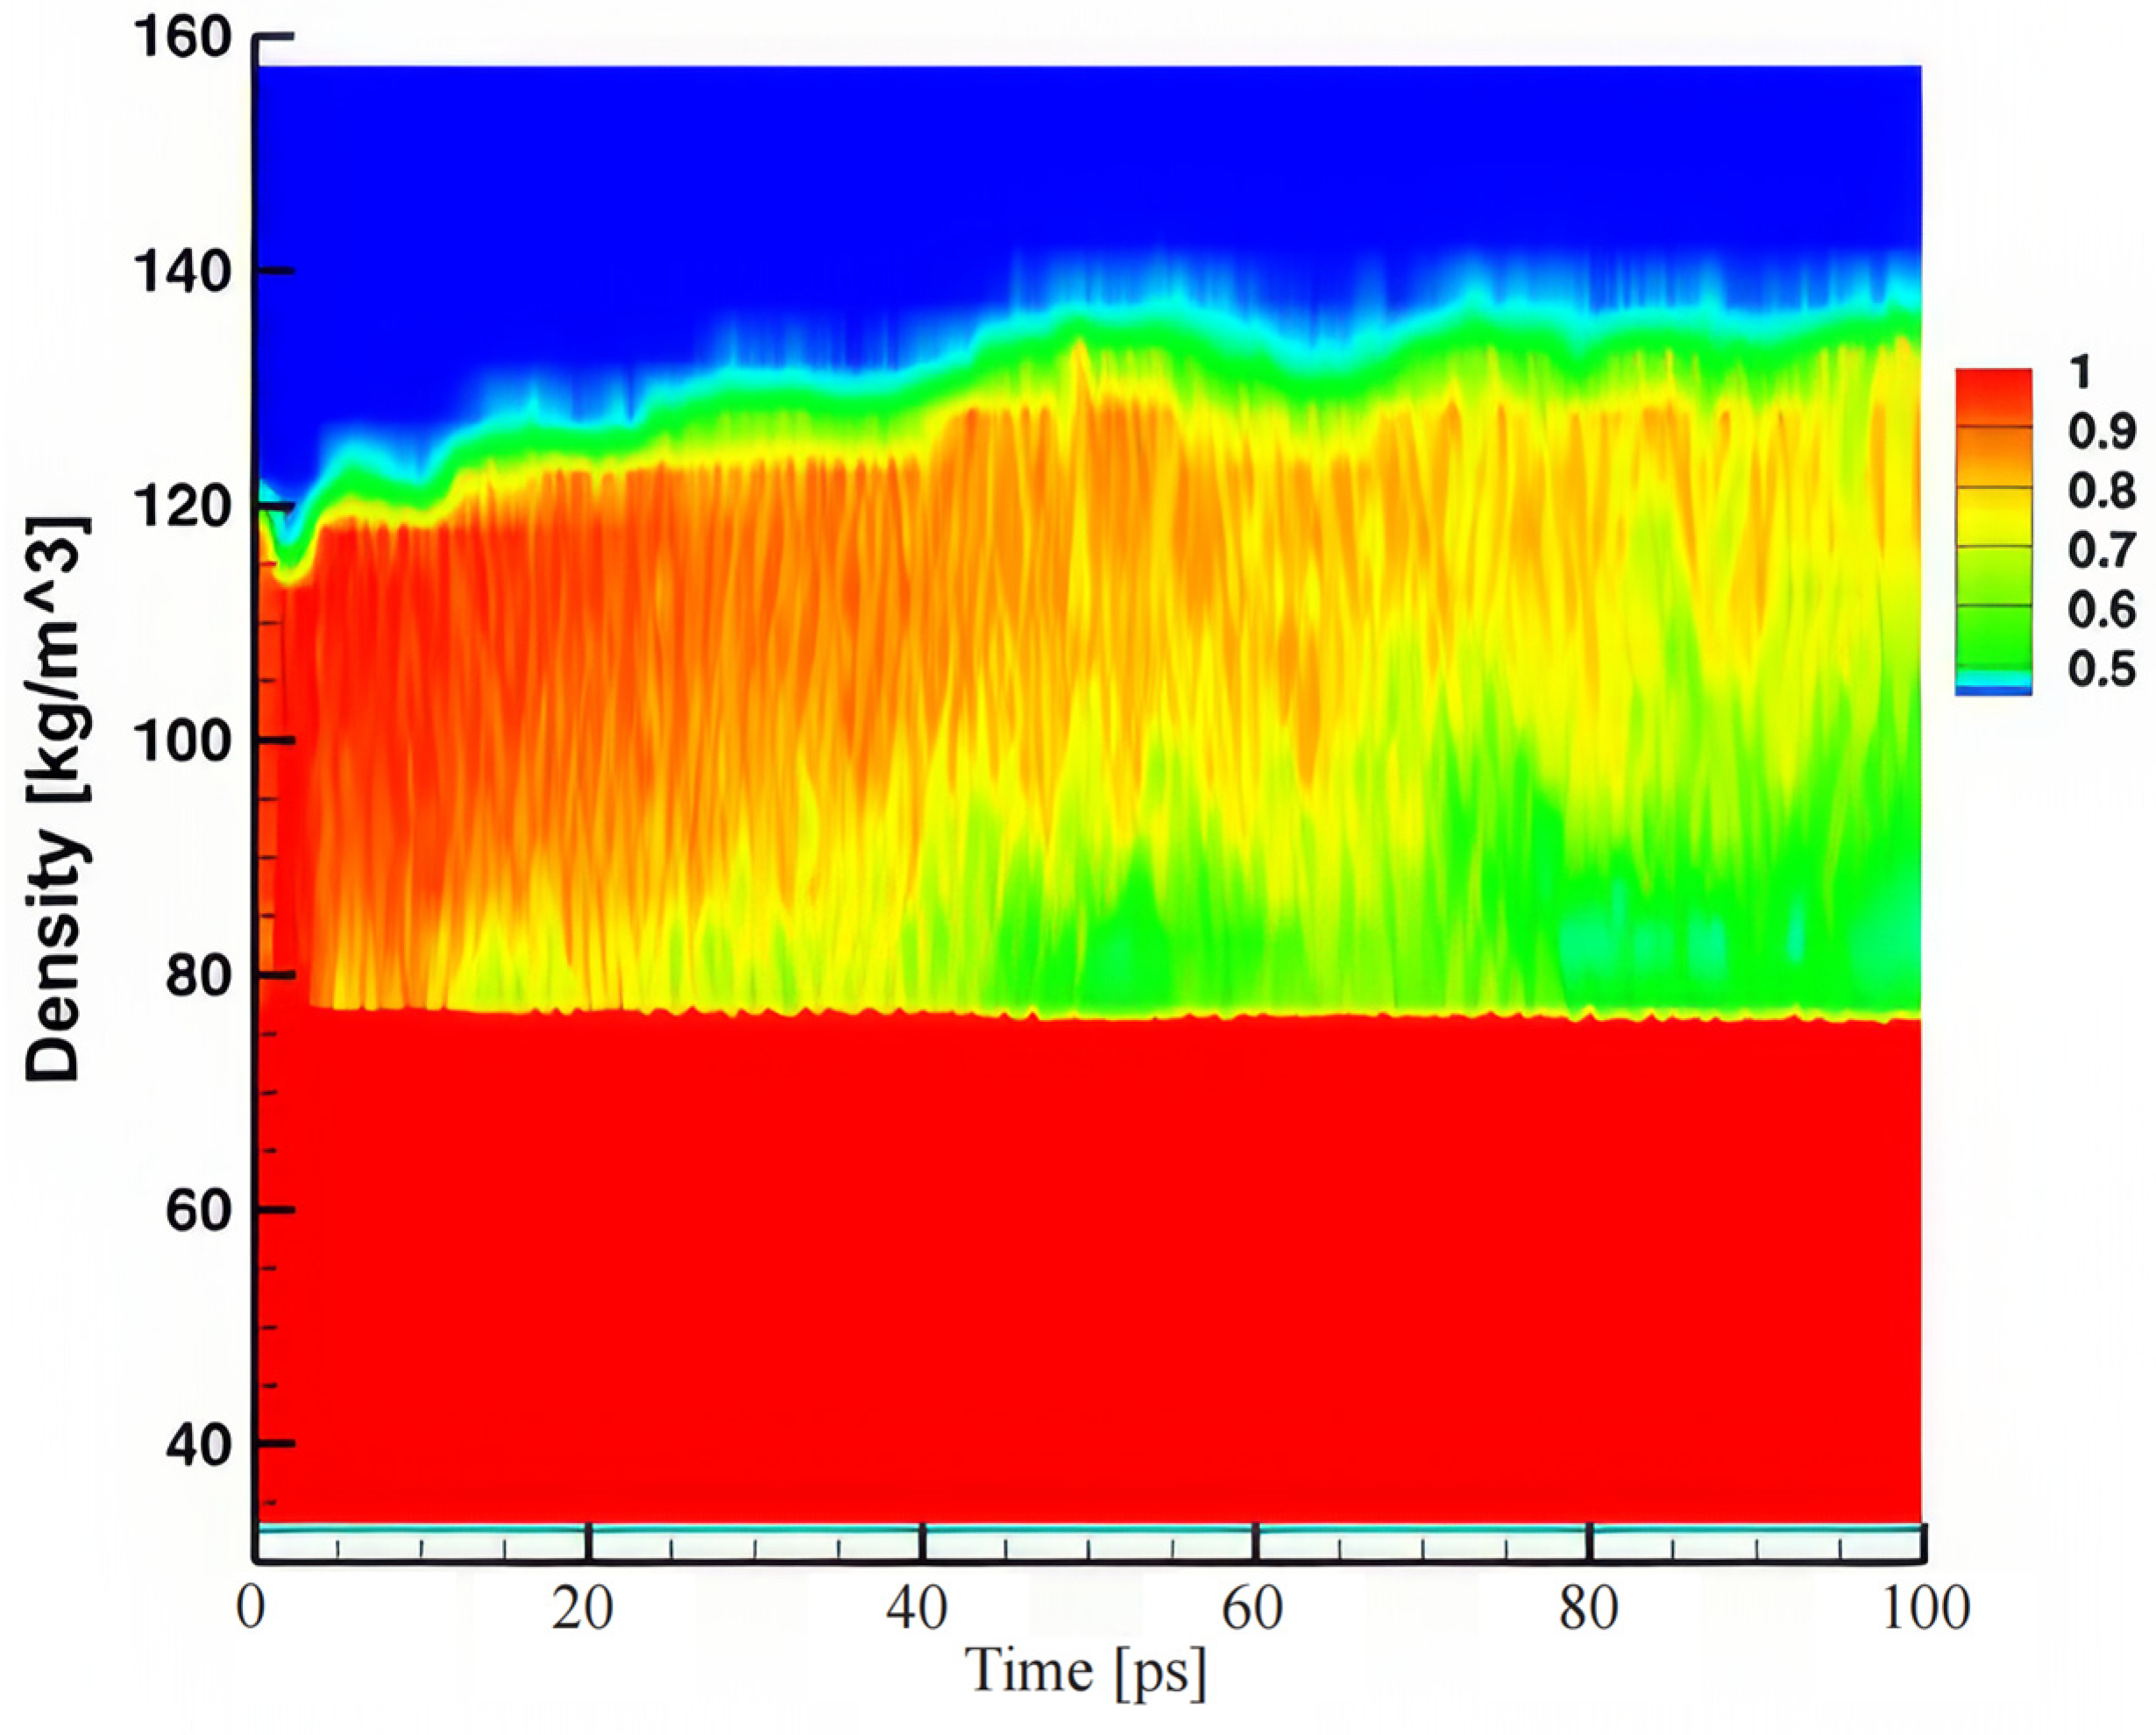
The density contour plot in
Figure 9 provides a detailed visualization of the thin-film boiling process on a nanostructured surface over time, illustrating the atomistic dynamics of phase transition and vapor–liquid interactions. The vertical axis represents the density distribution within the system, while the horizontal axis captures the time evolution of the boiling process. The color gradient, ranging from red (high density, liquid phase) to blue (low density, vapor phase), highlights the progressive evaporation of the thin liquid film and the formation of a vapor region as boiling evolves.
At the initial stages of the simulation, the density profile remains relatively uniform and high near the nanostructured surface (bottom red region), indicative of a stable liquid layer. However, as the time progresses beyond approximately 20 ps, a clear density gradient begins to form at the liquid–vapor interface. This gradient, transitioning from red to yellow and green regions, signifies the onset of vaporization driven by localized heating. The nanostructures facilitate this phase change by enhancing thermal conduction and creating localized hotspots where liquid molecules gain sufficient kinetic energy to escape into the vapor phase.
The upper region of the contour plot (blue) represents the vapor phase, which gradually expands over time, particularly after 40 ps. This expansion reflects the sustained and accelerated evaporation of the liquid film. The formation of a distinct liquid–vapor boundary, evident from the gradual color transition, underscores the role of the nanostructured surface in promoting efficient heat transfer. The nanoscale cavities and protrusions act as nucleation sites, reducing the energy barrier for bubble formation and ensuring continuous vapor release. Furthermore, the high surface area-to-volume ratio of the nanostructure enhances the contact area between the liquid and solid, further improving thermal energy distribution.
As the boiling process advances, the vapor phase becomes increasingly prominent, as seen in the upper portion of
Figure 9 where the density drops to near-zero values (blue region). This trend correlates with the depletion of the liquid phase near the surface, evidenced by the thinning of the red region over time. The persistence of intermediate density regions (yellow to green) suggests the presence of transient vapor clusters or bubbles undergoing dynamic coalescence and detachment. These regions also reflect the non-uniformity of vapor generation caused by the nanostructures, where localized hotspots drive heterogeneous evaporation.
The plot reveals that the nanostructured surface not only enhances the rate of evaporation but maintains a stable liquid–vapor interface, preventing the formation of insulating vapor layers that could otherwise impede heat transfer. The continued liquid replenishment near the surface, facilitated by capillary effects induced by the nanostructure, supports sustained nucleation and evaporation. This is particularly critical in thin-film boiling, where maintaining an efficient heat exchange is paramount to avoid thermal runaway or dry-out conditions.
3.5. Size Effect on the Ion Solution Droplet
The impact of droplet size on the evaporation process of the CuCl
2 solution droplets is a subject of interest due to its implications for material science and industrial applications.
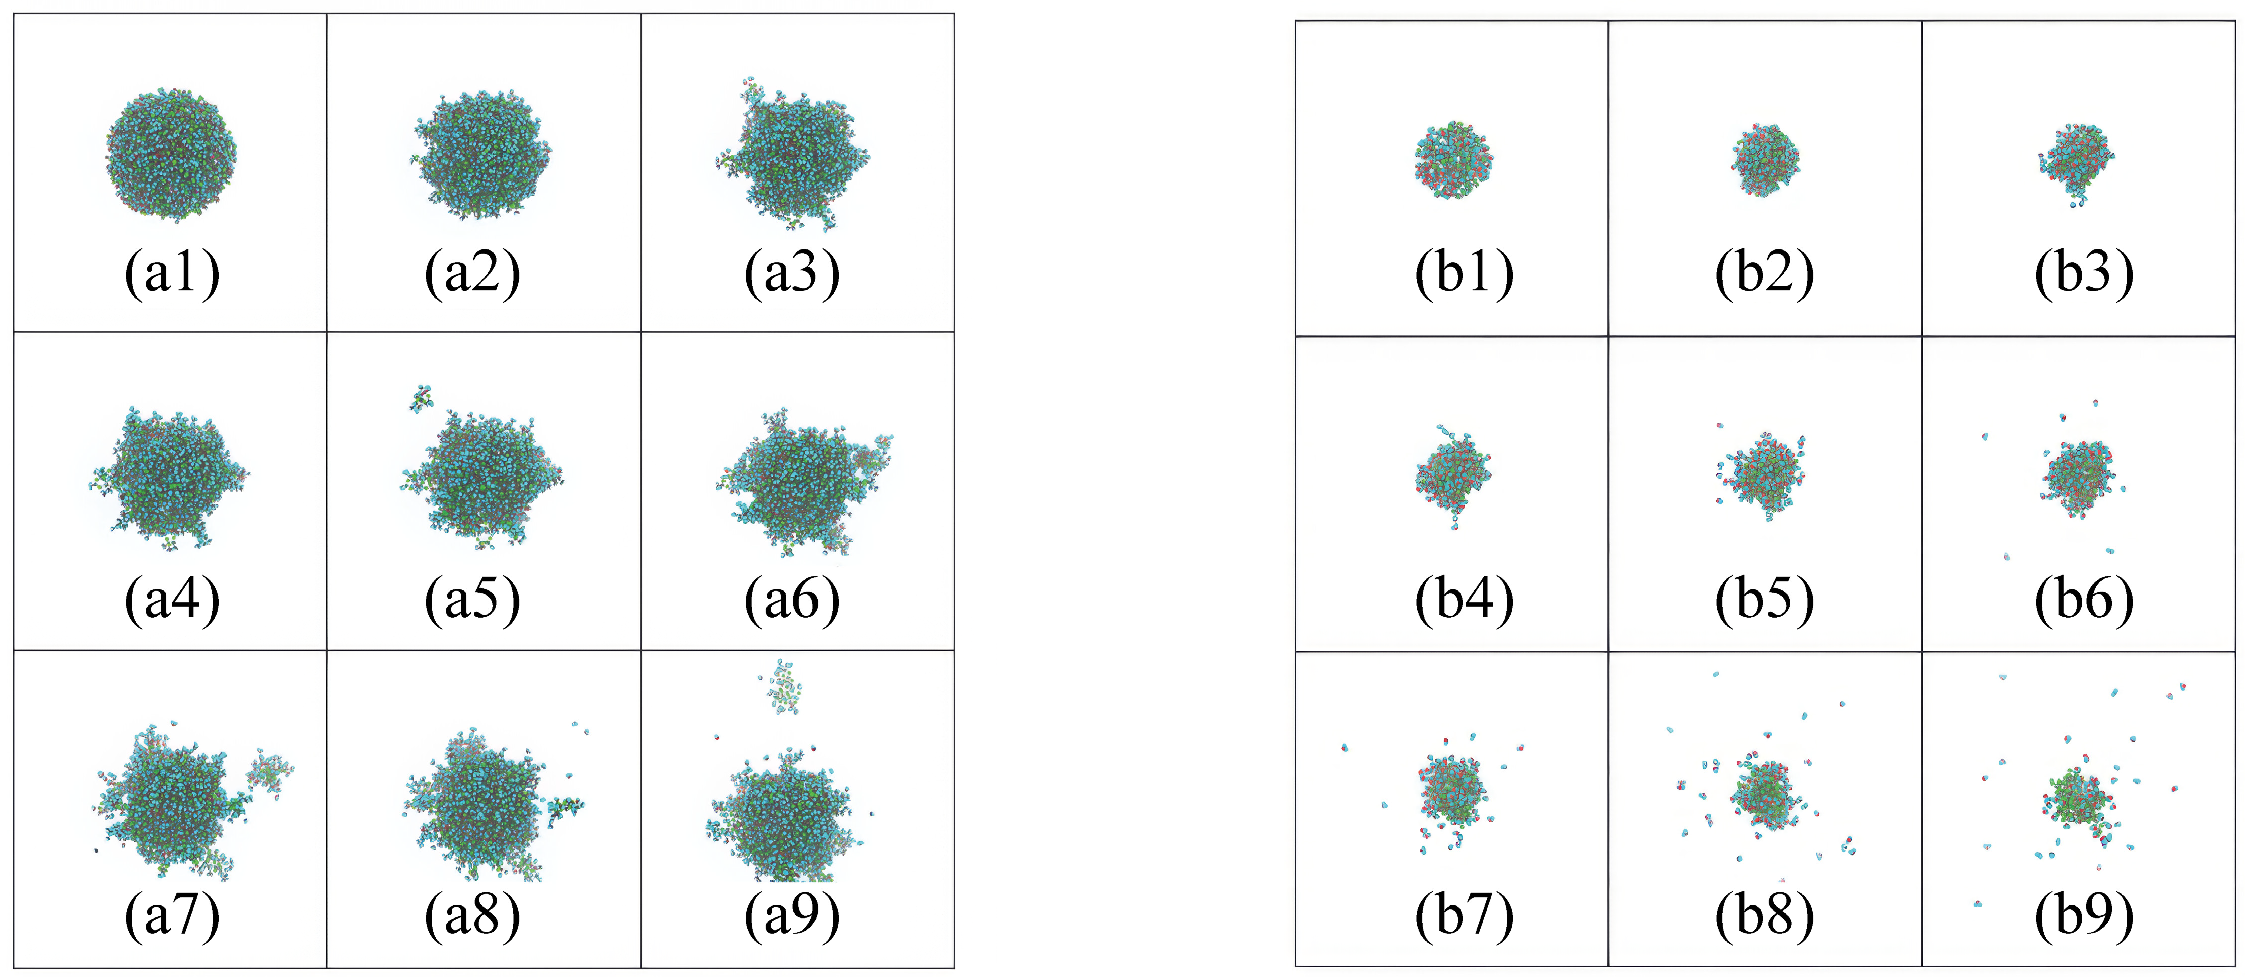
Figure 10 showcases the CuCl
2 solution droplets of varying sizes, providing a visual representation of the evaporation progression. The CuCl
2 droplet evaporation rate is close to the experiment research [
20]. In smaller droplets, the evaporation appears to be faster, likely due to the increased surface area-to-volume ratio, which facilitates a higher rate of solvent molecule escape. Conversely, larger droplets exhibit a slower evaporation process, as the proportion of surface area to volume is smaller, reducing the number of solvent molecules that can escape per unit time.
As the evaporation proceeds in these larger droplets, a transition occurs from a state of uniform distribution of ions to one where clustering and aggregation are evident. This aggregation is indicative of the increasing influence of interionic forces as the solvent evaporates, which can lead to diverse morphologies in the resultant solid, depending on the droplet size. The concentration gradient within the droplets also plays a critical role. As the solvent evaporates, the solute concentration near the droplet surface increases, potentially leading to the formation of a crust of solute that may further inhibit the evaporation process. This crust formation is more pronounced in larger droplets due to the longer diffusion path for solute molecules to reach the surface.
Our simulations show that smaller droplets exhibit a faster evaporation rate compared to larger droplets. This is primarily due to the higher surface area-to-volume ratio in smaller droplets, which facilitates a greater rate of solvent molecule escape. In smaller droplets, the larger surface area allows for more solvent molecules to escape per unit of time, leading to a faster overall evaporation process. As the solvent evaporates, ions become more concentrated near the surface, potentially forming a concentrated layer or crust that can affect the rate of evaporation in the later stages.
By contrast, larger droplets experience a slower evaporation rate. The smaller surface area-to-volume ratio in larger droplets means fewer solvent molecules are available at the interface for evaporation at any given time. Additionally, as the solvent evaporates, the concentration of ions in the droplet increases, and the formation of ion clusters may occur more gradually, affecting the overall evaporation process. These clusters can further slowdown the evaporation rate by forming barriers that hinder solvent diffusion to the surface.
Furthermore, the concentration gradient within the droplet becomes more pronounced in larger droplets, leading to a more substantial build-up of ions near the surface, which may eventually result in a solid crust forming, further impeding evaporation. In smaller droplets, the crust forms more quickly due to the more immediate concentration of solute, but the faster evaporation rate minimizes the impact on the overall process. These findings underline the importance of droplet size in controlling the evaporation dynamics of ionic solutions and offer valuable insights into the optimization of drying processes, particularly in industrial applications such as thin-film fabrication and material synthesis.


