Article

Pyrolyzed Biochar from Agricultural Byproducts: Synthesis, Characterization, and Application in Water Pollutants Removal

by
Niloy Chandra Sarker
1,†,
Md Abdur Rahim Badsha
2,†,
Greta Hillukka
2,
Bethany Holter
2,
Michael Kjelland
2 and
Khwaja Hossain
2,*
1
Department of Agriculture and Biosystem Engineering, North Dakota State University, Fargo, ND 58108, USA
2
Division of Science and Mathematics, Mayville State University, Mayville, ND 58257, USA
*
Author to whom correspondence should be addressed.
These authors contributed equally to this work.
Processes 2025, 13(5), 1358; https://doi.org/10.3390/pr13051358
Submission received: 26 March 2025 / Revised: 23 April 2025 / Accepted: 25 April 2025 / Published: 29 April 2025

Abstract

:
Biochar is a carbon-rich, porous substance produced from the thermal degradation process of carbon-based materials, like biomass and other solid waste, in an oxygen-deprived environment. The type of parent material and the conditions for processing are the principal factors in determining the properties of biochar. Because of its diverse physicochemical properties, biochar has gained growing attention over the decades as a cost-effective, sustainable, and emerging material with potential applications in energy, agriculture, and environmental sectors like wastewater treatment. Two different parent materials, such as wheat bran and maple leaf, were pyrolyzed at three different temperatures (300 °C, 500 °C, and 700 °C). The resultant biochar was analyzed for its adsorptive potential for different contaminants. All the tested physicochemical property values of the maple (Acer) leaf biochar were found to be higher than wheat (Triticum) bran biochar except bulk density and the dye absorption potential. Based on the biochar physiochemical properties, the pyrolysis temperature of 700 °C was found to be the best for pyrolyzing these biomasses. Irrespective of the biochar types, pH 2.0 with a residence time of 90 min outperformed with an initial dye concentration of 0.05 mg/mL and a biochar application rate of 50 mg/mL. Furthermore, MLBC exhibited higher oil adsorption potential in comparison with that of WBC. The addition of WBC and MLBC to the polymer beads increases their dye absorption competence; therefore, this biochar can be a potential means of water treatment.

1. Introduction

Biochar is a fine-grained and porous substance that is carbon-rich and can be produced by the thermal decomposition and pyrolysis of biomass under limited oxygen conditions [1]. In recent years, the preparation of biochar from different agricultural wastes and its utilization in the enhancement of agricultural fields and reduction in environmental pollution have received substantial interest from researchers worldwide. Specifically, biochar’s properties, such as carbon sequestration, CH4 emission reduction [2], and its sorption capacity [3,4,5,6], have brought it to the attention of environmental science researchers and other fields. Biochar becomes important in soil amendment by improving soil fertility, moisture holding capacity, and nutrient retention [7]. Furthermore, the large surface area of the biochar compared to its particle size makes it a valuable adsorbent [8,9,10]. However, biochars produced from various parent materials and different processing conditions (i.e., pyrolysis temperature, pyrolysis time, heating rate) may exhibit different surface areas and hence can exhibit different properties that are explored extensively [11,12,13,14,15].
Wheat is one of the major cereal and field crops in terms of acreage and production in the U.S. and worldwide [16,17]. Wheat bran, a byproduct of wheat processing, can make up to 25% of the output after milling and is primarily used as cattle feed. However, due to high transportation costs relative to bran, a significant amount of wheat bran remains on farmers’ land, causing environmental pollution [18]. Conversely, maple leaves are among the most abundant plant residues, and fallen maple leaves during the fall season may pose a serious issue for households. Nevertheless, wheat bran contains minerals, fiber, and bioactive compounds [19,20,21]. Similarly, the mineral content of maple leaves (e.g., Ca, Mg, N, and P) exceeds 5%, while even common pine needles have around 2.5% [22]. Therefore, both wheat bran and fallen maple leaves could serve as potential feedstocks for producing carbonaceous adsorbents like biochar. However, there are limited reports on producing biochar from wheat bran and maple leaves using various processing conditions and comparative analyses of the resulting biochar for their adsorptive behavior. Thus, the potential for utilizing these inexpensive and abundant agricultural byproducts and maple leaf waste should be explored. To achieve this goal, we hypothesized that the physicochemical properties of biochar from these two sources would change with processing temperatures. Therefore, the specific objective was to investigate and compare the effects of three pyrolysis temperatures (300 °C, 500 °C, and 700 °C) on the characteristics of biochar derived from wheat bran and maple leaves, as well as their adsorptive behaviors.
Heavy metals harm humans, animals, and plants because of their recalcitrance and toxicity, which contaminates the water. Therefore, an efficient method for heavy metal removal from water is a global concern. Conventional methods used for this purpose are costly, require high energy or reagents, and generate toxic slush [23,24]. However, absorption is an alternative technique for heavy metal removal because of its high efficiency and low cost [25]. Although several polymers have been used as heavy metal removal absorbents, new polymers with biodegradability, high efficiency, and low cost are always desired. Therefore, the polymer beads from biochar might be a good alternative means of heavy metal removal due to their low cost, biodegradability, high absorption capacity, and innocuity. So, the research interest is to investigate the effect of the addition of wheat bran and maple leaf biochar on the polymer beads for heavy metal removal efficiency. The biochar is encapsulated in the beads to prevent it from passing through a filtration system. Therefore, they are larger than any mesh size or filter pore size, allowing water to pass through while keeping the encapsulated biochar beads from going through as well. This way, the biochar will not stick to anything else in the solution if it is locked in the polymer bead.

2. Materials and Methods

2.1. Materials

2.1.1. Collection and Pre-Processing of Biomass

Wheat bran and maple leaves were collected from North Dakota Mill, Grand Forks, North Dakota, and the household’s premises in Mayville, ND, respectively. Upon collection, the wheat bran was sieved to achieve a uniform size distribution of 2–3 mm of the bran. The collected maple leaves were washed to remove dirt and were oven dried at 60 °C. Both biomass samples were then charred at three different temperatures, i.e., 300 °C, 500 °C, and 700 °C, using a bench-top temperature control muffle furnace (M BF51748C Muffle Furnace, Thermo Scientific, Columbia, MD, USA) with a temperature accuracy of ±1%. For preparing charcoal at each temperature, three identical metal containers were used to represent three laboratory replications, and each of the samples was charred three times to represent instrument replications. The volumes for each of the used containers were 3.93 × 105 mm3 (50 mm height, ×50 mm radius), and the amount of biomass in each of these containers was 40 g. After pyrolysis at different temperatures, the biochar samples in the metal containers were kept with the lid open and allowed to cool at room temperature before measuring the yield. For further characterization, the biochar samples were stored in sealed glass vials to avoid the addition of any unwanted moisture.

2.1.2. FITC Dye and Oil

FITC dye was purchased from Sigma Aldrich (St. Louis, MO, USA). This is abbreviated as fluorescein isothiocyanate, a derivative of fluorescein. The following characteristics make it the most popular xanthene dye. First, its good water solubility enables easy conjugation preparation. After conjugation, it shows reasonably large extinction coefficients and high quantum yield, which produces a bright fluorescence, and, lastly, its nonspecific binding is relatively low for most of the biological tissue. Notably, it has some unfavorable properties, including photostability, pH sensitivity, and polar sensitivity. Nonetheless, it has a wide range of applications, for example, biological research, pH indicator, and flow cytometry.
The oil used in the present experiment is motor oil, specifically PENNZOIL Engine Oil, which was purchased from Grainger Industrial Supply (Lake Forest, IL, USA).

2.1.3. Preparation of Adsorbent (Beads)

Bead preparation started with dissolving 1.20 g of phytagel in 125 mL of deionized water in a 500 mL beaker and stirring with a magnetic stirrer at room temperature for 15 min. Four separate solutions were made by mixing biochar (WBC and MLBC) in different ratios. The weight ratios of phytagel to biochar (WBC and MLBC) are 1:1, 1:2, 1:5, and 1:10. Therefore, the amounts of biochar (WBC and MLBC) corresponding to 1.2 g of phytagel were 1.2 g, 2.4 g, 6.0 g, and 12.0 g, respectively. The mixtures were continuously stirred at room temperature for another 15 min. In the second breaker, a solution of 0.5 g MgCl2·6H2O in 250 mL deionized water was prepared. Then, the first solution was taken into a separating funnel and allowed slowly to drip into the second solution beaker with continuous stirring at 100 rpm. Finally, the beads in the salt solution were stirred for another 10 min to settle the beads down while maintaining the same rotational speed. The phytagel polymer used here was obtained from Sigma Life Science (Woodlands, TX, USA).

2.1.4. Preparation of Cu2+ Solution

Copper (Cu2+) solution was prepared by dissolving 250 mg CuSO4·5H2O salt in 500 mL deionized water (500 mg/L). Diluted HNO3 and NaOH solutions (0.01 M) were used for pH adjustment of the copper solution. The “blue vitriol” salt used in the experiment was obtained from Fisher Scientific, Waltham, MA, USA.

2.2. Characterization of Biochar

Biochar samples produced from both biomass sources at each temperature were analyzed for their physicochemical properties, surface morphology, and adsorption potential.

2.2.1. Physicochemical Property

To determine the physicochemical properties of each biochar sample at three different pyrolysis temperatures, the pH, electrical conductivity (EC), total carbon (TC) content, bulk density (BD), and water holding capacity (WHC) were determined.
The pH, electrical conductivity (EC), bulk density (BD), and water holding capacity of the biochar were measured by following a protocol described by several researchers [26,27,28]. For pH and EC measurements, each of the biochar suspensions was made by adding 1% (w/v) of biochar in deionized water under continuous stirring at 90 °C using a magnetic hot plate stirrer. The suspension was then cooled down to room temperature, and a bench-top pH/EC meter (Cat. No. 89231-676, B10C Benchtop Meter, VWR, Radnor, PA, USA) was used to measure pH and EC. Concurrently, bulk density in g mL−1 of the biochar was calculated using the equation given below:
B u l k   d e n s i t y = W e i g h t   o f   d r y   b o c h a r   ( g ) V o l u m e   o f   p a c k e d   d r y   b i o c h a r   ( m L ) × 100  
The bulk density was measured by keeping each biochar type in a 20 mL glass vial and drying it in an oven overnight at 90 °C to obtain the moisture-free mass in grams (g). To measure the volume, the glass vials were tapped manually for 1 to 2 min to compact the dried biochar, and the volume was measured in milliliters (mL). The water holding capacity (WHC) of the biochar was determined and is reported as the water content (%) of the biochar on an oven-dried basis using a modified protocol previously described by several researchers [27,29].
To determine the TC, the biochar samples were first air dried, ground, and sieved to obtain a uniform size distribution of 250 µm. The sieved biochar was heated at 1050 °C in the presence of ultra-pure oxygen using a bench-top furnace, followed by cooling at 4 °C using a Peltier cooler to remove residual moisture. Halogens and sulfates were removed from the gas stream by passing the gas stream through copper mesh and silver wool, respectively. The gas stream was stabilized by passing it through a gas manifold. An infrared (IR) sensor in a primacsSNC analyzer (Skalar, Inc., Buford, GA, USA) was used to measure CO2 in the upstream process.

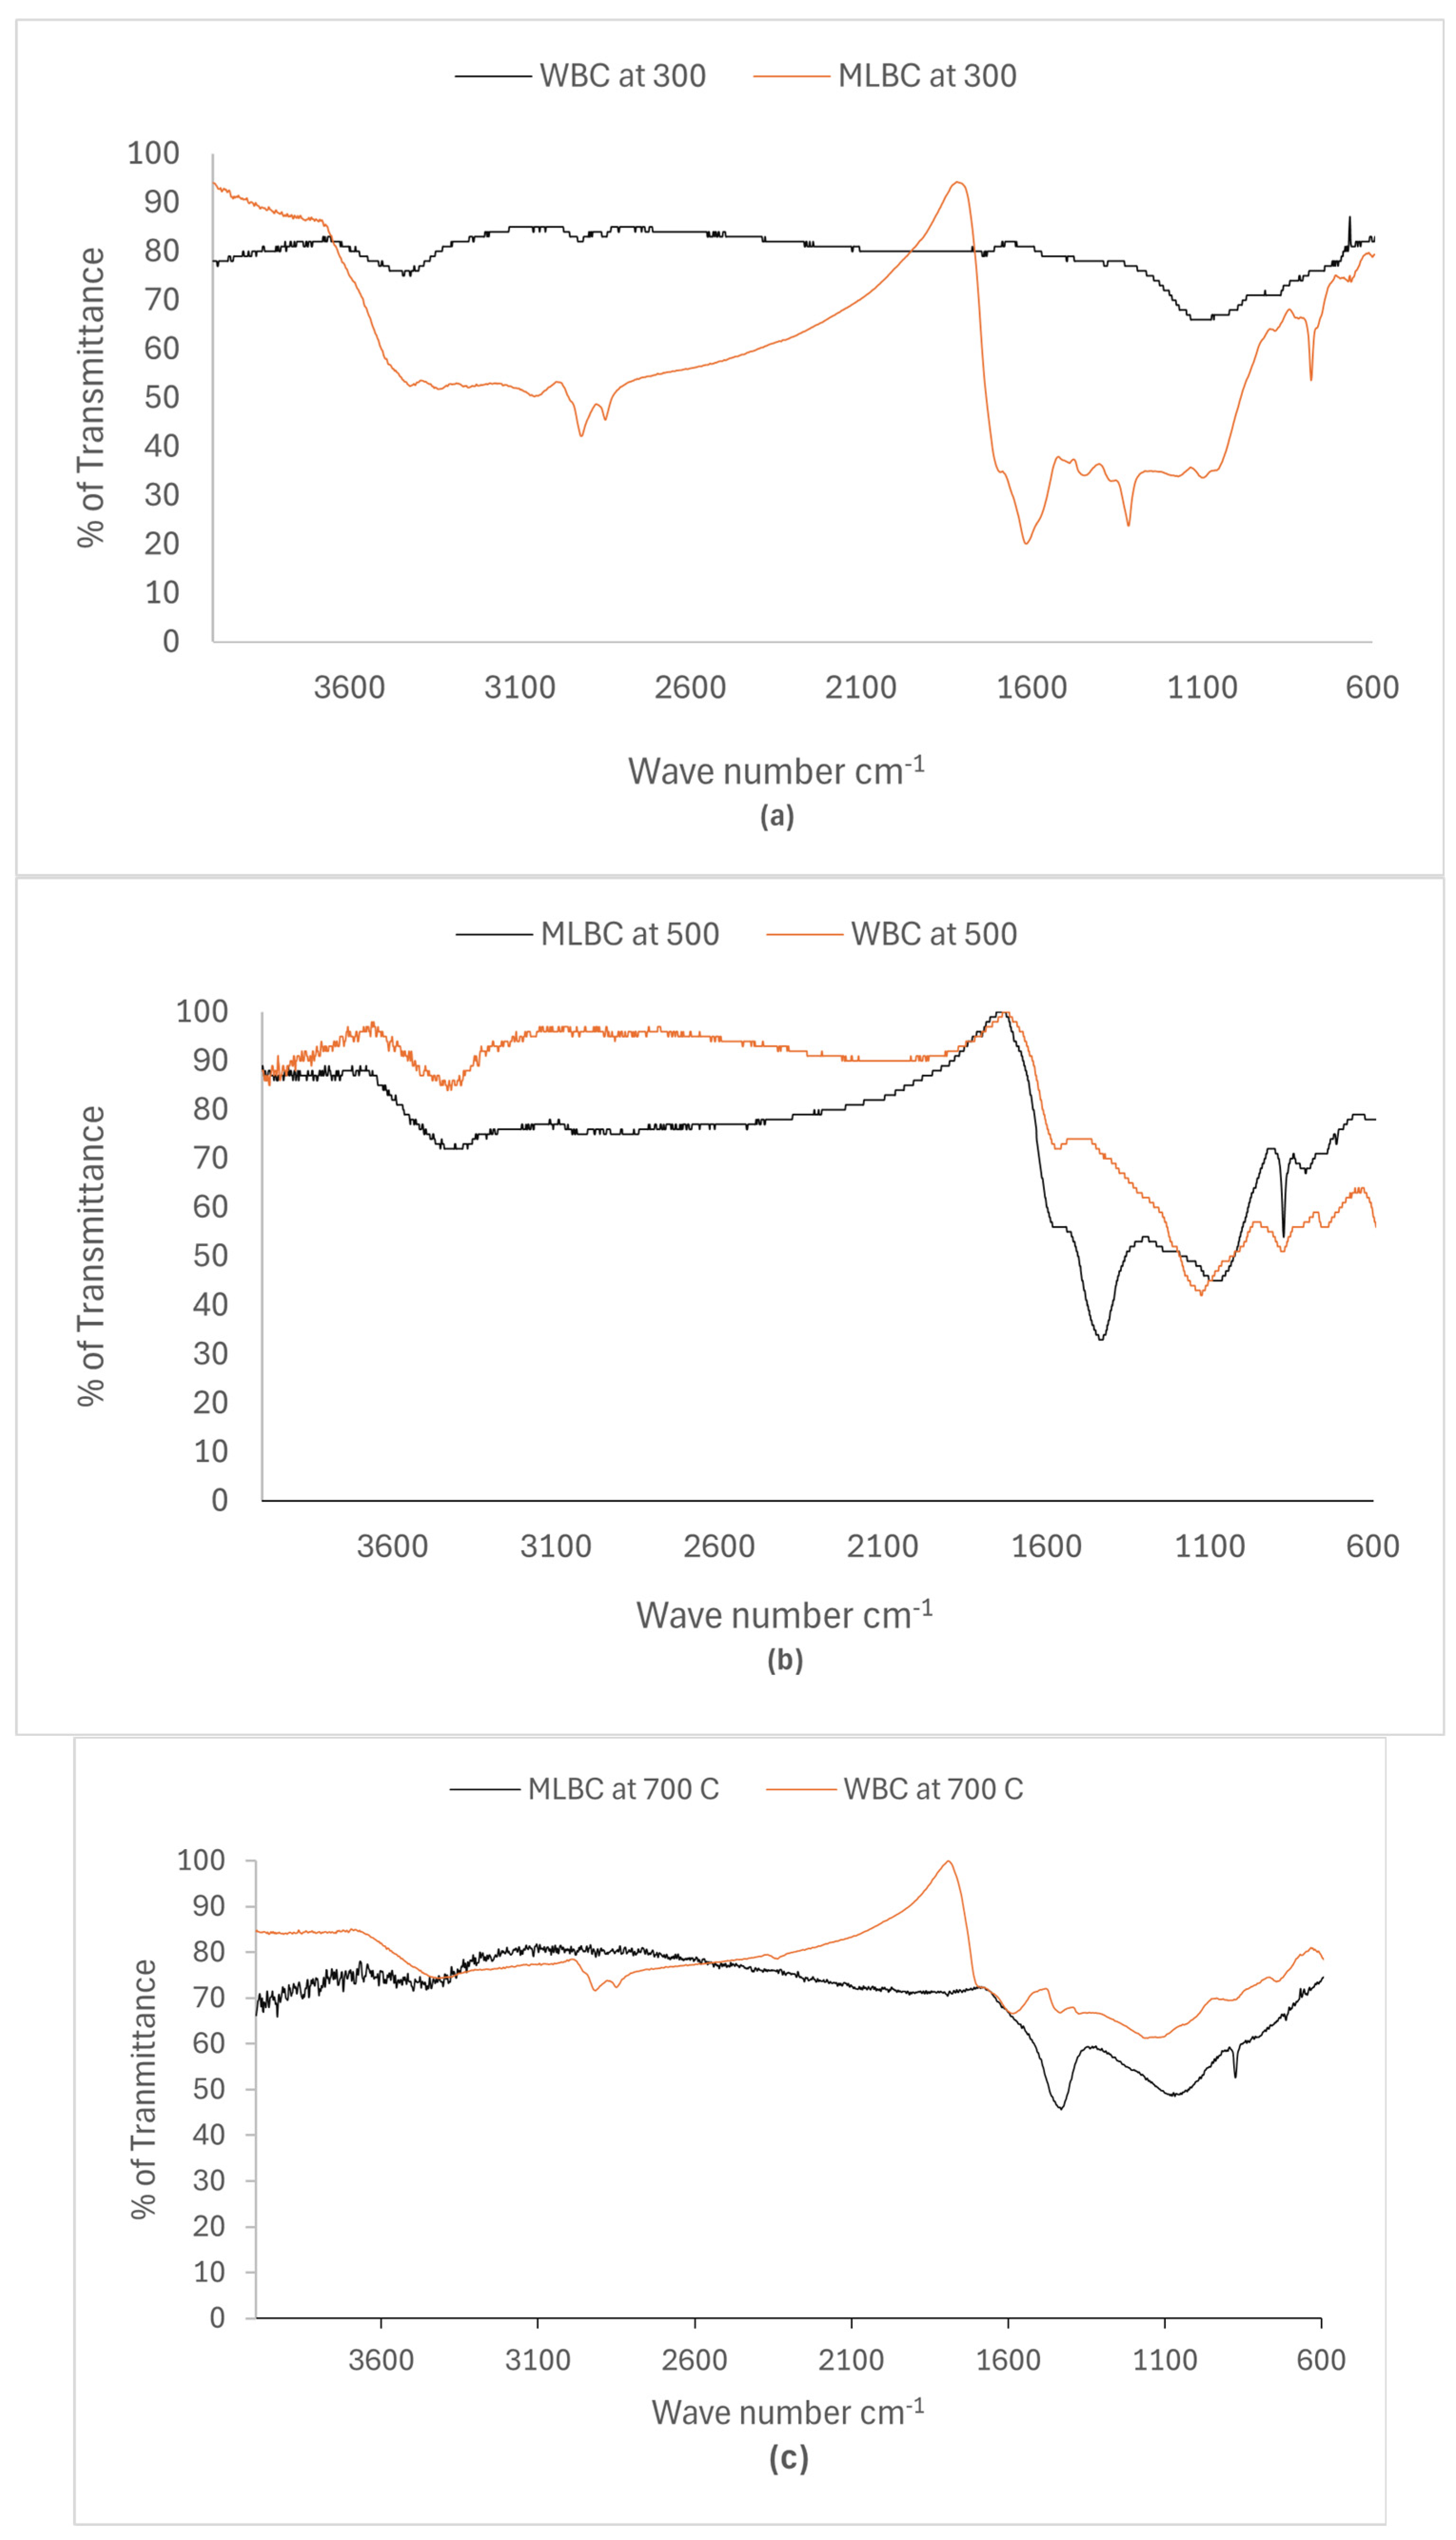
2.2.2. Surface Chemistry

The presence of functional groups and the chemical composition of the wheat bran and maple leaf biochar were examined using the Fourier transform infrared spectroscopy (FT-IR). A Thermo Scientific Nicolet 8700 FT-IR instrument at a resolution of 4 cm−1 was used for FT-IR analysis. A previously described protocol was followed to prepare the BC samples for FT-IR analysis [27,28]. Potassium bromide (KBr) pellets were prepared from fine powder of crushed and pulverized KBr and BC samples at a 1:100 ratio. Before forming the pellet using a hydraulic press (2 tons), the resultant fine powder was dried for 2 min using a light bulb. The transmittance spectrum was achieved by scanning the resultant pellets 32 times. A reference control pellet was prepared using only KBR powder and was scanned 32 times.

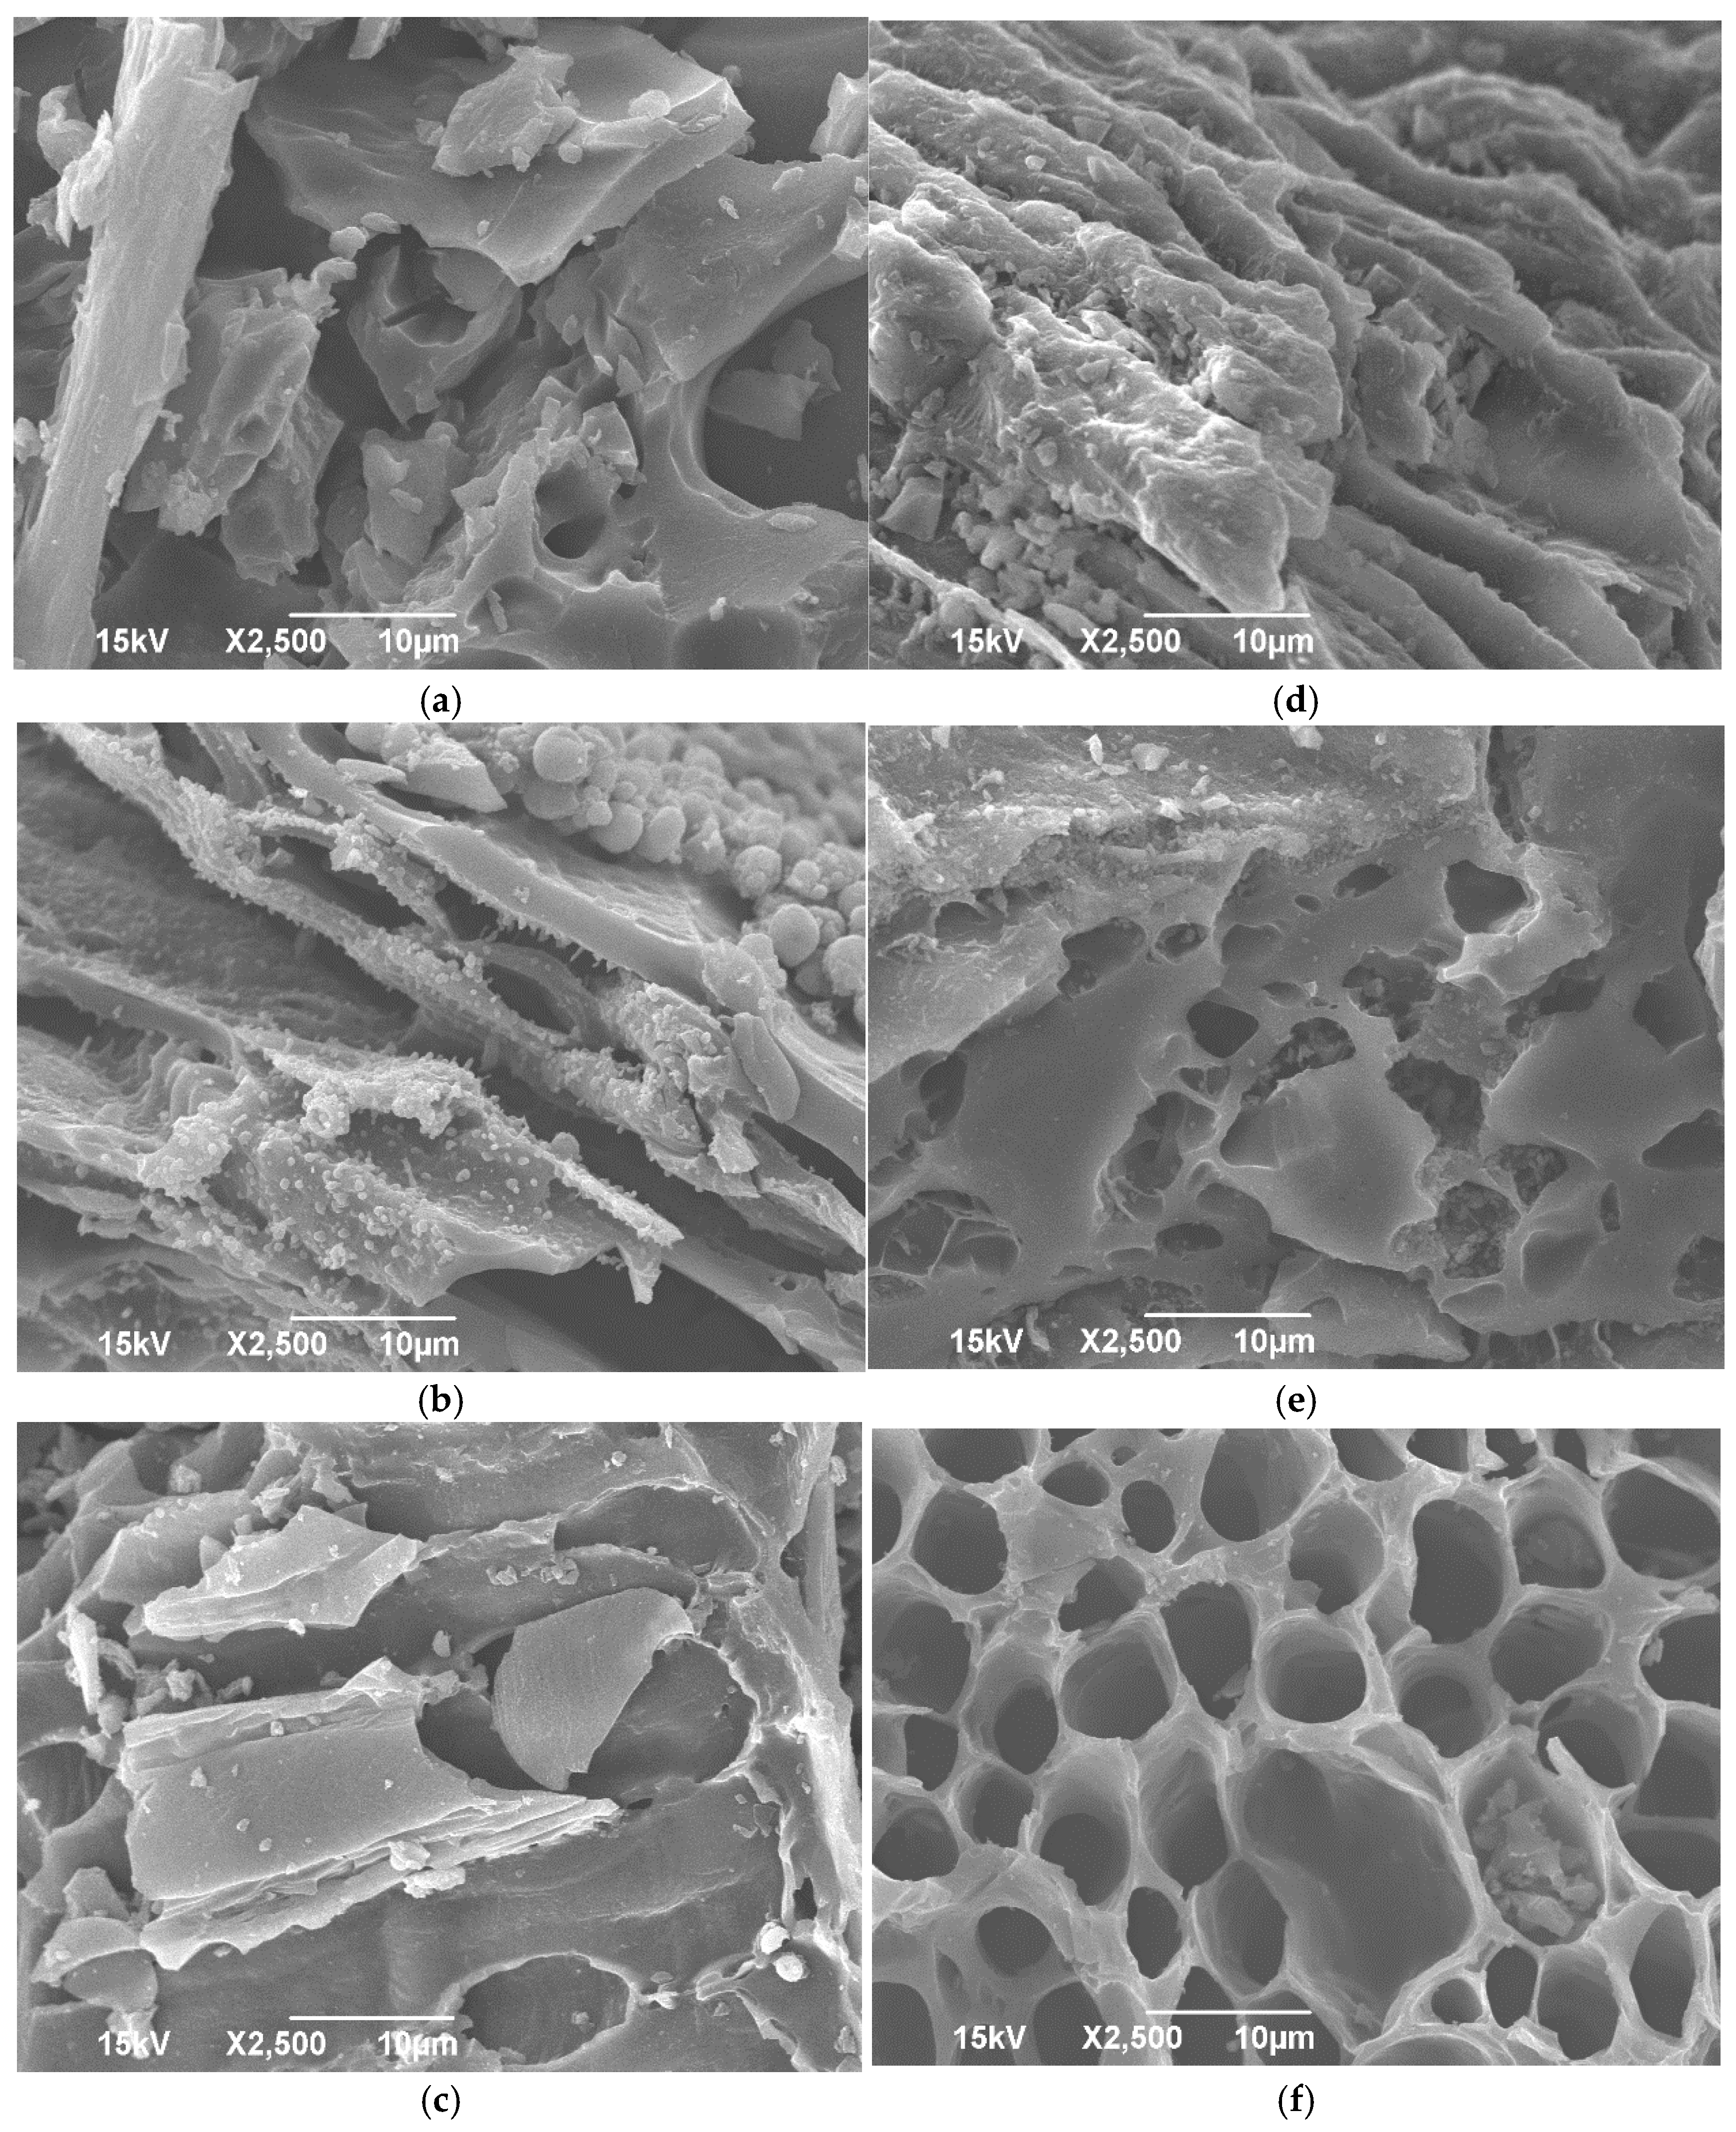
2.2.3. Surface Morphology

The morphology of the biochar samples was analyzed using a Scanning Electron Microscopy (Model: JEOL JSM-6490LV SEM; JEOL USA, Inc., Peabody, MA, USA) at the Electron Microscopy Center of North Dakota State University. Biochar samples were prepared by attaching to cylindrical aluminum mounts using double-stick carbon adhesive tabs (Ted Pella, Redding, CA, USA) and were coated (Cressington 108 Auto, Ted Pella) with a conductive layer of gold before taking the images. Three levels of magnification (750, 1500, 3000×) were taken for each of the samples to attain quality images.

2.2.4. FT-IR Analysis for Biochar Beads

The FT-IR spectra of biochar beads before and after adsorption of metal ions were obtained. The FT-IR graphs showed absorption frequency versus transmittance (%). The frequency range of the peaks was recorded to be 4000–650 cm−1. The signals were recorded by using the following parameters: angle of incidence, 45°; sampling area, 2 mm; the number of background scans, 32; optical resolution, 4.00 cm−1. The degree of cationization of the spectrum has been calculated by using the following equation.
C= (I1648I1495)/I1648 × 100%
I1648 and I1495 are the maximum intensities of the peaks at 1648 and 1495 cm−1, respectively.

2.2.5. Batch Adsorption Study

The batch adsorption study of six different biochars was carried out to find the FITC dye removal potential of the biochar types. Four different variables, i.e., pH, residence time, biochar amount, and dye concentration, were examined to find the optimum condition. All batch adsorption studies were conducted in 50 mL falcon tubes, and the adsorption study systems were incubated on an orbital shaker at 150 rpm. To find the effect of pH (2, 4, 6, 8, 10, and 12) on the dye removal, the initial dye concentration (0.05 mg/mL), biochar amount (20 mg/mL), and the residence time (120 min) were kept constant. To find the effect of adsorbent amount (20, 50, 100 mg/mL) at pH (2.00), dye concentration (0.05 mg/mL), and the residence time (120 min) was kept constant. The effect of residence time (60, 90, 120 min), the pH (2.00), the adsorbent amount (20 mg/mL), and the dye concentration (0.05 mg/mL) were kept constant. To study the dye concentration (0.03 mg/mL, 0.05 mg/mL, and 0.1 mg/mL), the pH (2.0), adsorbent amount (50 mg/mL), and the residence time (120 min) were kept constant. Samples from each of the falcon tubes were collected after filtration using filter paper, and the amount of dye removal was measured using UV-VIS spectroscopy.

2.2.6. Oil Adsorption

Besides the batch adsorption study of the dye removal, a separate study was conducted to find the adsorption potentiality of the biochar against motor oil. For the motor oil adsorption study, three variables, such as motor oil amount, biochar amount, and residence time, were examined. For each case, the motor oil was mixed to a 1:1 ratio with the tap water to mimic the condition of oil spreading into the surface water body. To study the effect of residence time, the motor oil and the biochar amount were kept constant. To study the effect of biochar amount, the motor oil amount and the residence time were kept constant. Contrariwise, to find the effect of motor oil amount, the residence time and biochar amount were fixed. After the incubation period, the adsorbed mass was filtered through a steel filter, and from the known amount of oil to biochar addition, the adsorption potentiality of each of the biochar types was calculated using the formula below:
C A = ( W C M W B C ) / W B C
Here, CA is the adsorption capacity (mg/g); WCM is the weight of the conjugated mass (g); and WBC is the weight of the biochar (g).

2.2.7. Adsorption Study for Biochar Beads

Batch experiments were conducted at room temperature by stirring a constant mass of dry biochar beads in 50 mL of metal ion solution under certain conditions. Each of the four types of biochar beads (1.0 g) was taken in a 50 mL falcon tube containing 50 mL of metal ion solution (500 mg/L) and stirred for 2 h at room temperature, maintaining 150 rpm. After the experiment, the mixture was centrifuged and filtered. The amount of metal ions adsorbed on the beads was measured by UV-VIS spectroscopy. The absorption measurements were run by a GENESYS 10S UV-Vis spectrophotometer by Thermo Scientific at Mayville State University, Mayville, ND, USA. The scan rate for the experiments was 500–900 nm with a fast scan rate mode at a step size of 5 nm.

3. Results

3.1. Biochar pH, EC, Bulk Density, and Water Holding Capacity

The pyrolysis of biomass at different temperatures removes different amounts of volatile matter at different rates. Therefore, the pyrolysis temperature acts as a driving force of the biochar property and causes different extents of composition (yield, pH, electrical conductivity, bulk density, and water holding capacity) and morphological changes to the produced biochar. As biomass increased, higher pyrolysis temperatures tended to remove more volatile matter faster, resulting in a decreased yield (%) of biochar with rising temperatures. Among the pyrolysis temperature range (300 °C, 500 °C, and 700 °C), the yield for the WBC was found to be 27.1%, 23.4%, and 19.7%, respectively, while the yield was 29.3%, 24.5%, and 22.8%, respectively, for the MLBC.
In the present research, the biochars were produced at three different temperatures and from two slightly alkaline biomass types, and the pH among the biochar types varied between 8.27 and 8.91. In general, MLBC was marginally alkaline compared to its counterpart, WBC. The pH range of the produced biochar types was found to be identical to other similar studies [30,31,32]. However, no consistent patterns were found among the biochar types with temperature changes. Having an alkaline nature, the produced biochar could possibly reduce soil acidity and thus increase the soil nutrient sorption capacity [33]. The presence of the total amount of dissolved salt and or ions in the biochar can be determined by the electrical conductivity (EC) of the biochar type. The EC of the biochar is found to be increased with the increasing temperature and varies between 417 µS cm−1 to 647 µS cm−1. Similar to that of pH, MLBC exhibited higher EC compared to WBC and confirmed the presence of a higher number of dissolved ions.
Biochar bulk density depends on the parent biomass and specifically on the inter-particle void spaces. Therefore, the bulk density of biochar derived from the same parent biomass did not vary significantly. However, MLBC exhibited significantly lower bulk density compared to biochar derived from wheat bran. The bulk density for WBC ranged between 0.43 g mL−1 to 0.47 g mL−1, whereas the bulk density for MLBC varied from 0.27 g mL−1 to 0.32 g mL−1. The lower bulk density of MLBC confirmed the presence of a higher amount of macropores and micropores compared to those of WBC. Therefore, MLBC could be more beneficial than WBC with respect to increasing the water holding capacity (WHC) when it is applied to soil. The WHC of soil is defined by the amount of water that can be held against the gravitational force, and it is a critical agronomic property. A higher WHC of the soil lowers the nutrient leaching, and thus a higher amount of nutrients becomes available to the crops. Two types of biochar produced in this study at three different temperatures exhibited a 72 to 86% water holding capacity, and, in general, maple leaf biochar showed a higher WHC than that of WB biochar. Additionally, with the same biochar type, the WHC also showed an increasing trend with increasing temperature. Therefore, the maple leaf biochar at 700 °C exhibited the highest WHC, at 86%, and would be a good candidate to boost the soil WHC in specific soils where the WHC is lower and thus has higher nutrient leaching (Table 1).

3.2. Biochar Surface Chemistry

The IR spectra presented in Figure 1 represent the transmittance spectra of two different types of biochar; each was prepared at three different temperatures (300 °C, 500 °C, and 700 °C). The characteristic peaks at different wavenumber regions validate the presence of different functional groups in the prepared biochar. Irrespective of the biochar type and pyrolysis temperature, the characteristic peaks around 3400 cm−1 were ascribed to the stretching vibration of the hydroxyl groups. The presence of this hydroxyl group in biochar samples could be from one or the other among residual water, aliphatic primary and secondary alcohols of the phenolic compounds, cellulose, and hemicellulose, which were present in the biomass. The characteristic wide peak for stretching of the C-H vibration bond specified the presence of polysaccharide moieties around 2800–3000 cm−1. Both C-O and C-H bonds stretching from the lignin components of each biomass type were identified around the 1000–1100 cm−1 and 800–900 cm−1 wavenumber region, respectively. In general, all of the biochar types exhibited similar types of characteristic peaks. Biochar, which was pyrolyzed at lower temperatures, has shown more residual water compared to that pyrolyzed at higher temperatures.

3.3. Surface Morphology of the Biochar

The SEM images, shown in Figure 2, elucidate structural changes in the biochar particles at different temperatures (300, 500, and 700 °C). The pyrolysis of the ML and WB resulted in lumpy surfaces with tiny pores in the biochar samples to facilitate a larger surface area. The micrograph images clearly showed both microporosity and morphological differences in biochar surfaces at three different temperatures. Passage-like structures proliferate the biochar surface to reveal partial morphological retention of the parent biomass. The removal of volatile matter from the parent biomass (ML and WB) during pyrolysis resulted in a highly porous structure of the biochar. The pyrolysis of ML and WB at higher temperatures resulted in higher porous biochar with a larger ratio of biochar particle size to surface area. The presence of low lignin and high volatile matter in the ML and WB smoothed the formation of pores. The pores developed by the removal of volatile matters would facilitate the carbonization and activation of the organic matter to enhance the adsorption capacity of the biochar.

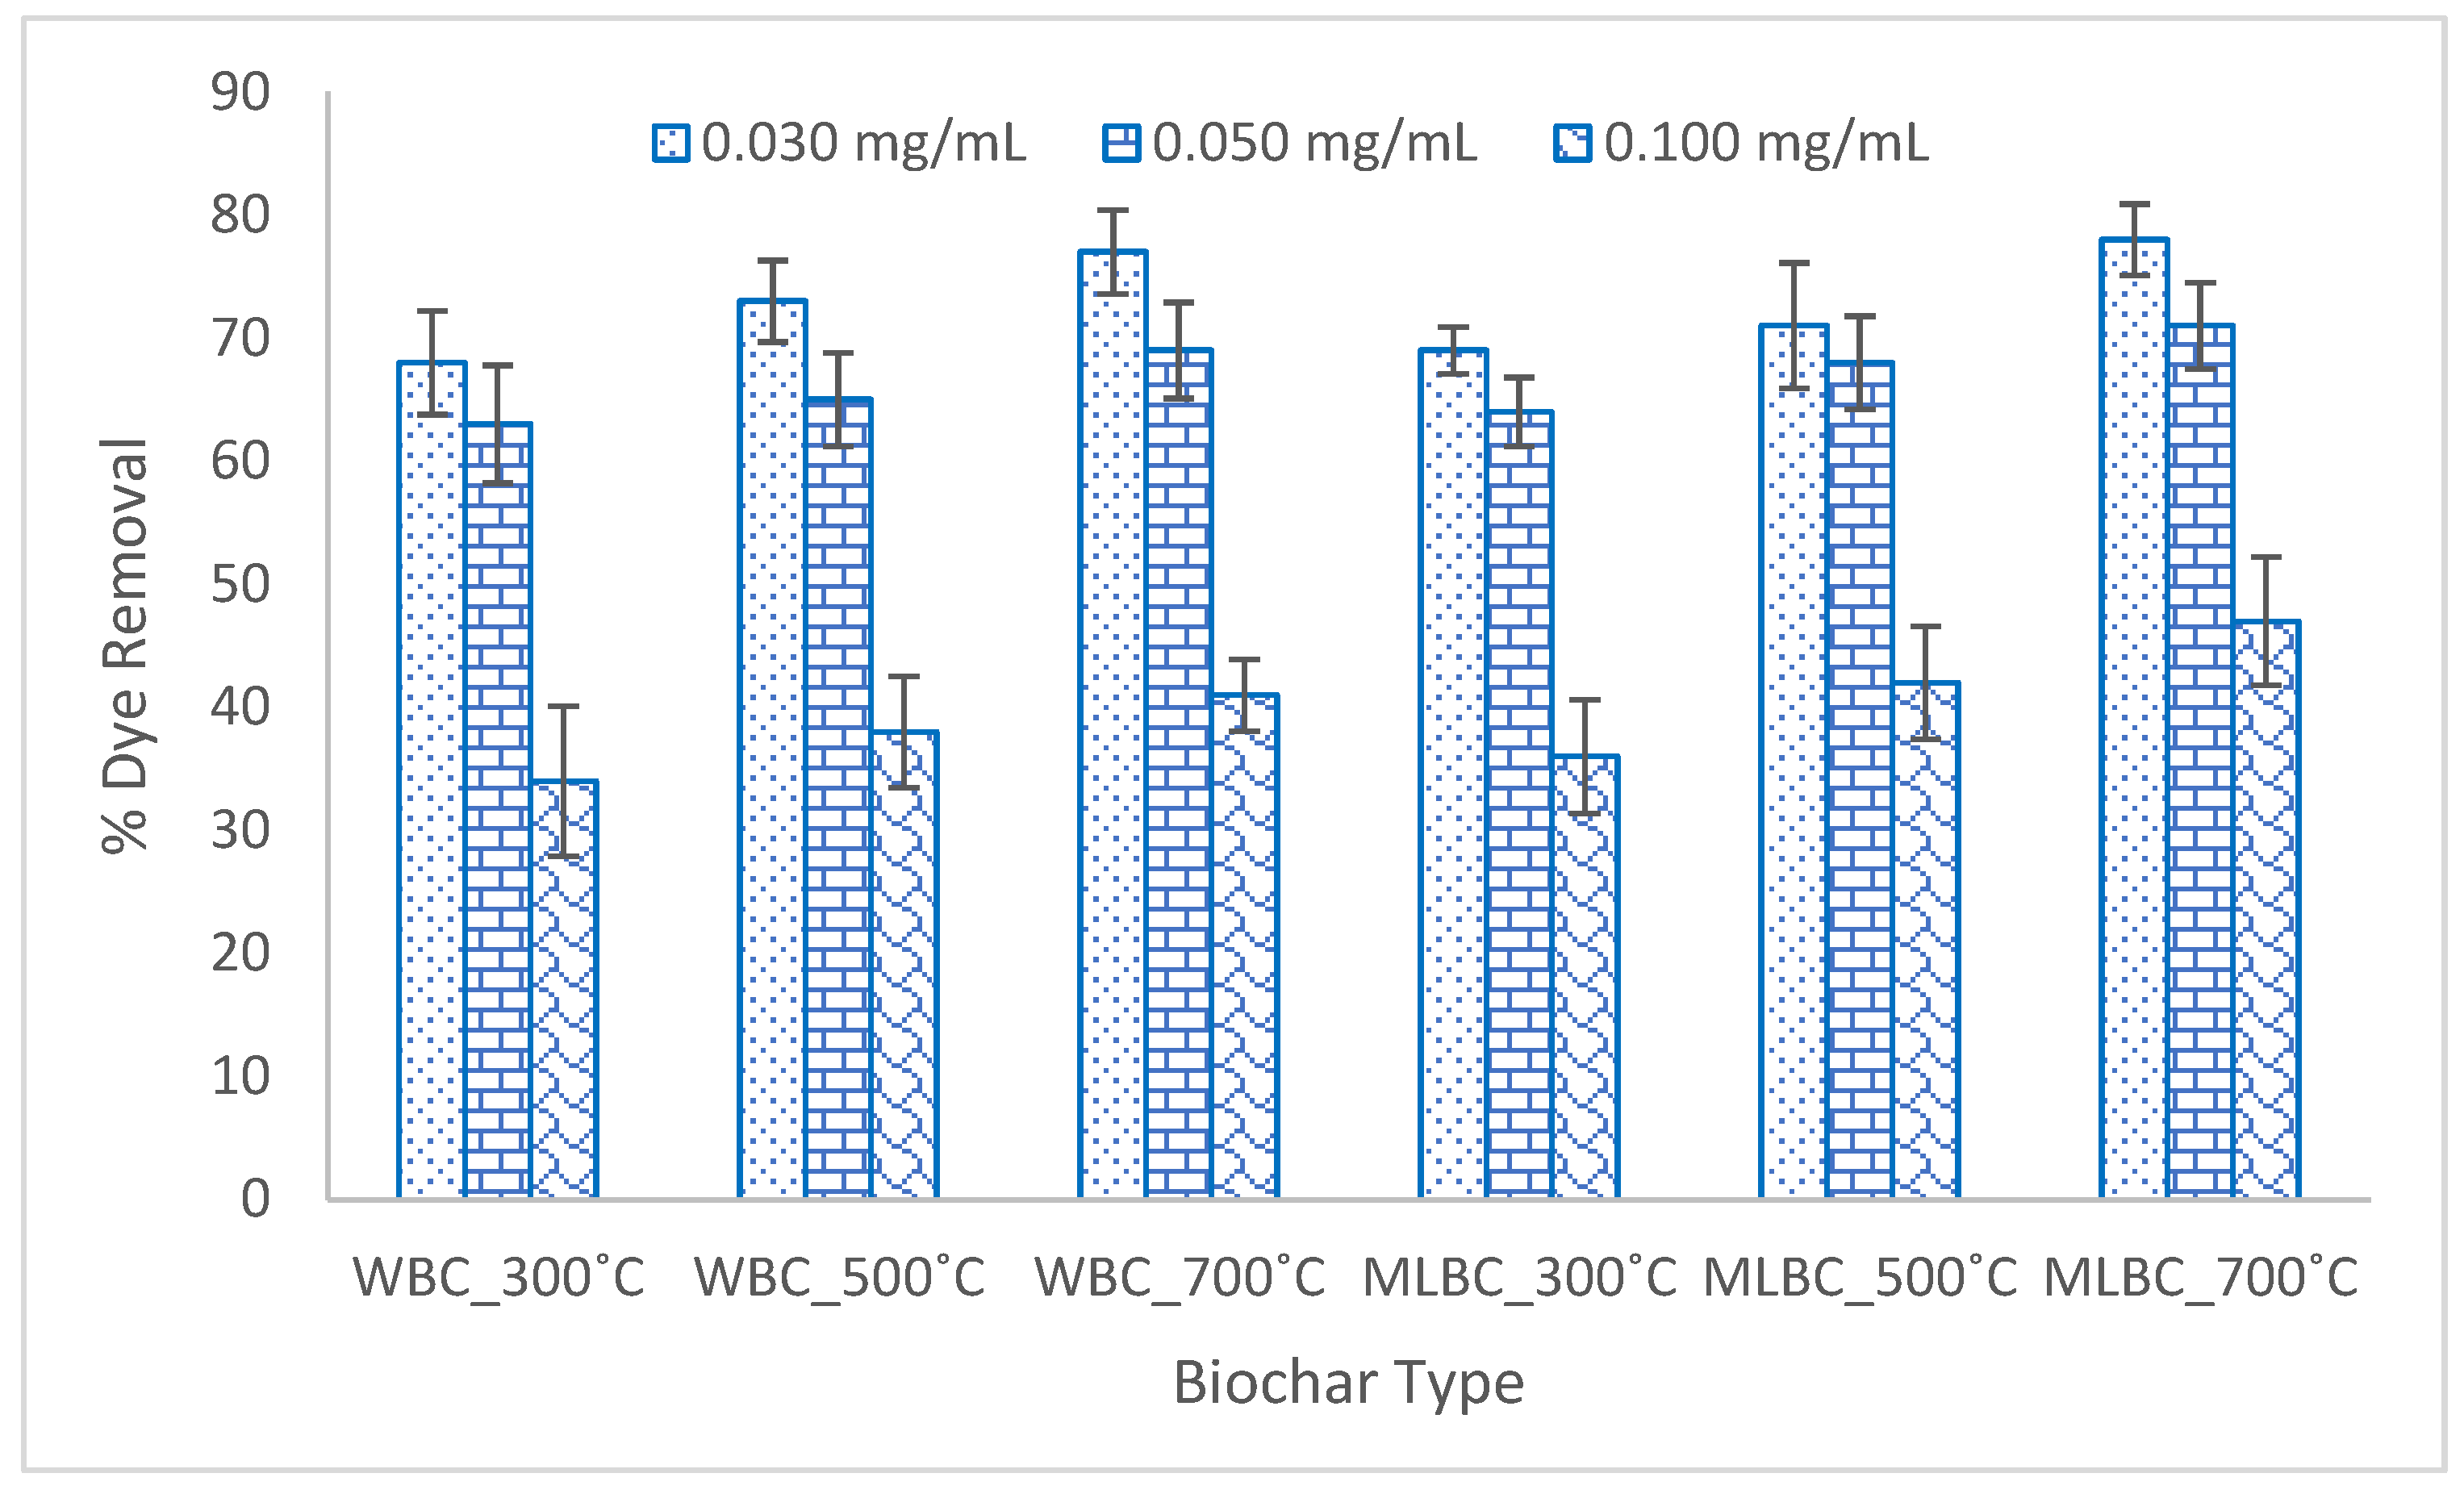
3.4. Dye Adsorption Potentiality of the Biochar

3.4.1. Effect of pH

The pH of a solution has been found to have a direct influence on the binding sites of the adsorbent and the ionization of the dye molecules. Specifically, the ionic state of the dye molecules at different pH facilitates and or renders the binding sites of the adsorbent to adsorb the dye. The present study shows an inverse correlation between the dye uptake and the pH increase. Irrespective of the treatments among the studied pH range (2, 4, 6, 8, 10, and 12), the highest amount of FITC dye removal from 51% to 66% was observed at pH 2, and the lowest amount of dye removal 38% to 55% was observed at pH 12, as shown in Figure 3. The lower pH of the dye solution possibly aided the presence of a higher amount of H+ ions, and eventually, those were adsorbed by the adsorbent surface. Since FITC dye used in the present study was anionic, at lower pH, a higher amount of dye adsorption was likely due to the electrostatic attraction between the adsorbent surface and the dye molecule. Contrariwise, a higher pH was likely to limit the presence of H+ ions, and consequently, electrostatic repulsion between the dye molecule and the adsorbent surface might have limited the adsorption at a higher pH.
However, implementing a pH of 2 on a large scale will be difficult, so it is recommended to maintain a pH of 6–8 for large-scale experiments, where the average dye removal amount was from 43% to 58.5%.

3.4.2. Effect of Time

Contact time between the adsorbent and the adsorbate was found to be critical for the adsorption process. The effect of contact time on the % dye removal, as shown in Figure 4, proves the effectiveness of the used BC at different time points. The effects of BC contact time on the % FITC dye removal revealed a 43–63% dye removal within the first 60 min. Within the first 60 min period, MLBC pyrolyzed at 700 °C was able to remove the highest 63% dye, and the WBC pyrolyzed at 300 °C reduced the lowest 43% dye. With an increase in contact time from 60 to 120 min, the % dye removal was also increased by 3 to 11% among the BC treatments. However, the % dye removal was not significant after a contact time of 90 min and was increased only by 0 to 2% among the treatments. A contact time increase from 60 to 90 min showed an increase in % dye removal by 3 to 9%. The study thus showed that the BC pores become almost saturated and or nearly attain the equilibrium within the first 90 min of contact time.

3.4.3. Effect of Adsorption Dose

Figure 5 represents the changed pattern of the % FITC dye removal with the change in the adsorbent dose, when pH, time, and initial dye concentration were kept constant at 2.0, 90 min, and 0.05 mg/mL, respectively. Among the three (20 mg/mL, 50 mg/mL, and 100 mg/mL) adsorption dosages, irrespective of the biochar type, the 100 mg/mL adsorption dose resulted in the highest amount of dye removal. The adsorption dose of 20 mg/mL was found to reduce the lowest amount of dye. Throughout the adsorption dosages, the highest removal was 73% and the lowest removal was 49% with MLBC pyrolyzed at 700 °C and WBC pyrolyzed at 300 °C, respectively. The present study showed an increasing trend of dye removal with the increment of the adsorbent dose. However, an increase in adsorption dosages from 50 mg/mL to 100 mg/mL did not show any significant increase in the dye removal, while the increase in adsorption dosages from 20 mg/mL to 50 mg/mL exhibited a significant increase in the dye removal potential. Specifically, considering all of the biochar types, an incremental increase in the adsorption dose from 20 mg/mL to 50 mg/mL increased the dye removal potential by 5–14%. Contrariwise, the increase in adsorbent dose from 50 mg/mL to 100 mg/mL increased the dye removal potential only by 2–3% throughout the treatments. In general, with the higher adsorption dosage, the amount of dye adsorbed per unit of the adsorbent was found to be reduced. Possibly, the presence of a higher amount of adsorbent in a confined place significantly reduced the BC pores and thus reduced the adsorbent amount. Contrariwise, the presence of lower adsorbent amounts facilitated the availability of the adsorbent sites of BC and allowed the highest amount of adsorption. A couple of other similar studies also reported similar observations with the increment of adsorbent dose [3,9,14].

3.4.4. Effect of Initial Dye Concentration

Mass transfer is always governed by the adsorbate to adsorbent ratio. Therefore, the initial dye concentration was a critical parameter to study the effect of BC adsorption potential. Figure 6 shows the % dye removal trend with three different initial dye concentrations, such as 0.03 mg/mL, 0.05 mg/mL, and 0.1 mg/mL. Irrespective of the BC types, the initial dye concentration of 0.03 mg/mL revealed the highest amount of % dye removal, followed by 0.05 mg/mL and 0.1 mg/mL, respectively. Among the dye concentrations, 0.03 mg/mL FITC dye might have provided enough absorbent sites to adsorb/uptake the dye. The increase in dye concentrations potentially decreased the ratio between the active sites/pores of the adsorbent to the dye molecule and possibly saturated the active sites/pore spaces of the adsorbent. Therefore, any further addition of the dye to make 0.1 mg/mL reduced the % dye removal potential significantly.

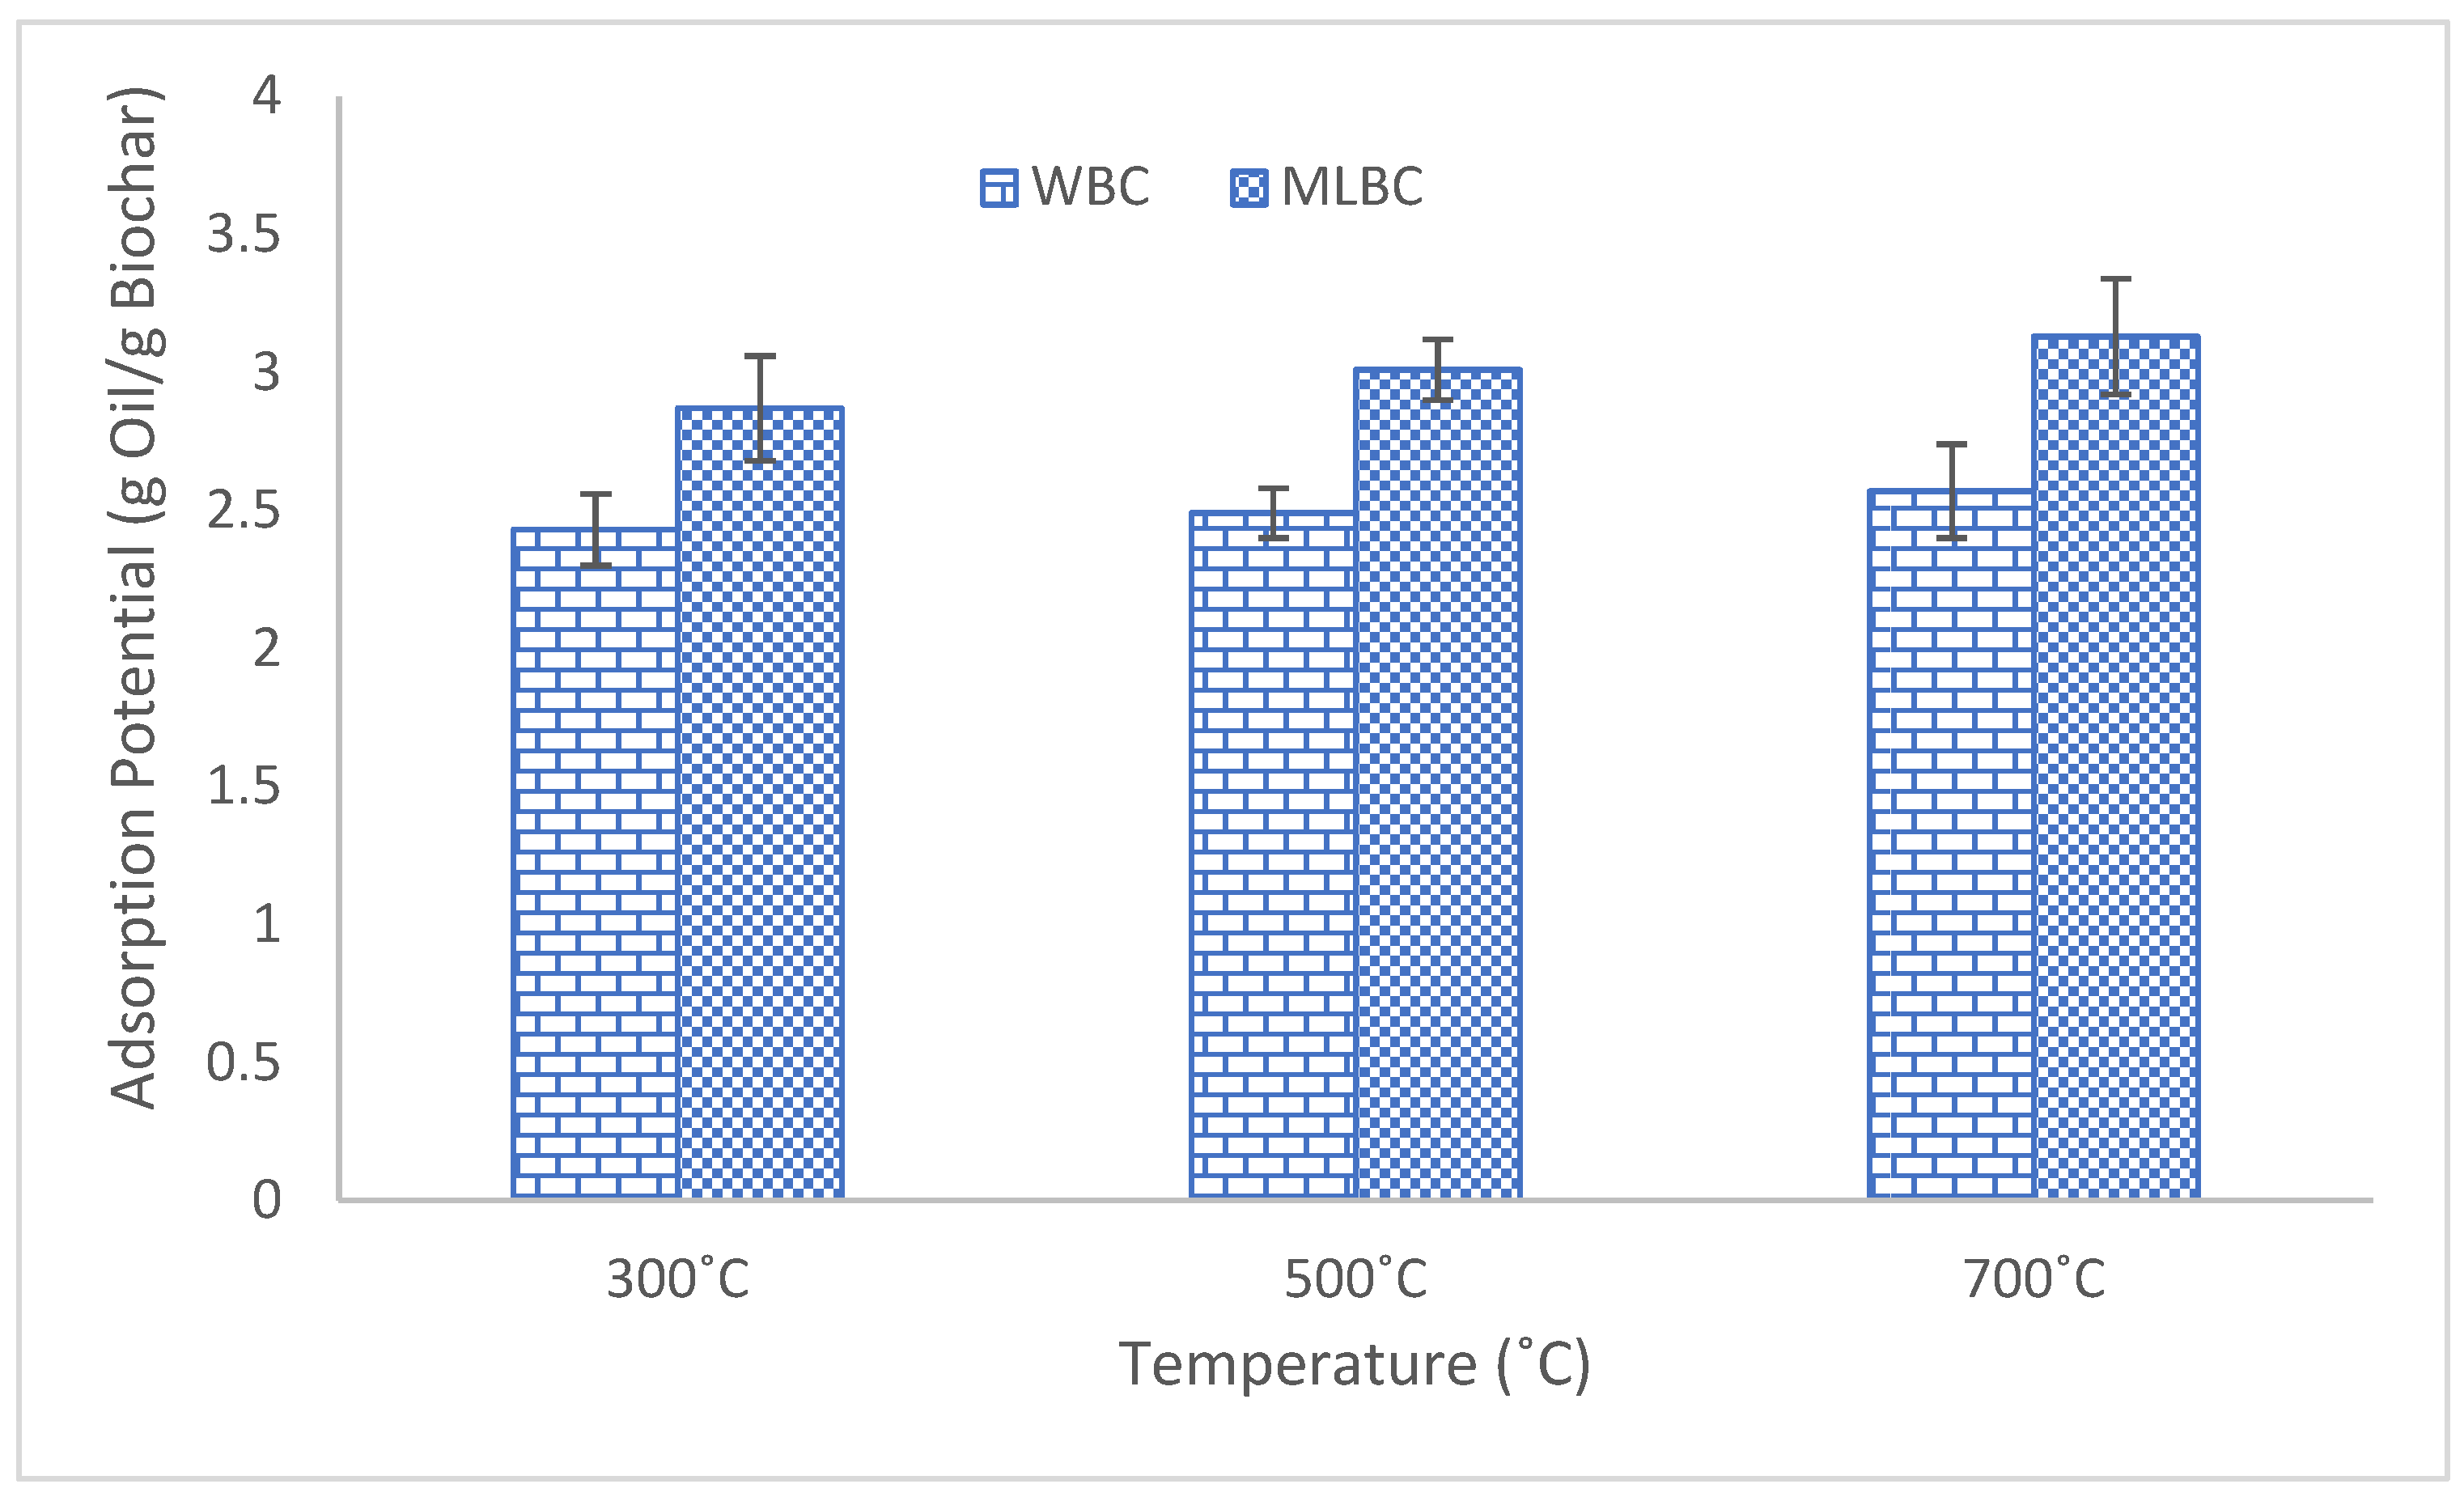
3.5. Oil Adsorption Potential

Figure 7 shows the oil adsorption potential of WBC and MLBC pyrolyzed at three different temperatures. For all the pyrolysis temperatures and the biochar types, oil adsorption was found to be almost instantaneous. Among the tested biochar types, MLBC generally showed higher oil adsorption potential compared to that of WBC. With an increase in biochar pyrolysis temperature from 300 °C to 700 °C, the adsorption potential of the MLBC increased from 2.87 g/g to 3.13 g/g. Contrariwise, with the same amount of temperature change, the adsorption potential for WBC was found to change from 2.43 g/g to 2.57 g/g. The oil adsorption potential for the biochar types was higher at higher pyrolysis temperatures and vice versa. Pyrolysis at a lower temperature might have remnant trace volatile matter in the produced biochar, and hence lowered the adsorption sites. For the same amount of biochar tested among MLBC and WBC, the higher adsorption potential of MLBC might be an indication of the higher adsorption surface area of MLBC compared to that of WBC.

3.6. Dye Adsorption Potentiality of the Biochar Beads

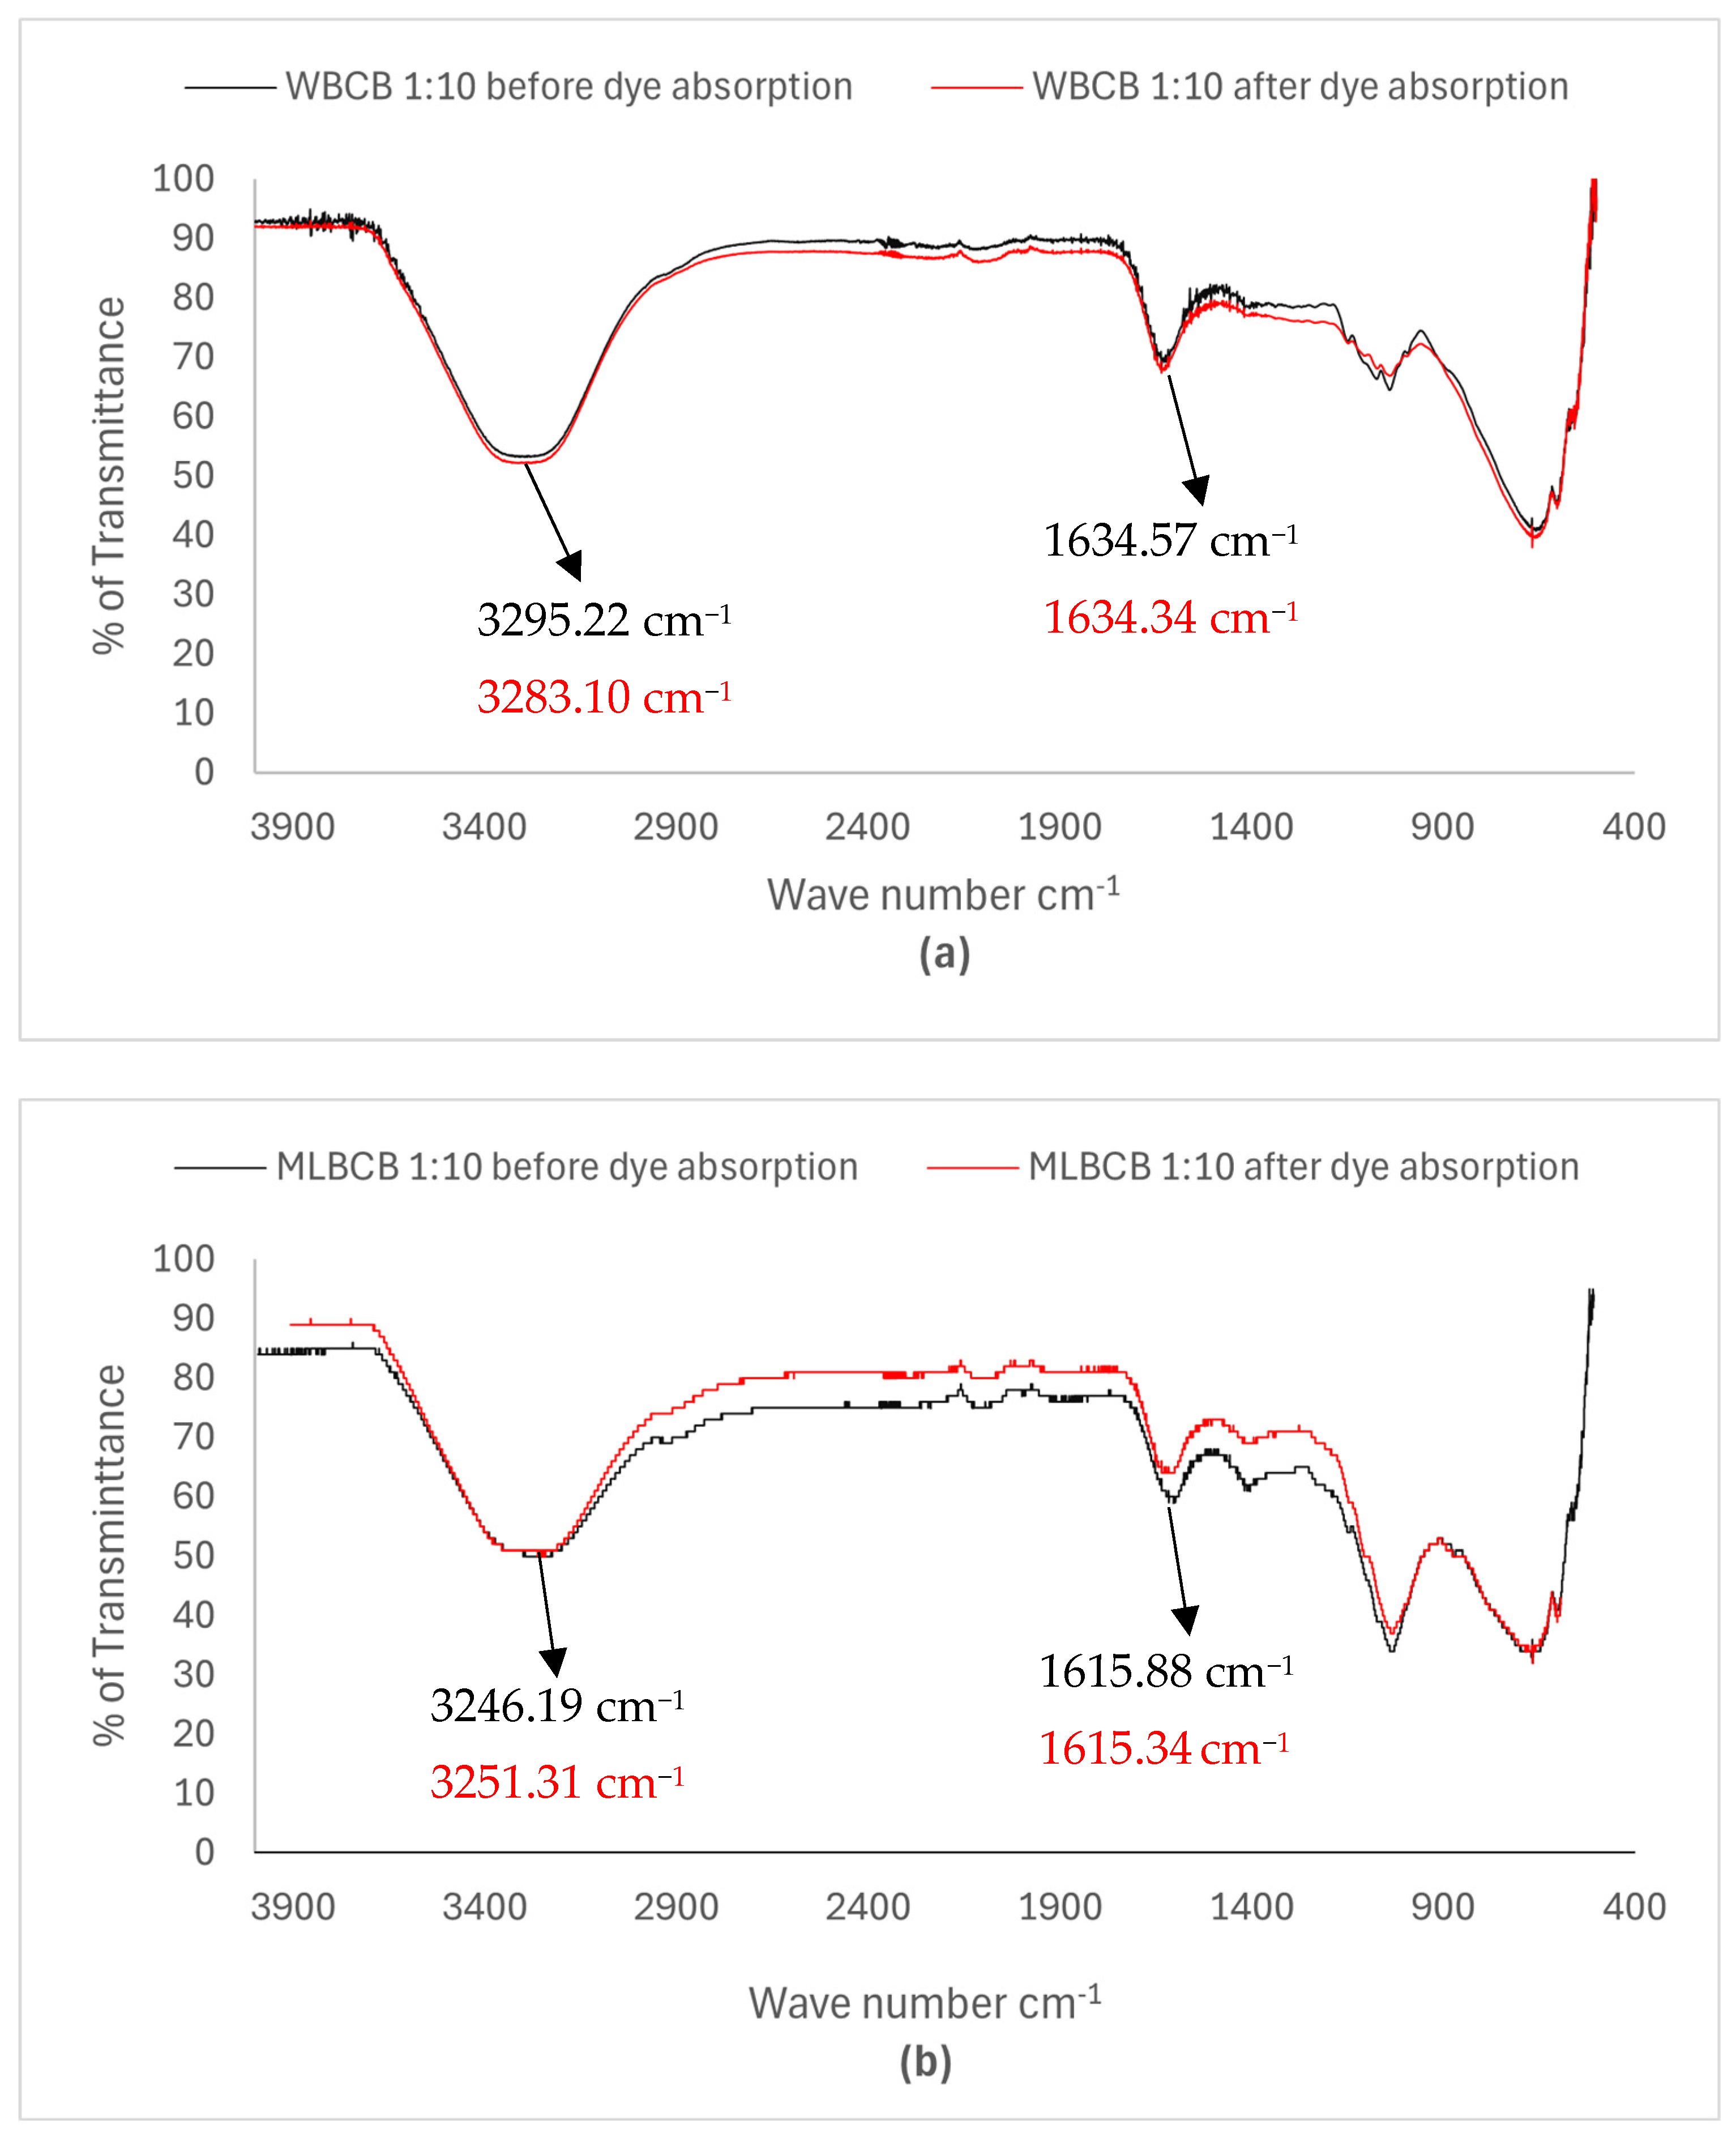
3.6.1. FT-IR Analysis of Biochar Beads

The FT-IR spectra of the beads are displayed in Figure 8. In the spectrum of MLBC beads 1:10, the characteristic peaks appear around 3246.19 cm−1, 1615.88 cm−1, and 1034.55 cm−1. The absorption bands at 3246.19, 1615.88 correspond to the stretching vibration of O-H and asymmetric or symmetric stretching vibration of C=O bonds, respectively. The aforementioned finding indicates the presence of carboxylate ions in the biochar beads. After the absorption of Cu2+ ions, the absorption bands at 3246.19 cm−1 and 1615.88 cm−1 have been shifted to 3251.31 cm−1 and 1615.34 cm−1, respectively. Those absorption bands correspond to the asymmetric stretching vibration of the COO ion. Therefore, these aforementioned changes indicate the interaction between the COO ion and Cu2+ ion [34,35,36]. Every type of bead follows a similar pattern in the spectrum, which indicates the successful absorption of copper ions by each type of bead. In the FT-IR spectra of the WBC beads 1:10, the characteristic peaks appear at 3295.22 cm−1, 1634.57 cm−1, 1038.93 cm−1, and 557.31 cm−1. Those absorption bands shifted to 3283.10 cm−1, 1634.34 cm−1, and 1038 cm−1, respectively, which indicated the copper ion absorption by the beads as discussed above.

3.6.2. UV-VIS Spectroscopy Analysis of WBC and MLBC Beads

A series of three diluted solutions was prepared from the standard solution (500 mg/L). The concentrations of the solutions are 250 mg/L, 125 mg/L, and 62.5 mg/L. All the standard solutions and experimental solutions were run on the UV-VIS spectrometer and collected their absorbance at the wavelength of 650 nm. A calibration curve was plotted by plugging concentration data into the X-axis and absorbance data into the Y-axis. The standard curve of the solution is calculated, y = 2 × 10⁻⁵x + 0.0011, where the intercept, slope, and correlation value are 2 × 10⁻⁵, 0.001, and 0.9949, respectively. By plugging the absorbance value into the above equation, the concentration of the treated solution was determined. Absorbances and corresponding concentration data are shown in Table 2. The table shows the minimum absorbance, hence the maximum absorption. WBC and MLBC beads are better absorbent than phytagel beads. Between wheat bran biochar beads and maple leaf biochar beads, wheat bran biochar beads are more efficient. Among wheat bran biochar beads, WBC 1:10 was the most efficient absorbent.

4. Discussion

An agricultural byproduct like wheat bran is a good source of biochar production due to its low cost and availability. In North Dakota (USA) only, 3 million bushels of wheat bran are produced annually, which causes environmental pollution. The process of biochar production from wheat bran and maple leaves offers a sustainable and versatile solution to some of the most pressing challenges in agriculture and environmental management. Furthermore, biochar has a potential use in energy recovery, water retention, contaminant removal, waste reduction and management, carbon sequestration, soil improvement, etc. In this research, we used biochar with polymer beads (encapsulated), which can become a potential means of wastewater treatment and catch the attention of industries and researchers.

5. Conclusions

In this study, we worked on the utilization of biochar produced from two abundant waste products, maple leaves and wheat bran. Among the two tested biochar types, with the exception of bulk density and the dye absorption potential, all of the physicochemical property values were higher for MLBC compared to WBC. The adsorption study revealed that, irrespective of the biochar types, optimum adsorption was found at pH 2.0, with a 0.05 mg/mL dye concentration, 50 mg/mL of biochar application, and a residence time of 90 min. Biochar pyrolyzed at 700 °C was found to perform best among the pyrolysis temperatures. Between the biochar types, MLBC performed better than WBC. Furthermore, the oil adsorption potential of MLBC was found to be higher compared with WBC. In terms of dye absorption potential, WBC beads have proved more efficient than MLBC beads.

Author Contributions

The experiment was performed by N.C.S., M.A.R.B., G.H. and B.H. N.C.S. and M.A.R.B. prepared the manuscript under the supervision of K.H., M.K. and K.H. were involved in concept creation. All authors have read and agreed to the published version of the manuscript.

Funding

This research received no external funding.

Data Availability Statement

The original contributions presented in this study are included in the article. Further inquiries can be directed to the corresponding author.

Acknowledgments

This research was conducted at Mayville State University, Mayville, ND, with partial support from the NSF ND EPSCoR ND-ACES program (OIA #1946202).

Conflicts of Interest

The authors declare no conflicts of interest.

Abbreviations

The following abbreviations are used in this manuscript:
BCBulk capacity
BDBulk density
CaAbsorption capacity
ECElectrical conductivity
FITCFluorescein isothiocyanate
IRInfrared
FT-IRFourier transform infrared
MLMaple leaf
MLBCMaple leaf biochar
MLBCBMaple leaf biochar bead
NDNorth Dakota
rpmRotation per minute
SEMScanning electron microscopy
TCTotal carbon content
UV-VISUltraviolet–visible
WCMWeight of the conjugated mass
WBCWeight of the biochar
WBWheat bran
WBCWheat bran biochar
WBCBWhere bran biochar bead
WHCWater holding capacity

References

  1. Lehmann, J.; Joseph, S. Biochar for Environmental Management; Routledge: London, UK, 2012. [Google Scholar]
  2. Zhao, X.; Wang, J.; Wang, S.; Xing, G. Successive Straw Biochar Application as a Strategy to Sequester Carbon and Improve Fertility: A Pot Experiment with Two Rice/Wheat Rotations in Paddy Soil. Plant Soil 2014, 378, 279–294. [Google Scholar] [CrossRef]
  3. Trakal, L.; Bingöl, D.; Pohořelý, M.; Hruška, M.; Komárek, M. Geochemical and Spectroscopic Investigations of Cd and Pb Sorption Mechanisms on Contrasting Biochars: Engineering Implications. Bioresour. Technol. 2014, 171, 442–451. [Google Scholar] [CrossRef]
  4. Lu, K.; Yang, X.; Shen, J.; Robinson, B.; Huang, H.; Liu, D.; Bolan, N.; Pei, J.; Wang, H. Effect of Bamboo and Rice Straw Biochars on the Bioavailability of Cd, Cu, Pb and Zn to Sedum Plumbizincicola. Agric. Ecosyst. Environ. 2014, 191, 124–132. [Google Scholar] [CrossRef]
  5. Kim, H.-S.; Kim, K.-R.; Kim, H.-J.; Yoon, J.-H.; Yang, J.E.; Ok, Y.S.; Owens, G.; Kim, K.-H. Effect of Biochar on Heavy Metal Immobilization and Uptake by Lettuce (Lactuca sativa L.) in Agricultural Soil. Environ. Earth Sci. 2015, 74, 1249–1259. [Google Scholar] [CrossRef]
  6. Puga, A.P.; Abreu, C.A.; Melo, L.C.A.; Beesley, L. Biochar Application to a Contaminated Soil Reduces the Availability and Plant Uptake of Zinc, Lead and Cadmium. J. Environ. Manag. 2015, 159, 86–93. [Google Scholar] [CrossRef] [PubMed]
  7. Cao, Y.; Yang, B.; Song, Z.; Wang, H.; He, F.; Han, X. Wheat Straw Biochar Amendments on the Removal of Polycyclic Aromatic Hydrocarbons (PAHs) in Contaminated Soil. Ecotoxicol. Environ. Saf. 2016, 130, 248–255. [Google Scholar] [CrossRef] [PubMed]
  8. Zheng, Y.; Wang, B.; Wester, A.E.; Chen, J.; He, F.; Chen, H.; Gao, B. Reclaiming Phosphorus from Secondary Treated Municipal Wastewater with Engineered Biochar. Chem. Eng. J. 2019, 362, 460–468. [Google Scholar] [CrossRef]
  9. Chaukura, N.; Murimba, E.C.; Gwenzi, W. Sorptive Removal of Methylene Blue from Simulated Wastewater Using Biochars Derived from Pulp and Paper Sludge. Environ. Technol. Innov. 2017, 8, 132–140. [Google Scholar] [CrossRef]
  10. Nautiyal, P.; Subramanian, K.A.; Dastidar, M.G. Adsorptive Removal of Dye Using Biochar Derived from Residual Algae after In-Situ Transesterification: Alternate Use of Waste of Biodiesel Industry. J. Environ. Manag. 2016, 182, 187–197. [Google Scholar] [CrossRef]
  11. Karami, N.; Clemente, R.; Moreno-Jiménez, E.; Lepp, N.W.; Beesley, L. Efficiency of Green Waste Compost and Biochar Soil Amendments for Reducing Lead and Copper Mobility and Uptake to Ryegrass. J. Hazard. Mater. 2011, 191, 41–48. [Google Scholar] [CrossRef]
  12. Kasozi, G.N.; Zimmerman, A.R.; Nkedi-Kizza, P.; Gao, B. Catechol and Humic Acid Sorption onto a Range of Laboratory-Produced Black Carbons (Biochars). Environ. Sci. Technol. 2010, 44, 6189–6195. [Google Scholar] [CrossRef] [PubMed]
  13. Melo, L.C.A.; Puga, A.P.; Coscione, A.R.; Beesley, L.; Abreu, C.A.; Camargo, O.A. Sorption and Desorption of Cadmium and Zinc in Two Tropical Soils Amended with Sugarcane-Straw-Derived Biochar. J. Soils Sediments 2015, 16, 226–234. [Google Scholar] [CrossRef]
  14. Zheng, R.; Chen, Z.; Cai, C.; Wang, X.; Huang, Y.; Xiao, B.; Sun, G. Effect of biochars from rice husk, bran, and straw on heavy metal uptake by pot-grown wheat seedling in a historically contaminated soil. BioResources 2013, 8, 5965–5982. [Google Scholar] [CrossRef]
  15. Jamieson, T.; Sager, E.; Guéguen, C. Characterization of Biochar-Derived Dissolved Organic Matter Using UV–Visible Absorption and Excitation–Emission Fluorescence Spectroscopies. Chemosphere 2014, 103, 197–204. [Google Scholar] [CrossRef]
  16. Awika, J.M.; Piironen, V.; Bean, S.; American Chemical Society; Division of Agricultural and Food Chemistry. Advances in Cereal Science: Implications to Food Processing and Health Promotion; American Chemical Society: Washington, DC, USA, 2011. [Google Scholar]
  17. Hensel, G.; Kastner, C.; Oleszczuk, S.; Riechen, J.; Kumlehn, J. Agrobacterium-Mediated Gene Transfer to Cereal Crop Plants: Current Protocols for Barley, Wheat, Triticale, and Maize. Int. J. Plant Genom. 2009, 2009, 835608. [Google Scholar] [CrossRef]
  18. Hemery, Y.; Rouau, X.; Lullien-Pellerin, V.; Barron, C.; Abecassis, J. Dry Processes to Develop Wheat Fractions and Products with Enhanced Nutritional Quality. J. Cereal Sci. 2007, 46, 327–347. [Google Scholar] [CrossRef]
  19. Apprich, S.; Tirpanalan, Ö.; Hell, J.; Reisinger, M.; Böhmdorfer, S.; Siebenhandl-Ehn, S.; Novalin, S.; Kneifel, W. Wheat Bran-Based Biorefinery 2: Valorization of Products. LWT-Food Sci. Technol. 2014, 56, 222–231. [Google Scholar] [CrossRef]
  20. Curti, E.; Carini, E.; Bonacini, G.; Tribuzio, G.; Vittadini, E. Effect of the Addition of Bran Fractions on Bread Properties. J. Cereal Sci. 2013, 57, 325–332. [Google Scholar] [CrossRef]
  21. Reisinger, M.; Tirpanalan, Ö.; Prückler, M.; Huber, F.; Kneifel, W.; Novalin, S. Wheat Bran Biorefinery—A Detailed Investigation on Hydrothermal and Enzymatic Treatment. Bioresour. Technol. 2013, 144, 179–185. [Google Scholar] [CrossRef]
  22. Kim, J.E.; Bhatia, S.K.; Song, H.J.; Yoo, E.; Jeon, H.J.; Yoon, J.Y.; Yang, Y.; Gurav, R.; Yang, Y.H.; Kim, H.J.; et al. Adsorptive removal of tetracycline from aqueous solution by maple leaf-derived biochar. Bioresour. Technol. 2020, 306, 1230–1292. [Google Scholar] [CrossRef]
  23. Roy, D.; Neogi, S.; De, S. Adsorptive Removal of Heavy Metals from Battery Industry Effluent Using MOF Incorporated Polymeric Beads: A Combined Experimental and Modeling Approach. J. Hazard. Mater. 2021, 403, 123624. [Google Scholar] [CrossRef]
  24. Kesenci, K.; Say, R.; Denizli, A. Removal of Heavy Metal Ions from Water by Using Poly(Ethyleneglycol Dimethacrylate-Co-Acrylamide) Beads. Eur. Polym. J. 2002, 38, 1443–1448. [Google Scholar] [CrossRef]
  25. Barakat, M.A. New Trends in Removing Heavy Metals from Industrial Wastewater. Arab. J. Chem. 2011, 4, 361–377. [Google Scholar] [CrossRef]
  26. Ahmedna, M.; Clarke, S.J.; Rao, R.M.; Marshall, W.E.; Johns, M.M. Use of Filtration and Buffers in Raw Sugar Colour Measurements. J. Sci. Food Agric. 1997, 75, 109–116. [Google Scholar] [CrossRef]
  27. Borhan, M.S.; Rahman, S.; Sarker, N.C. Characterizing Corn and Cattle Manure Derived Biochars Relevant to Their Use as Soil Additives. Trans. ASABE 2018, 61, 1335–1349. [Google Scholar] [CrossRef]
  28. Stella Mary, G.; Sugumaran, P.; Niveditha, S.; Ramalakshmi, B.; Ravichandran, P.; Seshadri, S. Production, Characterization and Evaluation of Biochar from Pod (Pisum sativum), Leaf (Brassica oleracea) and Peel (Citrus sinensis) Wastes. Int. J. Recycl. Org. Waste Agric. 2016, 5, 43–53. [Google Scholar] [CrossRef]
  29. Karhu, K.; Mattila, T.; Bergström, I.; Regina, K. Biochar Addition to Agricultural Soil Increased CH4 Uptake and Water Holding Capacity—Results from a Short-Term Pilot Field Study. Agric. Ecosyst. Environ. 2011, 140, 309–313. [Google Scholar] [CrossRef]
  30. Gai, X.; Wang, H.; Liu, J.; Zhai, L.; Liu, S.; Ren, T.; Liu, H. Effects of Feedstock and Pyrolysis Temperature on Biochar Adsorption of Ammonium and Nitrate. PLoS ONE 2014, 9, e113888. [Google Scholar] [CrossRef] [PubMed]
  31. Gaskin, J.W.; Steiner, C.; Harris, K.; Das, K.C.; Bibens, B. Effect of Low-Temperature Pyrolysis Conditions on Biochar for Agricultural Use. Trans. ASABE 2008, 51, 2061–2069. [Google Scholar] [CrossRef]
  32. Spokas, K.A.; Novak, J.M.; Stewart, C.E.; Cantrell, K.B.; Uchimiya, M.; DuSaire, M.G.; Ro, K.S. Qualitative Analysis of Volatile Organic Compounds on Biochar. Chemosphere 2011, 85, 869–882. [Google Scholar] [CrossRef]
  33. Lopez-Capel, E.; Sohi, S.P.; Gaunt, J.L.; Manning, D.A.C. Use of Thermogravimetry-Differential Scanning Calorimetry to Characterize Modelable Soil Organic Matter Fractions. Soil Sci. Soc. Am. J. 2005, 69, 930. [Google Scholar] [CrossRef]
  34. Garg, U.; Kaur, M.P.; Jawa, G.K.; Sud, D.; Garg, V.K. Removal of Cadmium (II) from Aqueous Solutions by Adsorption on Agricultural Waste Biomass. J. Hazard. Mater. 2008, 154, 1149–1157. [Google Scholar] [CrossRef] [PubMed]
  35. Li, N.; Bai, R. Highly Enhanced Adsorption of Lead Ions on Chitosan Granules Functionalized with Poly(Acrylic Acid). Ind. Eng. Chem. Res. 2006, 45, 7897–7904. [Google Scholar] [CrossRef]
  36. Pourjavadi, A.; Harzandi, A.M.; Hosseinzadeh, H. Modified Carrageenan 3. Synthesis of a Novel Polysaccharide-Based Superabsorbent Hydrogel via Graft Copolymerization of Acrylic Acid onto Kappa-Carrageenan in Air. Eur. Polym. J. 2004, 40, 1363–1370. [Google Scholar] [CrossRef]
Figure 1. FT-IR spectra of MLBC and WBC at (a) 300 °C; (b) 500 °C; and (c) 700 °C.
Processes 13 01358 g001
Figure 2. SEM micrograph of the wheat bran biochar at (a) 300 °C, (b) 500 °C, and (c) 700 °C and maple leaf biochar at (d) 300 °C, (e) 500 °C, and (f) 700 °C.
Processes 13 01358 g002
Figure 3. Effect of pH on the % dye removal by the wheat bran and maple leaf biochar.
Processes 13 01358 g003
Figure 4. Effect of residence time on the % dye removal by the wheat bran and maple leaf biochar.
Processes 13 01358 g004
Figure 5. Effect of biochar amounts on the % dye removal by the wheat bran and maple leaf biochar.
Processes 13 01358 g005
Figure 6. Effect of initial dye concentrations on the % dye removal by the wheat bran and maple leaf biochar.
Processes 13 01358 g006
Figure 7. Oil adsorption potential of the wheat bran and maple leaf biochar.
Processes 13 01358 g007
Figure 8. FT-IR spectrum of (a) WBCB 1:10 before and after dye absorption; (b) MLBCB 1:10 before and after dye absorption.
Processes 13 01358 g008
Table 1. Physicochemical characteristics of the biochars derived from wheat bran and maple leaf.
ParameterPyrolyzing TemperatureBiochar Type
Wheat Bran BiocharMaple Leaf Biochar
Yield (%)300 °C27.1% ± 2.17%29.3% ± 3.63%
500 °C23.4% ± 1.78%24.5% ± 2.97%
700 °C19.7% ± 2.41%22.8% ± 4.29%
pH300 °C8.32 ± 0.058.79 ± 0.09
500 °C8.29 ± 0.038.91 ± 0.06
700 °C8.27 ± 0.028.78 ± 0.04
Electric conductivity (EC, µS cm−1)300 °C428 ± 8.00613 ± 12.3
500 °C437 ± 11.0647 ± 23.5
700 °C417 ± 6.00629 ± 14.8
Bulk density (BD, g mL−1)300 °C0.47 ± 0.080.29 ± 0.03
500 °C0.43 ± 0.050.27 ± 0.07
700 °C0.46 ± 0.030.32 ± 0.04
Water holding capacity (WHC, %)300 °C72 ± 4.6282 ± 4.32
500 °C76 ± 3.1283 ± 7.12
700 °C73 ± 5.3486 ± 2.58
Total carbon (TC, %)300 °C52 ± 3.2163 ± 4.93
500 °C54 ± 4.5466 ± 5.67
700 °C55 ± 6.1261 ± 7.77
Table 2. UV-VIS spectroscopy study of beads. (WBC = wheat bran biochar; MLBC = maple leaf biochar).
TitleAbsorbance at 650 nmConcentration of Dye Solution After Absorbance (mg/L)Dye Absorbed by the Beads (mg)
Stock solution0.0065500-
Diluted solution-10.0024250-
Diluted solution-20.0018125-
Diluted solution-30.001362.5-
Phytagel–WBC = 1:10.003929010.5
Phytagel–WBC = 1:20.003625012.5
Phytagel–WBC = 1:50.003019015.5
Phytagel–WBC = 1:100.002110020.0
Phytogel Beads0.00584701.50
Phytagel–MLBC = 1:10.00615000.00
Phytagel–MLBC = 1:20.00483706.50
Phytagel–MLBC = 1:50.00463507.50
Phytagel–MLBC = 1:100.001423013.5
Dye absorbance for beads: 1.0 g of beads in 50 mL dye solution (500 mg/L).
Disclaimer/Publisher’s Note: The statements, opinions and data contained in all publications are solely those of the individual author(s) and contributor(s) and not of MDPI and/or the editor(s). MDPI and/or the editor(s) disclaim responsibility for any injury to people or property resulting from any ideas, methods, instructions or products referred to in the content.

