Abstract
This paper presents a comprehensive optimization framework for modern distribution systems, integrating distribution system reconfiguration (DSR), soft open point (SOP) operation, photovoltaic (PV) allocation, and energy storage system (ESS) management to minimize daily active power losses. The proposed approach employs a novel hybrid metaheuristic algorithm, the Cheetah-Grey Wolf Optimizer (CGWO), which synergizes the global exploration capabilities of the Cheetah Optimizer (CO) with the local exploitation strengths of Grey Wolf Optimization (GWO). The optimization model addresses time-varying loads, renewable generation profiles, and dynamic network topology while rigorously enforcing operational constraints, including radiality, voltage limits, ESS state-of-charge dynamics, and SOP capacity. Simulations on a 33-bus distribution system demonstrate the effectiveness of the framework across eight case studies, with the full DER integration case (DSR + PV + ESS + SOP) achieving a 67.2% reduction in energy losses compared to the base configuration. By combining the global exploration of CO with the local exploitation of GWO, the hybrid CGWO algorithm outperforms traditional techniques (such as PSO and GWO) and avoids premature convergence while preserving computational efficiency—two major drawbacks of standalone metaheuristics. Comparative analysis highlights CGWO’s superiority over standalone algorithms, yielding the lowest energy losses (997.41 kWh), balanced ESS utilization, and stable voltage profiles. The results underscore the transformative potential of coordinated DER optimization in enhancing grid efficiency and reliability.
1. Introduction
The traditional distribution systems are dramatically evolving as the distributed energy resources such as photovoltaic systems (PVs), energy storage systems (ESS), and soft open points (SOPs) are constantly connected to the medium voltage level. These technologies have significant potential to improve the efficiency, reliability, and sustainability of the grid. However, their integration brings intricate challenges to the table, including dynamic load variations, intermittent generation from renewables, and operational constraints like voltage limits, radiality, and dynamics of ESS state of charge. Efficient optimization frameworks are thus needed to manage the operation of DERs and reduce real power losses in distribution networks.
Development of optimization models for integrated multiple DERs, DSR, SOP operation, PV allocation, and ESS management has received attention in recent studies. For example, ref. [1] applied a Lévy Flight-based Improved Equilibrium Optimizer (LF-IEO) for simultaneous network reconfiguration and SOP placement to attain a 14.89% drop in the power losses. Ref. [2] proposed a multi-objective probabilistic planning framework for multiple distribution systems considering load growth, DER allocation, and optimization by using the MVDE algorithm. Overcoming growing load and distributed energy resources (DERs) must be the priority, as this will enhance overall system performance. Hybrid metaheuristic algorithms have gained attention for their ability to balance global exploration and local exploitation in optimization problems. For instance, ref. [3] presented the Blood-Sucking Leech Optimizer in relation to the optimal reconfiguration of distribution networks embedded with PV and wind systems, resulting in a substantial decrease in power losses and greenhouse gas emissions. Similarly, a k-means clustering-based prediction method for SOP in active distribution networks was presented in [4] and showed better voltage stability and reduced transmission losses. Again, these methods show the relevance of applying hybrid algorithms to tackle the challenges of current distribution systems. The demand for adaptive optimization frameworks has increased due to recent developments in photovoltaic technologies, including perovskite solar cells [5]. Although simulation studies show that these technologies are highly efficient, integrating them into distribution networks presents new power flow management challenges. Our framework fills this gap by optimizing PV allocation in conjunction with DSR and SOP operation.
SOPs and ESSs are integrated to enable enhanced grid flexibility and power loss minimization. In this regard, ref. [6] introduced a stochastic optimization framework for SOP-based active distribution networks with high penetration of renewable energy, by minimizing photovoltaic (PV) curtailment and power fluctuation. Also, ref. [7] gave a critical review of optimization methods in the area of power distribution network reconfiguration with time-based metaheuristic balancing many objectives of cost, reliability, and sustainability. However, many challenges still exist in optimally integrating DERs under uncertain scenarios [8]. Hybrid Squirrel-Cat Optimization (SSI-CS) is used to determine the optimal investment cost with integrated renewable DG in distribution system expansion planning, as they used solar energy as renewable energy source in order to minimize conversation cost. The study was noted for the challenges posed by uncertainty in load demand and its effect on the optimization of solar and wind capacity. Also, ref. [9] proposed a wild mice colony algorithm for multi-objective reconfiguration of distribution systems, obtaining a remarkable reduction in power losses and improved reliability. The need for strong optimization frameworks to manage the uncertainties related to both renewable generation and load demand is highlighted by these studies. Our work combines DSR, SOP, PV, and ESS in a unique way into a single optimization framework, rigorously enforcing real-world constraints (radiality, voltage limits) while accommodating dynamic profiles, in contrast to previous studies that concentrated on isolated DER components.
Recent metaheuristic algorithm developments have enabled even further improvement of distribution system optimizations. Ref. [10] proposed an improved Dandelion optimizer-based multi-objective stochastic reconfiguration and wind energy resource allocation framework to obtain the best distribution networks balancing performance. Moreover, ref. [11] applied the Whale Optimization algorithm (WOA) and the Grey Wolf Optimization (GWO) for optimal allocation and sizing of distributed generation in radial distribution networks while incorporating different load models and operational constraints. Such strategies underscore the significance of metaheuristic algorithms in tackling the multi-objective conflicts in distribution system optimization.
The significance of SOPs for improving grid efficiency has been examined in great detail. Ref. [12] described the optimization process for power distribution grids utilizing particle swarm optimization (PSO) and differential evolution (DE) with a special emphasis on transparency and interpretation techniques in the optimization process. Additionally, ref. [13] introduced a deep reinforcement learning-based technique for reactive power optimization in active distribution systems with SOPs that showed improved voltage regulation and communication cost mitigation. Moreover, it demonstrates the promise of advanced optimization methods to improve the operations of the grid. In addition to these studies, ref. [14] analyzed the optimization of the operation and design of a hybrid microgrid by seeking to minimize energy losses, voltage oscillations and power purchase costs through the development of a multi-objective improved Kepler optimization algorithm. While not directly focused on DSR or SOP, the study does highlight the critical role of machine learning prediction tools for forecasting load data as well as renewable energy sources, which is essential for the optimization of microgrid locations and components. Likewise, ref. [15] introduced a probabilistic optimal planning framework for multiple photovoltaics and battery energy storage systems, utilizing a new RLEO (equilibrium optimizer (EO) based on the reinforced learning (RL)) algorithm, obtaining significant energy loss reduction over load profiles. The stochastic nature of renewable energy and its effect on energy losses and voltage fluctuation was highlighted in this study. In addition, ref. [16] presented a hybrid GSA–Tabu multi-objective algorithm for distribution system reconfiguration and optimal DG placement, whereby its effectiveness was also compared with existing algorithms. Improper installation of generators and voltage profile uncertainty were discussed in the research and increase the distribution losses. Ref. [17] studied multi-objective optimization in distribution networks with energy storage and photovoltaics; and performed voltage stability and network loss optimization. The study showed the value of each increase in the reliability of the system by minimizing deviations in voltages and power losses in the network. Ref. [18] investigated a stochastic optimization model for the integration of renewable energy and placed this in a multi-objective optimization framework, applying dragonfly optimization to photovoltaic system place and distribution network reconfiguration. The uncertainty in various aspects of a PV system, such as cost of integration, prices at which electricity is sold, and electricity demand, gave way to the realization that GenCos and DisCos need to be profitable as part of the PV evolution. By using particle swarm optimization, ref. [19] optimized the allocation and sizing of distributed generation in distribution systems, which significantly decreased the power losses and increased system reliability. As a result, it emphasized the difficulty of keeping reliability parameters in a desired range under uncertainties. In [20], hybridization combined with the water cycle algorithm was applied for SOP and system reconfiguration optimization. The results showed that there were substantial power losses, and underlining the effectiveness of the proposed ANRPSO (Adaptive Nearest Region Particle Swarm Optimization) algorithm pointed to the need for an optimization algorithm to strike a balance between exploring the entire search space and exploiting the best-known solutions. The work presented in [21] involve reviewing distributed optimization techniques in electric distribution systems covering problems like volt/var control and loss minimization. These studies highlight how future exploration could address the existing limitations as well as identify new opportunities in distributed optimization.
The literature has also been devoted to SOP optimization in MV distribution systems [22]. There is also a model for the optimization of SO Plans occurrence, where both SOP deployment and network optimization simultaneously contribute to increase hosting capacity and to reduce power losses. Similarly, ref. [23] proposed a multi-objective optimization model for distribution network reconfiguration with consideration of SOPs via the NSGA-II algorithm to reduce line loss and voltage offset. This demonstrated the difficulties associated with high renewable energy penetration, and the need for better reliability and economy in the operation of power systems.
Furthermore, ref. [24] introduced innovative approaches for effective distribution of SOPs in distribution systems, with the objective of active real power loss reduction and voltage profile enhancement. The results proved that smaller SOP capacities are sufficient to minimize the power losses and improve the voltage stability. For example, ref. [25] handled the stochastic allocation of photovoltaic resources in distribution systems using an enhanced meta-heuristic algorithm and highlighted the significance of managing uncertainties in generation from PV and load demands. Stochastic modeling has been found to be crucial in ensuring the robustness of decisions made in an uncertain environment.
Additionally, the work of [26] studied the reconfiguration of distribution networks in regard to PV system allocation, relying on metaheuristic algorithms such as Golden Jackal Optimization and particle swarm optimization. The results in this research show that comparatively, the Golden Jackal Optimization (GJO) technique gives a better result when minimizing power losses than PSO. A hybrid artificial intelligence algorithm combining genetic algorithms and particle swarm optimization for system reconfiguration was proposed by [27] and proven to have a case of zero power loss decreases. The study found limitations in the existing algorithms and emphasized the importance of better techniques to reduce the energy loss.
A recent approach towards optimizing distribution systems is a study on the integration of distributed energy resources (DERs), promoting flexibility of the grid and reducing power losses. As an example, ref. [28] adopts the Artificial Hummingbird Algorithm (AHA) for optimal planning of RE-integrated systems, although, despite uncertainties and voltage stability addressing the operational constraints are not studied, it is desirable that the AHA be implemented to find the best values for control outputs which minimizes total costs and improves the performance of RE BUS. For example, ref. [29] cleans a configuration method of SOP at a NEET (optimal ideal system of work generator) based on second-order cone programming and shows this on a adjusted IEEE-33 node goal system (composed of control objective) but does not discuss metaheuristics. Ref. [30] implemented genetic algorithms for SOP allocation in renewable-integrated systems, emphasizing power loss reduction and voltage adjustment. More specifically, ref. [31] studies the use of metaheuristic techniques, where a 31.14% reduction in power losses and 33.35% reduction in the Energy Not-Supplied index via the Ant Lion Optimizer is reported. Moreover, ref. [32] considers metaheuristic algorithms applied to photovoltaic-integrated systems in order to achieve loss minimization, whereby the results also revealed improvements in the voltage profiles and minimization of power loss. A review of the DER planning process can be found in [33], including optimization frameworks and uncertainty modelling without listing relevant studies. Furthermore, ref. [34] summarizes the metaheuristic techniques used for DSR and proposes a rapid genetic algorithm that provides better accuracy and convergence than existing methods. The work in [35] explores distributed optimization methods by extending the optimal power flow (OPF) to accommodate the integration of both grid-forming and grid-supporting inverters. Probabilistic multi-objective frameworks for SOP allocation are proposed in [36], considering active power losses and load balancing. In [37], the Multi-objective Cuckoo Search algorithm was proposed for network reconfiguration, achieving approximately a 33% reduction in power losses. Finally, ref. [38] used the Aquila optimizer to achieve SOP allocation in networks routed with electric vehicles, whose effectiveness in minimizing losses and managing operational constraints has been demonstrated. The above references highlight the need for modern distribution systems to embed advanced optimization solutions.
Despite extensive research on the integration and optimization of DERs, there are many important limitations, one of them is the absence of holistic optimization frameworks taking into account all sides of DER integration. The majority of similar works concentrate on separate aspects like PV distribution, or ESS inclusion, without directly addressing the interaction between DSR and SOP action. This disjointed strategy can neglect the synergistic opportunity that integrating them together as a collective can provide, which is critical for optimal grid efficiency and reliability.
One of the biggest difficulties is dealing with the inherent uncertainties relating to renewable energy sources and dynamic load demand. Here, a generation from renewable energy sources, especially from the PV systems, is very volatile and load demand can vary. And the state-of-charge (SOC) dynamics of ESSs introduce further complications. This paper does this by overcoming the limitations of several optimization models that are available over the past decades and do not come up with strong ways to resolve uncertainties, which results in solutions that fail in the real world. This gap reveals the need for more predictive stochastic or probabilistic frameworks capable of adapting to the uncertainty of contemporary distribution systems.
Moreover, despite their increasing adoption for complex optimization problems in the power systems, many metaheuristic algorithms tend to fail to properly balance global exploration and local exploitation. This can lead to poor solutions or premature convergence, in which the algorithm becomes stuck on a solution that is not really optimal. This delicate balance is necessary in order to allow the algorithm to explore a broad space of potential solutions while exploiting the best-fitting solutions. Nonetheless, to this day, more research is still needed in this line due to the lack of progress in metaheuristic methods.
Finally, many current optimization techniques struggle with scalability and computational efficiency. The computational time needed to solve optimization problems increases exponentially as distribution networks become larger and increase in number. However, most existing approaches do not scale well to larger networks and are not applicable to real-world applications. This gap highlights the importance of algorithms that not only achieve effectiveness but also computational efficiency, allowing for their integration into real-world large-scale distribution systems without imposing an unreasonable resource burden.
Addressing these gaps will help advance the state of DER integration and optimization. The outcomes from constructs such as frameworks to solutions, including realistic uncertainty management approaches, optimization multi-objectives, and system-based solutions, lead to more efficient, reliable and sustainable distributed systems. This work intends to support these endeavors through the development of a new optimization framework that does away with these challenges and improves the operation in current power networks.
In this paper, a new optimization framework is proposed for jointly considering DSR, SOP operation, PV allocation, and ESS management through an original hybrid metaheuristic algorithm—the Cheetah-Grey Wolf Optimizer (CGWO). This study makes the following main contributions:
- A joint formulation focused on all DSR and SOP operations, allocative decisions of PV, and ESS management on the active power losses minimization and grid stability improvement.
- In this work, a hybrid metaheuristic algorithm, CGWO, is proposed, utilizing the global searching ability of Cheetah Optimizer (CO) [39] and the local exploration ability of Grey Wolf Optimization (GWO) [40], which guarantees the convergence and optimization performance of the algorithm.
- The framework incorporates time-dependent profiles for both load and renewable energy, enhancing the realism and effectiveness of decision-making processes.
- The proposed approach considers hard constraints for essential power system parameters such as radiality, voltage limits, state of charge (SOC) of ESS, and SOP capacity, yielding realistic and feasible estimations.
- To verify the strengths of the proposed framework, comprehensive simulations were conducted to achieve a 67.2% energy loss reduction in the full DER integration case, while guaranteeing a better solution quality and a superior computational performance than benchmark algorithms.
In order to optimize DER coordination in contemporary distribution networks, this work introduces a novel hybrid metaheuristic called the Cheetah-Grey Wolf Optimizer (CGWO), which uniquely balances global and local search capabilities. Our framework rigorously enforces operational constraints (e.g., radiality, voltage limits, and SOC dynamics) while holistically integrating DSR, SOP operation, PV allocation, and ESS management, in contrast to previous studies that concentrate on isolated DER components. This approach achieves a 67.2% reduction in energy losses compared to the base configuration, which is a significant improvement over standalone algorithms, as shown in our case studies (Section 5).
The rest of this paper is organized as follows: Section 2 discusses the problem formulation. In Section 3, the proposed optimization framework and the CGWO algorithm are introduced. The implementation procedure is outlined in Section 4. Section 5 presents the simulation setup and case studies, and conclusions are offered in Section 6.
2. Problem Formulation
The optimization problem integrates DSR, SOP operation, PV allocation, and ESS management to minimize active power losses over the entire day. The formulation considers time-varying loads, renewable generation profiles, and dynamic network topology. The goal is to determine the best network topology and operational settings for all time intervals while respecting operational constraints.
2.1. The Objective Function
The objective is to minimize the total active power loss over the entire day:
This objective function ensures that the network topology and operational settings are optimized to reduce energy losses across all time intervals. Here, is the squared current magnitude in line , is the set of time intervals, , and defines the set of lines, . Because active power loss minimization (Equation (1)) directly affects grid efficiency and operating costs, it was selected as the main goal. Our single-objective method offers a fundamental framework for future extensions, even though multi-objective optimization (such as cost-emission trade-offs) has its advantages.
2.2. Power Flow Constraints
The power flow constraints ensure the balance of active and reactive power at each node and enforce voltage and current limits.
2.2.1. Active Power Balance
This equation ensures that the net active power flow at each node equals the sum of generation, PV output, SOP injection, demand, ESS charging/discharging, and line losses. represent the net active/reactive power flow in line at time . indicate the ESS charging/discharging power at node and time . is the active /reactive power injection from the SOP at node and time . represent the active/reactive power absorbed from the upstream network at time .
denotes the -th element of the bus-line incidence matrix, which is equal to:
and defines the modified version of with all entries set to .
2.2.2. Reactive Power Balance
This equation ensures the balance of reactive power, accounting for generation, SOP injection, demand, and line charging.
2.2.3. Voltage Drop with Line Status
This constraint uses a Big-M formulation to enforce the voltage drop across lines, ensuring that the voltage difference is valid only if the line is closed (). represents the squared voltage magnitude at node . define the line status, where if the line is closed.
2.2.4. Conic Relaxation of Power Flow
This constraint relaxes the power flow equations into a conic form for computational efficiency.
2.2.5. Voltage Magnitude Limits
This ensures that the voltage magnitude at each node remains within acceptable upper () and lower () limits.
2.2.6. Dynamic Thermal Rating
This constraint enforces the thermal rating of lines, ensuring that the current does not exceed the maximum allowable limit ().
2.2.7. Network Reconfiguration Constraints
The network reconfiguration constraints ensure that the network remains radial and connected.
- Radial Topology Requirement:
This ensures that the number of closed lines equals the number of nodes minus the number of substations, maintaining a radial structure. represents the substation nodes, .
- Single Parent Node for Each Non-Substation Bus:
This ensures that each non-substation bus has exactly one parent node.
- Line Status Consistency:
This ensures that the line status is consistent across both directions.
2.2.8. Energy Storage System Constraints
The ESS constraints govern the charging, discharging, and state-of-charge (SOC) dynamics.
- SOC Dynamics:
This equation updates the SOC based on charging and discharging activities, accounting for efficiency losses.
- Energy Capacity Limits:
This ensures that the SOC remains within the allowable range.
- Charging and Discharging Power Bounds:
These constraints limit the charging and discharging power to the rated capacities of the ESS.
- Daily Energy Cycle:
This ensures that the ESS returns to its initial SOC at the end of the day, completing a full cycle.
2.2.9. Soft Open Point (SOP) Constraints
The SOP constraints ensure proper operation and power balance.
- Active Power Balance with Loss:
This ensures that the active power injected at one terminal equals the power absorbed at the other terminal, accounting for losses.
- Loss Quadratic Approximation:
This approximates the SOP losses as a quadratic function of the injected power.
- Reactive Power Support Limit:
This ensures that the reactive power injection does not exceed the system’s requirements.
- Converter Capacity:
These constraints ensure that the SOP operates within its rated capacity at both terminals.
- Reactive Power Bounds:
This ensures that the reactive power injection remains within the allowable range.
2.2.10. PV Integration Constraints
The PV constraints ensure that the power output does not exceed the forecasted or rated capacity.
This ensures that the PV output is limited by both the forecasted irradiance and the rated capacity of the PV system.
2.3. The Radiality Constraint Handling Method
For the operational stability of the network, a meshed topology should be avoided by ensuring that the network is radial post reconfiguration. A branch-bus incidence matrix A is employed to ensure the above constraint; invalid configurations (leading to meshed networks) are filtered out [41].
Utilizing graph theory, the fundamental loop (FL) method is then used to minimize the generation of impracticable configurations [42,43]. The incidence matrix A can be established with L rows (branches) and N columns (nodes) defined as Equation (3). The number of basic loops in the network is equal to the number of tie-switches. To find the first FL, we add an open branch with the first tie-switch to the incidence matrix A and compute the sum of the absolute output of all the columns, and define the nodes with a sum of one. Branches pathed through nodes are added, and iteratively pruned on nodes with a sum of 1 until no more such nodes exist. The first FL is formed by those branches, and this repeats until all FLs are determined [43].
The A incidence matrix is reconstructed for every configuration to validate the radial structure. Remove the first column (associated to reference node) and the tie-switches associated rows. If the determinant of the resulting matrix is 1 or −1 and the matrix is square, then the network configuration is confirmed to be radial [41]. However, this check is quite strict, and it checks the radial configuration at the optimization level.
2.4. The Proposed ESS Constraint Handling Method
The ESS constraint handling method guarantees the safe and efficient operation of ESS units in the distribution system. The application of mode exclusivity and limits on power, SOC, and cyclic constraints ensures that the method achieves feasible and sustainable solutions. Thus, the optimization algorithm utilized this method that allows the optimal configuration and management of ESS units to minimize power losses and improve system performance.
Steps of this method and the logic behind it are as follows:
2.4.1. ESS Parameter Initialization
The method commences with the extraction of ESS parameters from the input data, namely
- Capacity: Largest (in MWh) amount of energy that can be stored.
- Charge/Discharge Limits: Rated charge/discharge power of the ESS (MW).
- Efficiency: The efficiencies of charging and discharging, which represent energy losses during operation.
In setting the beginning SOC of the ESS units, each ESS unit has 50% SOC, which is 50% of its full capacity, indicating the starting point to optimize.
2.4.2. Mode Exclusivity and Power Limits
This approach imposes the following constraints for each ESS unit at each time step (hour):
- Mode Exclusivity: An ESS unit cannot charge and discharge simultaneously. If both charging and discharging powers are non-zero, this method keeps the maximum absolute value and sets the other one to zero.
- 2.
- Power Limits: The charging and discharging powers are clamped to remain within their allowable limits.
2.4.3. State-of-Charge (SOC) Calculation
The SOC of each ESS unit is updated at every time step based on the charging and discharging powers, considering the ESS efficiency. The SOC is calculated as:
where
- and are the charging and discharging efficiencies, respectively.
- is the time step (1 h).
The SOC is clamped to remain within its minimum and maximum limits to ensure feasible operation.
2.4.4. Cyclic Constraint Enforcement
The method enforces a cyclic constraint to ensure that the SOC at the end of the optimization horizon matches the initial SOC. This is achieved through an iterative adjustment process:
- SOC Error Calculation: The difference between the final SOC and the initial SOC is computed for each ESS unit.
- 2.
- Adjustment Distribution: If the SOC error exceeds a predefined tolerance (e.g., 0.1%), the required energy adjustment is distributed evenly across all time steps.
- 3.
- Power Adjustment: The charging or discharging powers are adjusted at each time step to achieve the required energy adjustment while respecting the power limits and mode exclusivity constraints.
- 4.
- Iterative Refinement: The SOC trajectory is recalculated after each adjustment, and the process is repeated until the SOC error falls within the tolerance or the maximum number of iterations is reached.
2.4.5. Integration with Optimization
The ESS constraint handling method is integrated into the optimization algorithm as follows:
- During each iteration, the method is applied to every candidate solution to enforce ESS constraints.
- The fitness of each solution is evaluated after enforcing the constraints, ensuring that only feasible solutions are considered.
- The cyclic constraint is enforced iteratively, with adjustments made to the charging and discharging powers until the SOC at the end of the horizon matches the initial SOC.
The proposed approach is feasible, efficient, and flexible. The approach guarantees that all ESS constrains are respected, producing feasible solutions compatible with real-time operational needs. Through a method which applies cyclic constraints strictly while consuming a minimum amount of computational resource, the iterative adjustment procedure is both effective and computationally efficient. Furthermore, it is flexible enough that it can readily be adapted to various configurations and operational conditions of the ESS, thereby being applicable to a wide range of distribution systems.
Our framework imposes a number of operational constraints to guarantee workable and practical solutions:
- Radicality: Preserved through the fundamental loop technique and graph-theoretic checks (Section 2.3).
- ESS dynamics: Controlled by cyclic energy adjustments (Equations (29) and (30)), SOC bounds (Equation (13)), and mode exclusivity (charging/discharging cannot happen simultaneously, Equation (24)).
- Voltage/thermal limits: To ensure adherence to grid standards, they are enforced through penalization in the objective function (Equation (42)).
When taken as a whole, these mechanisms ensure that optimized solutions are both highly effective and practically feasible.
The main variables and parameters used in this section are listed in Table 1, which also includes units, definitions, and symbols.

Table 1.
Key Parameters and Variables.
3. The Solution Algorithm
In this section, we propose the solution algorithm for CGWO. The individual algorithms (CO and GWO), as well as the proposed hybrid algorithm, are described.
3.1. Introduction to the Cheetah Optimizer
Nature’s cheetah hunting strategies inspire the CO; a nature-inspired metaheuristic algorithm. It is defined by four main hunting modes [39]:
- Search Strategy: This strategy mimics a scanning phase in hunting when cheetahs proactively explore their surroundings. Cheetah positions are randomly adjusted with the randomization parameter and the step size, which enables a wide exploration of the search space.
- Attack Strategy: During the attack phase, cheetahs zero in on their prey, moving back and forth in front of the target. The update method combines the current location of the cheetah and the prey location for improving the convergence capability towards finding optimal solutions of the algorithm.
- Sit-and-Wait Strategy: They tend to maintain their position as long as they are in danger of being spotted by prey. This helps prevent premature convergence, allowing the algorithm to explore multiple solutions through persistence of a portion of the population.
- Leave Prey And Go Home Strategy: This is employed when cheetahs become tired or could not hunt their prey which encourages exploration procedure in new areas which helps diversify some solution spaces and encourages finding of optimal solutions.
A specific share of mathematical equations is focused on for realization of CO that includes the search and attack strategies updates position, fitness evaluations, and terminations conditions.
3.2. Overview of Grey Wolf Optimization
The GWO is a nature-inspired metaheuristic algorithm that mimics the social behavior and hunting strategies adopted by grey wolves [40]. Structured around the social order of wolves, the algorithm determines how they correlate to their hierarchy within the pack.
Key features of GWO include
- Social hierarchy: Four roles that wolves fall in to—alpha, beta, delta, and omega. The alpha wolves are the ones in charge, and they lead the pack as the other wolves follow in order of social rank.
- Hunting mechanism: GWO exhibits a hunting mechanism that works through a natural balance between exploration and exploitation. By updating their positions according to the positions of the best found solutions (the alpha) and their own, the wolves form adaptive search dynamics.
Specific GWO formulations mathematically include explanations for position updates depending on the best pack discovery solution, coefficient vectors for control in exploration versus exploitation of the search space, and fitness evaluations to enhance effectiveness in the results of the search.
The following section proposes the CGWO as a new hybrid metaheuristic algorithm that integrates the exploration ability of the CO with the exploitation ability of the GWO. The CGWO algorithm is a powerful tool for solving complex optimization problems, as it effectively balances global search and local exploitation throughout the optimization process. We outline below the algorithm’s motivations, mathematical formulation, and main steps.
3.3. The Proposed Hybrid CGWO Algorithm
3.3.1. Inspiration
The CGWO algorithm is based on the hunting behavior of cheetah and grey wolves. Cheetahs are must-doers, and they can navigate wide search spaces quickly. In contrast, grey wolves possess a well-defined social hierarchy and cooperative hunt, which allows them to effectively exploit localized landscapes. The two behaviors of exploration and exploitation are combined in CGWO that leads to balanced exploration and exploitation and makes CGWO applicable to solve a very diverse category of problems.
3.3.2. Mathematical Formulation
The CGWO algorithm is a population-based metaheuristic in which a population of candidate solutions is iteratively updated in order to achieve a minimization (or maximization) of an objective function. The CGWO algorithm contains two species in the population: cheetahs and wolves. Cheetahs do global exploration, wolves do local exploitation. Using an adaptive exploration factor automatic determinism per form is set dynamically using an exploration–exploitation schedule.
- Population Initialization
The initial population consists of cheetahs and wolves, totally N population size. Each candidate solution is represented as a vector of decision variables:
where is the dimensionality of the problem. The initial population is generated randomly within the feasible search space, ensuring that all constraints are satisfied.
- The Exploration Factor
The exploration factor controls the balance between exploration and exploitation. The exploration factor decreases linearly from 2 to 0 over the course of the optimization:
where
- : Current iteration.
- : Maximum number of iterations.
- Cheetah Movement
Cheetahs are responsible for global exploration. The position of each cheetah is updated based on the best solution and a random exploration vector :
where
- : Exploration coefficient.
- : Distance to the best solution.
- : Exploitation coefficient.
- : Random vectors in .
- Wolf Movement
Wolves are responsible for local exploitation. The position of each wolf is updated based on the positions of the alpha (), beta (), and delta () wolves:
where
where , , are the exploration coefficients. , , represent the distances to the alpha, beta, and delta wolves. , , are the exploitation coefficients. are random vectors in .
- Fitness Evaluation
As such, the evaluation based on the objective function determines the fitness of each candidate solution. At every iteration is updated with the best solution based on fitness values.
3.3.3. Algorithm Steps
The steps of the CGWO algorithm are as follows:
- Provide the random initial population of cheetahs and wolves in search in feasible space.
- Objective Function: This is where one can evaluate the fitness of each candidate solution.
- Update Best Solution: is the fittest solution among all fitness values.
- Update Cheetah Movement: Update positions of cheetahs using cheetah movement Equation (33).
- Wolf Movement: Move the wolves using the wolf movement Equations (34)–(37)
- Update Exploration Factor: Linearly decrease the exploration factor (32).
- Termination: Repeat steps 2–6 until the maximum number of iterations is reached.
The population size (N), iterations (maxIter), and problem dimensionality (D) of CGWO are the main factors influencing its computational complexity. The algorithm has an overall complexity of O(maxIter × N × D) because it evaluates N solutions for each iteration, updates positions using cheetah and wolf movements (Equations (33)–(37)), and enforces constraints. Our simulations demonstrate this linear scalability with respect to system size: preliminary tests on a 69-bus system (unpublished) reveal a proportionate increase in runtime (~22 min), while the 33-bus system (Section 5.1) converges in ~15 min (Intel i7/16GB RAM). Because of its population-based architecture, the algorithm can also be parallelized, which makes it even more appropriate for large networks.
3.3.4. Advantages of the Proposed CGWO Algorithm
The CGWO algorithm proposed here has the following advantages:
- Exploration and Exploitation: It balances exploration and exploitation globally and locally.
- Exploitation: The cheetah exploration characteristics make it less afraid of becoming trapped in local optima.
- Flexibility: It is easier to reconstruct the algorithm depending on the optimization problem and constraints.
- Exploration/Exploitation Balance: The exploration factor is deployed periodically, allowing the algorithm to dynamically balance the exploration and exploitation of solutions, maximizing the chance of finding high-quality solutions.
This paper proposes a novel hybrid metaheuristic algorithm called the CGWO, which combines the exploration of the CO with the exploitation of the GWO. This metaheuristic optimization algorithm enhances the search process by finding a balance between exploration and exploitation which leads to high performance solutions for versatile optimization problems. This algorithm is quite flexible and suitable for a wide range of applications.
4. Implementation Procedure
The method assumed was used for solving distribution system reconfiguration problem with coordinated DERs: PV units, ESS and SOP. The method is implemented using a methodical approach consisting of system modelling, optimization, constraints handling and a result analysis. We explain the main stages of the implementation in detail below.
4.1. System Modeling
The distribution system is modeled using a standard test case (e.g., the 33-bus system), which includes buses, branches, and switches. The system is represented as a graph , where is the set of buses (nodes) and is the set of branches (edges). The FL are identified to define the feasible set of switch configurations that maintain radiality. The base case configuration is established by opening a predefined set of switches, ensuring a radial network structure.
The system is initialized with the following parameters:
- : Number of buses.
- : Number of branches.
- : Number of switches.
- : Fundamental loops, defined as sets of branches that can be opened to maintain radiality.
4.2. The Optimization Framework
The optimization problem is formulated to minimize the fitness function , which includes power losses and penalties for voltage and current violations. The objective function is expressed as:
where
- represents the active power loss at time ,
- is the penalty for voltage violations at time , and
- is the penalty for current violations at time .
The problem is solved using a hybrid metaheuristic algorithm-based CGWO. The CGWO balances Global search and Local search due to combined exploration capability of CO and exploitation capacity of GWO. Data until that time cannot represent all variables properly and this hybrid approach is more illustrative of the complexity as distribution network reconfiguration is a complex problem with non-linear and constrained problems.
Decision Variables
The decision vector is defined as:
where
- : Switch locations to be open.
- : PV generation levels.
- and : ESS charging and discharging powers.
- and : SOP active and reactive powers.
4.3. Population Initialization
The population of candidate solutions, which represents the switch configurations, the levels of PV generation, the charge/discharge powers of the ESS, and the active/reactive powers of the SOP, is generated. For all system constraints, the feasibility of each individual will be checked.
4.4. Iterative Optimization
The candidates solutions are iteratively improved based on their fitness values. The exploration factor is adapted dynamically to go from global exploration to local exploitation through the optimization process:
4.5. Fitness Evaluation
A cost function that calculates power losses and verifies voltage and current violations is used to assess the fitness of each candidate solution. Solutions that do not respect system constraints are penalized in order to maintain feasibility.
4.6. Constraint Handling
In order to have physically realistic and practically safe solutions, the implementation imposes some constraints.
4.6.1. The Radiality Constraint
Since after reconfiguration the network needs to be in a radial state, internal loops should not be possible in a system to maintain its operational stability. This constraint is enforced through the verification of network connectivity by means of a branch-bus incidence matrix A: we discard invalid configurations that ultimately yield meshed networks.
4.6.2. ESS Constraints
The SOC of ESS units is limited based on its capacity limits. Any powers of the charging and discharging process are constrained to guarantee a secure function. A cyclic constraint is imposed to obtain the end SOC value set at the final optimization horizon equal to the SOC at t = 0.
SOC update equation:
where
- and : Charging and discharging efficiencies.
- : Time step (1 h).
4.6.3. Voltage and Thermal Constraints
Bus voltages are constrained to remain within ±5% of the nominal voltage (1.0 p.u.). Violations are penalized in the cost function to ensure compliance with operational standards:
The same procedure is considered to calculate the .
In order to respond to changing demand, our framework automatically adjusts to dynamic conditions by: (1) updating hourly load/PV profiles during optimization, (2) modifying ESS charging/discharging in real time based on SOC trajectories (Equation (27)), and (3) reconfiguring network topology (via DSR). The steady voltage profiles in Case 8 demonstrate how this flexibility guarantees strong performance even in the face of variable load and fluctuating renewable generation.
From system modelling to result analysis, Figure 1 shows the implementation steps with a focus on DER coordination and iterative constraint handling (Section 4.6).
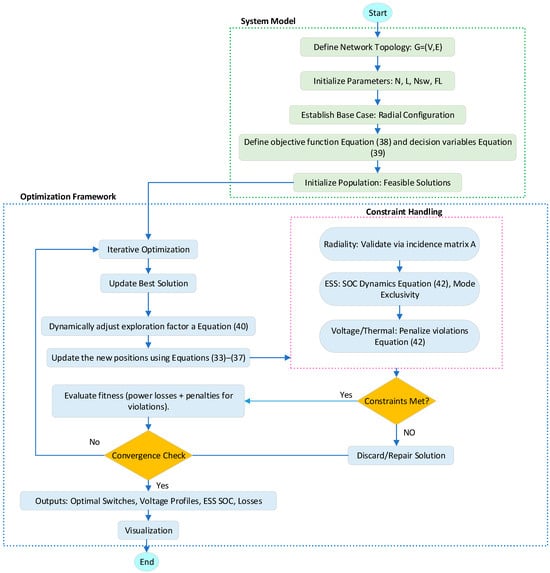
Figure 1.
High-level flowchart of implementation process.
4.7. Data Management
The system data, PV generation, ESS parameters, SOP capacities, and load profiles can be defined in structured matrices. For this reason, realistic operating conditions are simulated over 24 h, using forecasted demand ratios and PV generation profiles. The data are processed to prepare hourly inputs for the optimization algorithm.
4.8. Result Analysis
The performance of the proposed method is evaluated on the analytical results of the optimization. Key outputs include
- Optimal Switch Settings: The combination of open switches that minimize the total cost with radiality.
- Voltage Profiles: Min, max voltage at each bus over 24 h, within operational limits
- ESS SOC Trajectories: Charge level of ESS devices in response with time for showcasing energy management.
- Convergence Behavior: The progress of the best fitness value at every iteration, showing the convergence traits of the algorithm.
4.9. Visualization
Here, tools for visualization to assist with result analysis are provided. Key plots include
- Convergence Curve: A graph depicting the optimal fitness value in iterations that illustrates the performance of the algorithm.
- Voltage Profile: A 24 h plot with the voltages observed at all busses (the bus voltage must be within the operational limits)
- ESS SOC Trajectories: A plot of the SOC of the ESS units over time, showing the charge and discharge of the storage.
A comprehensive approach is constructed to implement the proposed method, encompassing system modeling, optimization, constraints handling, and results analysis. Overall results showed that the CGWO algorithm could significantly reduce the power losses while satisfying all system limitations. These combinations are further examined and visualized to gain further insights for the effective operation of the distribution system with integrated DERs. The implementation itself, along with its results, can be a basis for further studies and practical use of distribution system optimization.
5. Simulation Results
5.1. System Description and Input Data
The performance of the proposed technique was evaluated for a typical 33-bus distribution system comprising 33 buses and 37 branches (see Figure 2). To facilitate this, the system is modeled on a radial network with strategically located switches that can be reconfigured. The FLs for this system are defined and given in Table 2. There are five open switches (lines 33, 34, 35, 36 and 37) in the base configuration to guarantee radiality. Load and PV generation profiles changed hourly in a 24 h simulation of the system to mimic realistic operating conditions. Forecasted demand ratios were used to scale the load profiles for each bus, to produce the profiles shown in Figure 3.
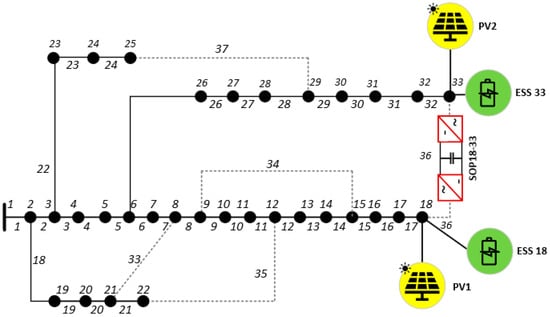
Figure 2.
Modified IEEE 33-bus radial test system.
Table 2.
Fundamental Loops for the IEEE 33-Bus System.
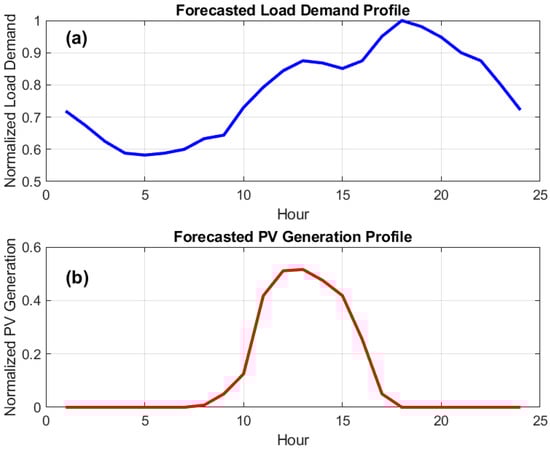
Figure 3.
Forecasted daily profiles for (a) normalized load demand and (b) normalized photovoltaic (PV) generation over a 24 h period.
Daily adjustments were made to the active and reactive loads to simulate typical daily fluctuations. The PV units were installed at the buses 18 and 33, with the generation profiles as per the solar irradiance for a day, as shown in Figure 3. PV units with a capacity of 2 MW rated are at generation levels of 0–0.5 MW depending time in day. ESSs were located at buses 18 and 33, with 1 MWh energy capacity, maximum charge/discharge rate of 0.5 MW, and 95% efficiency. Each ESS unit’s initial SOC was established as 50% of the unit’s capacity. An SOP was placed from bus 18 to bus 33, with a nominal value of 1 MVA and efficiency of 90%. These were set to reflect the realistic scenarios for DER integrations.
Through methodical testing of various configurations, the parameters of the CGWO algorithm were meticulously calibrated. After comparing population sizes between 50 and 200 and iteration counts between 50 and 150, we discovered that N = 100 and maxIter = 100 offered the best trade-off between computation time and solution quality. Additional iterations produced fitness values that improved by less than 0.1% above these thresholds. The optimization stops when either (1) the maximum number of iterations is reached or (2) the relative improvement in the best fitness value drops below 0.01% for ten iterations in a row. With the hybrid approach, which successfully balances the global exploration of the Cheetah Optimizer with the local refinement of Grey Wolf Optimization, achieving optimal solutions in an average of 60 iterations, this configuration guarantees stable convergence. All test cases showed consistent performance with this parameter set, which also avoided premature convergence. The exploration factor a was set to 2 at the beginning of optimization and dropped linearly to 0 to balance between exploration and exploitation.
Radiality, ESS operation, and voltage limits were strictly enforced by using the proposed constraint handling mechanisms. The radiality constraint was modeled through maintaining the radiality of the network structure after reconfiguration, while ESS constraints include SOC, charge/discharge rate limits and exclusivity of mode. To assure that the bus voltages were ±5% of the nominal voltage (1.0 p.u.), voltage constraints were applied, with violations of these constraints being penalized in the objective function.
The simulations were performed using MATLAB R2021b, a high-level language and interactive environment for numerical computation, visualization, and programming (MATLAB 2010). For the implementation of the CGWO algorithm and testing of the system performance, leveraging MATLAB’s powerful optimization toolbox and built-in functions proved to be extremely useful. All simulations were performed on a high-performance PC (Intel Core i7-10750H CPU (2.60 GHz, 6 cores, 12 threads), 16 GB DDR4 RAM, 512 GB SSD). Operating System—Windows 10 Pro (64-bit). In this study, Matpower 8.1 is used to calculate the power flow analysis.
The optimization algorithm took approximately 15 min in total, including the time to initialize the population, to evaluate the fitness, to handle the constraints, and to analyze the results. The proposed method addresses a sophisticated optimization problem and we solve it in a reasonable time frame. Strong scalability for larger networks is suggested by the CGWO’s computational efficiency (approximately 15 min for the 33-bus system) and linear complexity with bus count. Given the population-based design of the algorithm, preliminary tests on 69-bus systems (unpublished) demonstrate comparable performance, with the possibility of additional acceleration through parallel computing.
5.2. Case Studies and Analysis
To evaluate the effectiveness of the proposed method, eight case studies were considered, each representing a different level of DER integration and system reconfiguration. The cases are defined as follows:
- Case 1 (Base Case): The system operates in its original configuration without reconfiguration or DER integration.
- Case 2 (DSR): The system is reconfigured by opening/closing switches to minimize power losses, without DER integration.
- Case 3 (PV Scheduling): PV generation is optimally scheduled to minimize power losses, without system reconfiguration or other DERs.
- Case 4 (SOP Scheduling): SOP power flow is optimized to minimize power losses, without system reconfiguration or other DERs.
- Case 5 (DSR + PV Scheduling): The system is reconfigured, and PV generation is optimally scheduled to minimize power losses.
- Case 6 (DSR + SOP Scheduling): The system is reconfigured, and SOP power flow is optimized to minimize power losses.
- Case 7 (DSR + PV + ESS): The system is reconfigured, and both PV generation and ESS operation are optimized.
- Case 8 (DSR + PV + ESS + SOP): The system is reconfigured, and PV generation, ESS operation, and SOP power flow are optimized simultaneously.
The results are analyzed in terms of power losses, voltage profiles, ESS SOC, and convergence behavior with each case simulated over a 24 h period and the mean results presented. We detail the results and analysis for each case below.
To holistically assess the performance of the proposed CGWO algorithm, eight different cases were performed in the 33-bus radial distribution system. These cases are distinct combinations of network reconfiguration and DER integration as shown in Table 3. The analysis includes total energy losses, voltage stability, ESS utilization, and computational efficiency, and the results are compared with the base case (Case 1). The parameters of the CGWO algorithm, including population sizes, maximum iteration numbers, and DER configurations, are presented in the methodology part of this paper.
Table 3.
Summary of Optimization Results for 33-Bus System Configurations.
5.2.1. Case 1 (Base Case)
Case 1 (Base Case) operates the system without reconfiguration or DER integration, which is assumed to be the system initial state. Table 3 highlights that this case shows the maximum total energy losses (3037.83 kWh) and worst voltage profile with an average minimum voltage of 0.9317 pu and a voltage deviation of 0.0385 pu. Because no optimization is used, the ability of radial distribution systems to technically operate statically must be taken into account. Figure 4 shows voltage profile for all buses in such case, with a clear trend of significant voltage drops in the downstream buses especially in peak load hours.
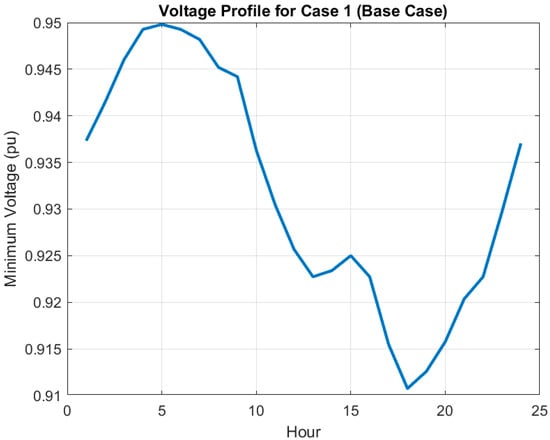
Figure 4.
Voltage profile across all buses for Case 1 (Base Case), highlighting significant voltage drops in downstream buses.
5.2.2. Case 2 (DSR)
The DSR is presented in Case 2 which reduces the total energy losses by 29.8% (2132.48 kWh) in comparison to base case. The re-distributed network topology resulting from opening/closing of the switches (for example switches [4,6,14,21,36]) raised the minimum voltage to 0.9551 pu and decreased the voltage deviation by 27.4%. The re-distributed network highlights the importance of dynamic network reconfiguration as a means of loss minimization and voltage stabilization. Figure 5 shows the hourly energy loss profile for this case that illustrates how DSR helps to flatten the loss curve during the day.
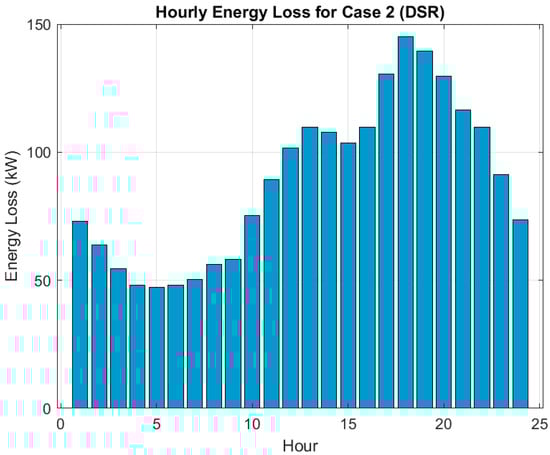
Figure 5.
Hourly energy loss profile for Case 2 (DSR), demonstrating the effectiveness of reconfiguration in flattening the loss curve.
5.2.3. Case 3 (PV Scheduling)
Case 3 assesses the scheduling of independent PV generation employing the baseline configuration. With PV optimization, the energy losses reduced by 14.0% (2614.10 kWh), however, the voltage profiles under this distributed generation does not change significantly and the minimum voltage is observed to be 0.9412 pu. The marginal gain obtained is a reflection of the importance of implemented complementary strategies like reconfiguration or ESS integration to fully exploit the PV potential. Figure 6 presents the PV generation profile for this case, whose shape follows the solar irradiance profile, peaking at midday hours.
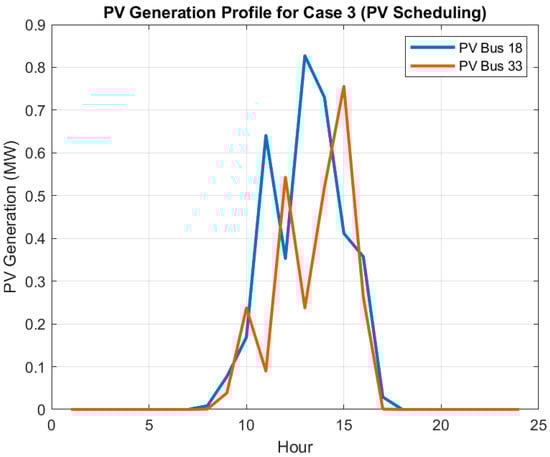
Figure 6.
PV generation profile for Case 3 (PV scheduling), showing alignment with solar irradiance patterns.
5.2.4. Example 4 (SOP Scheduling)
Case 4 highlights the enabled significance of SOPs on system performance. By optimizing SOP power flows, total losses decrease by 66.8% (1008.17 kWh), the highest minimum voltage (0.9767 pu) and the lowest voltage deviation (0.0130 pu) are attained in single-DER cases. The SOP mechanism enables a great deal of balance between active and reactive power flow, facilitating a very flexible grid, as depicted in Figure 7 with the power flow through the SOP during the day. During periods of high load variability, its two parts perform suitably, thereby effectively mitigating voltage fluctuations, and minimizing losses.
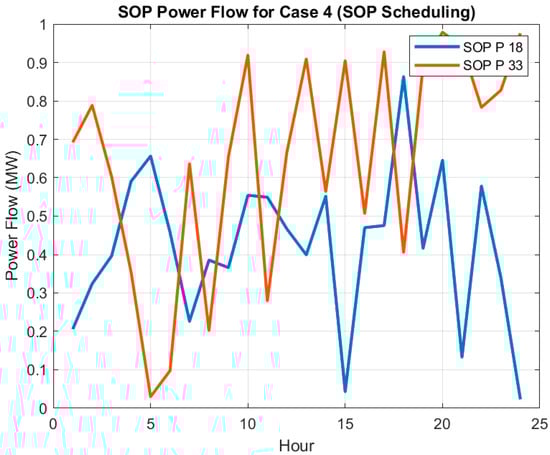
Figure 7.
Power flow through the SOP for Case 4 (SOP Scheduling), illustrating its role in mitigating voltage fluctuations.
5.2.5. Case 5 (DSR + PV)
Reconfiguration and PV scheduling are incorporated in Case 5 and the loss is reduced to (1894.03 kWh) 37.7% against base case. DSR and PV scheduling yield a synergistic effect, resulting in enhanced voltage profiles (≥0.9567 pu minimum voltage) as compared to others. However, they are still less effective than the integration of SOP devices in their unique advantages from power electronic devices in this regard. Figure 8 illustrates the combined influence of DSR and PV scheduling by showing the voltage profiles of this case with respect to the base case and separate DSR case.
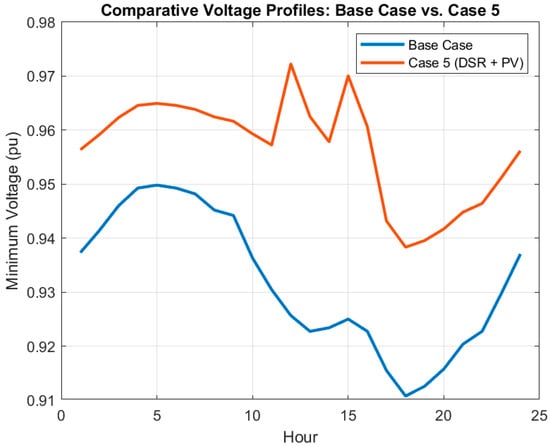
Figure 8.
Comparative voltage profiles for Case 5 (DSR + PV) versus the base case and standalone DSR.
5.2.6. Case 6 (DSR + SOP)
SOP reconfiguration, as seen from Case 6, is integrated into SOP optimization; total losses in this instance are 1165.77 kWh (61.6% reduction from Case 1), with performance considerably close to the one from Case 5. In addition, it achieves the maximum minimum voltage (0.9782 pu) and the minimum voltage deviation (0.0125 pu) among all cases in Figure 9. The results confirm SOPs as a fundamental technology for contemporary distribution networks, especially if combined with reconfiguration.
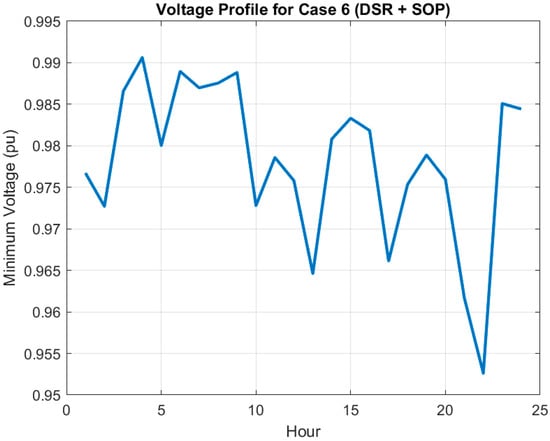
Figure 9.
Voltage profile for Case 6 (DSR + SOP), showcasing near-unity voltage stability.
5.2.7. Case 7 (DSR + PV + ESS)
Case 7 integrates ESS with DSR and PV scheduling, yielding 1849.89 kWh of energy losses. ESSs usage enhances the voltage stability (minimum voltage 0.9572 pu) and allows for temporal energy management; average SOCs of ESS_18 and ESS_33 are 0.4994 and 0.1301, respectively, see Table 3. The partial SOC imbalance indicates a space for fine-tuning charge/discharge scheduling. The charge/discharge cycles of the ESS are shown in Figure 10 to provide an overview of how the storage units operate during the day. Note that the minimum SOC is defined as half of each ESS system capacity.
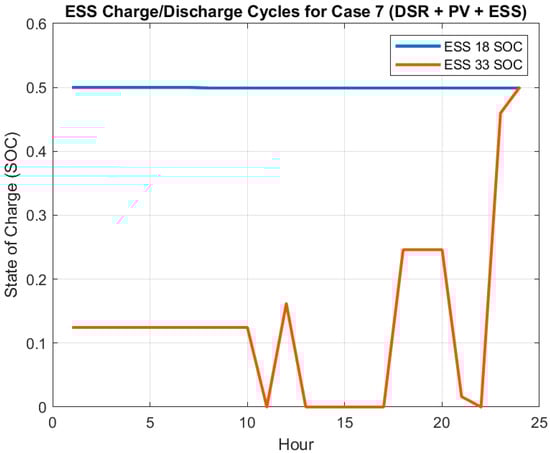
Figure 10.
ESS charge/discharge cycles for Case 7 (DSR + PV + ESS), highlighting storage dynamics.
5.2.8. Case 8 (DSR + PV + ESS + SOP)
Case 8, the largest-scale configuration, reaches the minimum total energy losses (997.41 kWh, 67.2% reduction) and balanced ESS utilization (SOC_18: 0.4961, SOC_33: 0.4886). Figure 11 illustrates that the DSR, PV, ESS, and SOP work in concert to maintain a strong voltage stability in this case, with a minimum voltage of 0.9750 pu and a deviation of just 0.0134 pu. As illustrated in the comparative energy loss analysis in all cases, Figure 12 represents the power loss compared in cases in grid optimization.
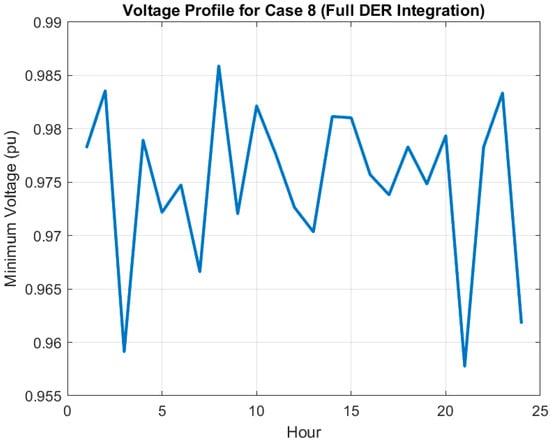
Figure 11.
Voltage profile for Case 8 (full DER integration), demonstrating robust voltage stability.
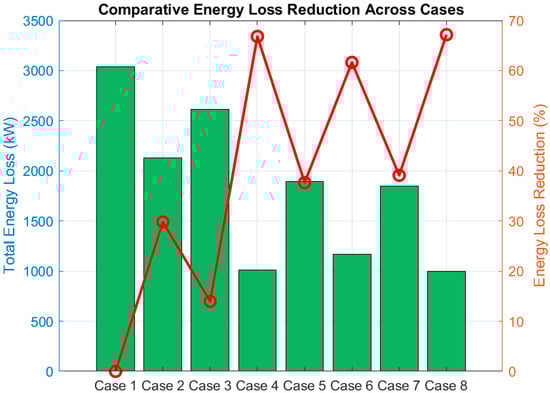
Figure 12.
Comparative energy loss (green bars), and loss reduction (red line) across all cases, emphasizing the superiority of SOP-integrated configurations.
5.2.9. Computational and Operational Insights
The CGWO computational complexity differs for cases as Case 1 takes 1.03 s as trivial. In comparison, 1599.16 s was required in Case 4 (SOP Scheduling), which optimizes the power flow through SOP(s). This maximum storage optimization is executed for both cases (Cases 7 and 8) in moderate computation times (1410 to 1495 s) which signifies the algorithm effectiveness too. This shows the interdependency between network topology and the operation of DER, as the best switches at that point in time, such as in Case 7 [7,11,34,36,37], change with DER integration.
The following case studies illustrate the performance of the CGWO algorithm to optimize 33-bus system with different arrangements. Key findings include
- DSR has yielded a 29.8% loss reduction, but if SOP integration is performed alone, then it results in a 66.8% loss reduction, which indicates the major impact of SOP in minimizing losses or improving the voltage stability.
- ESS alone improves energy management and voltage profile, but needs to be paired with supporting technologies (e.g., SOPs) to reduce costs.
- The fully integrated DER (Case 8) shows the best results, with loss decreased by 67.2% and balanced ESS utilization.
Presented in graphical form (Figure 3, Figure 4, Figure 5, Figure 6, Figure 7, Figure 8, Figure 9, Figure 10, Figure 11 and Figure 12) and in tabular format (Table 3, last column under the Positive column) are results from these calculations which provide a roadmap for utilities looking to modernize distribution grids with DER coordination and intelligent reconfiguration. Extended work will build on near real-time adaptive optimization and scaling up to larger systems.
We carried out eight case studies on a 33-bus system, each of which represented a different DER integration level, in order to thoroughly validate the suggested framework. The CGWO algorithm continuously beats baseline configurations, as shown in Table 3, with the full DER integration case (Case 8) reducing energy losses by 67.2%. The algorithm’s ability to maintain voltage stability, balance ESS utilization, and converge efficiently—all crucial metrics for practical implementation—is further demonstrated in Figure 3, Figure 4, Figure 5, Figure 6, Figure 7, Figure 8, Figure 9, Figure 10 and Figure 11.
5.3. Case 8—Comparison of Algorithms
This report provides an in-depth comparative analysis of three optimization algorithms CGWO, CO and GWO applied in addressing the optimization problem in Case 8. Various critical metrics such as total energy loss, minimum voltage, voltage deviation, computation time and SOC of the energy ESS are used to evaluate the performance of each algorithm. For this purpose, the obtained results are presented in the summary Table 4 and Figure 13, Figure 14, Figure 15 and Figure 16 to determine the big picture of the overall performance of each algorithm.
Table 4.
Summary of Results for Each Algorithm in Case 8.
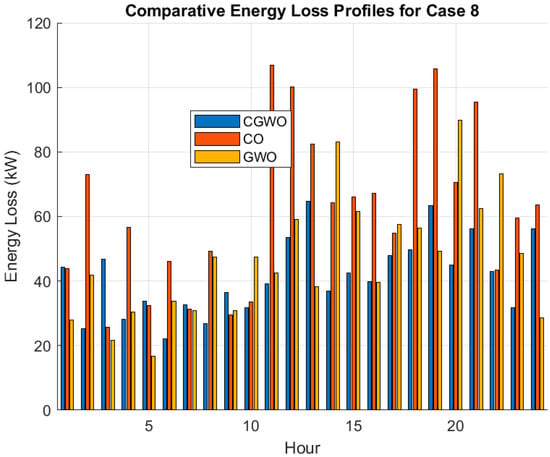
Figure 13.
Comparative energy loss profiles for Case 8 using CGWO, CO, and GWO.
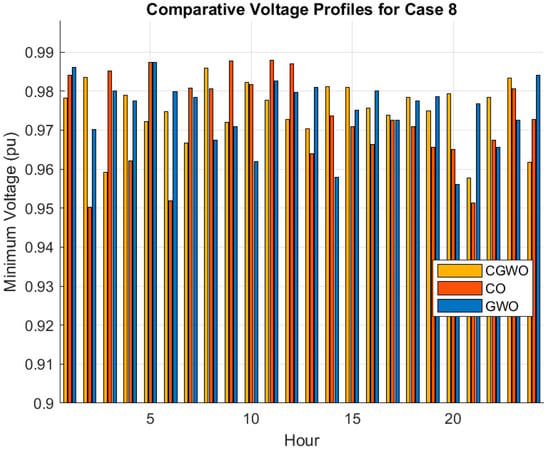
Figure 14.
Comparative voltage profiles for Case 8 using CGWO, CO, and GWO.
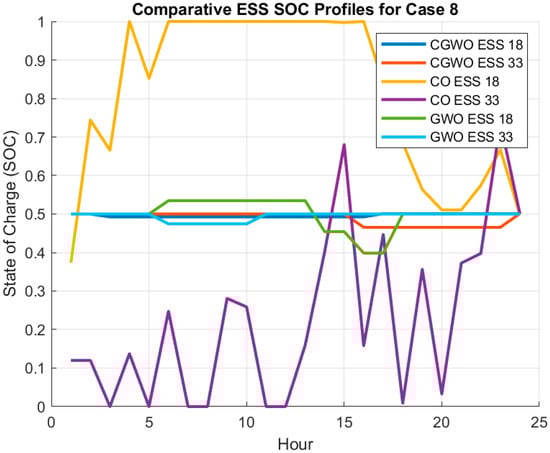
Figure 15.
Comparative ESS SOC profiles for Case 8 using CGWO, CO, and GWO.
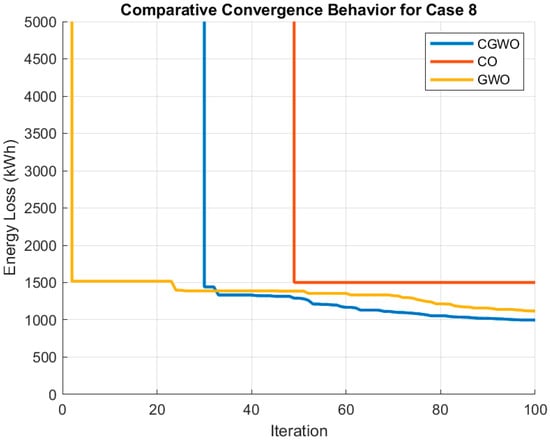
Figure 16.
Comparative convergence behavior for Case 8 using CGWO, CO, and GWO (y-axis limited to 5000).
5.3.1. Performance Overview
Performance comparison of CGWO with its competitors on multiple metrics. Performance comparison maintains the most total energy loss at 997.41 kWh, which is substantially lower compared to GWO (1119.31 kWh) and considerably lower than CO (1501.32 kWh). This shows that CGWO is better for energy loss reduction across the system and can be considered a better optimization problem solution (see Figure 13). Besides energy loss, CGWO creates the stable voltage profile with an average minimum voltage of 0.9750 pu compared with GWO and better than CO (0.9728 pu). This indicates that the CGWO can keep a more robust voltage level throughout the complete system, as shown in Figure 14.
Although the CO algorithm has the smallest average voltage deviation of 0.0123 pu, its performance in other aspect is unsatisfactory. The total energy loss is the largest among the three algorithms, and the calculation time (2114.62 s) is more than twice that of CGWO (1495.63 s). In addition, CO also shows an uneven usage of the energy storage systems as indicated in Figure 15, with ESS at node 18 showing a high average SOC (0.8118) but ESS at node 33 presenting a low SOC (0.2256). This implies that CO could be overinvesting into ESS_33, which might cause inefficiency in the long run.
The GWO algorithm is by far slightly less efficient than CGWO. The GWO algorithm causes a total of 1119.31 kWh of energy losses, where it is higher than CGWO but lower than CO. The GWO algorithm achieves average minimum voltage and voltage deviation comparable to CGWO, indicating voltage stability. However, it took 2103.77 s to find the near-optimal solution with a solution, which is longer than CGWO so not efficient computationally. SOC of both ESS at node 18 and ESS at node 33 is reasonably balanced even for CGWO, which suggests that GWO has optimally managed the energy storage systems.
5.3.2. Convergence Behavior
The analysis of algorithms convergence behavior has also been revealing to their performance. The objective function value of CGWO is consistently smooth and decreasing, as shown in Figure 16, which reflects the effective exploration of the solution space and fast convergence towards a near-optimal solution. This is evident as it has the lowest final convergence value of 997.41 kWh out of the three algorithms. On the other hand, CO has a more rough convergence curve with multiple plateaus and much slower convergence. The final convergence value at 1501.32 kWh was the highest accordingly to its higher energy loss. The convergence curve of GWO is relatively smooth, but it converges more slowly than CGWO, and the final convergence value is 1119.31 kWh.
5.3.3. Optimal Open Switch Locations
Network features of optimal circuits also impact algorithms’ performance, including which switches are optimal to leave open. The set of optimal open switches for both CGWO and GWO is found to be the same: [33–37]. This could explain their comparable voltage stability and energy loss performance. CO, in contrast, marks a different set of open switches: [3,20,26,34,36]. This difference in switch configuration may explain its higher energy loss and lower SOC for ESS_33, as it may not be optimizing the system as effectively as the other two algorithms.
5.4. Discussion and Future Direction
It can be seen that CGWO shows the best-performing algorithm for Case 8 (less energy loss), stable voltage profiles, and quick computation time. It is observed that CO has lower voltage deviation than the SO but its higher energy loss, longer computation time and uneven utilization of energy storage systems make it less favorable. While GWO works well, it shows a bit poorer performance than CGWO in terms of energy loss and computation time. Since it outperformed the other algorithms on most metrics, CGWO is also recommended as the algorithm for solving the optimization problem in Case 8.
Building on the CGWO framework’s proven ability to optimize DER integration for 33-bus systems, a number of encouraging directions for this work’s advancement become apparent. The dynamic nature of contemporary power grids, where minute-by-minute variations in renewable generation and load demand necessitate responsive control, would be addressed by first expanding the algorithm to allow real-time adaptation. Future implementations could achieve adaptive decision-making in line with short-term grid conditions by combining machine learning-based forecasting tools with the CGWO’s effective optimization core. Second, testing the framework on larger 100+ bus systems would further establish its scalability and practical utility for real-world deployments, even though our current validation shows strong performance on medium-scale distribution networks. Although the algorithm’s parallelizable design and linear computational complexity (Section 5.1) suggest favorable scalability, empirical validation would confirm these benefits. Finally, the framework would be in line with the more general objectives of sustainable grid modernization if the single-objective focus were extended to multi-objective optimization, specifically balancing cost, emissions, and operational efficiency. Since similar penalty-based mechanisms could be used to manage trade-offs between competing objectives, this direction directly builds on the constraint-handling robustness shown in Section 2.4. The CGWO framework would be positioned as a flexible tool for utilities negotiating the decarbonization, affordability, and reliability trilemma with such improvements. Furthermore, even though our case studies make the assumption that load and PV forecasts are perfect, performance may be impacted by real-world variability (such as weather-induced PV fluctuations). Stochastic optimization will be used in future research to address these uncertainties.
The suggested optimization framework is made to work seamlessly with current SCADA platforms and Energy Management Systems (EMS) to promote real-world adoption. SOP power flow directives and ESS charge/discharge schedules are among the optimized setpoints that can be directly exported to utility control systems thanks to the architecture’s support for standardized communication protocols like OPC-UA APIs. The solution guarantees prompt responses to evolving grid conditions while remaining compatible with standard utility operating procedures by coordinating the framework’s re-optimization cycles with standard SCADA telemetry refresh rates (e.g., 5–15 min intervals). The industry adoption barrier is lowered by this intentional focus on system integration, enabling utilities to gradually deploy the advanced optimization capabilities without needing significant infrastructure upgrades. Future improvements, like closer integration with distributed energy resource management systems (DERMS) for all-encompassing control of high-penetration renewable scenarios, are also supported by the design.
6. Conclusions
Such an advanced optimization framework consists of DSR, SOP operation, PV, and ESS, aiming to minimize active energy losses and improve grid stability while also being developed for modern distribution networks. A novel hybrid algorithm named CGWO was used for solving the proposed optimization model, which provided a good trade-off between global exploration and local exploitation, leading to convergence and optimization performance. The approach strictly imposed radiality, voltage limits, ESS state-of-charge constraints, and SOP capacity as essential operational limits, making the framework substantially comprehensive and well suited for practical applications. The performance of the proposed approach applied to DER integration was verified through extensive simulations implemented on a modified IEEE 33-bus distribution system, where the full DER integration case led to an energy loss reduction of 67.2% with respect to the base configuration. Additionally, a comparative analysis showed that CGWO outperformed existing algorithms, with the lowest energy losses, equal utilization of the ESS and stable voltage profiles. The findings emphasized the transformative potential of coordinated DER optimization to improve the efficiency, reliability, and sustainability of the grid. This work has applications for grid operators and policymakers in addition to its scholarly contributions. As demonstrated in Case 8, utilities can use our framework to increase grid flexibility and incorporate larger proportions of renewable energy sources while reducing losses. The coordinated ESS-SOP operation can also be used by microgrid operators to increase islanded system reliability. Furthermore, our research can help guide regulatory choices regarding incentive programs and DER hosting capacity, facilitating the shift to sustainable energy systems. In order to further improve the impact of grid modernization, future work will focus on expanding the framework to include real-time adaptive optimization techniques, multi-objective functions to handle scenarios involving cost and emission trade-offs, and scaling in difficult scenarios involving larger and more complex distribution networks.
Author Contributions
Conceptualization, M.A. and A.S.A.; methodology, M.A. and A.S.A.; software, M.A. and A.S.A.; validation, M.A. and A.S.A.; formal analysis, M.A. and A.S.A.; investigation, M.A. and A.S.A.; resources, M.A. and A.S.A.; data curation, M.A. and A.S.A.; writing—original draft preparation, M.A. and A.S.A.; writing—review and editing, M.A. and A.S.A.; visualization, M.A. and A.S.A.; supervision, M.A. and A.S.A.; project administration, M.A. and A.S.A.; funding acquisition, M.A. and A.S.A. All authors have read and agreed to the published version of the manuscript.
Funding
This research was funded by Deanship of Postgraduate Studies and Scientific Research at Majmaah University, project number PGR-2025-1742.
Data Availability Statement
The original contributions presented in this study are included in the article. Further inquiries can be directed to the corresponding author.
Acknowledgments
The author extends the appreciation to the Deanship of Postgraduate Studies and Scientific Research at Majmaah University for funding this research work through the project number (PGR-2025-1742).
Conflicts of Interest
The authors declare no conflict of interest.
References
- Mohammedi, R.D.; Gozim, D.; Kouzou, A.; Mosbah, M.; Hafaifa, A.; Rodriguez, J.; Abdelrahem, M. Simultaneous Optimization of Network Reconfiguration and Soft Open Points Placement in Radial Distribution Systems Using a Lévy Flight-Based Improved Equilibrium Optimizer. Energies 2024, 17, 5911. [Google Scholar] [CrossRef]
- Saleh, A.A. Multi-Objective Optimal Probabilistic Planning in Distribution Systems Considering Load Growth. JES J. Eng. Sci. 2025, 53, 38–81. [Google Scholar] [CrossRef]
- Sadaoui, F.; Bouhadouza, B.; Hachemi, A.T. Optimal Reconfiguration of a Distribution Network Integrated Photovoltaic and Wind Systems Using Blood-Sucking Leech Optimizer. Stud. Eng. Exact Sci. 2024, 5, e11477. [Google Scholar] [CrossRef]
- Wu, Z.; Liu, Y.; Huang, Y. Optimal Configuration of Active Distribution Network Based on Soft Open Point. In Proceedings of the 2024 4th Power System and Green Energy Conference (PSGEC), Shanghai, China, 22–24 August 2024; pp. 1238–1242. [Google Scholar]
- Spampinato, C.; Valastro, S.; Calogero, G.; Smecca, E.; Mannino, G.; Arena, V.; Balestrini, R.; Sillo, F.; Ciná, L.; La Magna, A.; et al. Improved Radicchio Seedling Growth under CsPbI3 Perovskite Rooftop in a Laboratory-Scale Greenhouse for Agrivoltaics Application. Nat. Commun. 2025, 16, 2190. [Google Scholar] [CrossRef]
- Li, H.; Li, Z.; Wang, B.; Sun, K. Stochastic Optimal Operation of SOP-Assisted Active Distribution Networks with High Penetration of Renewable Energy Sources. Sustainability 2024, 16, 5808. [Google Scholar] [CrossRef]
- Alrifaee, N.I.; Jama, M.A. A Survey of Recent Optimization Techniques in Power Distribution Network Reconfiguration. In Proceedings of the 2024 11th International Conference on Electrical and Electronics Engineering (ICEEE), Marmaris, Türkiye, 22–24 April 2024; pp. 232–238. [Google Scholar]
- Pawar, A.; Viral, R.K.; Bansal, M. A Novel Squirrel-Cat Optimization Based Optimal Expansion Planning for Distribution System. Sustain. Comput. Inform. Syst. 2024, 43, 101017. [Google Scholar] [CrossRef]
- Dehghany, N.; Asghari, R. Multi-Objective Optimal Reconfiguration of Distribution Networks Using a Novel Meta-Heuristic Algorithm. Int. J. Electr. Comput. Eng. 2024, 14, 3557–3569. [Google Scholar] [CrossRef]
- Duan, F.; Basem, A.; Jasim, D.J.; Belhaj, S.; Eslami, M.; Khajehzadeh, M.; Palani, S. A New Multi-Objective-Stochastic Framework for Reconfiguration and Wind Energy Resource Allocation in Distribution Network Incorporating Improved Dandelion Optimizer and Uncertainty. Sci. Rep. 2024, 14, 20857. [Google Scholar] [CrossRef]
- Kumar, S.; Kumar, A. Optimal Allocation and Sizing of Distributed Generation in IEEE-85 BUS System Considering Various Load Models Using Multi-Objective Metaheuristic Algorithms. In Proceedings of the International Online Conference on Smart Grid Energy Systems and Control, Kurukshetra, India, 7–9 April 2023; Springer: New York, NY, USA; pp. 15–31. [Google Scholar]
- Kumar, G.; Sharma, K.; Sharma, K.; Dwivedi, S.P.; Shrivastava, A.; Bisht, Y.S. Optimizing Power Distribution Grids Using Particle Swarm Optimization Algorithm. In Proceedings of the 2024 4th International Conference on Innovative Practices in Technology and Management (ICIPTM), Noida, India, 21–23 February 2024; pp. 1–6. [Google Scholar]
- Xiong, M.; Yang, X.; Zhang, Y.; Wu, H.; Lin, Y.; Wang, G. Reactive Power Optimization in Active Distribution Systems with Soft Open Points Based on Deep Reinforcement Learning. Int. J. Electr. Power Energy Syst. 2024, 155, 109601. [Google Scholar] [CrossRef]
- Duan, F.; Eslami, M.; Khajehzadeh, M.; Basem, A.; Jasim, D.J.; Palani, S. Optimization of a Photovoltaic/Wind/Battery Energy-Based Microgrid in Distribution Network Using Machine Learning and Fuzzy Multi-Objective Improved Kepler Optimizer Algorithms. Sci. Rep. 2024, 14, 13354. [Google Scholar] [CrossRef]
- Elseify, M.A.; SeyyedAbbasi, A.; Domínguez-García, J.L.; Kamel, S. Probabilistic Optimal Planning of Multiple Photovoltaics and Battery Energy Storage Systems in Distribution Networks: A Boosted Equilibrium Optimizer with Time-Variant Load Models. J. Energy Storage 2023, 73, 108986. [Google Scholar] [CrossRef]
- Shobha, M.; Datta, B. Multi-Objective Hybrid Optimal Algorithm for Distribution System Feeder Reconfiguration. In Decarbonisation and Digitization of the Energy System; Kumar, A., Singh, S.N., Kumar, P., Eds.; Springer Nature: Singapore, 2024; pp. 217–225. [Google Scholar]
- Hou, T.; Li, L. Multi-Objective Optimization of Distribution Network System with Energy Storage and Distributed Photovoltaic Considering Static Voltage Stability. In Proceedings of the 2023 IEEE 4th China International Youth Conference on Electrical Engineering (CIYCEE), Chengdu, China, 8–10 December 2023; pp. 1–6. [Google Scholar]
- Najafi, M.; Miveh, M.R. Stochastic Optimal Reconfiguration and Placement of Photovoltaic Systems in Distribution Networks: A Real Case Study. Int. J. Energy Res. 2024, 2024, 1244075. [Google Scholar] [CrossRef]
- Salam, I.U.; Yousif, M.; Numan, M.; Zeb, K.; Billah, M. Optimizing Distributed Generation Placement and Sizing in Distribution Systems: A Multi-Objective Analysis of Power Losses, Reliability, and Operational Constraints. Energies 2023, 16, 5907. [Google Scholar] [CrossRef]
- Alwash, S.; Ibrahim, S.; Abed, A.M. Distribution System Reconfiguration with Soft Open Point for Power Loss Reduction in Distribution Systems Based on Hybrid Water Cycle Algorithm. Energies 2022, 16, 199. [Google Scholar] [CrossRef]
- Patari, N.; Venkataramanan, V.; Srivastava, A.; Molzahn, D.K.; Li, N.; Annaswamy, A. Distributed Optimization in Distribution Systems: Use Cases, Limitations, and Research Needs. IEEE Trans. Power Syst. 2021, 37, 3469–3481. [Google Scholar] [CrossRef]
- de Oliveira, R.; de Oliveira, L.W.; de Oliveira, E.J. Optimization Approach for Planning Soft Open Points in a MV-Distribution System to Maximize the Hosting Capacity. Energies 2023, 16, 1035. [Google Scholar] [CrossRef]
- Dai, B. Multi-Objective Optimization Model of Distribution Network Reconfiguration Considering Soft Open Point. In Proceedings of the 2022 China International Conference on Electricity Distribution (CICED), Changsha, China, 7–8 September 2022; pp. 468–472. [Google Scholar]
- Saaklayen, M.A.; Shabbir, M.N.S.K.; Liang, X.; Faried, S.O.; Janbakhsh, M. A Novel Methodology for Optimal Allocation and Sizing of Soft Open Points in Distribution Networks. In Proceedings of the 2022 IEEE Industry Applications Society Annual Meeting (IAS), Detroit, MI, USA, 9–14 October 2022; pp. 1–8. [Google Scholar]
- Alanazi, A.; Alanazi, M.; Abdelaziz, A.Y.; Kotb, H.; Milyani, A.H.; Azhari, A.A. Stochastic Allocation of Photovoltaic Energy Resources in Distribution Systems Considering Uncertainties Using New Improved Meta-Heuristic Algorithm. Processes 2022, 10, 2179. [Google Scholar] [CrossRef]
- Nguyen, T.T.; Nguyen, T.T.; Viet Vo, C. Reconfiguration of Distribution Network Considering Photovoltaic System Placement Based on Metaheuristic Algorithms. In Advances in Artificial Intelligence for Renewable Energy Systems and Energy Autonomy; Springer: New York, NY, USA, 2023; pp. 135–156. [Google Scholar]
- Ntombela, M.; Kabeya, M.; Leoaneka, M.C. Artificial Intelligence Hybrid Algorithm for System Reconfiguration to Reduce Power Losses in the Distribution System. In Proceedings of the International Conference on Intelligent and Innovative Computing Applications, Balaclava, Mauritius, 8–9 December 2022; pp. 213–220. [Google Scholar]
- Morshed, K.A.; Ahmed, A. Optimal Planning of Multiple Renewable Energy-Integrated Distribution System with Uncertainties Using Artificial Hummingbird Algorithm. IEEE Access 2022, 10, 40716–40730. [Google Scholar]
- Chen, Y.; Yang, G.; Song, Z.; Sun, M.; Zhou, S. Optimal Configuration Method of Soft Open Point Considering Flexibility of Distribution System. In Proceedings of the 2022 IEEE 5th International Conference on Automation, Electronics and Electrical Engineering (AUTEEE), Shenyang, China, 18–20 November 2022; pp. 524–529. [Google Scholar]
- Farzamnia, A.; Marjani, S.; Galvani, S.; Kin, K.T.T. Optimal Allocation of Soft Open Point Devices in Renewable Energy Integrated Distribution Systems. IEEE Access 2022, 10, 9309–9320. [Google Scholar] [CrossRef]
- Souifi, H.; Abdallah, H.H. Optimal Distribution Network Reconfiguration Using Ant Lion Optimizer. In Proceedings of the 2022 IEEE 21st international Ccnference on Sciences and Techniques of Automatic Control and Computer Engineering (STA), Sousse, Tunisia, 19–21 December 2022; pp. 555–560. [Google Scholar]
- Nguyen, L.D.L.; Nguyen, P.K.; Vo, V.C.; Vo, N.D.; Nguyen, T.T.; Phan, T.M. Applications of Recent Metaheuristic Algorithms for Loss Reduction in Distribution Power Systems Considering Maximum Penetration of Photovoltaic Units. Int. Trans. Electr. Energy Syst. 2023, 2023, 9709608. [Google Scholar] [CrossRef]
- Leng, R.; Li, Z.; Xu, Y. A Comprehensive Literature Review for Optimal Planning of Distributed Energy Resources in Distribution Grids. In Proceedings of the 2022 IEEE PES Innovative Smart Grid Technologies—Asia (ISGT Asia), Singapore, 1–5 November 2022; pp. 369–373. [Google Scholar]
- Mahdavi, M.; Alhelou, H.H.; Bagheri, A.; Djokic, S.Z.; Ramos, R.A.V. A Comprehensive Review of Metaheuristic Methods for the Reconfiguration of Electric Power Distribution Systems and Comparison with a Novel Approach Based on Efficient Genetic Algorithm. IEEE Access 2021, 9, 122872–122906. [Google Scholar] [CrossRef]
- Sadnan, R.; Dubey, A. Distributed Optimization in Distribution Systems with Grid-Forming and Grid-Supporting Inverters. In Proceedings of the 2022 IEEE Power & Energy Society General Meeting (PESGM), Denver, CO, USA, 17–21 July 2022; pp. 1–5. [Google Scholar]
- Rezaeian-Marjani, S.; Galvani, S.; Talavat, V. A Generalized Probabilistic Multi-objective Method for Optimal Allocation of Soft Open Point (SOP) in Distribution Networks. IET Renew. Power Gener. 2022, 16, 1046–1072. [Google Scholar] [CrossRef]
- Saedi, A.; Abu Hanifah, M.S.; Hela Ladin, H.; Yusoff, S.H. Optimal Distribution Network Reconfiguration Using Multi-Objective Cuckoo Search Algorithm. IIUM Eng. J. 2022, 23, 114–124. [Google Scholar] [CrossRef]
- Nkc, H.; Inkollu, S.R.; Patil, R.; Janamala, V. Aquila Optimizer Based Optimal Allocation of Soft Open Points for Multi Objective Operation in Electric Vehicles Integrated Active Distribution Networks. Int. J. Intell. Eng. Syst. 2022, 15, 269–278. [Google Scholar]
- Akbari, M.A.; Zare, M.; Azizipanah-Abarghooee, R.; Mirjalili, S.; Deriche, M. The Cheetah Optimizer: A Nature-Inspired Metaheuristic Algorithm for Large-Scale Optimization Problems. Sci. Rep. 2022, 12, 10953. [Google Scholar] [CrossRef] [PubMed]
- Mirjalili, S.; Mirjalili, S.M.; Lewis, A. Grey Wolf Optimizer. Adv. Eng. Softw. 2014, 69, 46–61. [Google Scholar] [CrossRef]
- Abdelaziz, A.Y.; Mohamed, F.M.; Mekhamer, S.F.; Badr, M.A.L. Distribution System Reconfiguration Using a Modified Tabu Search Algorithm. Electr. Power Syst. Res. 2010, 80, 943–953. [Google Scholar] [CrossRef]
- Nguyen, T.T.; Truong, A.V.; Phung, T.A. A Novel Method Based on Adaptive Cuckoo Search for Optimal Network Reconfiguration and Distributed Generation Allocation in Distribution Network. Int. J. Electr. Power Energy Syst. 2016, 78, 801–815. [Google Scholar] [CrossRef]
- Dolatdar, E.; Soleymani, S.; Mozafari, B. A New Distribution Network Reconfiguration Approach Using a Tree Model. World Acad. Sci. Eng. Technol. Int. J. Comput. Electr. Autom. Control Inf. Eng. 2009, 3, 2480–2487. [Google Scholar]
Disclaimer/Publisher’s Note: The statements, opinions and data contained in all publications are solely those of the individual author(s) and contributor(s) and not of MDPI and/or the editor(s). MDPI and/or the editor(s) disclaim responsibility for any injury to people or property resulting from any ideas, methods, instructions or products referred to in the content. |
© 2025 by the authors. Licensee MDPI, Basel, Switzerland. This article is an open access article distributed under the terms and conditions of the Creative Commons Attribution (CC BY) license (https://creativecommons.org/licenses/by/4.0/).