Article

Prediction of circRNA–miRNA Interaction Using Graph Attention Network Based on Molecular Attributes and Biological Networks

by
Abdullah Almotilag
1,
Murtada K. Elbashir
1,*,
Mahmood A. Mahmood
1 and
Mohanad Mohammed
2
1
Department of Information Systems, College of Computer and Information Sciences, Jouf University, Sakaka 72441, Saudi Arabia
2
School of Mathematics, Statistics and Computer Science, University of KwaZulu-Natal, Pietermaritzburg 3209, South Africa
*
Author to whom correspondence should be addressed.
Processes 2025, 13(5), 1318; https://doi.org/10.3390/pr13051318
Submission received: 22 March 2025 / Revised: 19 April 2025 / Accepted: 21 April 2025 / Published: 25 April 2025
(This article belongs to the Special Issue Computational Biology Approaches to Genome and Protein Analyzes)

Abstract

:
(1) Background: Circular RNAs (circRNAs) are covalently closed single-stranded molecules that play crucial roles in gene regulation, while microRNAs (miRNAs), specifically mature microRNAs, are naturally occurring small molecules of non-coding RNA with 17-25-nucleotide sizes. Understanding circRNA–miRNA interactions (CMIs) can reveal new approaches for diagnosing and treating complex human diseases. (2) Methods: In this paper, we propose a novel approach for predicting CMIs based on a graph attention network (GAT). We utilized DNABERT to extract molecular features of the circRNA and miRNA sequences and role-based graph embeddings generated by Role2Vec to extract the CMI features. The GAT’s ability to learn complex node dependencies in biological networks provided enhanced performance over the existing methods and the traditional deep neural network models. (3) Results: Our simulation studies showed that our GAT model achieved accuracies of 0.8762 and 0.8837 on the CMI-9905 and CMI-9589, respectively. These accuracies were the highest among the other existing CMI prediction methods. Our GAT method also achieved the highest performance as measured by the precision, recall, F1-score, area under the receiver operating characteristic (AUROC) curve, and area under the precision–recall curve (AUPR). (4) Conclusions: These results reflect the GAT’s ability to capture the intricate relationships between circRNAs and miRNAs, thus offering an efficient computational approach for prioritizing potential interactions for experimental validation.

1. Introduction

circRNAs are a class of non-coding RNAs characterized by covalently closed-loop structures, which are integrated into the linear mRNAs of eukaryotic cells [1,2,3,4]. They are not methylated, they are not 5′ capped, and they do not contain the 3′ poly(A) tail [4,5,6]. The most important feature of circRNAs is that they are mostly formed in the nucleus through a mechanism known as back splicing [7]. circRNAs were initially described more than three decades ago and were considered as non-coding RNAs with no specific function, or even as products of random transcription or splicing mistakes [8]. High-throughput sequencing and bioinformatics studies have shown that these circRNAs have important functions in gene regulation processes, including transcription regulation and even protein synthesis in some instances [4,9,10,11]. This has changed the view of circRNAs as just transcriptional noise, but rather they are involved in multiple biological processes, such as cancer and other diseases [12,13]. microRNAs (miRNAs), specifically mature microRNAs, are naturally occurring small molecules of non-coding RNA with 17-25-nucleotide sizes [8,14,15]. They are significant post-transcriptional modulators of gene expression that affect target sites in messenger RNAs’ untranslated regions via direct base pairing [16]. Knowledge of circRNA–miRNA interactions (CMIs) can reveal new approaches for diagnosing and treating complex human diseases [17]. In CMI analysis, circRNA interacts with miRNA at a particular site called the miRNA response element (MRE) [9]. These MREs include sequences that can form a circRNA–miRNA complex. This interaction has been shown to be crucial in the process of gene regulation and is well illustrated in various biological phenomena, such as cancers [9]. This form of binding confers the ability of circRNAs to influence one or more miRNAs in an extensive array of downstream pathways. For instance, ciRS-7 is reported to interact with miR-7 and suppress the function of the latter, hence regulating the genes controlled by the latter [12,13,18].
Because of the scarcity of resources and materials, as well as manpower, it is practically impossible to carry out large-scale experiments to validate all the conceivable CMIs. Consequently, the use of computational methods to filter out the likely-to-interact CMIs in advance has become a standard strategy. These methods rely on an algorithm and model to predict the interactions based on prior knowledge, and it helps to down-sample the experiment space by offering a smaller list of potential candidates for validation in a wet laboratory. This synergism of computation and experiment conductively augments the discovery and identification of CMIs, enabling more purposeful and cost-effective study [9].
In the biomedical field, computational models for predicting associations between various entities, such as genes, proteins, microRNAs, and diseases, are becoming increasingly common [19,20,21,22]. These models leverage large datasets, including genomic, proteomic, and transcriptomic data, to infer potential interactions or associations. They rely on machine learning algorithms, statistical methods, and network-based approaches to predict these relationships, which can then be experimentally validated in the lab. While prediction models for CMIs are gaining attention, this field is still relatively underexplored compared to other areas of biomedical research. Most existing models for predicting CMIs rely on the nearest-neighbor relationship in biological networks [9,12]. These approaches assume that circRNAs and miRNAs that are close to each other in a biological network, such as a protein–protein interaction network or a regulatory network, are more likely to interact.
By using various computing methods, including advanced artificial intelligence and machine learning, as well as deep learning approaches, there are several approaches that have been proposed for the prediction of CMIs [23]. The deep learning-based methods include KGDCMI introduced by Wang X-F et al. [17] and WSCD by Guo L-X et al. [24]. KGDCMI employs a deep neural network technique to predict CMIs by fusing multi-source information through a deep neural network. On the other hand, WSCD employs Word2vec, structural deep network embedding (SDNE), convolutional neural networks (CNNs), and deep neural networks (DNNs) to extract and fuse both attribute and behavioral features for CMI predictions. Also, there are several graph-based deep learning methods that have been proposed for CMI prediction. These methods include SGCNCMI by Yu C-Q et al. [25] and GCNCMI by He J et al. [26], which are based on graph convolutional networks (GCNs). SGCNCMI utilizes GCNs to identify CMIs with the help of node similarity, while GCNCMI utilizes node information by employing graph convolutional layers and integrating embedded representations for more accurate predictions. When it comes to methods that use boosting techniques, the authors Qian Y et al. [27] introduced CMASG and Wang X-F et al. [28] also proposed BioDGW-CMI. CMASG uses GNNs to learn node and feature representations and singular value decomposition (SVD) for feature extraction while a light gradient boosting machine (LightGBM) is used for the final prediction. In the same manner, BioDGW-CMI combines bio-text mining using BioBERT with a heat wavelet diffusion pattern analysis for node embedding, with LightGBM for realistic predictions. These models are based on learning latent biology and incorporation of thin and complex network representations. The most recent development, namely, BEROLECMI [9], introduces a new technique whereby CMI is predicted by presenting the role attributes of a molecule. This model uses bidirectional encoder representations from DNABERT [29], a transformer-based model for DNA sequences, to extract molecular attribute features. It employs Gaussian and sigmoid kernel functions to construct self-similarity networks and utilizes a sparse autoencoder (SAE) to learn high-level representations. It additionally extracts role similarity from the CMI network and combines all these features for prediction purposes. In the case of CMI pairs, BEROLECMI used LightGBM for final prediction and was able to predict 14 out of 15 CMI pairs and outperformed other models on common datasets. Further, KS-CMI introduced by Wang X-F et al. [30] and JSNDCMI by Wang X-F et al. [31] combine boosting approach with feature extraction techniques. KS-CMI realizes feature representation improvement in circRNA–miRNA–cancer networks by employing a CatBoost classifier and a denoising autoencoder (DAE). However, JSNDCMI combines the functional and topological structure similarities with a gradient boosting decision tree (GBDT) classifier to support the identification of CMIs in sparse networks. The existing studies on CMI prediction like BEROLECMI have contributed significantly to the development of CMI prediction using molecular characteristics and biological networks. However, most of these models are mainly based on conventional machine learning approaches or boosting schemes which may not effectively characterize the relationships and dependencies of the nodes within the biological networks. Furthermore, feature fusion methods are not designed to make full use of graph-based structural information.
In this paper, we used molecular attributes, self-similarity networks, and role-based network embeddings to determine the interaction between circRNA and miRNA. We constructed a graph attention network (GAT), which models the intricate relationships between circRNA and miRNA nodes within a biological interaction network. This is inspired by the fact that GAT can capture the intricate dependencies between nodes in a graph using attention mechanisms that help it filter out the most salient interactions in the context of the circRNA–miRNA biological graph. In contrast to the traditional classifiers, the GAT model can efficiently distinguish between the structural and functional properties of nodes in the network by imposing various degrees of attention weights on the neighboring nodes. This allows the model to not only include local topology information but also distinguish between the types of molecular interactions, thus making the predictions more accurate. The results obtained show that our GAT model significantly outperforms the existing CMI prediction methods, providing an effective approach to address the complexities inherent in biological networks.
The key contributions of our study are as follows:
  • We proposed a novel approach based on GAT which can utilize the attention mechanism to model the complex dependencies in the biological network for CMI predictions.
  • The role-based graph embeddings generated using Role2Vec are used as graph structures for the GAT model.
  • Our proposed GAT method obtained state-of-the-art performance, surpassing the existing models like BEROLECMI and KS-CMI based on the performance metrics accuracy, precision, recall, F1-score, AUROC, and AUPR.
Our GAT approach is different from the existing methods in that it utilizes the known interaction data to perform two tasks: first, it generates the RNA feature based on role definition through Role2Vec, and then it guides the graph attention network (GAT) through its graph structure input. The GAT model processes biologically meaningful graph data consisting of circRNA and miRNA nodes. This enables our model to capitalize on the interaction network to produce features and construct the structural framework which enhances biological interpretation during predictions.

2. Materials and Methods

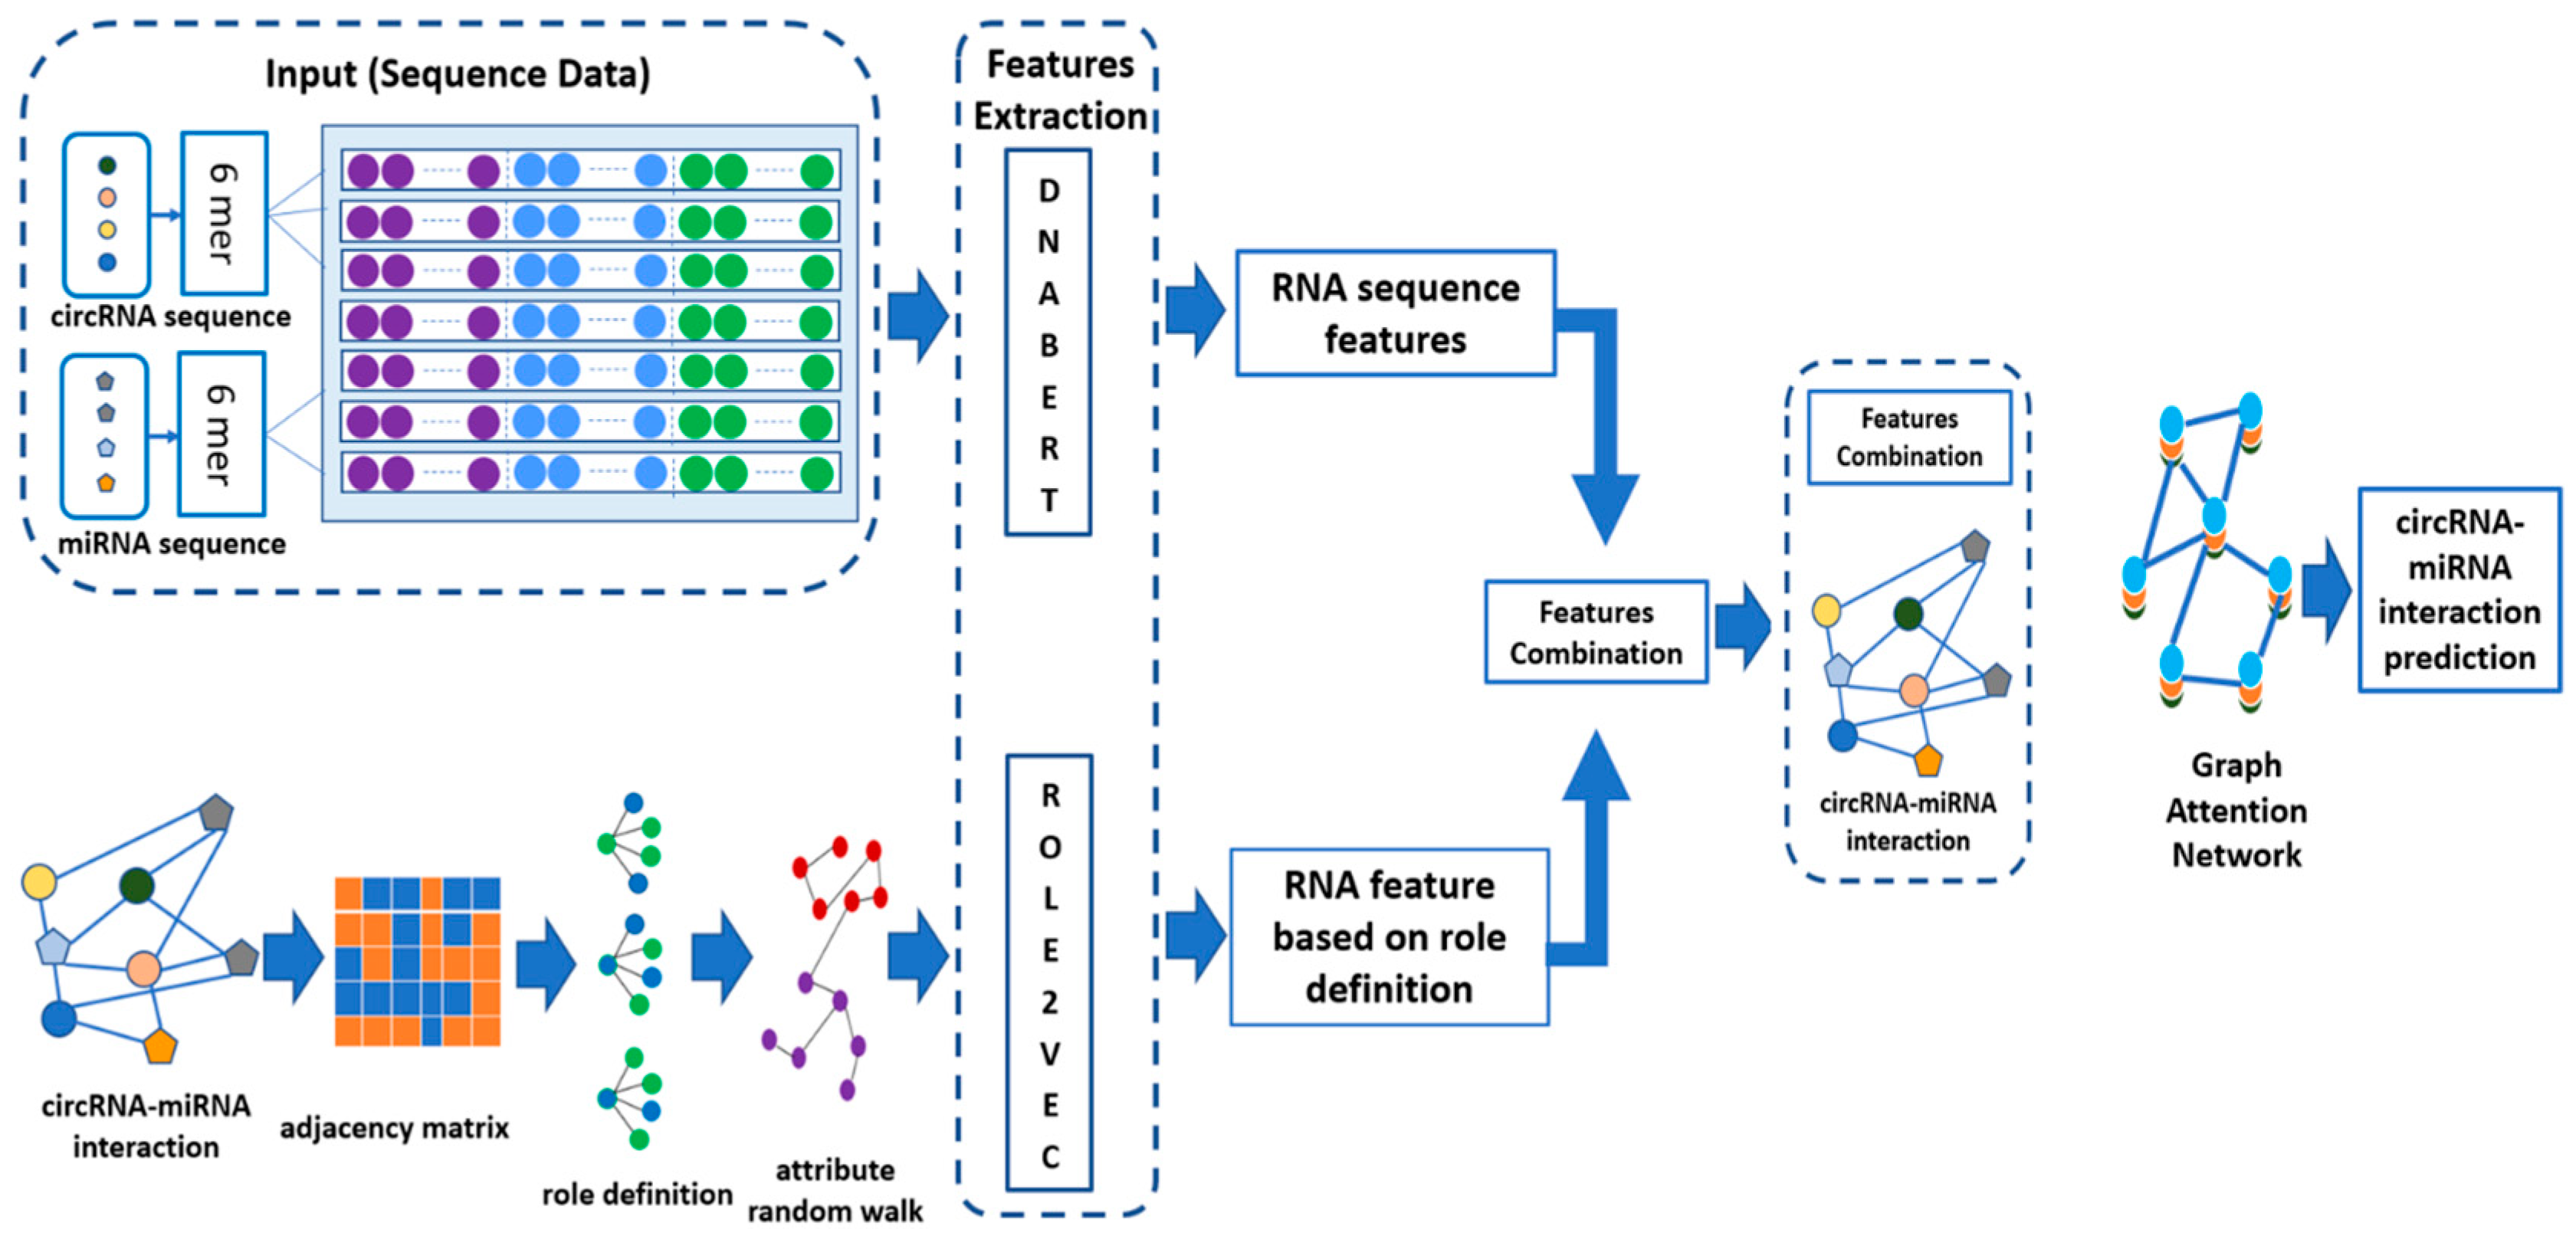
The approach described in this study combines the sequence of circRNAs and miRNAs and their molecular structures to predict circRNA–miRNA interaction using the GAT model. As illustrated in Figure 1 below, the circRNA and miRNA sequences are first passed through DNABERT [29], which is used to extract RNA sequence features utilizing 6-mer encoding. In 6-mer encoding, each RNA sequence is fragmented into smaller units, which are subsequences of 6 nucleotides. A DNABERT tokenizer is then employed to convert these 6-mer fragments into high-dimensional feature representations by passing them through a pre-trained DNABERT model. These features are then integrated with the structural role-based features obtained using the method Role2Vec, which is a graph embedding approach that captures the topological data extracted from the interaction network based on an adjacency matrix. This adjacency matrix reveals the known CMIs. To construct the negative samples, we used random sampling in which we generated all the possible combinations of circRNA and miRNA pairs via Cartesian products. We removed the interacting pairs that are found in the CMI dataset, and the remaining pairs were considered as negative samples. The feature vectors concatenate each individual RNA sequence and the corresponding role-based feature. These feature vectors are fed into the GAT model that takes graph structure into account and learns complicated relationships between circRNAs and miRNAs. By examining the features of the CMI lists, the constructed GAT model can focus on the relevant features and optimize the attention mechanism for the interaction patterns of new potential CMIs. This approach, assessed by five-fold cross-validation, shows that enriching interaction features with graph structure information improves the prediction.

2.1. Datasets

In this study, we utilized two key datasets: CMI-9905 and CMI-9589 [17,31]. CMI-9905 contains 9905 circRNA–miRNA interactions including 2346 circRNAs and 962 miRNAs, and it is based on high-confidence interaction data. CMI-9905 is one of the largest and most used benchmarks for CMI prediction because of its broad coverage and experimental validation. CMI-9589 has 9589 interacting pairs of 2115 circRNAs and 821 miRNAs downloaded from the circBank database [32], which is another benchmark for assessing the generalizability of models in different biological settings. These datasets can be used to assess the performance of circRNA–miRNA prediction models that are well established with strict benchmarks and proven to be effective in various situations.

2.2. Features Extraction Using DNABERT for circRNA and miRNA Sequences

In this paper, we employed DNABERT, a BERT model for DNA sequences pre-trained on GENCODE, to extract features from both circRNA and miRNA sequences [33]. The circRNA and miRNA sequence files were downloaded from https://github.com/1axin (accessed on 18 August 2024) [9]. The first step in the methodology involves breaking down each e circRNA and miRNA sequence into 6-base pairs known as 6-mers with a sliding window of length 6. This results in each sequence becoming part of a set of overlapping 6-mer subsequences, wherein the subsequences are tokenized and passed to the DNABERT model. The 6-mer subsequences were then passed through the DNABERT tokenizer which converts them to inputs that the model can process. These tokens are then input into the DNABERT model, which outputs embedding vectors that represent each 6-mer fragment based on the number of hidden units in the model’s architecture. The means of these embeddings are then calculated to generate a feature vector for each sequence. After the feature vectors of the sequences have been obtained, they are made into vectors of equal sizes and then stacked into a single array for input. These are then stored in an h5 file for future use in downstream analysis. This process takes advantage of DNABERT to capture the inherent relations within its circRNA/miRNA sequences which helps in improving the reliability of any predictions/analysis made on extracted features.

2.3. Role-Based Graph Embeddings (Role2Vec)

Role2Vec is a graph embedding approach for learning the structural roles of nodes in a network by contrast with node centrality [34,35,36]. With an aim of capturing proximal relationships that are more focused, Role2Vec learns the embeddings of nodes that contribute to and exercise the functional roles within a graph such as hubs, bridges, or more commonly, articulation points, which are paramount in cases where node roles are more important than their connectivity. The method makes use of a random walk strategy, which received much attention in learning network embeddings [37,38]. Instead of relying on the nodes in the immediate neighborhood to convey information about the node, the random walk strategy gathers information about the nodes that play similar structural roles in different parts of the graph. This is based on the Markov process where the probability of moving from one node to another depends on the node at current and on the chosen walk. The equation to derive this probability is as follows [34]:
P v t + 1 v t = w ( v t , v t + 1 ) v N ( v t ) w ( v t , v )
where N v t is the neighbor of node v t , and w v t , v t + 1 is the weight of the edge that links node v t and v t + 1 .
These walks are then employed to further train a skip-gram model with the aim of acquiring the node representation. The objective function of the skip-gram model is to maximize the log-probability of the context nodes v t w , …., v t + w and it can be given by the following equation [30].
  m a x t w j w ,   j 0 l o g P v t + 1 v t  
Here, w represents the window size, defining the size of the context around the target node. By integrating the random walk with the skip-gram model, the goal of Role2Vec is to bring similar nodes together in the embedding space. This can be expressed as follows:
m a x ( u , v ) D l o g P v u
P v u represents the probability of node v appearing in the context of node u and D is the set of node pairs generated by the random walks.
This approach helps in generalizing the node roles present across various networks and improves Role2Vec when used in applications such as link prediction roles, identification of roles, and combined transfer learning in various networks. Role2Vec is, thus, useful in tasks where it is important to identify node functions or jobs instead of just connections.

2.4. Graph Attention Network

GATs are an extension of graph neural networks (GNNs) where nodes and their generated features incorporate attention coefficients that decide the importance of each neighboring node to modify the model’s flexibility for capturing the structure of graph-structured data [39,40,41,42]. This attention mechanism may filter out the neighboring nodes that are most important to GATs during the feature aggregation stage, which is important to obtain significant node representations. For each node v , the feature vector h i j R F (with F features) is first linearly transformed by a shared weight matrix w R F × F , resulting in a new representation h v = W h i j . After that, the attention mechanism calculates the weight (attention score) assigned to each of the neighboring node u by applying a shared attention function to the transformed features of each pair of nodes (u and v) in the neighborhood. Using a self-attention mechanism, the model computes unnormalized attention weights for each edge, reflecting the relevance of the connection between nodes. The equation that computes the attention score is as follows [43]:
                        e u v = L e a k y R e L U a T W h v   W h u
These raw scores are then normalized, in proportion to all neighbors of the target node, using a softmax function to produce the attention coefficients. The softmax function across all the neighbors of node i is as follows [41]:
α i j = e x p e i j k N ( i ) e x p e i k
The last node representation is then obtained by summing the neighbors’ features, but the weights are given by the attention coefficients. This architecture makes GATs more capable of adapting to the local structure of the graph as compared to the traditional GNNs.
The GAT demonstrates superior benefits over GCNs when it comes to modeling circRNA–miRNA interactions. All the traditional GCNs conduct neighborhood information aggregation through uniform weight systems without considering different network interaction strengths. The attention mechanism within GAT enables the model to determine customizable weights for each neighbor, thus permitting it to concentrate on crucial nodes. The capability serves essential purposes when studying biological graphs that contain functional interactions of differing significance.

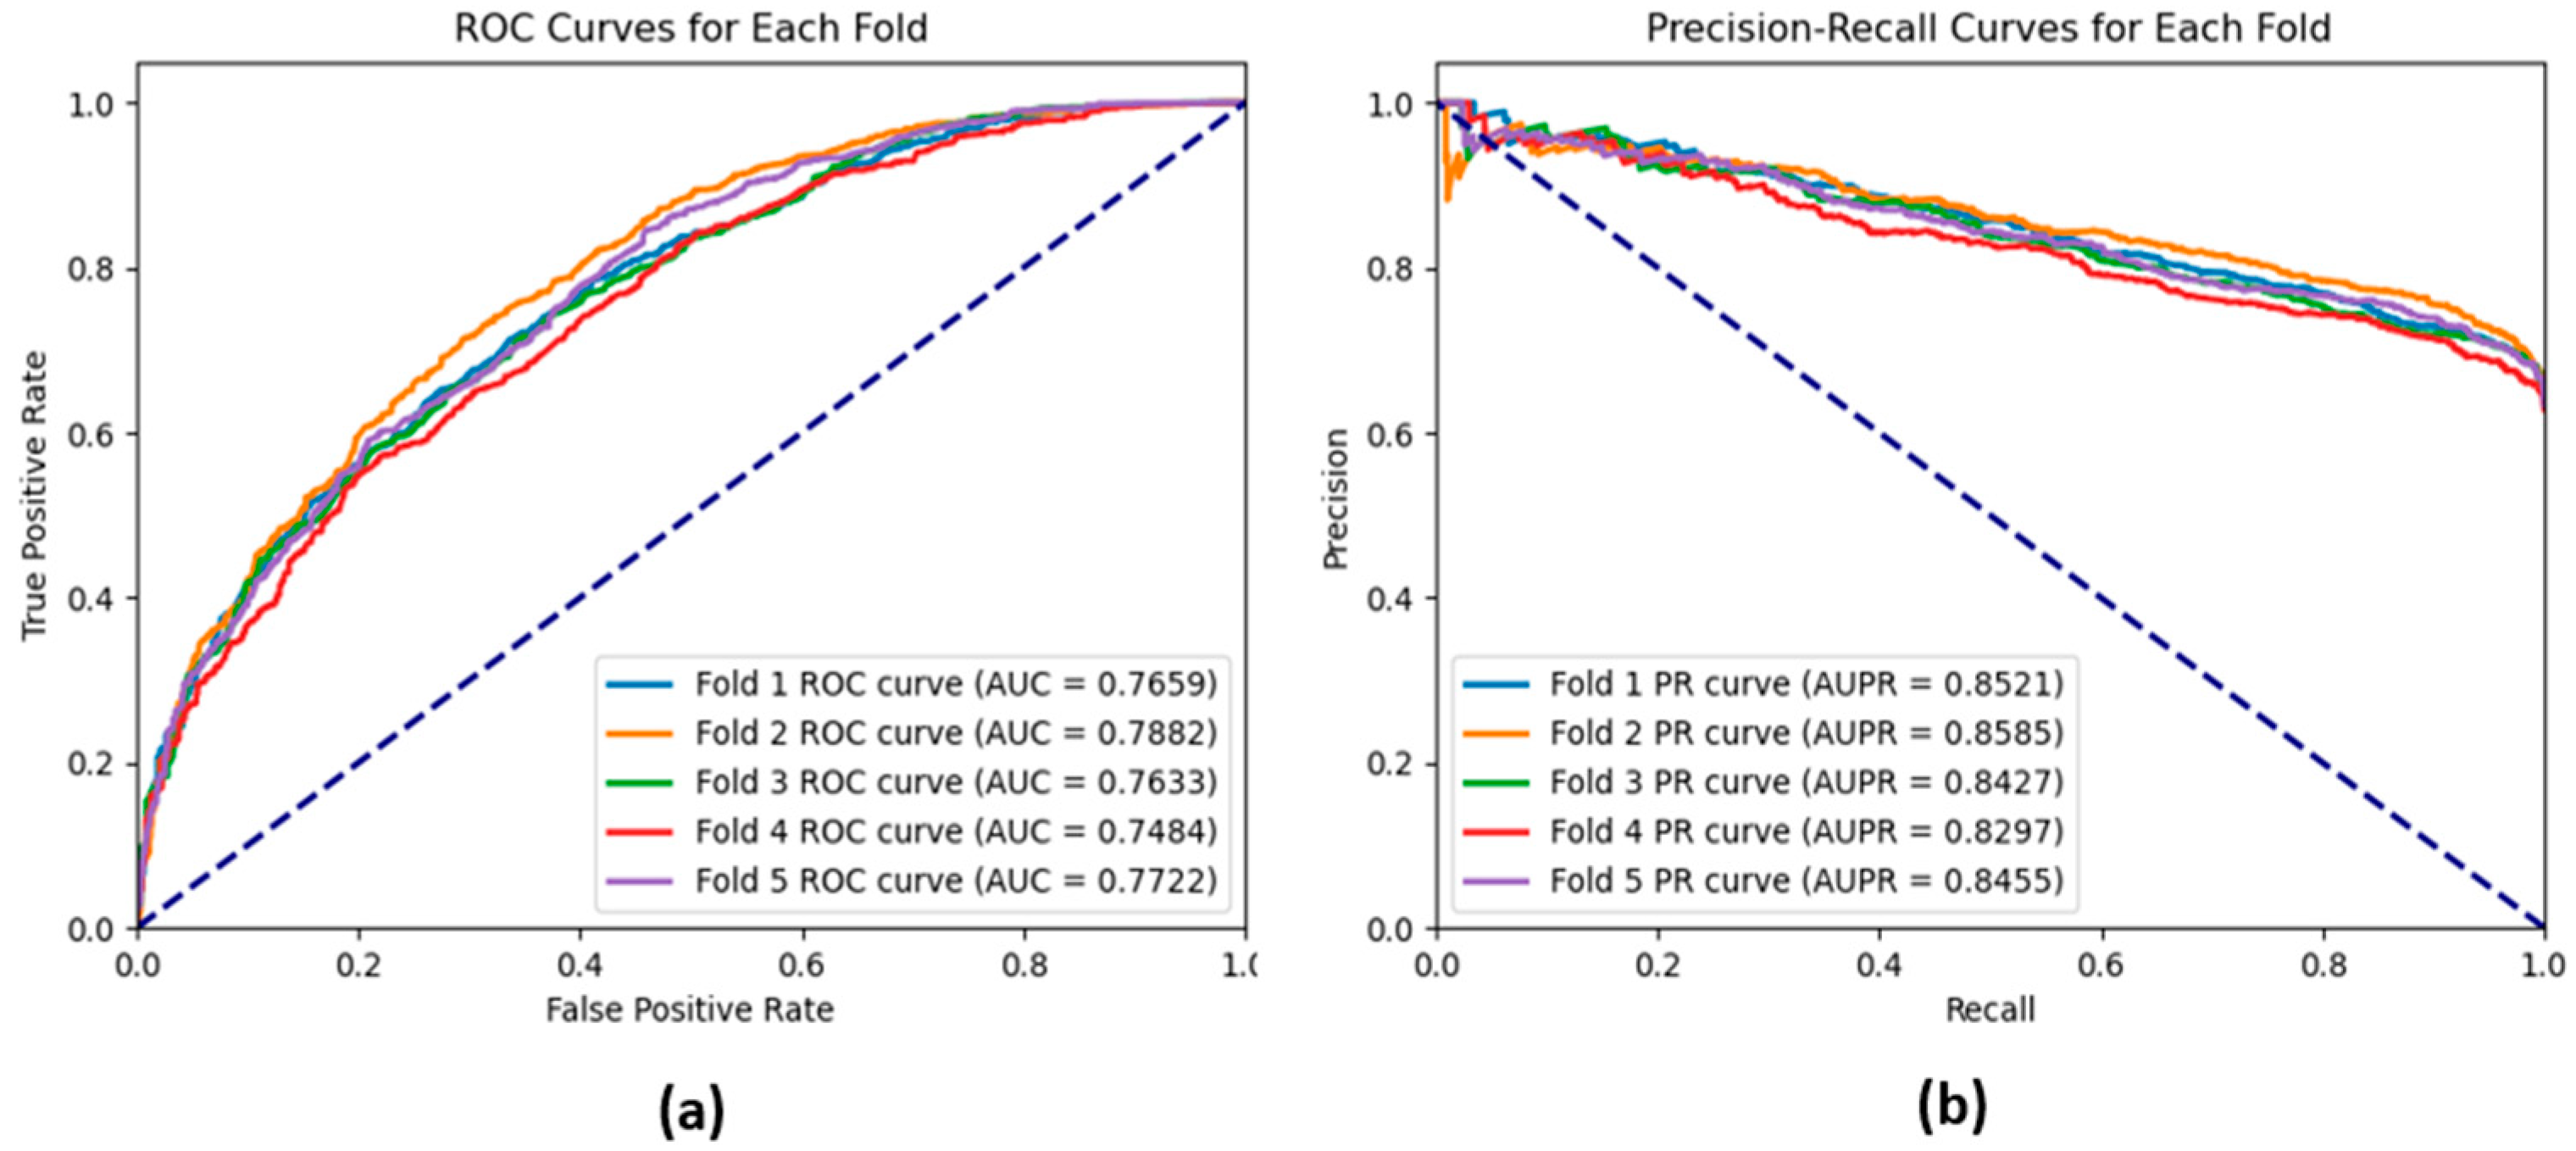
2.5. Performance Measures

We used the evaluation metrics accuracy, precision, recall, and F1-score to evaluate the performance of our GAT model based on five-fold cross-validation [44]. These performance metrics are calculated using the following values: true positive (TP), which refers to the positive instances that are correctly classified as positive; true negative (TN), which refers to the negative instances that are correctly classified as negative; false positive (FP), which refers to the negative instances that are incorrectly classified as positive; and false negative (FN), which refers to the positive instances that are incorrectly classified as negative.
Accuracy is one of the most widely used metrics that is defined as the percentage of correctly classified instances [45,46,47] and can be calculated as follows:
A c c u r a c y = T P + T N T P + T N + F P + F N  
Precision measures the proportion of correctly predicted positive instances to the total number of instances predicted as positive and thus, how often the proposed model is right with its positive predictions, and it can be calculated as follows:
P r e c i s i o n = T P T P + F P  
Recall is the ratio of correctly predicted positive instances to the total number of actual positive instances emphasizing the model’s ability to identify all the relevant positive cases. It can be calculated as follows:
R e c a l l = T P T P + F N
Since precision and recall as the two measures are not solely sufficient for providing results, the F1-score is, therefore, calculated as the harmonic mean of those two in order to obtain a single value that enhances the two. F1-score can be calculated as follows:
F 1 - S c o r e = 2 × P r e c i s i o n × R e c a l l P r e c i s i o n + R e c a l l
In addition to the performance measures, we use the area under the receiver operating characteristics (AUROC), which is considered a threshold-independent measure. The ROC curve compares the true positive against the false positive. It has a value between 0.5, which reflects the random guess classification, to 1, which means high classification quality. This metric is especially relevant for the binary classification problem when the classes are almost equiproportional. Also, we used the area under the precision–recall curve (AUPR) which focuses on the trade-off between precision and recall. AUPR is especially important when the classes are not equiproportional; therefore, it reflects the model in predicting the minority class without being influenced by the majority class.

3. Results and Discussion

3.1. Feature Distribution and Similarity Analysis of circRNA and miRNA Data

The histograms in Figure 2 provide information regarding the distribution of the features identified from circRNA and miRNA sequences by DNABERT. The distribution of the circRNA feature (Figure 2a) shows that it has equal variation across the dataset represented by a ‘normal curve’ with values ranging from −2 to 2 with most of the values being around the mean. This distribution shows that circRNA features appear to have good variability which is crucial for distinguishing between relevant biological patterns. On the other hand, the distribution of the miRNA feature (Figure 2b) is concentrated around −0.5 with the majority of values centered on this zone. This implies that the miRNA feature has a different distribution compared to circRNA, which might be due to biological differences in miRNA data. This indicates that the features of both circRNA and miRNA may play unique roles in predicting circRNA–miRNA interaction.
Figure 3 shows the cosine similarity matrix points which show the relationship between circRNA and miRNA features that are extracted using DNABERT. Each box in the heatmap shows the similarity between two corresponding feature vectors of circRNA and miRNA, higher similarity is represented in yellow, while lower similarity appears in purple. This matrix represents an effective method for postulating potential biological interactions between circRNAs and miRNAs. These results may suggest functional associations or regulatory connections are more likely between pairs of genes with a higher cosine similarity as having more similar features might mean that they participate in similar roles regulating genes or subgroups of genes. The varying degrees of similarity in the heatmap highlight the complex and diverse nature of CMIs.
The circRNA and miRNA features were also plotted using t-Distributed Stochastic Neighbor Embedding (t-SNE) and are presented in Figure 4. In the plot, the circRNA is represented in blue, while the miRNA is shown in orange. The figure also demonstrates that the two types of features partially overlap, highlighted by the fact that miRNA features are located on the right side of the figure and separated from the circRNA features. This raises the possibility that there are inherent differences in the feature representations of circRNA and miRNA, which can contribute to interaction prediction.

3.2. Model Evalution

Our model is evaluated on two datasets that are commonly used for the evaluation of CMI prediction. These datasets are the CMI-9905 and the CMI-9589 datasets. Wang et al. [17] compiled the CMI-9905 dataset, which comprised 9905 interactions between 2346 circRNA and 962 miRNAs. The CMI-9905 dataset, which has a high degree of confidence in its CMI, is used as a benchmark by Wang, XF et al. study [9].
We used grid search to adjust our model hyper-parameters prior to training. The parameter values that yield optimal performance are chosen to be employed with our built model. Our objective is to build a model that can effectively generalize to unseen data. Table 1 lists the hyper-parameters that produce the best results along with the outcomes they produced based on accuracy and F1-score.
Table 1 shows that the Learning Rate (LR.), Weight Decay (WD.), Dropout (DO.), Hidden Channel (HC.), and Number of Head (NH.) of 0.005, 0.0001, 0.3, 64, and 2, respectively, yielded high accuracy (acc.) and F1-score, and these values are used to build our GAT model.
Figure 5 and Figure 6 show the model’s test and training accuracies and loss curves, respectively, based on the CMI-9905 dataset. These figures demonstrate that our model’s accuracy will increase with the number of training epochs it completes. At an accuracy of over 0.87, both the test and training accuracies stabilize, indicating that it has excellent generalization capabilities when predicting unknown data.
The performance of our GAT model based on five-fold cross-validation on the CMI-9905 dataset is presented in Table 2. The model achieves an average accuracy of 0.8762, precision of 0.9007, and recall of 0.9056, indicating strong performance in accurately recognizing CMIs while maintaining a good balance between precision and recall as demonstrated by the relatively high F1-score of 0.9031. Moreover, the model provides a relatively high average AUROC of 0.9500, which means that the model can have a high separation rate between real and fake interactions. This is evident by the ROC curve shown in Figure 7a, which demonstrates the True Positive Rate (TPR) against the False Positive Rate (FPR) across the different threshold levels that indicate how accurately the model separates between real interactions (positive class) and fake interactions (negative class). Also, the result reveals that the model achieves an AUPR of 0.9729. The precision–recall curves shown in Figure 7b also illustrate that the GAT model yields exceptional performance results, with high precision and recall scores recognized on all five folds. Small standard deviations of all these measures further support the stability and applicability of the GAT model as a highly suitable tool to predict CMIs.
Table 3 shows the performance obtained using the GAT model on the CMI-9589 dataset using five-fold cross-validation. As depicted in the table, the GAT model consistently achieved high performance based on the performance measures: accuracy, precision, recall, F1-score, AUROC, and AUPR. The accuracy varies within the range of 0.8722 to 0.8894 with an average accuracy of 0.8837; the standard deviation of 0.0060 indicates the stability of the model’s performance. Similarly to accuracy, precision, recall, and F1-score vary only slightly between folds with the mean values of 0.9065, 0.9188, and 0.9126, respectively, this means that the model keeps a good balance of false positives and true positives. The obtained high AUROC average equals 0.9533, and the AUPR average equals 0.9767, proving that the model possesses high discriminative power. The low standard deviations for all the analyzed metrics indicate the reliability and robustness of the model. These results provide a perspective on the suitability and efficiency of the proposed GAT model for predicting the CMIs. The ROC and the precision–recall curves shown in Figure 8a, b also illustrate that the GAT model yields exceptional performance results.

3.3. Comparison with the Traditional Deep Neural Network Models

Table 4 shows the performance of the traditional deep neural network model (DNN) on CMI prediction. From the results in the table, our GAT model demonstrates superior performance compared to the traditional DNN method. The performance obtained with the GAT model emphasizes its ability to leverage the graph-based structure of the data. The GAT model outperformed the traditional DNN model consistently across all the performance metrics where it achieves higher accuracy (0.8762 vs. 0.7155), precision (0.9007 vs. 0.7470), recall (0.9056 vs. 0.8442), F1-score (0.9031 vs. 0.7902), AUROC (0.9500 vs. 0.7676), and AUPR (0.9729 vs. 0.8457). The results also demonstrate the GAT model’s ability to capture the topological relationship of circRNA and thmiRNA interactions, which is overlooked by the traditional deep learning method. The utilization of the graph structure together with the attention mechanism enabled the GAT model to learn the importance of different features in determining the interactions and thus providing an accurate context-aware prediction. This emphasizes the importance of using graph-based models in biological network analysis such as CMI prediction.
The ROC and the precision–recall curves shown in Figure 9a, b are obtained using the traditional deep learning model. These figures also reflect the ability of the GAT model to provide accurate results compared to the traditional deep learning model.

3.4. Comparison with the Existing CMI Prediction Methods

Table 5 shows the performance of the GAT method on the CMI-9905 and CMI-9589 datasets compared to the other prediction methods based on accuracy, precision, recall, and F1-score. The table shows clearly that our GAT method outperformed the existing prediction methods. Our GAT method obtained an accuracy, precision, recall, and F1-score of 0.8762, 0.9007, 0.9056, and 0.9031, respectively, on the CMI-9905 dataset. Our obtained performance is superior compared to the best existing method, BEROLECMI, on the CMI-9905 dataset, which obtained an accuracy, precision, recall, and F1-score of 0.8395, 0.8427, 0.8396, and 0.8392, respectively, on the CMI-9905 dataset. Additionally, on the CMI-9589 dataset, our model demonstrated superior results with accuracy, precision, recall, and F1-score of 0.8837, 0.9065, 0.9188, and 0.9126, respectively, further surpassing the performance of BEROLECMI, which obtained accuracy, precision, recall, and F1-score of 0.8777, 0.8799, 0.8778, and 0.8776, respectively, on the CMI-9589 dataset.

3.5. Comparison with the Existing CMI Prediction Methods Based on AUROC and AUPR

Table 6 shows the performance of the GAT model on the CMI-9905 and CMI-9589 datasets compared to other CMI prediction models based on AUROC and AUPR performance metrics. It is obvious that the proposed GAT model performs the best meaning that it can model CMI more accurately compared to the existing methods. In the CMI-9905 dataset, the GAT model obtained an AUROC of 0.9500 and AUPR of 0.9729, both surpassing the KS-CMI model which obtained an AUROC and AUPR of 0.9144 and 0.9086, respectively. The same is also reflected in the CMI-9589 dataset; the GAT model yields the highest value AUROC of 0.9533 and AUPR of 0.9767. This comparison reflects the robustness of the GAT model and its enhanced capability to predict CMI more accurately than other existing methods.

3.6. Case Study

We conducted a case study using the CMI-753 dataset to confirm our model’s performance. The circR-2Cancer database is the source of the CMI-753 dataset [49]. The most recent version of the data showed 753 CMIs between 515 circRNA and 469 miRNA after rigorous filtering and processing, all of which are supported by experiments [9]. In this study, we utilized the CMI-753 dataset for training our proposed model and subsequently tested it on a separate test set extracted from the same dataset. After obtaining the predictions, we selected the top 10 highest-scoring predicted positive interactions and verified their validity against the existing literature. The results of this evaluation are presented in Table 7.
We reviewed the literature to further assess the biological relevance of our model. Table 7 shows that nine out of the top ten highest-scoring predicted positive interactions were validated by PubMed. Although biological experiments did not validate the interaction between the pair (circ2174 and miR-149), it is undeniable that they might interact. Notably, PMID: 29709702 confirmed that circ-PDE8A functions as a circular RNA molecule that promotes cancer growth in pancreatic ductal adenocarcinoma (PDAC). It shows that circ-PDE8A reaches high expression levels in liver-metastatic PDAC cells and is associated with patients exhibiting advanced TNM stage and lymphatic spread and reduced prognoses. The function of circ-PDE8A includes playing the role of a competing endogenous RNA (ceRNA) which acts by sequestering miR-338 to affect the expression levels of MACC1 which enables invasive tumor growth. The interaction between CircMTO1 and miR-9 has been analyzed extensively (PMID: 28520103) because CircMTO1 contributes to hepatocellular carcinoma suppression through miR-9 interaction. This reflects that our model-based predictions receive strength from biological evidence which proves the value of GAT-based analysis for identifying essential circRNA–miRNA functional interactions.

3.7. Potential Applications

Our GAT-based model can demonstrate wide practical use across multiple biomedical research organizations. This approach enables researchers to select high-confidence interaction candidates which leads to decreased expenses and time needed for conducting experimental laboratory tests. The predictive model can enable researchers to identify new disease biomarkers, especially for cancers due to their established regulatory roles in circRNA and miRNA interactions [50]. The combination of circRNAs and miRNAs provides potential biomarkers for diagnosis and prognosis because these molecules demonstrate high stability and specificity as well as endogenous RNA functions. The model can also be applied in drug development because it reveals circRNA–miRNA pathways that control gene expression to identify optimal drug targets [51]. Scientists are rapidly advocating these pathways as therapeutic targets because they help combat multiple drug resistance in cancer treatment. Through the identification of significant interactions, the model can help researchers find suitable candidate RNAs for targeted therapies alongside designing RNA-based drugs and developing clinical strategies for drug response prediction and personalized medicine.

4. Conclusions

circRNAs and miRNAs play critical roles in gene regulation, and they have an association with various diseases, including cancer. circRNA–miRNA interaction (CMI) prediction can provide researchers with insights into disease mechanisms and uncover potential therapeutic targets. In this paper, we propose a novel approach for predicting CMI using a graph attention network (GAT). The utilized features are extracted from circRNA and miRNA sequences using DNABERT. Also, we extracted CMI features using Role2Vec. The GAT model leverages attention mechanisms and CMI graph structure to learn complex node dependencies in CMI networks. Our approach outperformed both the traditional deep neural networks and existing CMI prediction methods. We evaluated our model using the commonly used datasets CMI-9905 and CMI-9589. It achieved accuracies of 0.8762 and 0.8837 on the CMI-9905 and CMI-9589 datasets, respectively. The precision, recall, F1-score, AUROC, and AUPR achieved by our model on the benchmark dataset (CMI-9905) are 0.9007, 0.9056, 0.9031, 0.9500, and 0.9729, respectively. These values are the highest compared to the existing CMI prediction methods.
Nevertheless, our approach has limitations and directions for future development. The high-quality datasets, including CMI-9905 and CMI-9589, limit their applicability to diverse biological contexts. In future work, building an efficiently extensible theoretical model and an easily accessible interface can enhance usability and enable scientists to predict and validate CMIs from various sets of data and in various diseases.

Author Contributions

M.K.E. computed the features, generated the prediction model, performed experimental comparison, and drafted the manuscript; M.M. downloaded the data and performed all the necessary preprocessing; M.M., A.A. and M.A.M. participated in the design of the study and helped to draft the manuscript. All authors have read and agreed to the published version of the manuscript.

Funding

This work was funded by the Deanship of Graduate Studies and Scientific Research at Jouf University under grant No. (DGSSR-2023-02-02479).

Data Availability Statement

The used data and the prediction model’s code are available in the link (https://github.com/murtadaBashir/CMImodeldataandcod).

Acknowledgments

The authors would like to acknowledge the Deanship of Graduate Studies and Scientific Research at Jouf University for their invaluable support and funding of this research work.

Conflicts of Interest

The authors declare no conflicts of interest. The funders had no role in the design of the study; in the collection, analyses, or interpretation of data; in the writing of the manuscript; or in the decision to publish the results.

References

  1. Memczak, S.; Jens, M.; Elefsinioti, A.; Torti, F.; Krueger, J.; Rybak, A.; Maier, L.; Mackowiak, S.D.; Gregersen, L.H.; Munschauer, M.; et al. Circular RNAs are a large class of animal RNAs with regulatory potency. Nature 2013, 495, 333–338. [Google Scholar] [CrossRef]
  2. Salzman, J.; Gawad, C.; Wang, P.L.; Lacayo, N.; Brown, P.O. Circular RNAs Are the Predominant Transcript Isoform from Hundreds of Human Genes in Diverse Cell Types. PLoS ONE 2012, 7, e30733. [Google Scholar] [CrossRef] [PubMed]
  3. Chen, L.-L.; Yang, L. Regulation of circRNA biogenesis. RNA Biol. 2015, 12, 381–388. [Google Scholar] [CrossRef] [PubMed]
  4. Chen, L.-L. The expanding regulatory mechanisms and cellular functions of circular RNAs. Nat. Rev. Mol. Cell Biol. 2020, 21, 475–490. [Google Scholar] [CrossRef]
  5. Tang, M.; Lv, Y. The Role of N6-Methyladenosine Modified Circular RNA in Pathophysiological Processes. Int. J. Biol. Sci. 2021, 17, 2262–2277. [Google Scholar] [CrossRef] [PubMed]
  6. Jeck, W.R.; Sharpless, N.E. Detecting and characterizing circular RNAs. Nat. Biotechnol. 2014, 32, 453–461. [Google Scholar] [CrossRef]
  7. Hwang, H.J.; Kim, Y.K. Molecular mechanisms of circular RNA translation. Exp. Mol. Med. 2024, 56, 1272–1280. [Google Scholar] [CrossRef]
  8. Hsu, M.-T.; Coca-Prados, M. Electron microscopic evidence for the circular form of RNA in the cytoplasm of eukaryotic cells. Nature 1979, 280, 339–340. [Google Scholar] [CrossRef]
  9. Wang, X.-F.; Yu, C.-Q.; You, Z.-H.; Wang, Y.; Huang, L.; Qiao, Y.; Wang, L.; Li, Z.-W. BEROLECMI: A novel prediction method to infer circRNA-miRNA interaction from the role definition of molecular attributes and biological networks. BMC Bioinform. 2024, 25, 264. [Google Scholar] [CrossRef]
  10. Kristensen, L.S.; Andersen, M.S.; Stagsted, L.V.W.; Ebbesen, K.K.; Hansen, T.B.; Kjems, J. The biogenesis, biology and characterization of circular RNAs. Nat. Rev. Genet. 2019, 20, 675–691. [Google Scholar] [CrossRef]
  11. Pamudurti, N.R.; Bartok, O.; Jens, M.; Ashwal-Fluss, R.; Stottmeister, C.; Ruhe, L.; Hanan, M.; Wyler, E.; Perez-Hernandez, D.; Ramberger, E.; et al. Translation of CircRNAs. Mol. Cell 2017, 66, 9–21.e7. [Google Scholar] [CrossRef] [PubMed]
  12. Feng, X.-Y.; Zhu, S.-X.; Pu, K.-J.; Huang, H.-J.; Chen, Y.-Q.; Wang, W.-T. New insight into circRNAs: Characterization, strategies, and biomedical applications. Exp. Hematol. Oncol. 2023, 12, 91. [Google Scholar] [CrossRef] [PubMed]
  13. Zhang, J.; Luo, Z.; Zheng, Y.; Duan, M.; Qiu, Z.; Huang, C. CircRNA as an Achilles heel of cancer: Characterization, biomarker and therapeutic modalities. J. Transl. Med. 2024, 22, 752. [Google Scholar] [CrossRef]
  14. Wang, J.; Chen, J.; Sen, S. MicroRNA as Biomarkers and Diagnostics. J. Cell. Physiol. 2015, 231, 25–30. [Google Scholar] [CrossRef] [PubMed]
  15. Liu, H.; Ren, G.; Chen, H.; Liu, Q.; Yang, Y.; Zhao, Q. Predicting lncRNA–miRNA interactions based on logistic matrix factorization with neighborhood regularized. Knowl.-Based Syst. 2020, 191, 105261. [Google Scholar] [CrossRef]
  16. Hansen, T.B.; Jensen, T.I.; Clausen, B.H.; Bramsen, J.B.; Finsen, B.; Damgaard, C.K.; Kjems, J. Natural RNA circles function as efficient microRNA sponges. Nature 2013, 495, 384–388. [Google Scholar] [CrossRef]
  17. Wang, X.-F.; Yu, C.-Q.; Li, L.-P.; You, Z.-H.; Huang, W.-Z.; Li, Y.-C.; Ren, Z.-H.; Guan, Y.-J. KGDCMI: A New Approach for Predicting circRNA–miRNA Interactions from Multi-Source Information Extraction and Deep Learning. Front. Genet. 2022, 13, 958096. [Google Scholar] [CrossRef]
  18. Scoyni, F.; Sitnikova, V.; Giudice, L.; Korhonen, P.; Trevisan, D.M.; de Sande, A.H.; Gomez-Budia, M.; Giniatullina, R.; Ugidos, I.F.; Dhungana, H.; et al. ciRS-7 and miR-7 regulate ischemia-induced neuronal death via glutamatergic signaling. Cell Rep. 2024, 43, 113862. [Google Scholar] [CrossRef]
  19. Ren, Z.-H.; You, Z.-H.; Yu, C.-Q.; Li, L.-P.; Guan, Y.-J.; Guo, L.-X.; Pan, J. A biomedical knowledge graph-based method for drug–drug interactions prediction through combining local and global features with deep neural networks. Briefings Bioinform. 2022, 23, bbac363. [Google Scholar] [CrossRef]
  20. Li, Y.-C.; You, Z.-H.; Yu, C.-Q.; Wang, L.; Wong, L.; Hu, L.; Hu, P.-W.; Huang, Y.-A. PPAEDTI: Personalized Propagation Auto-Encoder Model for Predicting Drug-Target Interactions. IEEE J. Biomed. Health Inform. 2022, 27, 573–582. [Google Scholar] [CrossRef]
  21. Ren, Z.-H.; You, Z.-H.; Zou, Q.; Yu, C.-Q.; Ma, Y.-F.; Guan, Y.-J.; You, H.-R.; Wang, X.-F.; Pan, J. DeepMPF: Deep learning framework for predicting drug–target interactions based on multi-modal representation with meta-path semantic analysis. J. Transl. Med. 2023, 21, 48. [Google Scholar] [CrossRef]
  22. Zhang, L.; Yang, P.; Feng, H.; Zhao, Q.; Liu, H. Using Network Distance Analysis to Predict lncRNA–miRNA Interactions. Interdiscip. Sci. Comput. Life Sci. 2021, 13, 535–545. [Google Scholar] [CrossRef] [PubMed]
  23. Wang, W.; Zhang, L.; Sun, J.; Zhao, Q.; Shuai, J. Predicting the potential human lncRNA–miRNA interactions based on graph convolution network with conditional random field. Briefings Bioinform. 2022, 23, bbac463. [Google Scholar] [CrossRef] [PubMed]
  24. Guo, L.-X.; You, Z.-H.; Wang, L.; Yu, C.-Q.; Zhao, B.-W.; Ren, Z.-H.; Pan, J. A novel circRNA-miRNA association prediction model based on structural deep neural network embedding. Briefings Bioinform. 2022, 23, bbac391. [Google Scholar] [CrossRef] [PubMed]
  25. Yu, C.-Q.; Wang, X.-F.; Li, L.-P.; You, Z.-H.; Huang, W.-Z.; Li, Y.-C.; Ren, Z.-H.; Guan, Y.-J. SGCNCMI: A New Model Combining Multi-Modal Information to Predict circRNA-Related miRNAs, Diseases and Genes. Biology 2022, 11, 1350. [Google Scholar] [CrossRef]
  26. He, J.; Xiao, P.; Chen, C.; Zhu, Z.; Zhang, J.; Deng, L. GCNCMI: A Graph Convolutional Neural Network Approach for Predicting circRNA-miRNA Interactions. Front. Genet. 2022, 13, 959701. [Google Scholar] [CrossRef]
  27. Qian, Y.; Zheng, J.; Jiang, Y.; Li, S.; Deng, L. Prediction of circRNA-MiRNA Association Using Singular Value Decomposition and Graph Neural Networks. IEEE/ACM Trans. Comput. Biol. Bioinform. 2022, 20, 3461–3468. [Google Scholar] [CrossRef]
  28. Wang, X.-F.; Yu, C.-Q.; You, Z.-H.; Qiao, Y.; Li, Z.-W.; Huang, W.-Z. An efficient circRNA-miRNA interaction prediction model by combining biological text mining and wavelet diffusion-based sparse network structure embedding. Comput. Biol. Med. 2023, 165, 107421. [Google Scholar] [CrossRef]
  29. Ji, Y.; Zhou, Z.; Liu, H.; Davuluri, R.V. DNABERT: Pre-trained Bidirectional Encoder Representations from Transformers model for DNA-language in genome. Bioinformatics 2021, 37, 2112–2120. [Google Scholar] [CrossRef]
  30. Wang, X.-F.; Yu, C.-Q.; You, Z.-H.; Qiao, Y.; Li, Z.-W.; Huang, W.-Z.; Zhou, J.-R.; Jin, H.-Y. KS-CMI: A circRNA-miRNA interaction prediction method based on the signed graph neural network and denoising autoencoder. iScience 2023, 26, 107478. [Google Scholar] [CrossRef]
  31. Wang, X.-F.; Yu, C.-Q.; You, Z.-H.; Li, L.-P.; Huang, W.-Z.; Ren, Z.-H.; Li, Y.-C.; Wei, M.-M. A feature extraction method based on noise reduction for circRNA-miRNA interaction prediction combining multi-structure features in the association networks. Briefings Bioinform. 2023, 24, bbad111. [Google Scholar] [CrossRef] [PubMed]
  32. Liu, M.; Wang, Q.; Shen, J.; Yang, B.B.; Ding, X. Circbank: A comprehensive database for circRNA with standard nomenclature. RNA Biol. 2019, 16, 899–905. [Google Scholar] [CrossRef] [PubMed]
  33. Devlin, J.; Chang, M.-W.; Lee, K.; Toutanova, K. BERT: Pre-training of Deep Bidirectional Transformers for Language Understanding. arXiv 2019, arXiv:1810.04805. [Google Scholar]
  34. Zhang, W.; Guo, X.; Pan, T.; Liu, C.; Jiao, P.; Pan, L.; Wang, W. Role-Oriented Network Embedding Based on Adversarial Learning between Higher-Order and Local Features. In Proceedings of the 30th ACM International Conference on Information & Knowledge Management (CIKM 2021), Queensland, Australia, 1–5 November 2021; pp. 3632–3636. [Google Scholar]
  35. Ahmed, N.K.; Rossi, R.A.; Lee, J.B.; Willke, T.L.; Zhou, R.; Kong, X.; Eldardiry, H. Role-Based Graph Embeddings. IEEE Trans. Knowl. Data Eng. 2020, 34, 2401–2415. [Google Scholar] [CrossRef]
  36. Rossi, R.A.; Ahmed, N.K. Role Discovery in Networks. IEEE Trans. Knowl. Data Eng. 2014, 27, 1112–1131. [Google Scholar] [CrossRef]
  37. Perozzi, B.; Al-Rfou, R.; Skiena, S. DeepWalk: Online learning of social representations. arXiv 2014. [Google Scholar] [CrossRef]
  38. Grover, A.; Leskovec, J. Node2vec: Scalable feature learning for networks. arXiv 2016. [CrossRef]
  39. Elbashir, M.K.; Almotilag, A.; Mahmood, M.A.; Mohammed, M. Enhancing Non-Small Cell Lung Cancer Survival Prediction through Multi-Omics Integration Using Graph Attention Network. Diagnostics 2024, 14, 2178. [Google Scholar] [CrossRef]
  40. Siameh, T. Semi-Supervised Classification with Graph Convolutional Networks; Mississippi State University: Starkville, MS, USA, 2023. [Google Scholar]
  41. Kipf, T.N.; Welling, M. Semi-Supervised Classification with Graph Convolutional Networks. arXiv 2016, arXiv:1609.02907. [Google Scholar]
  42. Xu, K.; Hu, W.; Leskovec, J.; Jegelka, S. How Powerful Are Graph Neural Networks? arXiv 2018, arXiv:1810.00826. [Google Scholar]
  43. Veličković, P.; Cucurull, G.; Casanova, A.; Romero, A.; Liò, P.; Bengio, Y. Graph Attention Networks. arXiv 2017, arXiv:1710.10903. [Google Scholar]
  44. Chicco, D.; Jurman, G. The advantages of the Matthews correlation coefficient (MCC) over F1 score and accuracy in binary classification evaluation. BMC Genom. 2020, 21, 6. [Google Scholar] [CrossRef] [PubMed]
  45. Powers, D.M.W. Evaluation: From Precision, Recall and F-Measure to ROC, Informedness, Markedness and Correlation. arXiv 2020, arXiv:2010.16061. [Google Scholar]
  46. Sokolova, M.; Lapalme, G. A systematic analysis of performance measures for classification tasks. Inf. Process. Manag. 2009, 45, 427–437. [Google Scholar] [CrossRef]
  47. Fawcett, T. An Introduction to ROC analysis. Pattern Recogn. Lett. 2006, 27, 861–874. [Google Scholar] [CrossRef]
  48. Zhao, Y.-X.; Yu, C.-Q.; Li, L.-P.; Wang, D.-W.; Song, H.-F.; Wei, Y. BJLD-CMI: A predictive circRNA-miRNA interactions model combining multi-angle feature information. Front. Genet. 2024, 15, 1399810. [Google Scholar] [CrossRef]
  49. Lan, W.; Zhu, M.; Chen, Q.; Chen, B.; Liu, J.; Li, M.; Chen, Y.-P.P. CircR2Cancer: A manually curated database of associations between circRNAs and cancers. Database 2020, 2020, baaa085. [Google Scholar] [CrossRef]
  50. Ishaq, Y.; Ikram, A.; Alzahrani, B.; Khurshid, S. The Role of miRNAs, circRNAs and Their Interactions in Development and Progression of Hepatocellular Carcinoma: An Insilico Approach. Genes 2022, 14, 13. [Google Scholar] [CrossRef]
  51. Ma, B.; Wang, S.; Wu, W.; Shan, P.; Chen, Y.; Meng, J.; Xing, L.; Yun, J.; Hao, L.; Wang, X.; et al. Mechanisms of circRNA/lncRNA-miRNA interactions and applications in disease and drug research. Biomed. Pharmacother. 2023, 162, 114672. [Google Scholar] [CrossRef]
Figure 1. Workflow of CMI prediction using DNABERT and Role2Vec embeddings integrated with a graph attention network (GAT).
Processes 13 01318 g001
Figure 2. Histograms of the (a) circRNA and (b) miRNA features.
Processes 13 01318 g002
Figure 3. Cosine similarity matrix between circRNA and miRNA features.
Processes 13 01318 g003
Figure 4. t-SNE visualization of circRNA and miRNA features.
Processes 13 01318 g004
Figure 5. Training accuracy curve.
Processes 13 01318 g005
Figure 6. Training loss curve.
Processes 13 01318 g006
Figure 7. (a) ROC curves and (b) precision–recall curves for each fold of a 5-fold cross-validation of the GAT model based on the CMI-9905 dataset.
Processes 13 01318 g007
Figure 8. (a) ROC curves and (b) precision–recall curves for each fold of a 5-fold cross-validation of the GAT model based on the CMI-9589 dataset.
Processes 13 01318 g008
Figure 9. (a) ROC curves and (b) precision–recall curves for each fold of a 5-fold cross-validation of the traditional deep learning model based on the CMI-9905 dataset.
Processes 13 01318 g009
Table 1. Sample of the parameter values and their results.
#LR.WD.DO.HC.NH.Acc.F1-Score
10.0050.00010.36420.88520.9103
20.0050.00100.36440.88480.9095
30.0050.00050.33240.88210.9076
40.0100.00100.33240.88150.9074
50.0050.00100.36420.88100.9070
Table 2. The performance of our GAT model on the CMI-9905 dataset.
FoldAccuracyPrecisionRecallF1-ScoreAUROCAUPR
Fold 10.87170.90260.89820.90040.94940.9731
Fold 20.88190.90120.91740.90920.95430.9764
Fold 30.87340.89080.91260.90160.95070.9740
Fold 40.86860.90460.88410.89420.94250.9686
Fold 50.88540.90450.91590.91020.95320.9725
Mean0.87620.90070.90560.90310.95000.9729
Std0.00640.00510.01270.00590.00410.0025
Table 3. The performance of our GAT model on the CMI-9589 dataset.
FoldAccuracyPrecisionRecallF1-ScoreAUROCAUPR
Fold 10.88940.91240.92340.91780.95630.9787
Fold 20.88580.92130.90830.91480.95550.9791
Fold 30.87220.89950.91160.90550.94420.9738
Fold 40.88680.90150.92480.91300.95980.9785
Fold 50.88430.89800.92600.91180.95080.9732
Mean0.88370.90650.91880.91260.95330.9767
Std0.00600.00900.00740.00410.00540.0026
Table 4. The performance of traditional deep learning model on the CMI-9905 dataset.
FoldAccuracyPrecisionRecallF1-ScoreAUROCAUPR
Fold 10.71770.71730.92850.80940.76590.8521
Fold 20.72740.7850.79480.78990.78820.8585
Fold 30.70520.75770.78740.77230.76330.8427
Fold 40.71050.70930.91380.79860.74840.8297
Fold 50.71670.76570.79680.78090.77220.8455
Mean0.71550.74700.84420.79020.76760.8457
Std0.00750.02900.0630.01300.01290.0097
Table 5. The GAT performance comparison with different CMI prediction models.
DatasetModelAccuracyPrecisionRecallF1-Score
CMI-9905Our GAT model0.87620.90070.90560.9031
BEROLECMI [9]0.83950.84270.83960.8392
KS-CMI [30]0.83430.8366N/A0.8340
BJLD-CMI [48]0.83410.85310.80700.8294
JSNDCMI [31]0.82310.82320.8203N/A
CMI-9589Our GAT model0.88370.90650.91880.9126
BEROLECMI [9]0.87770.87990.87780.8776
GCNCMI [26]0.85300.94130.83450.8847
KS-CMI [30]0.83500.8354NA0.8349
KGDCMI [17]0.82510.83970.8036NA
Table 6. The GAT performance comparison with different CMI prediction models based on AUROC and AUPR.
DatasetModelAUROCAUPR
CMI-9905Our GAT model0.95000.9729
KS-CMI [30]0.91440.9086
BEROLECMI [9]0.91040.9086
BioDGW-CMI [28]0.90260.8962
JSNDCMI [31]0.90030.8999
SGCNCMI [25]0.89420.8887
WSCD [24]0.89230.8935
KGDCMI [17]0.89300.8767
CMI-9589Our GAT model0.95330.9767
BEROLECMI [9]0.94910.9431
BioDGW-CMI [28]0.94760.9416
JSNDCMI [31]0.94150.9403
GCNCMI [26]0.93200.9396
KS-CMI [30]0.91790.9181
SGCNCMI [25]0.90150.9011
KGDCMI [17]0.90410.8937
Table 7. Top 10 predicted circRNA–miRNA interactions with supporting biological evidence.
#CircRNAmiRNAScoreEvidence
1circ2174miR-1490.9989unconfirmed
2circ-PDE8AmiR-3380.9988PMID: 29709702
3CircMTO1miR-90.9880PMID: 28520103
4circPLK1miR-296-5p0.9985PMID: 31337246
5hsa_circ_0001038miR-337-3p0.9973PMID: 31809842
6hsa_circ_0006948miR-490-3p0.9971PMID: 31881015
7hsa_circ_0007534miR-6130.9969PMID: 32271418
8circRPMS1miR-2030.9960PMID: 31695488
9circ_ARF3miR-12990.9960PMID: 32240746
10circRPMS1miR-4510.9955PMID: 31695488
Disclaimer/Publisher’s Note: The statements, opinions and data contained in all publications are solely those of the individual author(s) and contributor(s) and not of MDPI and/or the editor(s). MDPI and/or the editor(s) disclaim responsibility for any injury to people or property resulting from any ideas, methods, instructions or products referred to in the content.

