Abstract
Carbon emissions accounting of wastewater treatment systems is essential for understanding their energy efficiency and greenhouse gas emissions. To overcome the inefficiencies and high uncertainty of traditional carbon emission accounting methods in wastewater treatment, carbon emission prediction software for biological wastewater treatment systems was developed. This system is based on biochemical reactions that occur during biological wastewater treatment processes and the classification of carbon emission sources within the system. By utilizing stoichiometric relationships, a carbon emission accounting platform for wastewater treatment processes was created using programming languages, such as Python. The platform was used to calculate the carbon emissions of two typical urban wastewater treatment plants in Xi’an. The results indicated that oxidation ditches in conventional urban wastewater treatment processes demonstrated superior performance, with lower energy consumption and total carbon emissions. Carbon emission calculations also revealed that septic tanks, which are critical components of building drainage systems, are frequently underestimated and overlooked as significant carbon emission sources.
1. Introduction
In recent years, environmental issues, particularly global warming, have garnered significant attention from the public and academic communities worldwide. In September 2019, the United Nations Framework Convention on Climate Change (UNFCCC) stated that many countries had pledged to achieve net zero carbon emissions by 2050 [1]. Carbon emissions primarily refer to greenhouse gases dominated by carbon dioxide (CO2), including nitrous oxide (N2O), methane (CH4), ozone (O3), and chlorofluorocarbons (CFCs, freons). Existing research data indicate that prolonged and extensive carbon emissions contribute to global warming, rising temperatures, and changes in ecosystems, which in turn affect agricultural production and the growth of flora and fauna [2,3,4,5]. Additionally, carbon emissions lead to the melting of glaciers and permafrost, rising sea levels, and widespread flooding, exacerbating droughts and causing water resource shortages, ultimately affecting the environment. The reduction of greenhouse gas emissions and response to climate change have become a global consensus within the international community. Most industries (e.g., the power sector, chemical industry, agriculture, and construction industry) are required to conduct carbon emission assessments and formulate strategies for carbon reduction [6,7,8,9,10].
As a focal point linking environmental pollution, fossil fuel consumption, and global warming, carbon emissions play a pivotal role in shaping China’s long-term environmental strategies. According to statistics from the World Resources Institute, the major sources of carbon emissions in China are the construction and renewable energy industries, as well as the industrial and agricultural sectors [11]. China’s main contributors to carbon emissions are energy, industry, transportation, and building materials. In 2021, China’s industrial sector energy consumption (including 41 industrial categories) accounted for about 65.29% of the country’s total energy consumption, of which coal consumption accounted for 54.98%. The industrial sector contributes nearly 76.30% of sulfur dioxide emissions and 67.25% of carbon dioxide emissions to the country’s total emissions [12]. Since transportation is a primary and essential sector for social development and the national economy, carbon emissions from China’s transportation sector account for 9.17% of the total [13]. In 2020, the total energy consumption of the entire lifecycle of China’s buildings reached 2.27 billion tonnes of coal equivalent (tce), accounting for 45.5% of China’s total energy consumption. Specifically, the energy consumption during the building materials production stage was 1.11 billion tce, representing 22.3% of the country’s total energy consumption; the energy consumption during the construction stage was 0.09 billion tce, accounting for 1.9%; and the energy consumption during the building operation stage was 1.06 billion tce, making up 21.3%. In the same year, the total carbon emissions from the entire lifecycle of China’s buildings amounted to 5.08 billion tonnes of CO2, representing 50.9% of the country’s total carbon emissions. Among these, the carbon emissions from the building materials production stage were 2.82 billion tonnes of CO2, accounting for 28.2% of the total; the carbon emissions from the construction stage were 0.1 billion tonnes of CO2, representing 1.0%; and the carbon emissions from the building operation stage were 2.16 billion tonnes of CO2, accounting for 21.7% [14]. Studies have shown that under low-carbon and carbon-neutral scenarios, measures to improve the efficiency of the building materials value chain have the greatest potential for CO2 emissions reduction before 2030 and remain significant through 2060 [15]. In summary, carbon emissions have emerged as a crucial determinant in shaping China’s long-term environmental policies. This issue is central not only to political and international dialogues but also to initiatives aimed at ecological restoration, fossil fuel conservation, and mitigating global warming. Projections indicate that carbon emissions from the wastewater sector are expected to increase by 27% between 2005 and 2030 [16,17,18,19].
It is worth noting that during the social water cycle, a significant portion of water is converted into domestic sewage and industrial wastewater. These two sources are the primary contributors to water pollution and critical challenges hindering the harmonious development of socio-economic progress and environmental protection [20,21,22,23]. Traditional wastewater treatment relies on additional energy and chemicals to sustain the high pollutant removal efficiency of microorganisms in biological reaction tanks. These microorganisms break down polymeric organic matter into CO2, H2O, and energy [24]. However, the water treatment industry, as a persistent source of greenhouse gas emissions, has gone largely unnoticed. This was mainly attributed to the hidden and unpredictable nature of greenhouse gas emissions within the sector. Biological wastewater and sludge treatment processes involve a wide variety of microorganisms and complex biochemical reactions, resulting in greenhouse gas emissions that vary significantly depending on environmental conditions. This process involves both direct carbon emissions from biological activities and indirect carbon emissions from the operation of equipment and facilities [25,26]. Moreover, these emissions are continuous and long-term. In 2021, the “Innovation and Development of Carbon Reduction Technologies under the Carbon Neutrality Context” forum was held in Beijing, where researchers proposed new directions and pathways for low-carbon development of China’s wastewater treatment industry [4,5]. In 2021, the centralized collection rate of urban domestic sewage in China reached 68.6%, representing an increase of 3.8 percentage points compared with the previous year [27]. By 2025, the wastewater treatment sector is projected to make substantial progress in achieving synergistic outcomes for pollution reduction and carbon mitigation alongside continuous advancements in energy efficiency and carbon reduction capabilities. In addition, water-scarce cities at the prefecture level and above in China are expected to achieve reclaimed water utilization rates exceeding 25% [28]. In recent years, China will design and construct 100 wastewater treatment plants with efficient energy utilization and resource recovery systems, primarily based on low-carbon emission water treatment technologies [29]. The country aims to increase this rate to 70% by 2025, with a primary focus on mitigating greenhouse-gas emissions. Existing research has focused on areas such as carbon emission accounting [30,31,32], carbon emission measurement [23,33,34] carbon emission structure [35,36] carbon footprint analysis [37,38,39,40,41], and carbon emission evaluation [42]. However, studies utilizing existing wastewater treatment engineering data for simulation and prediction remain relatively scarce.
Foreign experts have long focused on the issue of carbon emissions during the wastewater treatment process and have conducted professional research on this topic. Bridle [43] developed a program that can be used for wastewater treatment plant data. This program evaluated data from 16 wastewater treatment facilities in Canada, calculating the emissions from primary treatment, conventional activated sludge, extended aeration, and anaerobic digestion of residual sludge. Jennifer R. Stokes et al. [44] developed the Wastewater Energy Sustainability Tool (WWEST), which is used to conduct a hybrid life cycle assessment of wastewater collection, treatment, and discharge infrastructure in the United States. Christine Sweetapple [45] revised the activated sludge model and developed BSM2-e (Benchmark Simulation Model No.2-e), which is used to study the sources of uncertainty in greenhouse gas emission modeling during the wastewater treatment process. Hiroko Yoshida [46] applied tracer dispersion methods to quantify the integrated, real-time emissions of methane and nitrous oxide from a wastewater treatment plant. Shuhei Masuda [47] and others investigated the seasonal variations of greenhouse gas emissions and the main emission sources at a specific wastewater treatment plant. Celia Somlai et al. [48] used a multi-chamber automated soil gas flux system with high spatial and temporal resolution to measure CO2 and CH4 fluxes for 81 days in septic tanks in the northern maritime climate of Ireland. They studied the spatiotemporal variations of CO2 and CH4 emissions from septic tank leachate and found that CO2 fluxes exhibited strong diurnal variations driven by soil temperature, while CH4 fluxes were less influenced by environmental factors. These studies and reports focus on accounting for the water treatment facilities and evaluating specific processes or products, but there has been limited research on carbon emission assessment models for the entire wastewater treatment process. Consequently, there is no systematic method for evaluating the carbon emissions of water treatment processes and the energy-saving effects of the processes. In addition, in recent years, there has been widespread attention in the industry regarding carbon emissions measurement and modeling methods in wastewater treatment, such as Multi-Objective Particle Swarm Optimization (MPSO), Non-dominated Sorting Genetic Algorithm-II (NSGA-II) [49], and Mixed-Integer Programming models [50].
This study explores the generation mechanisms and transformation pathways of greenhouse gases during the biochemical processes of biological wastewater treatment. By developing a carbon emission prediction model based on biochemical reaction equations, this study quantified the carbon emissions throughout the treatment process. The paper also provides preliminary carbon emission simulation calculations in the process design of newly constructed wastewater treatment plants to assess the energy consumption and environmental impact of the design, and to optimize the wastewater treatment processes and operational modes. The results provide valuable guidance for promoting energy efficiency, reducing emissions, and optimizing processes in biological wastewater treatment systems, offering a scientific basis for sustainable upgrades and innovations in treatment technologies.
2. Materials and Methods
Carbon emissions from wastewater treatment systems can be categorized into two main types: direct and indirect emissions [23,38]. Direct carbon emissions are generated by biochemical reactions involving microorganisms in wastewater treatment systems. Indirect carbon emissions, on the other hand, arise from energy consumption associated with the operation of infrastructure, such as lifting pumps, aeration equipment, and sludge thickening devices, as well as material consumption from the addition of chemicals such as methanol, flocculants, and coagulant aids. Prior to biological treatment, a pretreatment process should be implemented, which includes processes such as screening, grit chambers, and primary sedimentation tanks. Typically, the pollutant removal rate of the primary sedimentation tank is 20–30%. The wastewater entering the main treatment process should meet the water quality range specified in Table 1. The sources of carbon emissions from the sewage and sludge treatment processes are shown in Table 2.

Table 1.
Applicable water quality parameter ranges.
Table 2.
Carbon emission sources in sewage and sludge treatment processes.
2.1. Carbon Emissions in Biological Wastewater Treatment Processes
Direct carbon emissions from water treatment systems are closely influenced by factors such as raw water quality [51,52,53], the selected treatment processes [54,55,56], and the specific requirements for discharge or reuse [57]. Organic wastewater suitable for biological treatment typically undergoes secondary or tertiary treatment to meet discharge standards or advanced treatment to achieve reuse goals. Primary treatment methods, such as screening, filtration, sedimentation, flotation, and aeration, produce minimal direct carbon emissions, with the majority being indirect emissions caused by energy consumption. Therefore, carbon emissions from primary treatment can be calculated based on the energy consumption per cubic meter of water treated at local water treatment plants [58,59]. Secondary water treatment methods used in secondary treatment depend on the concentration of pollutants: For low concentrations of organic carbon, aerobic biological treatment methods, including activated sludge, oxidation ditches, and sequencing batch reactors (SBR), are commonly employed [60,61]. These processes primarily emit CO2 along with small amounts of H2O. Conversely, for high concentrations of organic carbon, anaerobic biological treatment methods such as septic tanks, anaerobic sludge digesters, and upflow anaerobic sludge blanket (UASB) reactors are often utilized. These processes predominantly generate recoverable CH4 accompanied by smaller quantities of CO2 and H2O. It is important to note that methane has a global warming potential 20–25 times greater than that of carbon dioxide. Tertiary treatment methods are closely related to the type of pollutant and greenhouse gas emissions. Among them, N2O, which has a global warming potential that is approximately 298 times that of CO2, is a significant concern. Therefore, nitrogen treatment processes must be strictly monitored while accounting for carbon emissions.
Carbon emissions from organic nitrogen transformation: The processes of ammonification and nitrification generate CO2 and H2O, and N2O emissions have been observed in almost all biological denitrification processes: (1) During nitrification, aerobic nitrifying bacteria can undergo denitrification under low dissolved oxygen (DO) conditions, producing N2O. Heterotrophic nitrifying bacteria can also generate N2O during nitrification. When the DO concentration was less than 1.5–2.5 mg/L, the N2O release rate decreased by 60%. N2O emissions are rare in practical wastewater nitrification processes [62]. (2) During denitrification, N2O is an intermediate product of the reduction of nitrates. Its production is influenced by factors such as the microbial species, pH, C/N ratio, external carbon sources, DO, sludge retention time (SRT), and temperature [63]. (3) Simultaneous nitrification and denitrification achieve nitrogen removal efficiency comparable to that of sequential nitrification and denitrification, but with significantly reduced N2O emissions. On an engineering scale, 0–14.6% of nitrogen is converted to N2O during wastewater denitrification, with N2O emissions depending on the denitrification method. Carbon emissions from organic phosphorus transformation According to the principles of biological phosphorus removal, the transformation of organic phosphorus does not produce gaseous carbon emissions. However, in processes that combine nitrogen and phosphorus removal, the presence of nitrate in the anaerobic zone may result in minor carbon emissions. These emissions depend on nitrate concentration and microbial species in the anaerobic zone. Advanced treatment methods for reuse typically involve chemical or physicochemical processes. The resulting carbon emissions primarily stem from material consumption, which is related to the quality of the reused water.
Indirect carbon emissions mainly refer to emissions resulting from electricity consumption and material consumption of chemicals during the operation of wastewater treatment plants. Electricity consumption in wastewater treatment plants is primarily used for pumping wastewater and sludge, supplying oxygen during biological treatment, and recirculation systems. Electricity accounts for 60–90% of the total energy consumption, which also includes fuels and chemicals. In rough estimates, the total energy consumption can be approximated as 1.2–1.7 times the electricity consumption. The electricity consumption depends on the treatment scale, processes, and requirements. The pollutant discharge standards for municipal wastewater treatment plants (GB18918 [64]) provide regional electricity consumption limits based on treatment scale, which can serve as a reference for estimation. In China, electricity consumption for wastewater treatment is approximately 0.2–0.3 kWh m−3. Moreover, carbon emissions corresponding to material consumption should not be overlooked. Material consumption includes chemicals added during water treatment, such as methanol, flocculants, and coagulant aids, which depend on the concentration of suspended solids in the water. Different chemicals and water qualities result in different dosages, which can be determined through coagulation experiments. Notably, the coagulation process reduces the COD, which must be accounted for in the subsequent process efficiency calculations. If an external carbon source is required in denitrification processes, the associated material consumption should also be included. Methanol dosage can be determined experimentally or based on empirical formulas, with deviations typically within 10% [65,66].
- : Methanol dosage.
- : Amount of NO3− removed from the denitrification tank.
- : Dissolved oxygen concentration in the denitrification tank influent.
The commonly used chemicals for phosphorus removal include aluminum salts, iron salts, and lime. When using aluminum salts or iron salts as coagulants, their dosage is typically 1.5–3 times the molar ratio of the total phosphorus content in the water. When using lime for phosphorus removal, the reaction forms Ca5(PO4)3OH precipitate. The required lime dosage depends on the alkalinity of the wastewater rather than its phosphorus content. However, lime is less frequently used for phosphorus removal because of the large amount of sludge that is produced.
2.2. Construction of the Carbon Emission Prediction Model for Biological Wastewater Treatment Processes
Based on the sources of carbon emissions in the wastewater treatment process described earlier, a model was developed to calculate the total carbon emissions, including both direct and indirect emissions, at each stage and for each treatment method. The carbon emission measurement boundaries for sewage treatment are shown in Figure 1. For biological treatment processes, calculations are based on biochemical reaction equations, with the following assumptions:
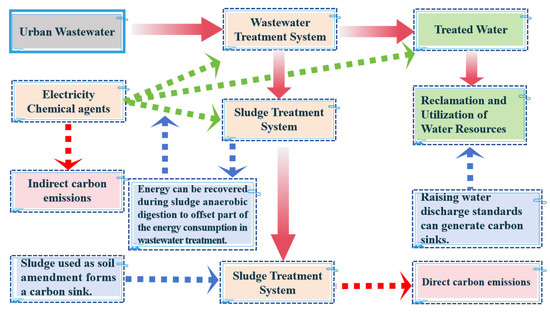
Figure 1.
Schematic diagram of the carbon emission measurement boundaries for urban sewage treatment.
The biological conversion of organic carbon occurs via assimilation and dissimilation, with no intermediate carbon products formed; the final products of organic carbon conversion are only CO2 and CH4.
- The dissolved oxygen required for aerobic nitrification is sufficient, and there are no heterotrophic nitrifying bacteria in the system; N2O is produced only during denitrification. The final product of organic nitrogen is N2.
- The anaerobic zone for biological phosphorus removal does not consider denitrification processes. Anaerobic biological treatment processes are only related to changes in organic carbon and do not consider the transformation of organic nitrogen or phosphorus.
- The solubility of various gases in water is not accounted for.
- The environmental conditions for the biological reactions are: room temperature (20 °C), one standard atmospheric pressure, and a pH value of 7.0.
- The transformation processes and products of elements such as sulfur (S) and iron (Fe) are neglected in the chemical reactions.
The carbon emission measurement boundaries for sewage treatment are shown in Figure 1. For biological treatment processes, calculations are based on biochemical reaction equations, with the following assumptions: the biological conversion of organic carbon occurs via assimilation and dissimilation, with no intermediate carbon products formed; the final products of organic carbon conversion are only CO2 and CH4. The dissolved oxygen required for aerobic nitrification was sufficient, and there were no heterotrophic nitrifying bacteria in the system; N2O was produced only during denitrification. The anaerobic zone for biological phosphorus removal does not consider denitrification processes. Anaerobic biological treatment processes are only related to changes in organic carbon and do not consider the transformation of organic nitrogen or phosphorus.
Chemical Equation for Organic Carbon Transformation under Aerobic Conditions:
Chemical Equation for Organic Carbon Transformation under Anaerobic Conditions:
Chemical Equation for Organic Nitrogen Transformation During Denitrification:
Chemical Equation for Organic Phosphorus Transformation (Using Acetate as a Carbon Source):
Under Aerobic Conditions:
Under Anoxic Conditions:
Under Anaerobic Conditions:
Based on the above biochemical conversion equations for organic matter, it is evident that carbon emissions from biological conversion processes are related to the concentrations of organic carbon, organic nitrogen, and organic phosphorus. These emissions are also influenced by discharge standards and the treatment efficiency of biological processes.
The water quality parameters for the carbon emissions accounting platform of the wastewater treatment system used in this study are listed in Table 2. Based on the logical sequence of the wastewater treatment process, a carbon emission accounting platform for wastewater treatment processes was developed using Python (3.9.13) as the programming language, Django (3.2.12) as the web framework, and MySQL (8.0.31) as the database.
The platform’s core functionalities include data input, analysis, and output. It calculates the carbon emissions for each treatment unit of the wastewater treatment process and recommends low-carbon treatment processes suitable for a specific water quality. The operating conditions are presented in Table 3.
Table 3.
Carbon emission accounting platform technical environment.
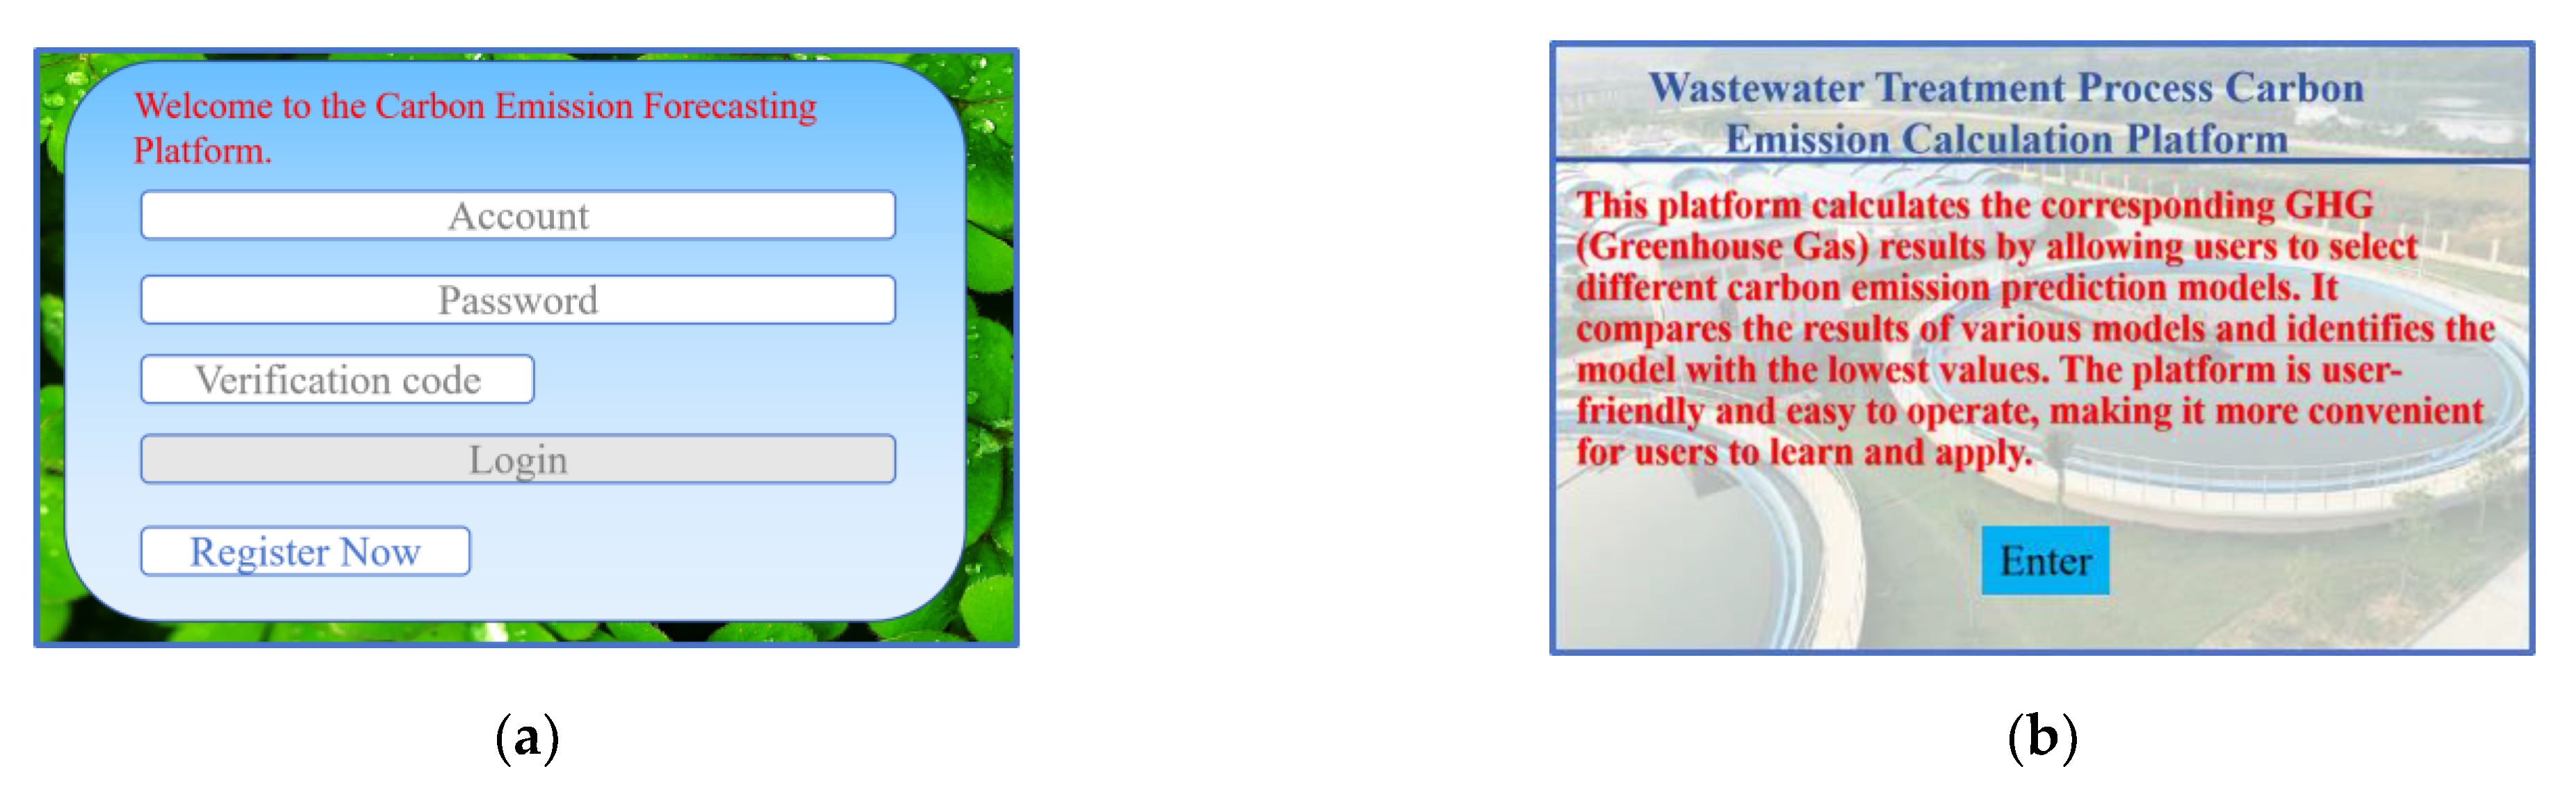
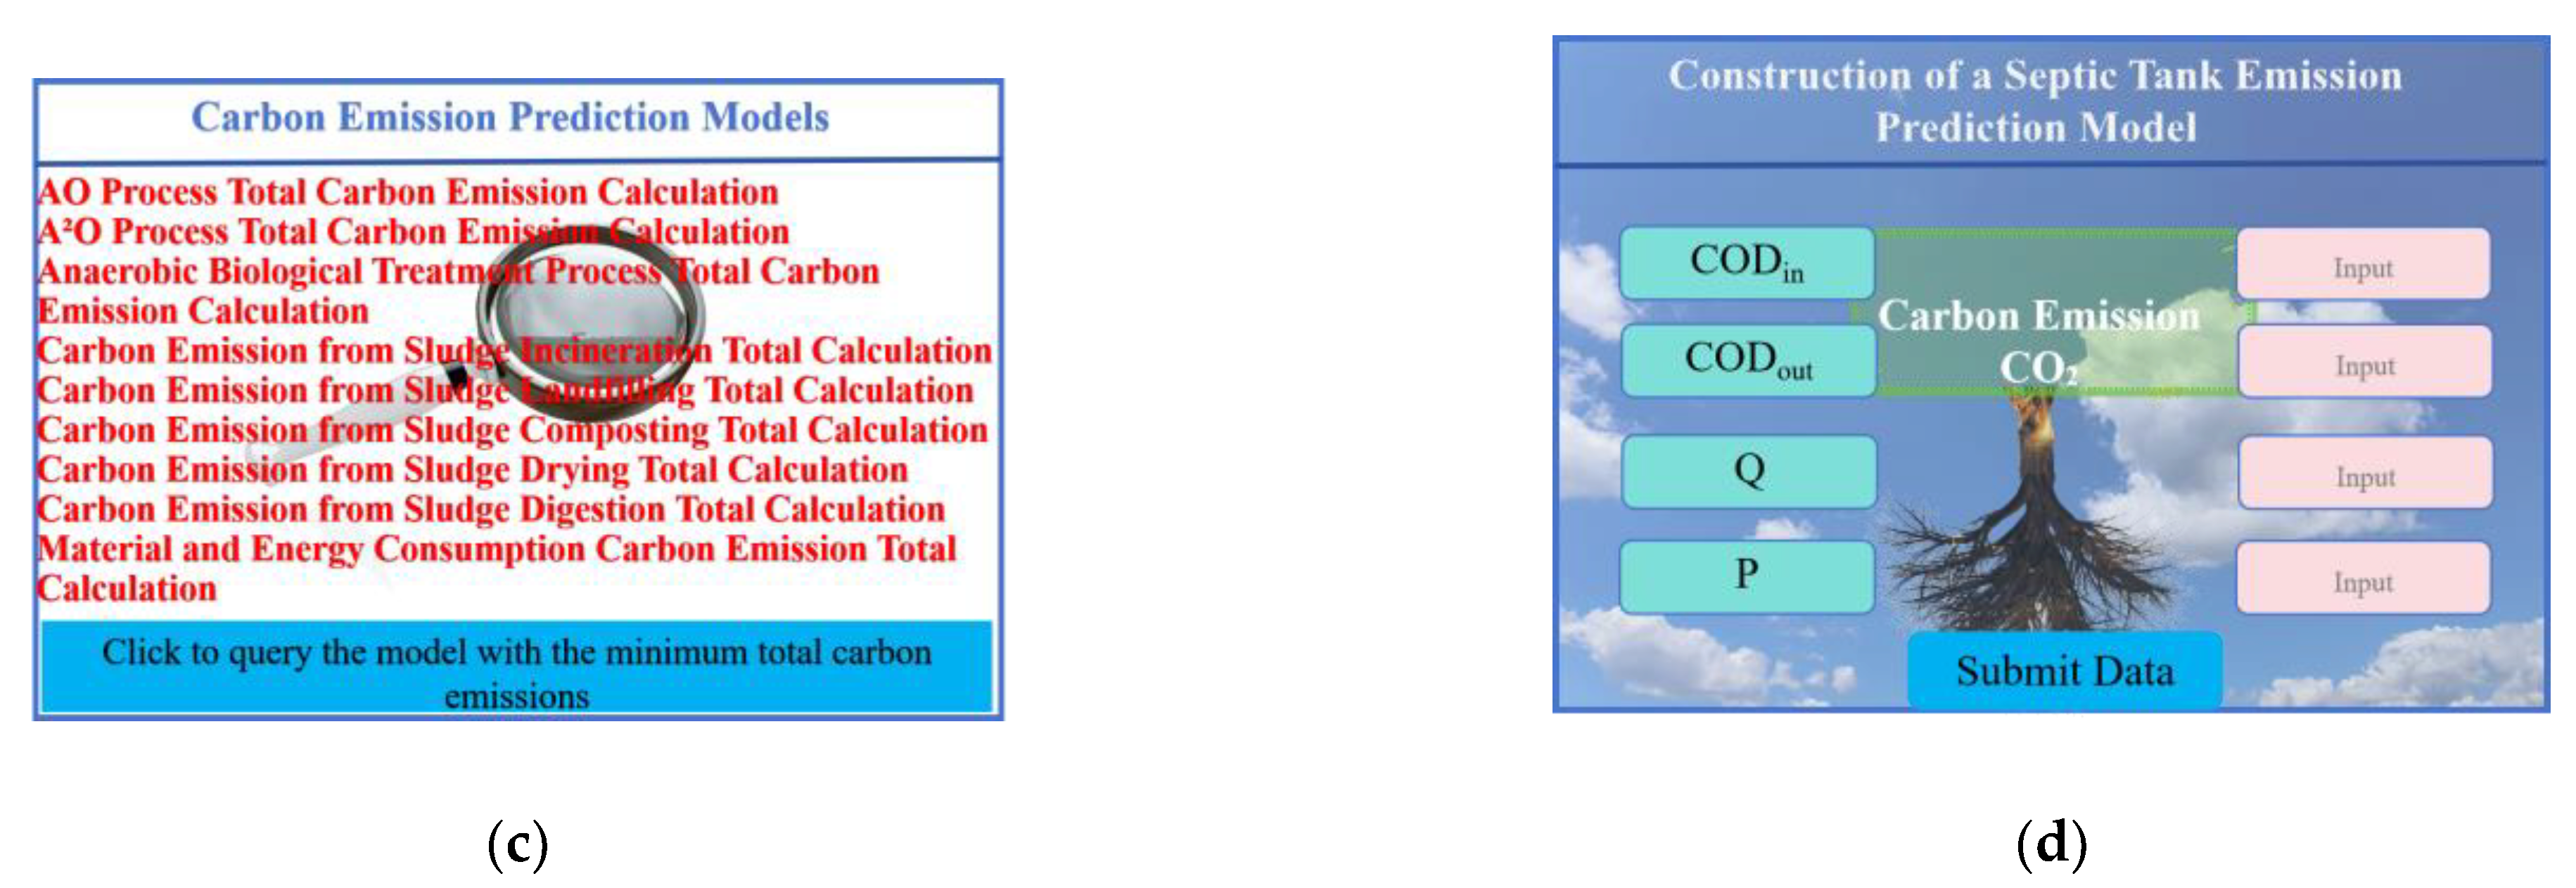
The wastewater treatment process carbon emission accounting platform does not require installation or downloading. The detailed code can be found in the Supplementary Materials. Simply copy and paste the following link into a browser: http://81.69.38.227:2022/userLogin (accessed on 20 October 2022), register, log in, and click to operate. In Figure 2, (a) displays the registration and login interface of the wastewater treatment process carbon emission calculation platform, (b) shows the system introduction interface of the wastewater treatment process carbon emission calculation platform, (c) presents the process selection interface of the wastewater treatment process carbon emission calculation platform, and (d) illustrates the on-site display interface required for the total carbon emission calculation data.
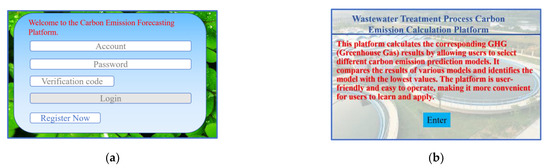

Figure 2.
Urban sewage treatment common process carbon emission accounting platform. (a) Sewage treatment process carbon emission accounting platform registration and login interface, (b) Sewage treatment process carbon emission accounting platform system introduction interface, (c) Sewage treatment process carbon emission accounting platform process selection interface, (d) Carbon emission total calculation data required field display interface.
3. Results
3.1. Simulation Calculation Results
The types of water treatment process units are diverse, their functions are complex, and the principles and structural differences of different water treatment technologies vary significantly, resulting in significant differences in carbon emissions across various water treatment methods. The carbon emission programming logic diagram of the wastewater treatment system is drawn based on the wastewater treatment process of the treatment plant and the function of each structure. During use, sequentially click to select the names of the pretreatment, secondary treatment, and sludge treatment processes, and input the corresponding operating parameters and influent/effluent water quality. The program will display the carbon emissions of each structure. At the end of the program, the carbon emissions of each structure will be summed up to obtain the total carbon emissions of the selected process flow. The calculation process for the carbon emission accounting platform for wastewater treatment processes is shown in Figure 3. Owing to the limitations of workload and data collection, this simulation and calculation focused on common water treatment processes.
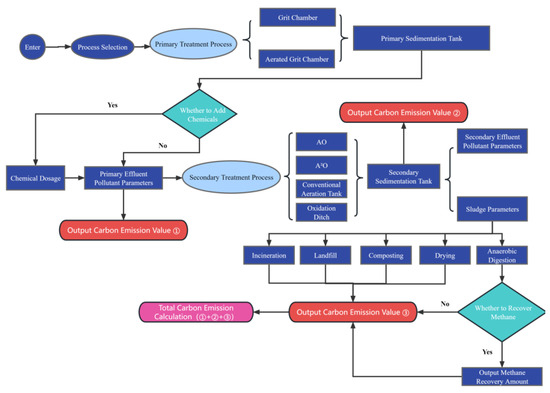
Figure 3.
The calculation process of the carbon emission accounting platform for wastewater treatment processes is shown in the diagram.
3.1.1. Oxidation Ditch
Oxidation ditches are the most widely used urban sewage treatment process in China. It primarily removes organic carbon from sewage and is part of the aerobic activated sludge treatment system. By controlling the operational parameters, this process can achieve nitrogen removal. Other similar aerobic activated sludge process calculations can use the carbon emissions model of the oxidation ditch.
The method for predicting CO2 emissions during the aerobic stage of microbial decomposition and metabolism is as follows.
The biomass of endogenous respiration degraded during the aerobic phase is:
According to the literature [67], the prediction method for CO2 produced by aerobic endogenous respiration is:
The molecular formula of microorganisms in the anoxic process is C10H19O3N, and the stoichiometric relationship in microbial synthesis is as follows:
Based on the stoichiometric relationship, we obtain:
where 0.502 represents the amount of organic matter oxidized per gram of O2 (g).
Thus, the coefficient in Equation (9), after rearrangement and conversion, is calculated as:
In the formula:
- —Influent flow rate, m3 d−1.
- —hydraulic retention time, d.
- —volatile suspended solid concentration, mg L−1.
- —Sludge decay coefficient, generally valued at 0.05~0.1 d−1.
- Y—Sludge growth yield, f = BOD5/BOD.
When nitrification occurs in an aerobic tank, inorganic carbon (CO2) in wastewater is used as a carbon source for the reaction, absorbing a portion of (CO2). The reaction equation is as follows:
The amount of NH4+ in the aerobic tank is:
where TNin—total nitrogen in the influent (mg L−1. TNout—Total nitrogen in effluent, mg L−1.
The amount of CO2 recovered by the nitrification reaction in the aerobic tank is:
N2O emissions in the aerobic stage were calculated using the N2O emission factor determined through measurements:
In this equation:
- —Amount of N2O generated, mg L−1.
- —surface area of aerobic tank, m2.
- —N2O emission factor of the aerobic tank, 0.725 g m−2.
3.1.2. A2O Process
The A2O process is a water treatment system currently used in wastewater treatment plants to remove nitrogen and phosphorus. The direct carbon emissions in this process consist of three parts: aerobic, anoxic, and anaerobic emissions.
Construction of the prediction model for carbon emissions in the anaerobic stage:
Construction of the Prediction Model for Carbon Emissions in the Anoxic Stage:
Prediction model for carbon emissions in the aerobic stage:
Therefore, the carbon emission model for the A2O process is:
The coefficients in the above formulas are derived based on stoichiometric relationships.
Calculate the required parameters based on the process formulas and chemical equations, as listed in Table 4.
Table 4.
Parameters required for carbon emission accounting platform.
3.2. Simulation Calculation of Carbon Emissions
Using water quality data from wastewater treatment plants in Xi’an City as an example, carbon emissions were calculated using the proposed model. The Xi’an No. 9 Wastewater Treatment Plant has a daily treatment capacity of 150,000 m3 d−1 and employs the Carrousel oxidation ditch process with a hydraulic retention time (HRT) of 18.32 h. The Xi’an No. 2 Wastewater Treatment Plant, with a daily treatment capacity of 200,000 m3 d−1, uses a biological nitrogen and phosphorus removal process (A2O) combined with a multi-stage and multi-segment nitrogen and phosphorus removal process, featuring an HRT of 17.1 h. The water quality of the sewage treatment plant is shown in Table 5.
Table 5.
Water quality of the sewage treatment plant.
The simulation results from the platform are as follows: Eighth Wastewater Treatment Plant: Carbon emissions from biological treatment accounted for 50 ± 5% of the total emissions, energy consumption contributed 45 ± 3%, sludge disposal accounted for 3 ± 3%, and material consumption accounted for only 2%. The oxidation ditch process was analyzed using conventional treatment scales. Second Wastewater Treatment Plant: For the A2O process under conventional treatment scales, carbon emissions from energy consumption range between 40% and 63% of the total, whereas biological treatment contributes 33% to 45%. Sludge disposal accounts for 1% to 9%, and material consumption contributes only 1% to 2%. The primary sources of carbon emissions are direct emissions from biological treatment and indirect emissions from energy consumption.
These findings reveal that, under conventional treatment scales, the carbon emissions of the oxidation ditch process mainly originate from biological treatment and energy consumption, with both contributing at similar levels. However, for the A2O process, carbon emissions from energy consumption are approximately 1.3 times higher than those from biological treatment. A comparative analysis indicates that under similar water quality and quantity conditions, the oxidation ditch process can reduce overall carbon emissions.
3.3. Septic Tank
According to the carbon emission accounting method proposed by Ludwig Sasses [68], the CH4 emission from the septic tank is calculated as:
where:
- —emission from the septic tank, kg day−1.
- P—number of service users in the building, persons.
- —Methane density under standard conditions, 0.71 kg m−3.
The CO2 emission from the septic tank can be calculated as:
where:
- —CO2 emission from the septic tank, kg day−1.
- —CO2 density under standard conditions, 1.96 kg day−1.
From the above calculations for CH4 and CO2 emissions from the septic tank, the carbon emission prediction model for the septic tank is as follows:
where:
- —Carbon emission from the septic tank, kg d−1;
- —CH4 emission from the septic tank, kg day−1;
- —CO2 emissions from the septic tank, kg day−1.
4. Discussion
The sewage treatment plant data program by Hugh D. Monteith [69] and others yielded the following results: the primary treatment discharge rate was 0.005 kg CO2 equivalent m−3, the conventional activated sludge rate was 0.26 kg CO2 equivalent m−3, and after extended aeration and aerobic digestion, the residual sludge undergoes anaerobic digestion with a discharge rate of 0.8 kgCO2 equivalent m−3. An evaluation of the carbon emissions from water treatment at the Xi’an Second Sewage Treatment Plant on 15 May 2024, was conducted, using the plant’s average inflow and outflow parameters for that day. The specific data is as following Table 6 and Table 7:
Table 6.
Water quality parameters of the Xi’an Second Sewage Treatment Plant on 15 May 2024.
Table 7.
The input parameter values in the carbon emission accounting platform.
The calculation results of the carbon emission platform are shown in Table 8.
Table 8.
The carbon emission accounting platform calculation results.
The carbon emissions of the plant on that day were 162,214.6 kg d−1, with a carbon emission of 0.9 kg CO2 equivalent m−3 per unit of treated water. The direct carbon emissions were 97,996.6 kg d−1, with a carbon emission of 0.54 kg CO2 equivalent m−3 per unit of treated water. Among these, the carbon emissions from biological treatment were 95,948.8 kg d−1, with a carbon emission of 0.53 kg CO2 equivalent m−3 per unit of treated water. The carbon emissions from sludge anaerobic digestion were 2047.8 kg d−1, with a carbon emission of 2.1 kg CO2 equivalent m−3. The indirect carbon emissions were 64,218 kg d−1, with a carbon emission of 0.36 kg CO2 equivalent m−3 per unit of treated water. Among these, the carbon emissions from material consumption were 11,835 kg d−1, with a carbon emission of 0.065 kg CO2 equivalent m−3 per unit of treated water, while the carbon emissions from energy consumption were 52,383 kg d−1, with a carbon emission of 0.29 kg CO2 equivalent m−3 per unit of treated water.
The plant’s carbon emissions for that day were calculated using the IPCC greenhouse gas inventory method. The calculation results are shown in Table 9.
Table 9.
The calculation results using the IPCC greenhouse gas inventory method.
The carbon emissions calculated using the IPCC greenhouse gas inventory method for this water plant were higher than those calculated by the software, as the carbon emissions from electricity consumption were double-counted, leading to an overestimation of the plant’s overall carbon emissions. This has a certain misleading effect on the plant’s carbon reduction efforts. The results obtained by the software also showed significant differences from the findings of Hugh D. Monteith [68] and others, primarily because the software system calculates the entire water treatment process.
The effluent from the conventional septic tanks had the following characteristics: COD, 120–400 mg L−1; BOD5, 40–150 mg L−1; COD removal rate, 15%; SS removal rate, 30%; BOD5 removal rate, 9%; and ammonia nitrogen removal rate, 3%. According to the “Outdoor Drainage Design Code” GB50014-2021 [70], the BOD5 of domestic sewage can be calculated as 25 g~50 g per person per day, and based on the B/C ratio of domestic sewage, the average COD is calculated as 75 g per person per day. The “Discharge Standard for Sewage into Urban Sewers” GB/T31962-2015 [71] requires the discharge limits to be: COD 500 mg L−1 and BOD5 350 mg L−1. With the population of the 100 most populous cities in China being approximately 150 million, a simulation can be performed to predict the daily carbon emissions generated by septic tanks in these cities. emissions were reported at 420 tons per day, whereas emissions amounted to 570 tons per day. The total carbon emissions, expressed as greenhouse gas () equivalents, reached an estimated 11,000 tons per day. The calculation above only accounts for the 100 most populous cities in China. The population used in the calculation was likely underestimated, with a total of 338 prefecture-level cities in China. In addition, carbon emissions from nitrogen removal were not considered. Furthermore, the calculation only includes carbon emissions from septic tanks associated with residential building wastewater and does not consider septic tanks in other public buildings. Therefore, septic tanks related to building wastewater are underestimated and overlooked as sources of carbon emissions.
5. Conclusions
Based on the sources of carbon emissions and the biochemical reaction equations of biological sewage treatment processes, a carbon emission model was constructed. Using the model, a preliminary carbon emission calculation was performed for typical sewage treatment processes, leading to the following conclusions. For urban sewage with similar water volume and quality, the oxidation ditch process, compared to the A2O process, is more conducive to energy saving and emission reduction, and the carbon emissions from septic tanks associated with buildings exceed 10,000 tons per day. Septic tanks have underestimated and overlooked sources of carbon emissions. The effluent from the septic tank has not undergone a disinfection process, the system is open, and carbon emissions have not yet been recovered, posing potential air environmental hazards, pathogenic risks, and biological threats.
Future efforts should focus on improving the structural design of septic tanks to facilitate gas collection and reduce carbon emissions. Several limitations were identified through the calculation and simulation of carbon emissions from the sewage treatment processes. For instance, there are numerous influencing factors, making it difficult to calculate each factor individually to improve accuracy, and there is a lack of engineering measurement data, making it impossible to assess the deviation between simulated and actual data. Some gases generated during the wastewater treatment process are water-soluble (e.g., CO2, N2O, etc.); when the temperature changes, the solubility of various water-soluble gases in water varies significantly. The model calculation does not account for the carbon emissions from gases dissolved in water, resulting in an overestimation of the direct carbon emissions calculated by the model. The simulation mainly focused on activated sludge-based treatment systems, excluding other ecological treatment technologies. Future research should prioritize studying deviations and collecting more data while also including carbon emissions accounting for ecological treatment systems. The design of sewage treatment processes should not be solely focused on treatment efficiency and meeting discharge standards but should also comprehensively consider environmental impacts, particularly carbon emissions. The application of “Internet+” technologies will make carbon emission calculations for water treatment processes more scientific and accurate. Utilizing big data systems will bring model calculations closer to actual emissions, offering valuable insights into industry standards, engineering design, and system operation.
Supplementary Materials
The following supporting information can be downloaded at: https://www.mdpi.com/article/10.3390/pr13040999/s1. Programming code display.
Author Contributions
Conceptualization, X.Y.; methodology, X.Y.; software, Y.Y.; validation, Y.Y.; formal analysis, X.Y.; investigation, X.Y.; resources, X.Y.; data curation, H.L.; writing—original draft preparation, X.Y.; writing—review and editing, H.L.; visualization, H.L.; supervision, Y.Y.; project administration, H.L.; funding acquisition, H.L. All authors have read and agreed to the published version of the manuscript.
Funding
This research was funded by the second group of Tianshan Talent Training Program: Youth Support Talent Project, grant number 2023TSYCQNTJ0030 and the “Tianchi Talent” Recruitment Program of the Human Resources and Social Security Department of Xinjiang Uygur Autonomous Region.
Data Availability Statement
Data is contained within the article and the article’s Supplementary Material.
Acknowledgments
We would like to extend our sincere gratitude to Ning Zuojun for his invaluable assistance with the statistical analysis. We also acknowledge the School of Civil Engineering at Kashi University for providing the necessary laboratory space and technical equipment that were essential for the successful execution of the experiments. We appreciate the technical support provided by Xinjiang Junte Design Engineering Co., Ltd., which played a crucial role in the progress of our experimental work. Finally, we are grateful to our administrative team for their support throughout the course of this project.
Conflicts of Interest
Author Yueting Yang was employed by the Shaanxi Construction Seventh Engineering Group Co., Ltd. The remaining authors declare that the research was conducted in the absence of any commercial or financial relationships that could be construed as a potential conflict of interest.
Abbreviations
The following abbreviations are used in this manuscript:
| CO2 | Carbon dioxide |
| N2O | Nitrous oxide |
| CH4 | Methane |
| CFCs | Chlorofluorocarbons |
| O3 | Ozone |
| H2O | Water |
| A2O | Anaerobic-Anoxic-Oxic |
References
- Wamsler, C.; Schäpke, N.; Fraude, C.; Stasiak, D.; Bruhn, T.; Lawrence, M.; Schroeder, H.; Mundaca, L. Enabling New Mindsets and Transformative Skills for Negotiating and Activating Climate Action: Lessons from Unfccc Conferences of the Parties. Environ. Sci. Policy 2020, 112, 227–235. [Google Scholar] [PubMed]
- Karakaya, E.; Akkoyun, G.; Hicyilmaz, B. Carbon Pricing for Greenhouse Gas Emission Reduction: Carbon Tax or Emission Trading? Ekon. Polit. Finans. Arastirmalari Derg. 2023, 8, 813–841. [Google Scholar]
- Ricke, K.L.; Caldeira, K. Maximum Warming Occurs About One Decade after a Carbon Dioxide Emission. Environ. Res. Lett. 2014, 9, 8. [Google Scholar]
- Mekonnen, Z.A.; Riley, W.J.; Randerson, J.T.; Shirley, I.A.; Bouskill, N.J.; Grant, R.F. Wildfire Exacerbates High-Latitude Soil Carbon Losses from Climate Warming. Environ. Res. Lett. 2022, 17, 11. [Google Scholar]
- Lue, W.W.; Ren, H.Y.; Ding, W.C.; Li, H.; Yao, X.; Jiang, X. The Effects of Climate Warming on Microbe-Mediated Mechanisms of Sediment Carbon Emission. J. Environ. Sci. 2023, 129, 16–29. [Google Scholar]
- Li, X.; Cui, X.D.; Wang, M.X. Analysis of China’s Carbon Emissions Base on Carbon Flow in Four Main Sectors: 2000–2013. Sustainability 2017, 9, 13. [Google Scholar] [CrossRef]
- Tan, D.J.; Bilal; Gao, S.; Komal, B. Impact of Carbon Emission Trading System Participation and Level of Internal Control on Quality of Carbon Emission Disclosures: Insights from Chinese State-Owned Electricity Companies. Sustainability 2020, 12, 14. [Google Scholar] [CrossRef]
- Shen, Q.; Gu, J.M.; Shang, L.; Liu, S.; Song, X.H.; Yu, W.S.; Liu, Y.P.; Sun, N.N.; Wei, W. Carbon Emissions and Low-Carbon Development in Olefin Industry. Environ. Res. 2024, 244, 10. [Google Scholar]
- Wang, G.F.; Liao, M.L.; Jiang, J. Research on Agricultural Carbon Emissions and Regional Carbon Emissions Reduction Strategies in China. Sustainability 2020, 12, 20. [Google Scholar] [CrossRef]
- Yang, Z.; Gao, W.J.; Han, Q.; Qi, L.Y.; Cui, Y.J.; Chen, Y.Q. Digitalization and Carbon Emissions: How Does Digital City Construction Affect China’s Carbon Emission Reduction? Sust. Cities Soc. 2022, 87, 14. [Google Scholar]
- Xie, S.; Wang, L.; Shao, Z. Review on Carbon Emissions Researches at Home and Abroad. Arid Land Geogr. 2014, 37, 720–730. [Google Scholar]
- China Energy Statistical Yearbook 2022; China Statistics Press: Beijing, China, 2023.
- Yu, Y.; Li, S.Q.; Sun, H.P.; Taghizadeh-Hesary, F. Energy Carbon Emission Reduction of China’s Transportation Sector: An Input-Output Approach. Econ. Anal. Policy 2021, 69, 378–393. [Google Scholar]
- China Building Energy Efficiency Association. Research Report of China Building Energy Consumption and Carbon Emissions, Institute of Urban and Rural Construction and Development, Chongqing University. In Construction and Architecture; China Building Energy Efficiency Association: Beijing, China, 2023; pp. 57–69. [Google Scholar]
- Lu, H.Y.; You, K.R.; Feng, W.; Zhou, N.; Fridley, D.; Price, L.; du Can, S.D. Reducing China’s Building Material Embodied Emissions: Opportunities and Challenges to Achieve Carbon Neutrality in Building Materials. iScience 2024, 27, 21. [Google Scholar]
- Office of Atmospheric Programs Climate Change Division U.S. Environmental Protection Agency. Global Anthropogenic Non-CO2 Greenhouse Gas Emissions: 1990–2030; U.S. Environmental Protection Agency: Washington, DC, USA, 2012. [Google Scholar]
- Wu, H.R.; Cai, C.; Yu, L.; Shang, Z.X.; Zhang, Y.M.; Ni, X.J.; Guo, R.; Liu, J.; Peng, K.M.; Huang, X.F.; et al. Technology-Driven Carbon-Neutral Pathway Analysis for Urban Wastewater Treatment Plants. J. Clean Prod. 2024, 475, 9. [Google Scholar]
- Song, C.H.; Zhu, J.J.; Yuan, Z.G.; van Loosdrecht, M.C.M.; Ren, Z.J. Defining and Achieving Net-Zero Emissions in the Wastewater Sector. Nat. Water 2024, 2, 927–935. [Google Scholar]
- Liao, X.W.; Tian, Y.J.; Gan, Y.W.; Ji, J.P. Quantifying Urban Wastewater Treatment Sector’s Greenhouse Gas Emissions Using a Hybrid Life Cycle Analysis Method—An Application on Shenzhen City in China. Sci. Total Environ. 2020, 745, 7. [Google Scholar]
- Rezvani, F.; Sarrafzadeh, M.H.; Ebrahimi, S.; Oh, H.M. Nitrate Removal from Drinking Water with a Focus on Biological Methods: A Review. Environ. Sci. Pollut. Res. 2019, 26, 1124–1141. [Google Scholar]
- Wu, Z.D.; Ye, Q.L. Water Pollution Loads and Shifting within China’s Inter-Province Trade. J. Clean Prod. 2020, 259, 8. [Google Scholar]
- Elginoz, N.; Alzaboot, M.; Babuna, F.G.; Iskender, G. Construction of a Large Water Treatment Plant: Appraisal of Environmental Hotspots. Desalination Water Treat. 2019, 172, 309–315. [Google Scholar]
- Zhang, Y.; Ge, T.G.; Liu, J.; Sun, Y.L.; Liu, Y.; Zhao, Q.; Tian, T.F. The Comprehensive Measurement Method of Energy Conservation and Emission Reduction in the Whole Process of Urban Sewage Treatment Based on Carbon Emission. Environ. Sci. Pollut. Res. 2021, 28, 56727–56740. [Google Scholar]
- Chmielewski, A.G.; Sudlitz, M.; Zubrowska-Sudol, M. Advanced Technology for Energy, Plant Nutrients and Water Recovery at Wastewater Treatment Plants. Energies 2024, 17, 25. [Google Scholar] [CrossRef]
- Chang, H.M.; Zhao, Y.; Li, X.; Damgaard, A.; Christensen, T.H. Review of Inventory Data for the Biological Treatment of Sewage Sludge. Waste Manag. 2023, 156, 66–74. [Google Scholar] [CrossRef] [PubMed]
- Pan, W.T.; Liu, H.; Chen, Y.Z.; Wang, Q.; Wang, Y.X.; Zhang, L.; Peng, Y.Z. Towards the Application of Mainstream Low-Carbon Anammox Wastewater Treatment Technologies: Strategies, Innovations, and Prospects. Front. Chem. Sci. Eng. 2025, 19, 19. [Google Scholar] [CrossRef]
- Ministry of Housing and Urban-Rural Development (Ed.) Bulletin on the Status of Urban Construction in China in 2021; Ministry of Housing and Urban-Rural Development: Beijing, China, 2022. [Google Scholar]
- National Development and Reform Commission (Ed.) Urban Sewage Treatment and Resource Utilization Development Plan in the 14th Five-Year Plan; National Development and Reform Commission: Beijing, China; Ministry of Housing and Urban-Rural Development: Beijing, China, 2021. [Google Scholar]
- National Development and Reform Commission (Ed.) Implementation Opinions on Promoting Synergistic Pollution Reduction and Carbon Mitigation in Wastewater Treatment; National Development and Reform Commission: Beijing, China; Ministry of Housing and Urban-Rural Development and the Ministry of Ecology and Environment: Beijing, China, 2024. [Google Scholar]
- Yateh, M.; Li, C.; Li, F.T.; Gu, C.P.; Ma, S.J.; Lu, B.B.; Tang, Y.L. Understanding the Influence of Energy and Chemical Use on Water Treatment Plants Carbon Emissions Accounting. J. Water Process Eng. 2025, 69, 15. [Google Scholar] [CrossRef]
- Liu, Y.; Mauter, M.S. High-Resolution Carbon Accounting Framework for Urban Water Supply Systems. Environ. Sci. Technol. 2022, 11, 13920–13930. [Google Scholar] [CrossRef]
- Liu, Z.X.; Xu, Z.Y.; Zhu, X.L.; Yin, L.R.; Yin, Z.T.; Li, X.L.; Zheng, W.F. Calculation of Carbon Emissions in Wastewater Treatment and Its Neutralization Measures: A Review. Sci. Total Environ. 2024, 912, 18. [Google Scholar] [CrossRef]
- Tao, J.Q.; Liu, Y.; Zhou, C.L. Carbon Emission Measurement and Water Treatment in Poyang Lake Eco-Economic Zone in the Context of Energy Saving and Emission Reduction in Tourism. Desalination Water Treat. 2023, 299, 222–231. [Google Scholar] [CrossRef]
- Jiang, S.; Li, E.X.; Wei, Y.M.; Yan, X.X.; He, R.F.; Banny, E.T.; Xin, Z. Measurement and Influencing Factors of Carbon Emission Efficiency Based on the Dual Perspectives of Water Pollution and Carbon Neutrality. Sci. Total Environ. 2024, 911, 10. [Google Scholar] [CrossRef]
- Zuo, Q.T.; Zhang, Z.Z.; Ma, J.X.; Zhao, C.G.; Qin, X. Carbon Dioxide Emission Equivalent Analysis of Water Resource Behaviors: Determination and Application of Ceea Function Table. Water 2023, 15, 24. [Google Scholar] [CrossRef]
- Zhang, S.; Xie, Y.L.; Jiang, Y.C.; Luo, Z.W.; Ji, L.; Cai, Y.P. Urban Water Resources Management with Energy Constraint and Carbon Emission Intensity under Uncertainty: A Dual Objective Optimization Model. J. Clean Prod. 2024, 434, 14. [Google Scholar] [CrossRef]
- Wu, Z.P.; Duan, H.R.; Li, K.L.; Ye, L. A Comprehensive Carbon Footprint Analysis of Different Wastewater Treatment Plant Configurations. Environ. Res. 2022, 214, 11. [Google Scholar]
- Wang, Y.T.; Gao, W.F.; Lv, L.Y.; Ma, X.T.; Ren, Z.J.; Sun, L.; Liu, X.Y.; Wang, P.F.; Sun, Z.; Tian, Y.; et al. Comprehensive Carbon Footprint Analysis of Wastewater Treatment: A Case Study of Modified Cyclic Activated Sludge Technology for Low Carbon Source Urban Wastewater Treatment. Sci. Total Environ. 2024, 923, 12. [Google Scholar] [CrossRef] [PubMed]
- Karakas, A.; Tozum-Akgul, S.; Komesli, O.T.; Kaplan-Bekaroglu, S.S. Carbon Footprint Analysis of Advanced Biological Wastewater Treatment Plant. J. Water Process Eng. 2024, 61, 8. [Google Scholar]
- Hu, W.Q.; Han, M.Q.; Gu, D.G.; Smith, R.; Hu, T.T.; Lou, Y.H.; Sun, Y.R.; Li, G.H.; Zhang, N.; Lu, J.Q. Spatiotemporal Carbon Footprint Analysis of Bottled Water Production by Ultrafiltration and Reverse Osmosis. J. Water Process Eng. 2024, 64, 12. [Google Scholar]
- Abolli, S.; Milan, E.G.; Bashardoust, P.; Alimohammadi, M. What Is the Carbon Footprint of Reverse Osmosis in Water Treatment Plants? A Systematic Review Protocol. Environ. Evid. 2023, 12, 9. [Google Scholar]
- Zhang, Q.; Wu, Q.; Xie, Y.; Dzakpasu, M.; Zhang, J.; Wang, X.C. A Novel Carbon Emission Evaluation Model for Anaerobic-Anoxic-Oxic Urban Sewage Treatment. J. Environ. Manag. 2024, 350, 119640. [Google Scholar] [CrossRef]
- Bridle, T. Of: A Rational Procedure for Estimation of Greenhouse-Gas Emissions from Municipal Wastewater Treatment Plants. Water Environ. Res. 2006, 78, 647. [Google Scholar] [CrossRef]
- Stokes, J.R.; Horvath, A. Supply-Chain Environmental Effects of Wastewater Utilities. Environ. Res. Lett. 2010, 5, 7. [Google Scholar]
- Sweetapple, C.; Fu, G.T.; Butler, D. Identifying Key Sources of Uncertainty in the Modelling of Greenhouse Gas Emissions from Wastewater Treatment. Water Res. 2013, 47, 4652–4665. [Google Scholar]
- Yoshida, H.; Monster, J.; Scheutz, C. Plant-Integrated Measurement of Greenhouse Gas Emissions from a Municipal Wastewater Treatment Plant. Water Res. 2014, 61, 108–118. [Google Scholar]
- Masuda, S.; Suzuki, S.; Sano, I.; Li, Y.Y.; Nishimura, O. The Seasonal Variation of Emission of Greenhouse Gases from a Full-Scale Sewage Treatment Plant. Chemosphere 2015, 140, 167–173. [Google Scholar] [PubMed]
- Somlai, C.; Knappe, J.; Gill, L. Spatial and Temporal Variation of Co2and Ch4 Emissions from a Septic Tank Soakaway. Sci. Total Environ. 2019, 679, 185–195. [Google Scholar] [PubMed]
- Eslamipoor, R. Direct and Indirect Emissions: A Bi-Objective Model for Hybrid Vehicle Routing Problem. J. Bus. Econ. 2024, 94, 413–436. [Google Scholar]
- Eslamipoor, R. A Two-Stage Stochastic Planning Model for Locating Product Collection Centers in Green Logistics Networks. Clean. Logist. Supply Chain. 2023, 6, 100091. [Google Scholar]
- Singh, S.K.; Sharma, A.; Singh, D.; Chopra, R. Energy Use and Carbon Footprint for Potable Water Treatment in Haiderpur Water Treatment Plant, Delhi, India. Asian J. Water Environ. Pollut. 2021, 18, 37–44. [Google Scholar]
- Ma, J.M.; Ni, X.J.; Cai, C.; Da, Y.; Hu, K.; Guo, R.; Liu, J.; Peng, K.M.; Liu, E.R.; Huang, X.F. Insights into Greenhouse Gas Emissions from a Wastewater Treatment Plant in Vulnerable Water Areas of China. Sci. Total Environ. 2023, 902, 9. [Google Scholar]
- Kalvakaalva, R.; Prior, S.A.; Smith, M.; Runion, G.B.; Ayipio, E.; Blanchard, C.; Wall, N.; Wells, D.; Hanson, T.R.; Higgins, B.T. Direct Greenhouse Gas Emissions from a Pilot-Scale Aquaponics System. J. Asabe 2022, 65, 1211–1223. [Google Scholar]
- Zhang, Q.L.; Sun, D.H.; Wang, M.S.; Yin, C.H. Analysis of Typical Energy Saving Technology in the Sewage Treatment Plant. In Proceedings of the 9th International Conference on Applied Energy (ICAE), Cardiff, UK, 21–24 August 2017. [Google Scholar]
- Jiang, H.; Jin, Q.; Cheng, P.P.; Hua, M.; Ye, Z. How Are Typical Urban Sewage Treatment Technologies Going in China: From the Perspective of Life Cycle Environmental and Economic Coupled Assessment. Environ. Sci. Pollut. Res. 2021, 28, 45109–45120. [Google Scholar]
- Chen, X.D.; Xu, Z.W.; Yao, L.M.; Ma, N. Processing Technology Selection for Municipal Sewage Treatment Based on a Multi-Objective Decision Model under Uncertainty. Int. J. Environ. Res. Public. Health 2018, 15, 18. [Google Scholar]
- Su, Q.; Dai, H.C.; Xie, S.Y.; Yu, X.Y.; Lin, Y.; Singh, V.P.; Karthikeyan, R. Water-Energy-Carbon Nexus: Greenhouse Gas Emissions from Integrated Urban Drainage Systems in China. Environ. Sci. Technol. 2023, 57, 2093–2104. [Google Scholar]
- Yu, S.L.; Deng, S.H.; Zhou, A.; Wang, X.B.; Tan, H.Z. Life Cycle Assessment of Energy Consumption and Ghg Emission for Sewage Sludge Treatment and Disposal: A Review. Front. Energy Res. 2023, 11, 11. [Google Scholar]
- Li, H.H.; Cheng, X.H.; Ding, H.; Yang, Y.; Li, D.; Wang, J.Q.; Han, J.J. Cleaner Production and Carbon Reduction Target: Analysis of Sewage Treatment Plants in Nort-Central China. Energy Sources Part A-Recovery Util. Environ. Eff. 2022, 44, 2770–2781. [Google Scholar]
- Bao, Z.Y.; Sun, S.C.; Sun, D.Z. Characteristics of Direct Co2 Emissions in Four Full-Scale Wastewater Treatment Plants. Desalination Water Treat. 2015, 54, 1070–1079. [Google Scholar]
- Bai, R.L.; Jin, L.; Sun, S.R.R.; Cheng, Y.; Wei, Y. Quantification of Greenhouse Gas Emission from Wastewater Treatment Plants. Greenh. Gases 2022, 12, 587–601. [Google Scholar]
- Zhang, Z.Z.; Zhang, Y.; Chen, Y.G. Recent Advances in Partial Denitrification in Biological Nitrogen Removal: From Enrichment to Application. Bioresour. Technol. 2020, 298, 16. [Google Scholar]
- Wrage-Mönnig, N.; Horn, M.A.; Well, R.; Müller, C.; Velthof, G.; Oenema, O. The Role of Nitrifier Denitrification in the Production of Nitrous Oxide Revisited. Soil Biol. Biochem. 2018, 123, A3–A16. [Google Scholar]
- GB 18918-2002; Discharge standard of pollutants for municipal wastewater treatment plant. The Standardization Administration of China: Beijing, China, 2002.
- Horn, H.; Telgmann, U. Simulation of Tertiary Denitrification with Methanol in an Upflow Biofilter. Water Sci. Technol. 2000, 41, 185–190. [Google Scholar]
- Dong, W.Y.; Zhang, X.B.; Wang, H.J.; Sun, F.Y.; Liu, T.Z. Enhanced Denitrification with External Carbon Sources in a Biological Anoxic Filter. Water Sci. Technol. 2012, 66, 2243–2250. [Google Scholar]
- Li, Z.-b.; Li, H.-l.; Liu, Y.; Yang, Y.-t.; Wang, Y.-b. Prediction Method of Carbon Emission in Sewage Treatment System. Sichuan Environ. 2023, 42, 340–349. [Google Scholar]
- Gutterer, B.; Sasse, L.; Panzerbieter, T.; Reckerzügel, T. Decentralised Wastewater Treatment Systems (Dewats) and Sanitation in Developing Countries. WEDC: Madison, WI, USA; Loughborough University: Loughborough, UK; BORDA: Bremen, Germany, 2009. [Google Scholar]
- Monteith, H.D.; Sahely, H.R.; MacLean, H.L. Closure. Water Environ. Res. 2006, 78, 648. [Google Scholar] [CrossRef]
- GB 50014-2021; Standard for design of outdoor wastewater engineering. The Standardization Administration of China: Beijing, China, 2021.
- GB/T31962-2015; Wastewater Quality Standards for Discharge to Municipal Sewers. The Standardization Administration of China: Beijing, China, 2015.


Disclaimer/Publisher’s Note: The statements, opinions and data contained in all publications are solely those of the individual author(s) and contributor(s) and not of MDPI and/or the editor(s). MDPI and/or the editor(s) disclaim responsibility for any injury to people or property resulting from any ideas, methods, instructions or products referred to in the content. |
© 2025 by the authors. Licensee MDPI, Basel, Switzerland. This article is an open access article distributed under the terms and conditions of the Creative Commons Attribution (CC BY) license (https://creativecommons.org/licenses/by/4.0/).