Abstract
Based on considering the stress state distribution and potential failure surface of the specimen during uniaxial compression, the drilling parameters (layout, spacing, position) are set. Thoroughly understanding the influence of different drilling parameters on the pressure relief effect is conducive to reducing the occurrence of coal mine rock burst accidents. Through laboratory tests and numerical simulation tests under different drilling parameters, the influence laws of mechanical parameters, failure characteristics, AE characteristic parameters and energy evolution of specimens under different drilling parameters were studied. The pressure relief effect under different drilling parameters was evaluated by using the pressure relief effect evaluation index (X), and the best combination of drilling parameters was obtained. The results show the following: (1) Compared with the intact specimen, the peak strength of the drilling specimen is significantly reduced, and the drilling layout has the greatest influence on the mechanical properties, followed by the drilling spacing and drilling position. (2) Different drilling layouts will form different weak-strength surfaces in the specimen, and lead the expansion and penetration of cracks, resulting in different failure modes of the specimen. The stress distribution inside the specimen will affect the stress concentration around the borehole, finally affect the damage degree of the specimen. (3) Drilling can not only effectively reduce the energy accumulation capacity, but also enhance the degree of energy dissipation. The AE ringing counts and energy of the triangular-drilling specimens are the least. The AE ringing counts and energy decrease first and then increase with the increase in drilling spacing, and are the smallest at three times the drilling diameter. The AE ringing counts and energy increase gradually with the upward movement of the drilling position. (4) The optimal combination of drilling parameters was obtained by the test, and it was triangular-layout drilling, drilling spacing three times the diameter, and the drilling position in the middle of the specimen, and the value of the pressure relief effect evaluation index (X) was 65.41. The research results can provide some reference for the selection and optimization of drilling pressure relief parameters in rock burst mines.
1. Introduction
With the increase in coal mining depth, dynamic disasters have gradually become the main disasters in deep mines in China [1,2,3], such as rock bursts and mine earthquakes. The regional prevention and control of rock bursts in coal mines is by means of manual intervention. By changing the mechanical properties of surrounding rock, the energy accumulation and stress concentration of surrounding rock can be reduced. This can reduce the impact tendency of surrounding rock. Among them, drilling pressure relief with a large diameter is the most commonly used means to prevent rock bursts in rock burst mines [4,5,6]. The basic principles for determining some drilling parameters are provided in the prevention method of drilling pressure relief [7,8]. However, the influence of drilling parameters on mechanical properties and failure characteristics of coal rock has not been fully explored, which affects the accurate evaluation of the pressure relief effect. Therefore, it is necessary to study the effects of different combinations of drilling parameters on strength, failure, coal–rock impact, energy dissipation and pressure relief effect evaluation.
Many scholars have carried out relevant research on the mechanism of drilling pressure relief. Wang et al. [9] analyzed the pressure relief mechanism of drilling in deep roadways. He proposed that the stress transfer effect and the surrounding rock deformation control effect can be used as the direct evaluation index of the pressure relief effect, and determined the key drilling parameters when the pressure is fully relieved. Zhao and Lin et al. [10,11] studied the failure evolution process of rocks with boreholes and concluded that the cracks around holes are characterized by vertical tensile cracks formed on the upper and lower sides of boreholes, and shear cracks or secondary cracks formed on the left and right sides of boreholes. Tensile, compressive and shear applications affect the final failure mode of brittle rock. Jia et al. [12] studied the crack propagation and evolution penetration process around the drilling and found that the release of energy and stress is the fundamental reason for the drilling pressure relief. Wang et al. [13] concluded that the radius of the plastic zone around the borehole is the key factor affecting the pressure relief effect, and when selecting the pressure relief parameters of the borehole, the first choice should be the joint pressure relief of several boreholes, followed by expanding the diameter of the borehole and finally increasing the depth of the borehole. Zhu et al. [14] analyzed typical rock burst accidents and believed that excessive pressure relief of coal would seriously weaken its own carrying capacity. This forces the abutment pressure to move back to the direction of the roadway, resulting in delayed rock burst disasters. He also put forward the prevention and control measures of near-field strong pressure relief and strong support, deep-control pressure relief and strong monitoring. Zhu et al. [15] studied the pressure relief index of the working face impact danger area. It is considered that drilling pressure relief can prevent rock bursts by reducing the impact energy index and energy dissipation index of coal and rock. Yao et al. [16] unified the pressure relief mechanism of boreholes with roadway support, studied the energy characteristics of the anchorage-strengthening zone and stress-reducing zone, and believed that boreholes should be placed between the anchorage end and the peak stress.
A large number of scholars have conducted in-depth research on drilling pressure relief parameters, such as the diameter, layout, depth and direction of pressure relief drilling. Reasonable setting of drilling parameters must meet the pressure relief effect in three aspects. First, it is to reduce the stress of surrounding rock, release the elastic energy of roadway surrounding the rock and achieve the purpose of reducing the deformation of surrounding rock and preventing dynamic disasters. The second is to improve the physical condition of surrounding rock and reduce the burst tendency of surrounding rock, so that the surrounding rock does not have the condition of rock burst. The third is to ensure the strength characteristics of the surrounding rock, and the surrounding rock structure has a certain bearing capacity to maintain the stability of the roadway [17,18,19,20]. Yin et al. [21,22] evaluated the pressure relief effect of drilling from the perspective of energy storage and dissipation. With the increase in drilling diameter and number, the energy pre-release index, energy dissipation-increasing index and impact tendency weakening index gradually increase, and the increase gradient gradually decreases. Ma et al. [23] obtained the influence law of different borehole diameters, borehole depths and borehole angles on the peak strength of coal through numerical simulation tests. Wu et al. [24] analyzed the weakening effect of drilling with different shapes on the mechanical properties of specimens and concluded that the stability order of different drilling shapes was round, arch, trapezoid, rectangular and square. Zhang et al. [25] studied the influence law of different pressure relief drilling layouts and numbers by the coal-like material test and numerical simulation, and found that the pressure relief effect of triangular-layout drilling was the best. And the higher the density of the drilling, the more developed the rock cracks around the drilling, and the better the pressure relief effect. Nian et al. [26] studied the effect of large-diameter drilling on the pressure relief and permeability improvement of coal seams by numerical simulation and found that the stress around the drilling presented a symmetrical distribution. With the increase in drilling diameter, the plastic zone, crack and gas permeability of coal also increase. Wang et al. [27] studied the effects of the drillings number and arrangement on the mechanics and impact tendency of specimens and believed that with the increase in the drillings number, the impact tendency would gradually weaken, and the pressure relief effect would be better. Zuo et al. [28] arranged pressure relief drillings at 180°, 120°, 90° and 60°, and the peak strength of the specimens was reduced by 14%, 27%, 20% and 22%, respectively. At the same time, the sensitivity of the drillings’ diameter, arrangement angle and horizontal spacing was analyzed, and the influence of the drillings on compressive strength was gradually reduced. From the perspective of energy storage, Gong and He et al. [29,30] studied the influence of a different number of drillings and layout angles on the rock burst tendency of red sandstone. It was found that the peak-strength strain storage index decreases with the increase in the number of drillings. The peak-strength strain storage index is the lowest when the drilling angle and loading direction are 27°. Moreover, the angle of the drillings layout is more obvious to the burst tendency than the number of drillings. Lyu et al. [31,32] proposed a method of pressure relief by variable-diameter drilling and studied the effects of reaming diameter, reaming depth and reaming spacing on the pressure relief and energy dissipation of roadway surrounding rock. It was concluded that the position of the variable diameter should be within the range of the stress peak value, and the deep reaming should pass through the stress concentration area, so as to achieve the best pressure relief effect.
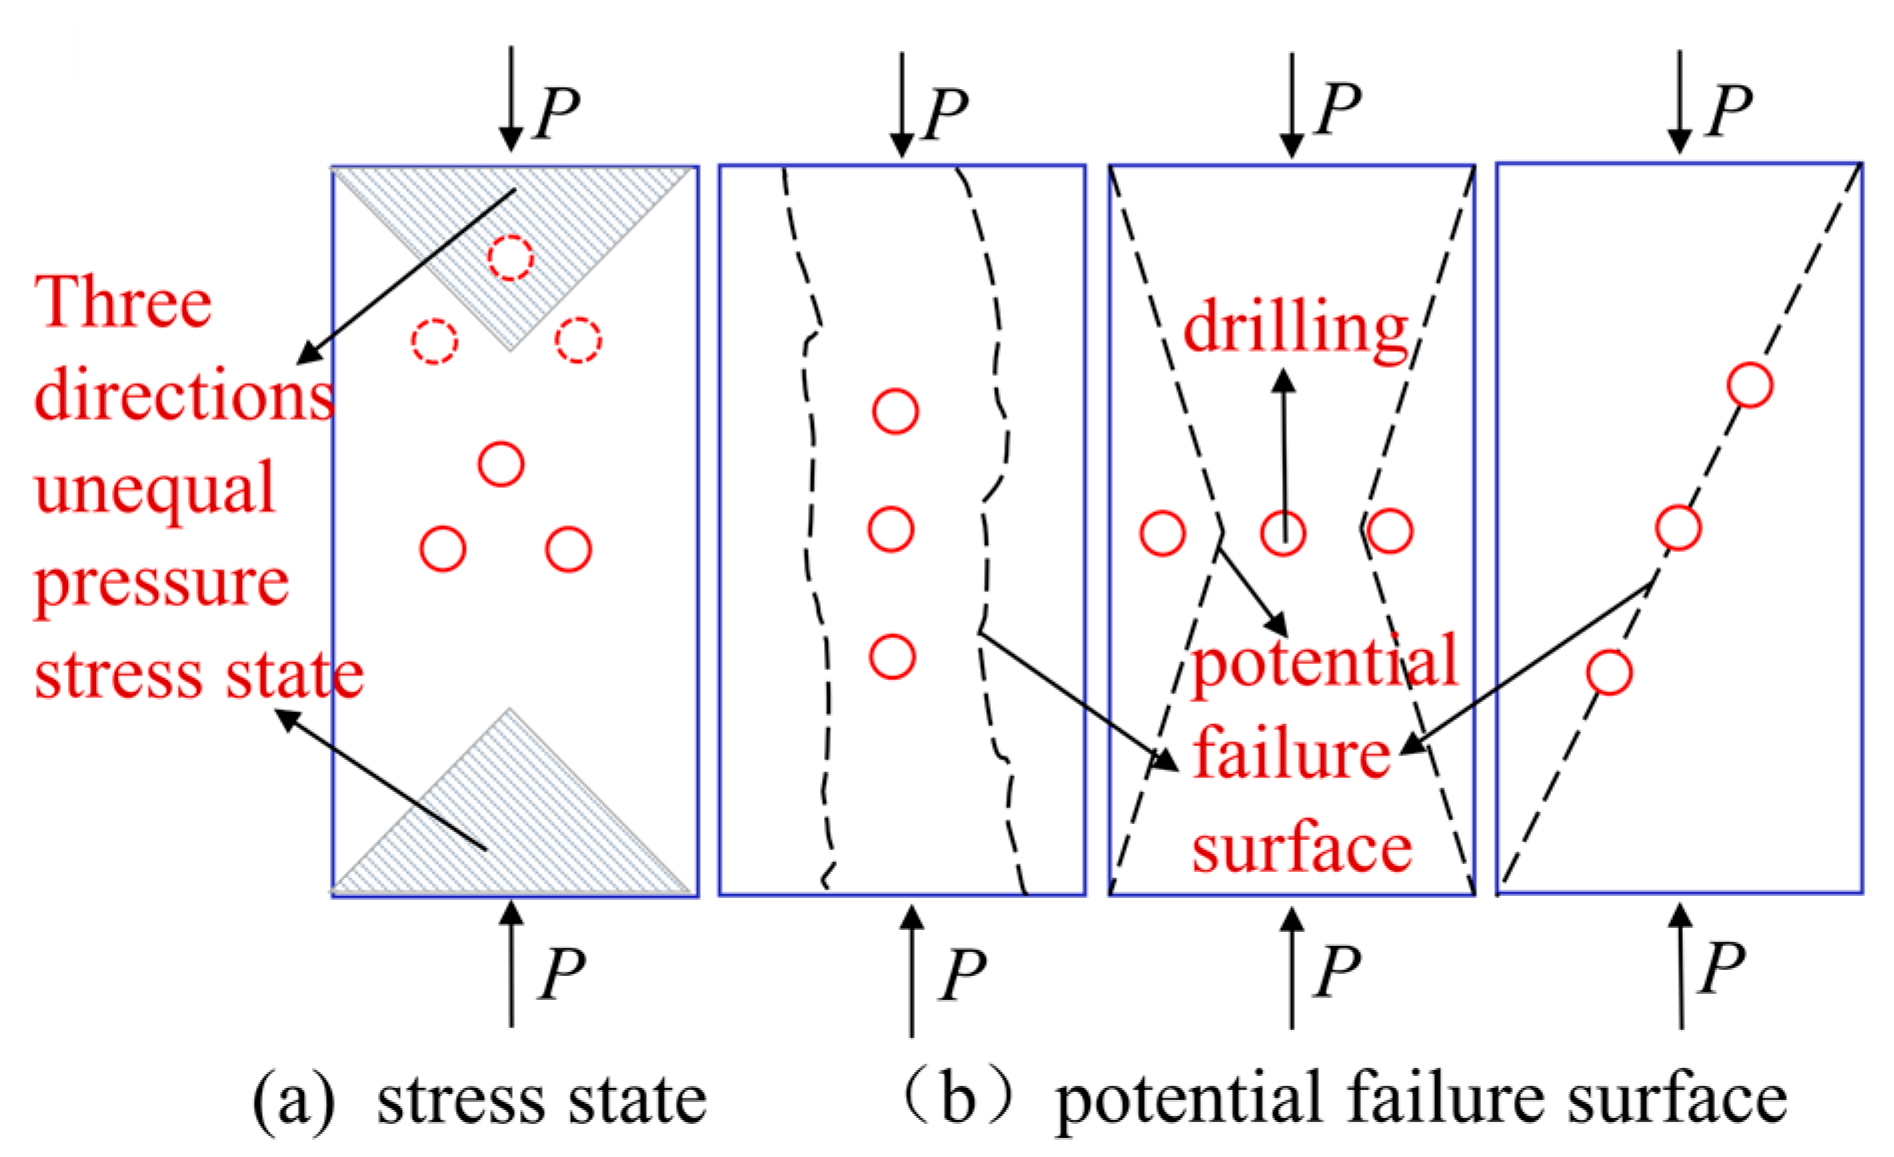
The existing research on the pressure relief effect of drilling on coal rock mainly focuses on drilling diameter and drilling layout. However, the selection and determination principles of other drilling parameters are not clear enough. The stress state distribution of the specimen and the relationship between the potential failure surface and drilling parameters in the uniaxial-compression process are ignored. And the relationship between the mechanical parameters of the specimen affected by drilling parameters, the failure mechanism and the evaluation of the pressure relief effect is unclear. Therefore, based on considering the stress state distribution and potential failure surface of the specimen during uniaxial compression, three kinds of drilling parameters, such as drilling layout, drilling spacing and drilling position, are studied in this paper, as shown in Figure 1. And the influence laws of mechanical parameters (peak strength, elastic modulus, peak strain), failure characteristics (crack distribution, failure mode, crack count), AE characteristics (ringing count, energy) and the energy evolution of specimens under different drilling parameters are obtained. The impact energy index, strength reduction index and energy dissipation index of the specimens under different drilling parameters are analyzed, and a new evaluation index (X) of the pressure relief effect is proposed according to these three indexes. The pressure relief effect under different drilling parameters is evaluated by using the value of X, and the best drilling parameter combination is obtained. The research results can serve as a valuable reference for selecting drilling parameters when implementing the drilling pressure relief with a large diameter in rock burst mines.
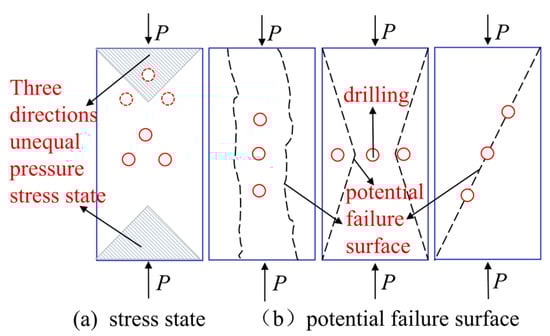
Figure 1.
Schematic diagram of the stress state and failure mode of rock in uniaxial compression test.
2. Specimen Preparation and Test Scheme
2.1. Specimen Preparation
The internal joints and cracks of raw coal specimens are significantly developed, and their mechanical properties are unstable. In order to reduce the influence of the defects of the specimens themselves on the experimental results, many researchers choose to use physically similar materials to cast specimens for experimental research. They chose α-type high-strength anhydrous gypsum: water = 1:0.4 as the material to pour the cuboid specimen with side lengths of 100 mm × 100 mm × 200 mm [25]. The specimen preparation process is shown in Figure 2.
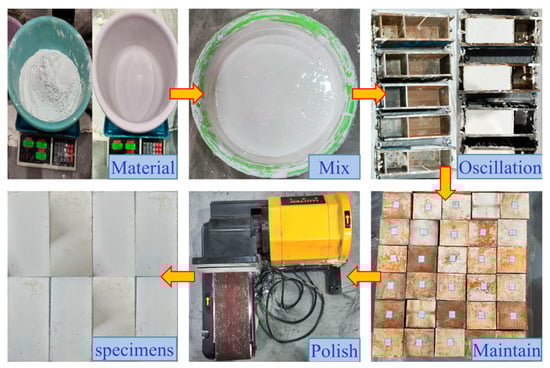
Figure 2.
The specimens preparation process.
The impact tendency indexes of the standard specimen was tested, and the results are shown in Table 1. It can be determined that the gypsum specimen has a strong impact tendency, and its mechanical properties are similar to those of strong-impact tendency coal rock, which can be used in the research of drilling pressure relief parameters.

Table 1.
Basic mechanical parameters and burst tendency indexes.
2.2. Test System
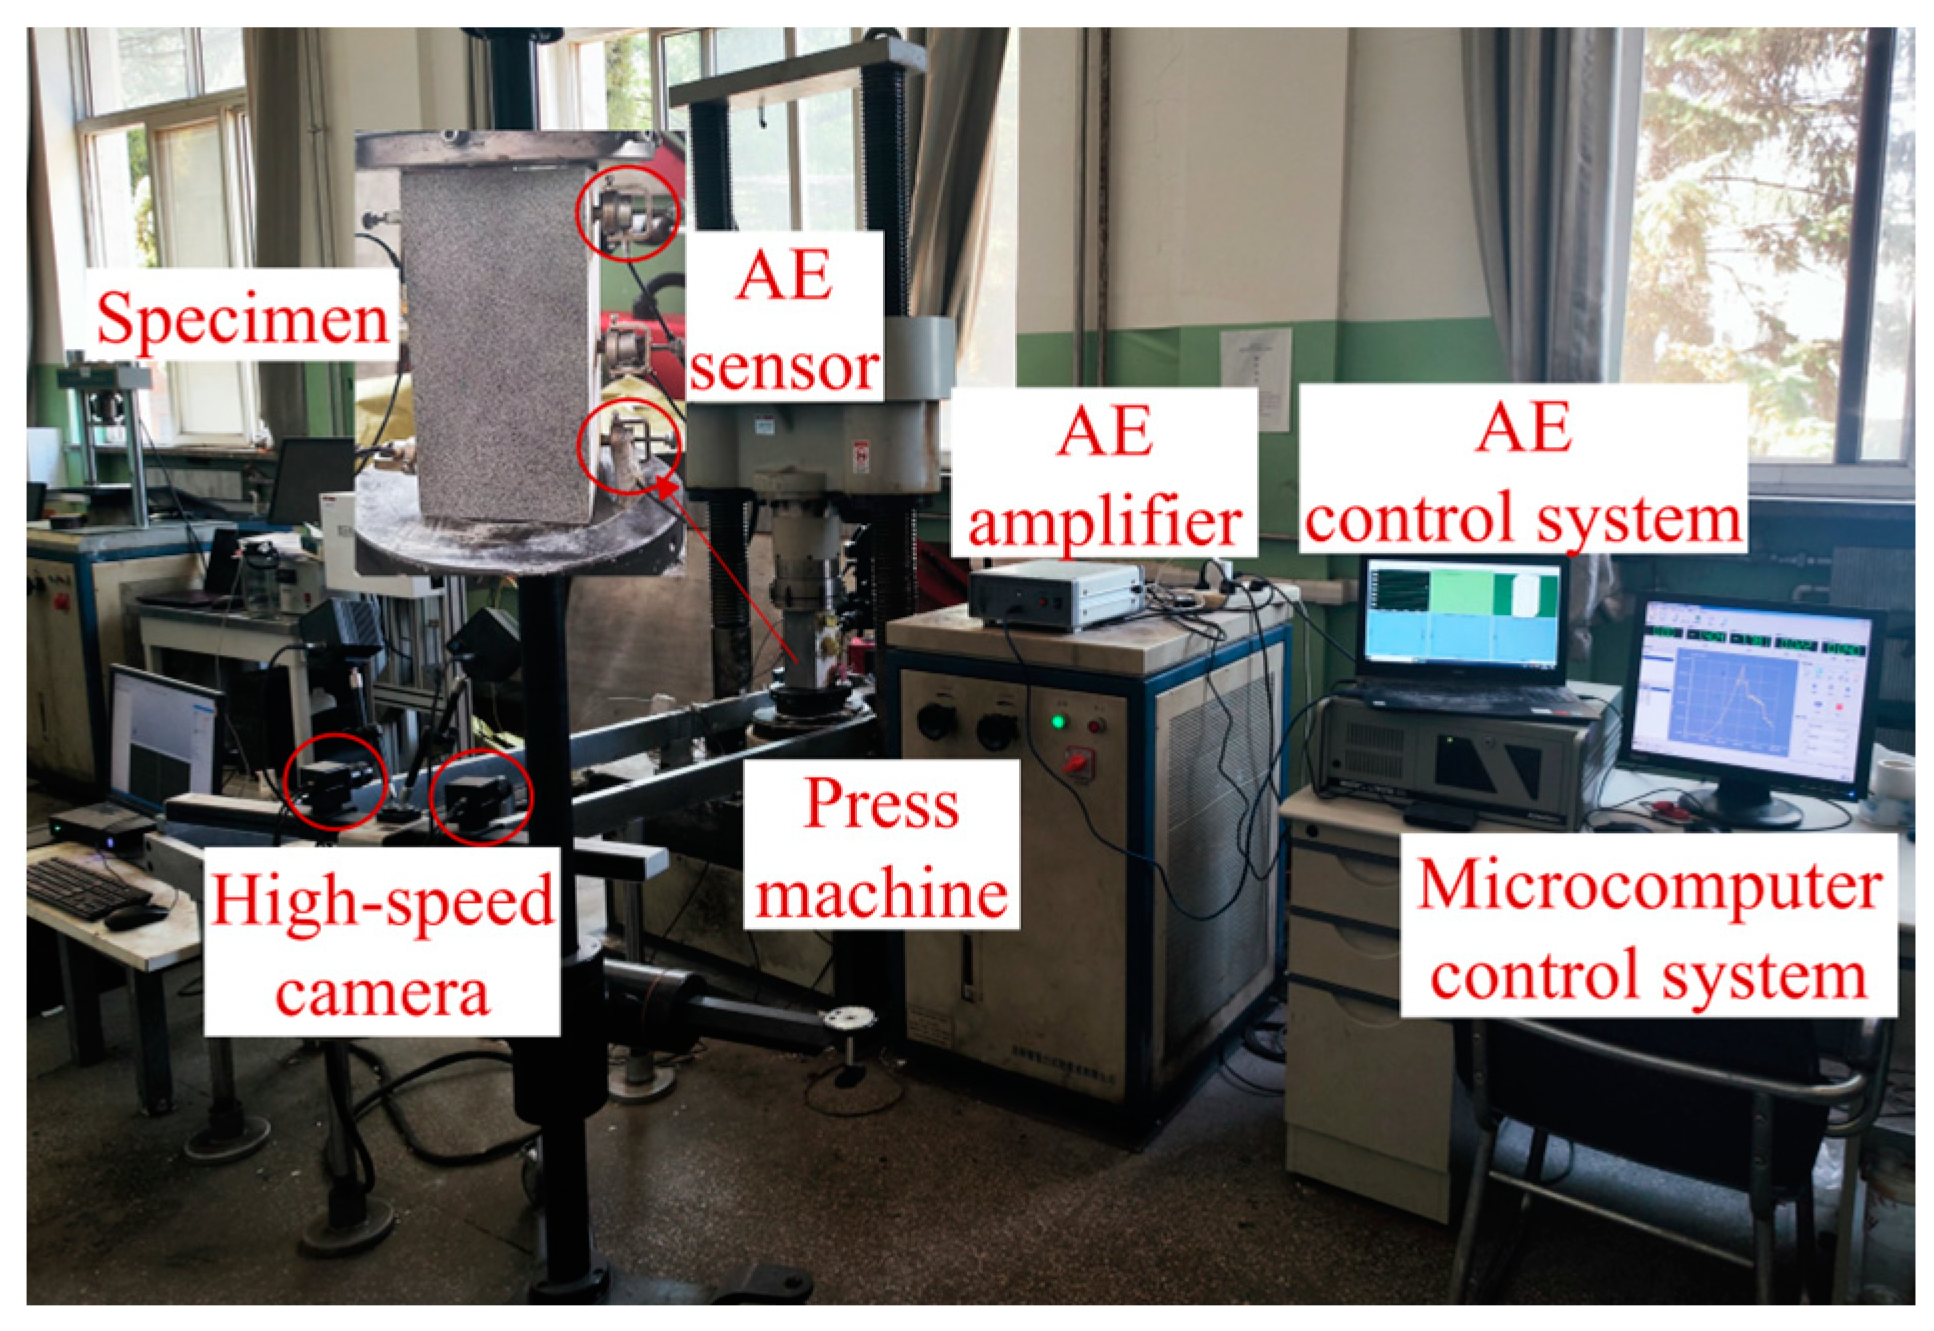
As shown in Figure 3, the test system consists of a microcomputer-controlled electro-hydraulic servo pressure test system, two high-speed cameras, and an acoustic emission acquisition and analysis system. The maximum static load that can be applied by this test system is 1000 kN. Two high-speed cameras were used to record the surface crack evolution process and fracture characteristics of the specimen. The camera resolution is 2448 × 2048 pixels, and the frame rate is up to 70 fps.
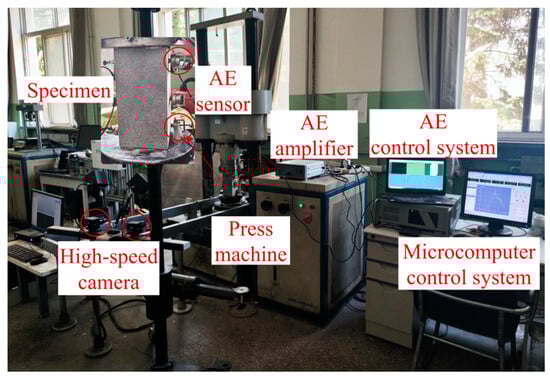
Figure 3.
Test system and equipment.
The DS5-8B acoustic emission acquisition and analysis system was used to record the acoustic emission characteristics data of the specimen during the loading process. The acoustic emission system is composed of an acoustic emission sensor, amplifier, automatic data acquisition system and analysis software. The diameter of the sensor is 18 mm, and the resonance frequency is 100~400 KHz. The loading method of the test is displacement control, and the loading speed is controlled at 2 × 10⁻³ mm/s.
2.3. Test Scheme
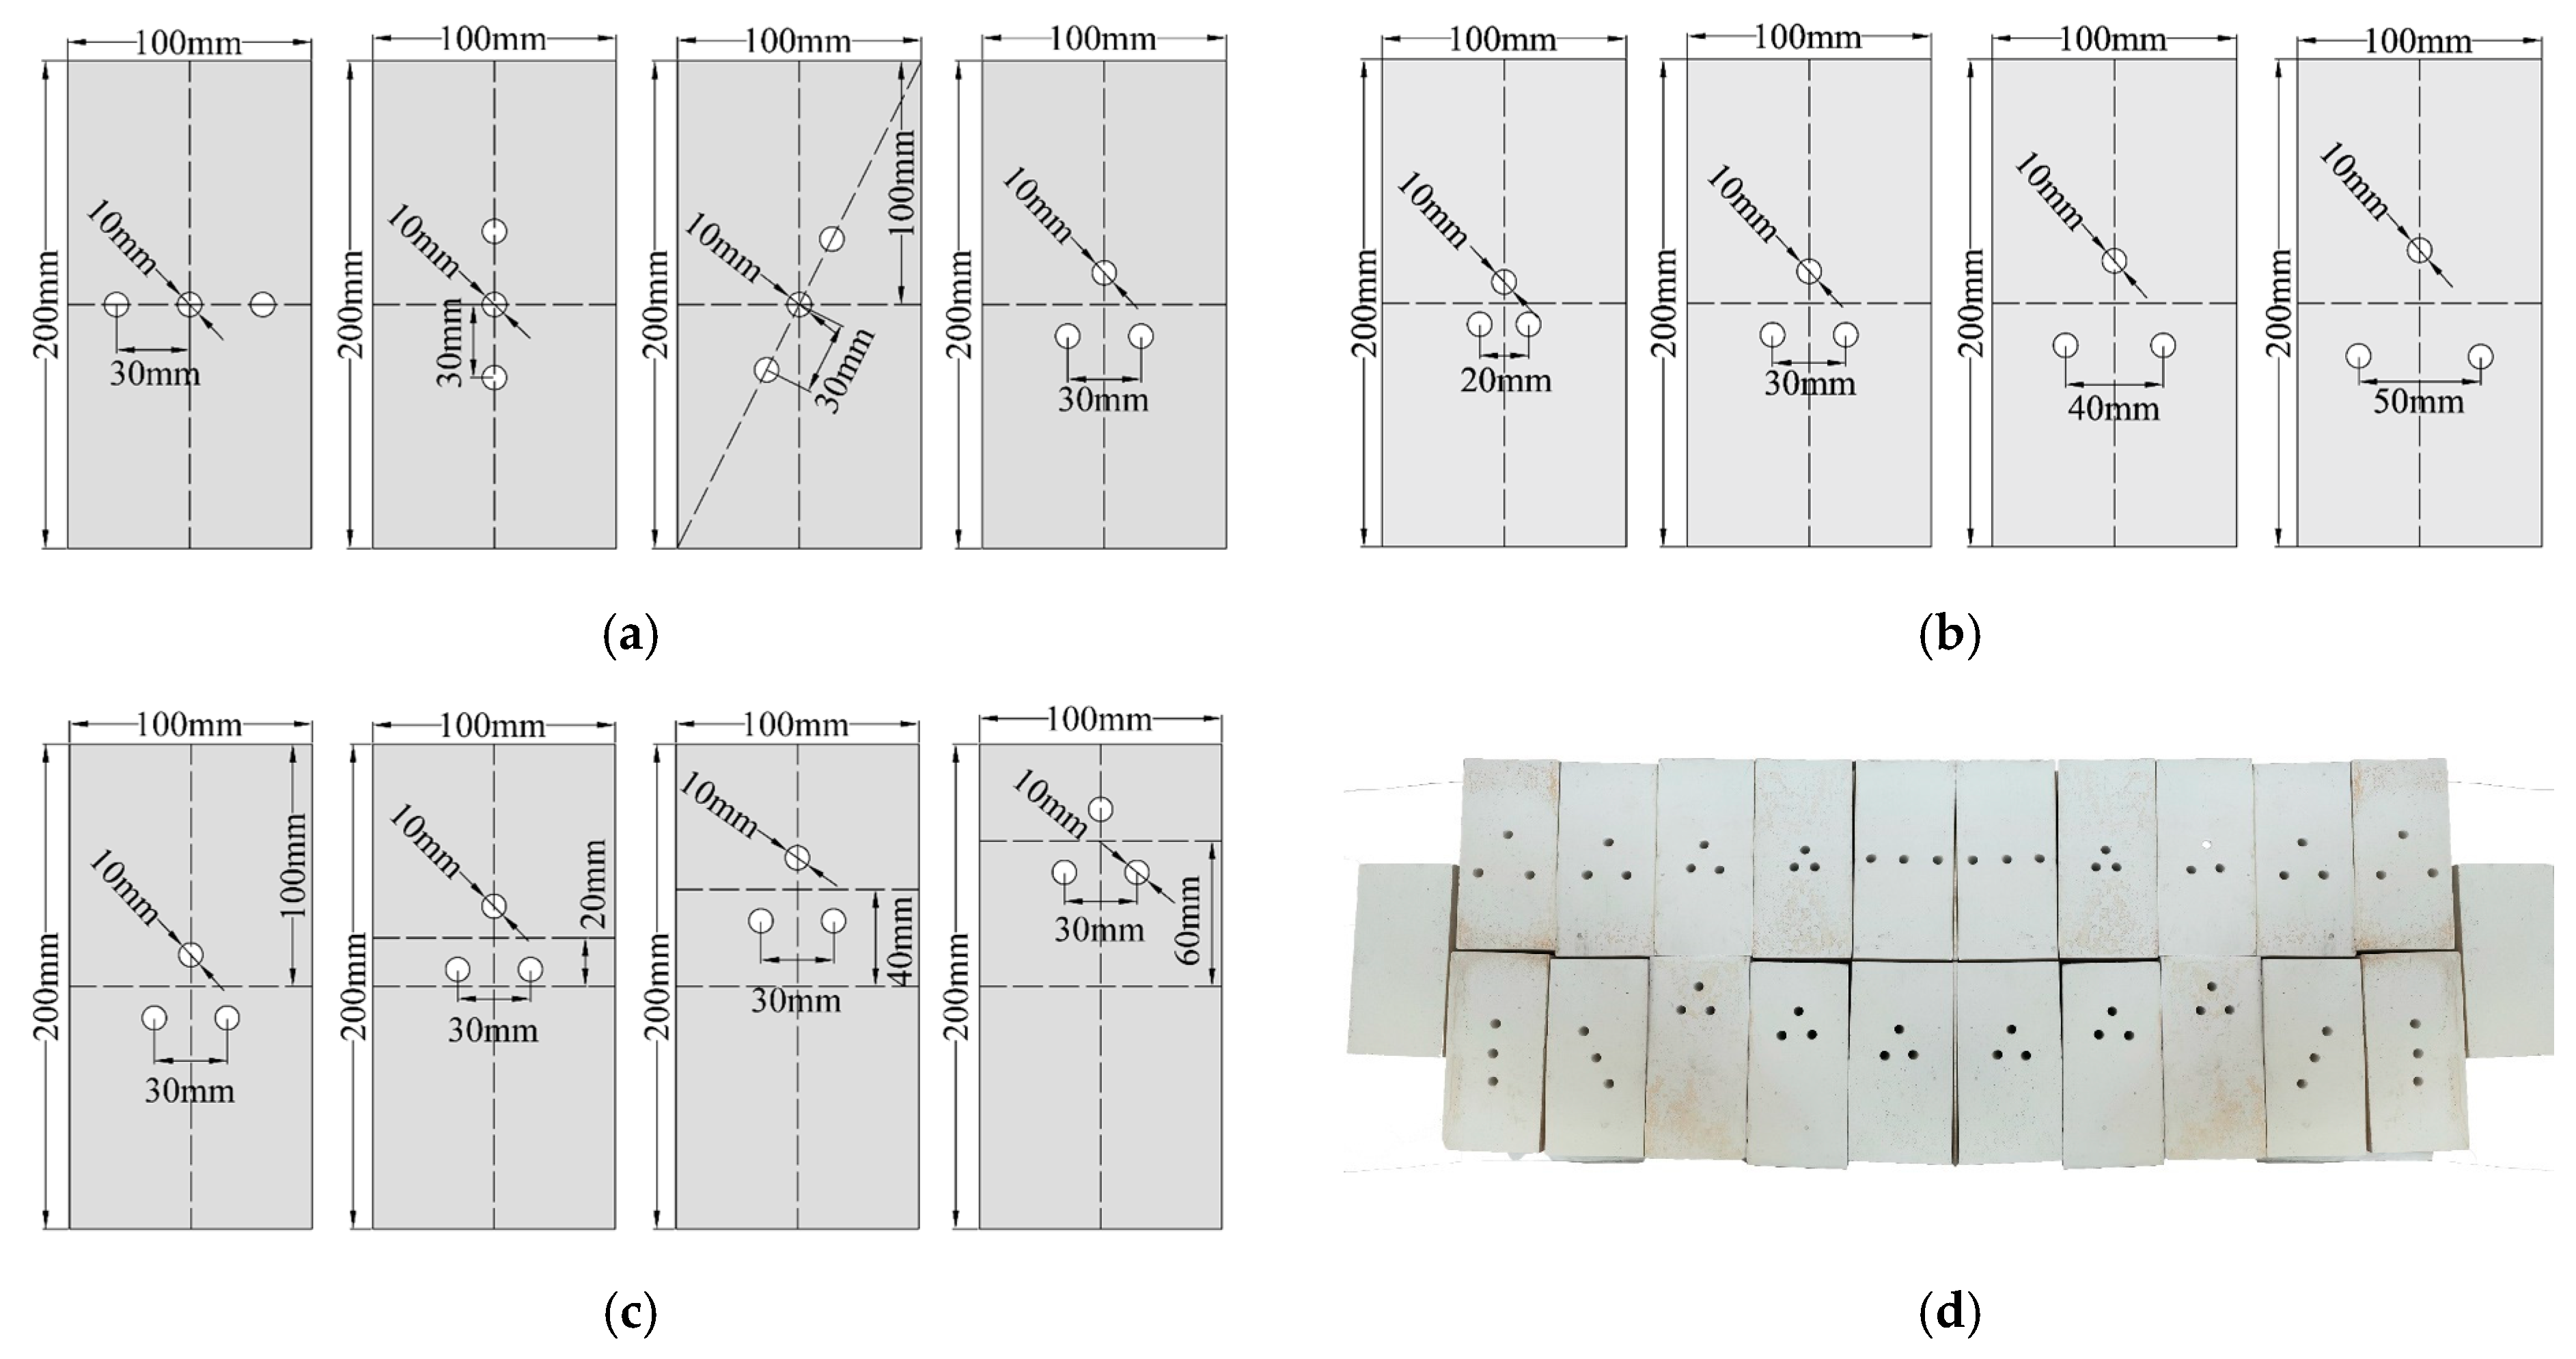
According to the index of the drilling diameter-to-specimen width ratio (D/W) [33], the drilling diameter was determined to be 10 mm. The drilling parameters studied in this experiment include drilling layout, drilling spacing and drilling position.
Therefore, the three groups of test schemes designed are shown in Table 2. The first group determined the optimal drilling layout; the drilling spacing and drilling position were fixed; and the drilling layouts were changed to intact (I), horizontal (H), triangular (T), diagonal (D) and vertical (V). The second group determined the drilling spacing, selected the best layout in the first group and kept the drilling position unchanged. The drilling spacing was 20 mm, 30 mm, 40 mm and 50 mm, corresponding to 2 times, 3 times, 4 times and 5 times the drilling diameter. The third group determined the drilling position, selected the optimal layout and spacing determined by the first two groups; took the middle of the specimen as the starting point; changed the spacing between the centroid of the triangular layout of the drilling and the reference line in the middle of the specimen; and set it at 0, 20, 40 and 60 mm. Therefore, specimen T30-0 is arranged in a triangular layout, the drilling spacing is 30 mm, and the drilling position is in the middle of the specimen. The drilling parameter settings and some specimens are shown in Figure 4. In order to ensure the accuracy of the test, three specimens were prepared for each drilling parameter combination.
Table 2.
Experimental scheme.
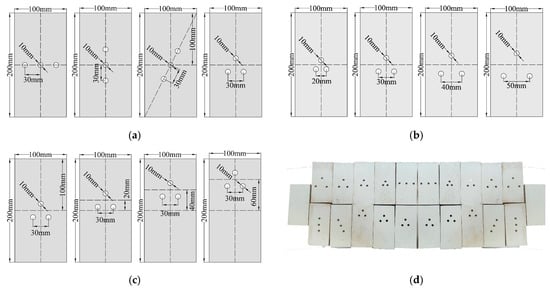
Figure 4.
Drilling parameter setting diagrams: (a) Drilling layout; (b) Drilling spacing; (c) Drilling position; (d) Partial finished specimens.
3. Experimental Results Analysis
3.1. Influence of Drilling Parameters on Mechanical Properties
3.1.1. Influence of Drilling Layouts on Mechanical Properties
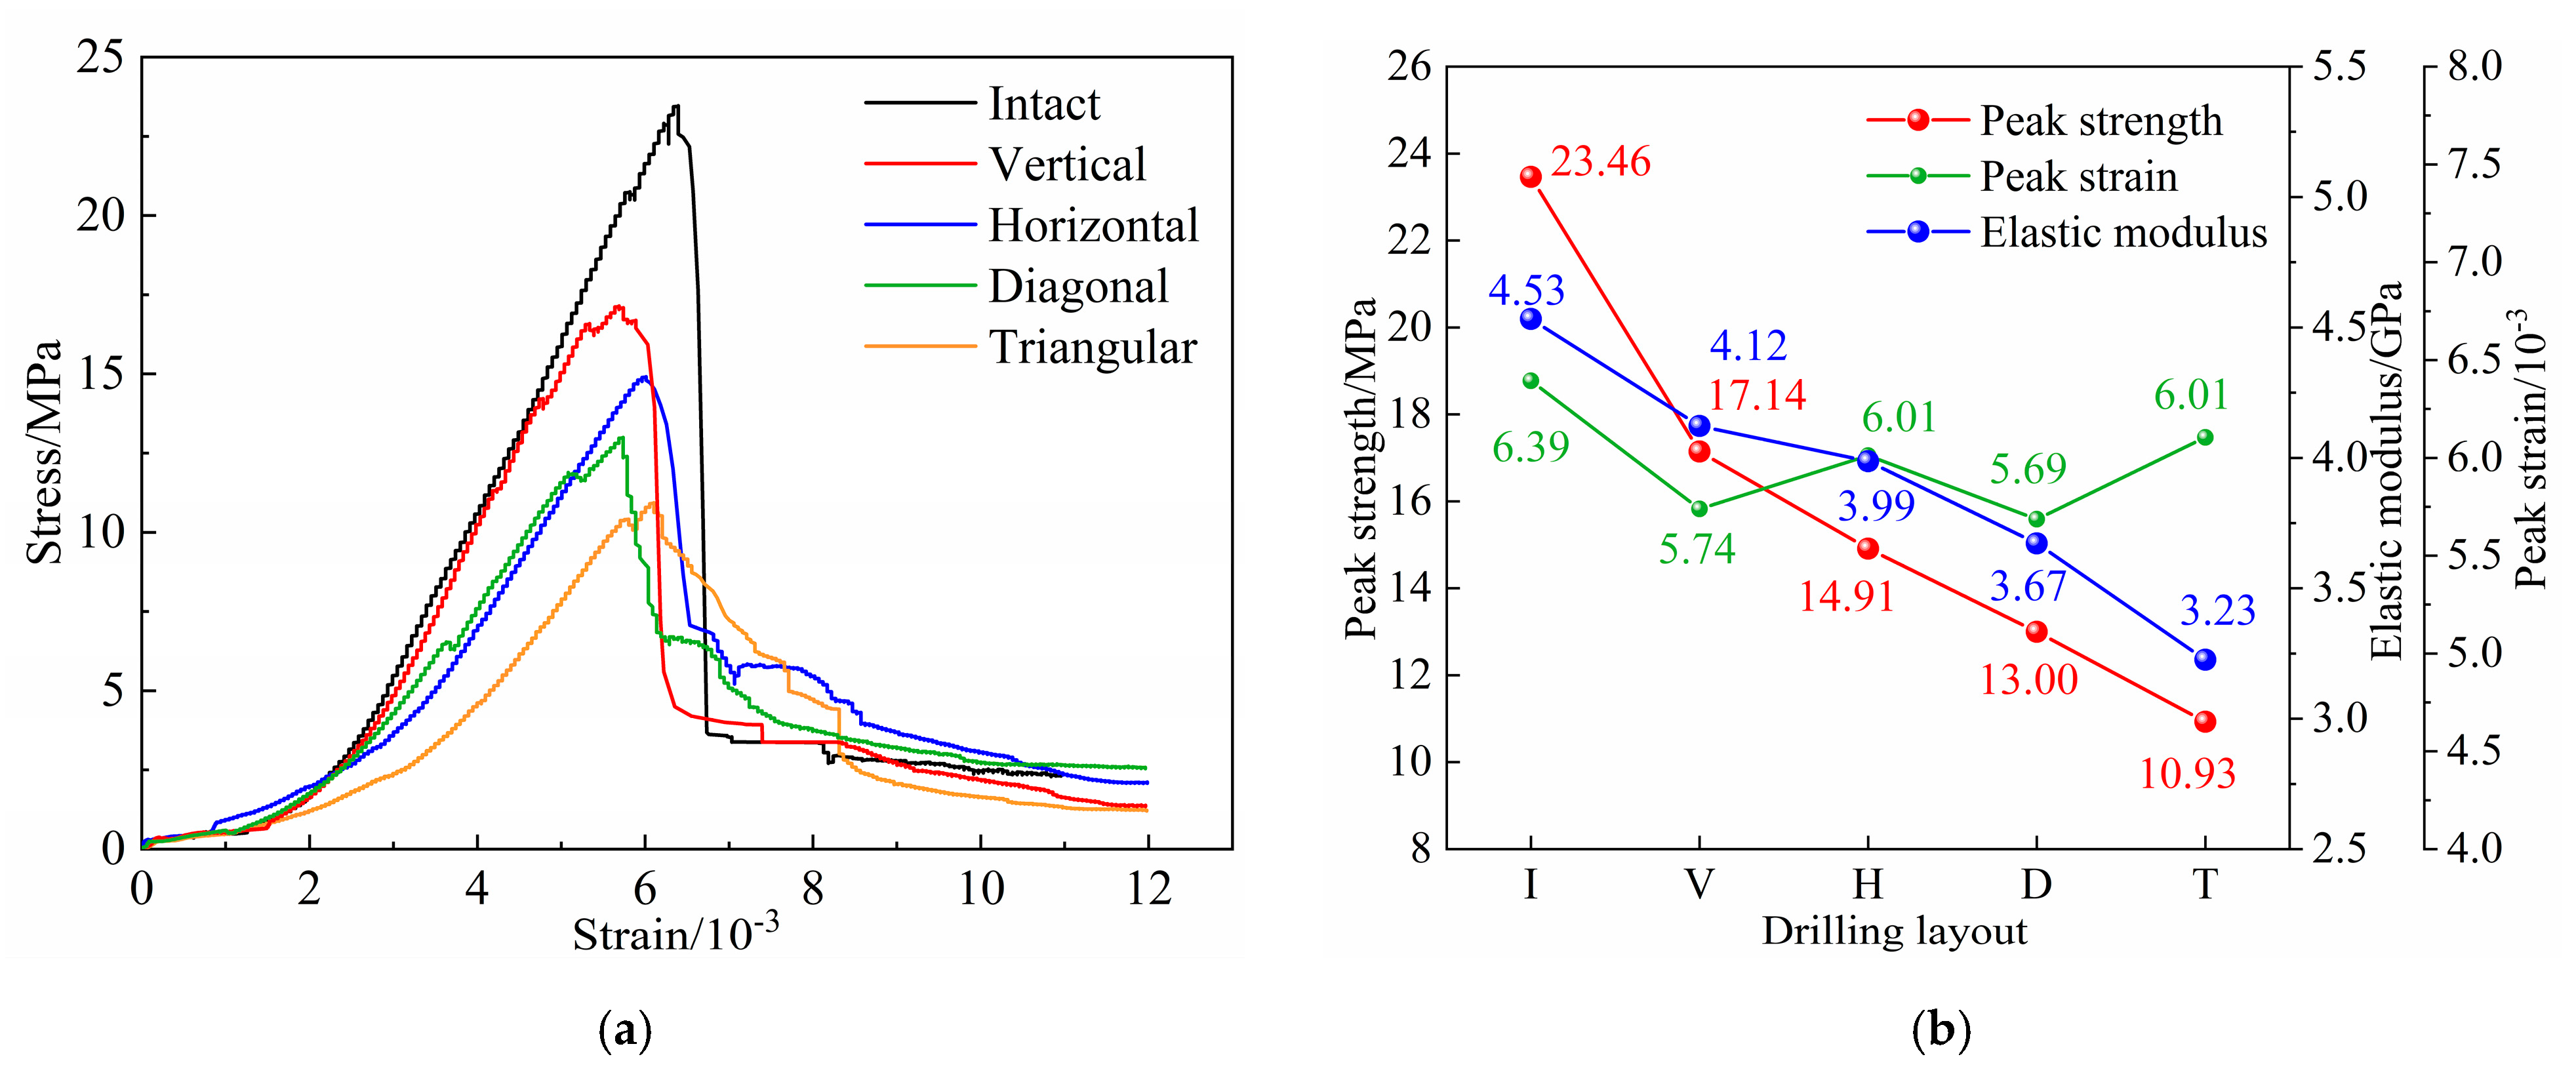
As shown in Figure 5a, the stress–strain curves of specimens with different drilling layouts were composed of four stages: the fracture compaction stage, the elastic deformation stage, the plastic deformation stage and the post-peak failure stage. It can be seen that the drilling layouts have an influence on the trend of the pre-peak curve and post-peak curve of the specimen. The pre-peak curve of the intact specimen and the vertical-layout drilling specimen increased rapidly. The pre-peak curves of the specimens with horizontal-layout, triangular-layout and diagonal-layout drilling become gentler successively. In the plastic deformation stage, the drilling specimens will demonstrate the phenomenon of stress reduction. The post-peak failure curves of both the intact specimen and the vertical-layout drilling specimen showed a rapid stress decline, showing the characteristics of brittle failure. However, the post-peak failure curves of horizontal-layout, triangular-layout and diagonal-layout drilling specimens changed from steep to gentle, and the triangular layout is the gentlest. It shows that different drilling layouts can effectively reduce the pre-peak energy accumulation capacity and post-peak energy release rate of specimens. And the triangular-layout drilling has the strongest ability to reduce energy accumulation.
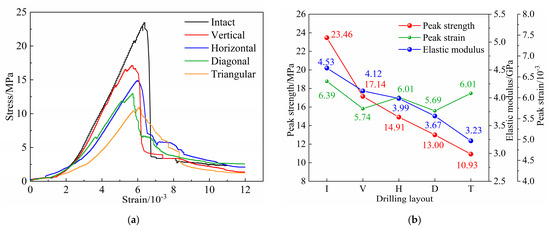
Figure 5.
Stress–strain curves (a) and mechanical parameters (b) of specimens with different drilling layouts.
As shown in Figure 5b, the drilling layout has a strong correlation with the peak strength and elastic modulus of the specimen, but has little effect on the peak strain of the specimen. The peak strength of the intact specimen is the highest, 23.46 MPa. The peak strength of drilling specimens with the vertical layout, horizontal layout, diagonal layout and triangular layout showed a decreasing trend, and were 17.14 MPa, 14.91 MPa, 13.00 MPa and 10.93 MPa, respectively. The elastic modulus of the intact specimen, vertical-layout, horizontal-layout, diagonal-layout and triangular-layout drilling specimen decreased from 4.53 GPa to 3.23 GPa, showing a decreasing tendency in sequence. The peak strength and elastic modulus are the smallest under triangular-layout drilling. This is due to the triangular-layout drilling having changed the stress distribution inside the specimen, and the stress concentration in the area around the drilling became more obvious, resulting in the initial initiation, development and penetration of cracks, and the formation of a large range of pressure relief areas in the middle of the specimen, resulting in the overall bearing capacity reduction [25].
3.1.2. Influence of Drilling Spacings on Mechanical Properties
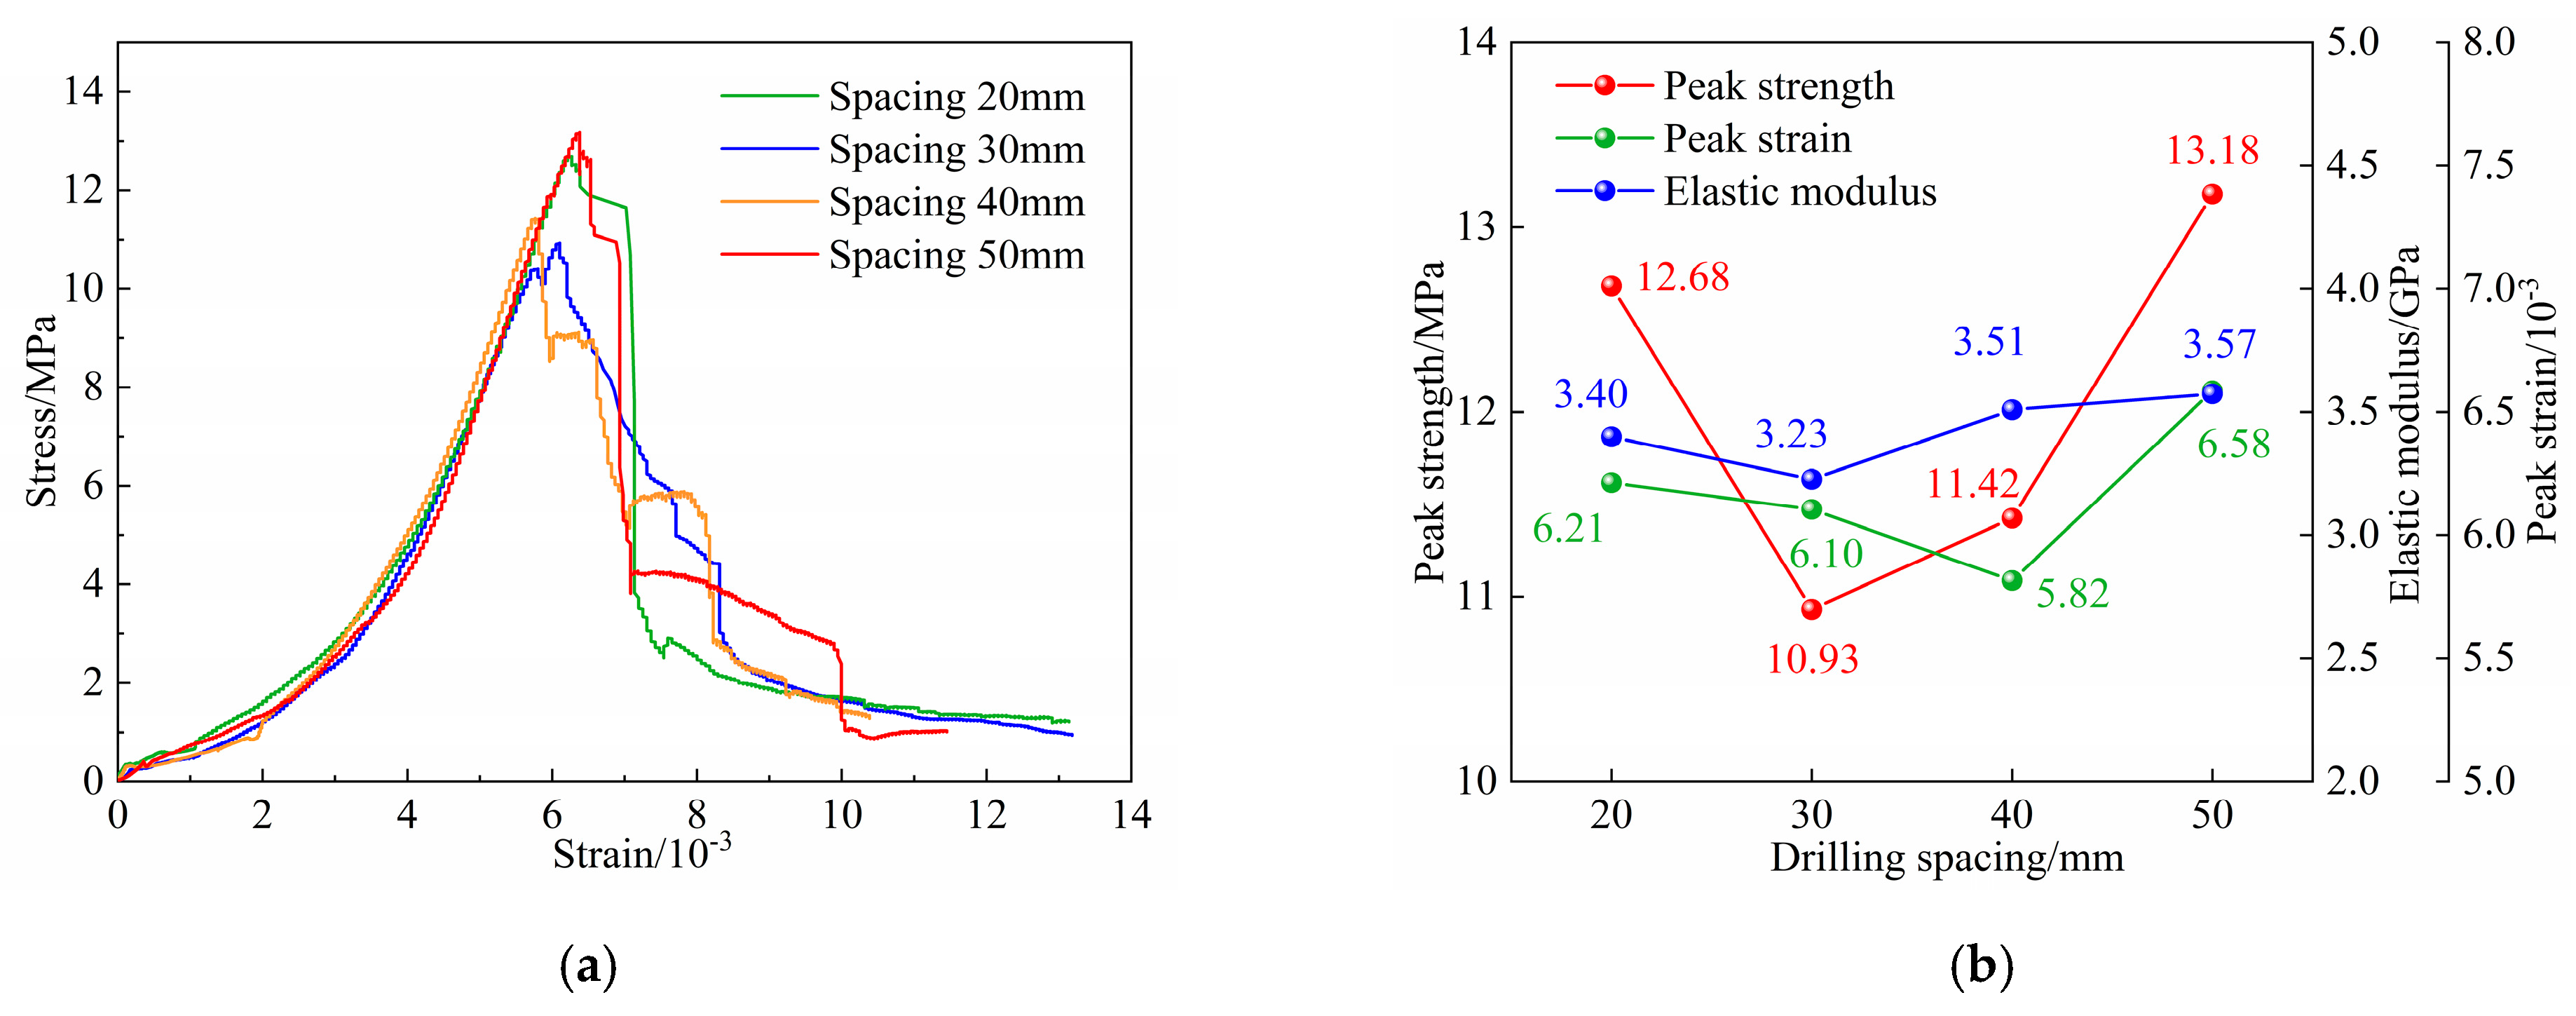
As shown in Figure 6a, the stress–strain curves of specimens with different drilling spacings were composed of four stages: the fracture compaction stage, the elastic deformation stage, the plastic deformation stage and the post-peak failure stage. It can be seen that the curve coincidence degree of specimens with different drilling spacings is higher in the crack compression stage and the elastic deformation stage, but the curve difference between the plastic deformation stage and the post-peak failure stage is large. With the increase in drilling spacing, the curve of the post-peak failure stage first becomes gentle and then steep, indicating that the post-peak energy release rate of the specimen also decreases first and then increases. The residual strength of the specimens is roughly the same.
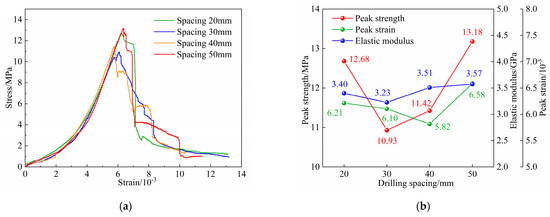
Figure 6.
Stress–strain curves (a) and mechanical parameters (b) of specimens with different drilling spacings.
As shown in Figure 6b, there is a significant correlation between drilling spacing and peak intensity. When the drilling layout drilling is the same, the peak strength decreases first and then increases with the increase in drilling spacing. When the drilling spacing is three times the drilling diameter, the peak strength is the smallest (10.93 MPa). This may be caused by the largest holes group’s linkage failure range of the specimen, whose drilling spacing is three times the drilling diameter. However, when the drilling spacing is more than three times the drilling diameter, the rock mass between the holes cannot be connected, resulting in the increase in the peak strength of the specimen. The change in the peak strain and elastic modulus is not obvious with the increase in drilling spacing.
3.1.3. Influence of Drilling Positions on Mechanical Properties
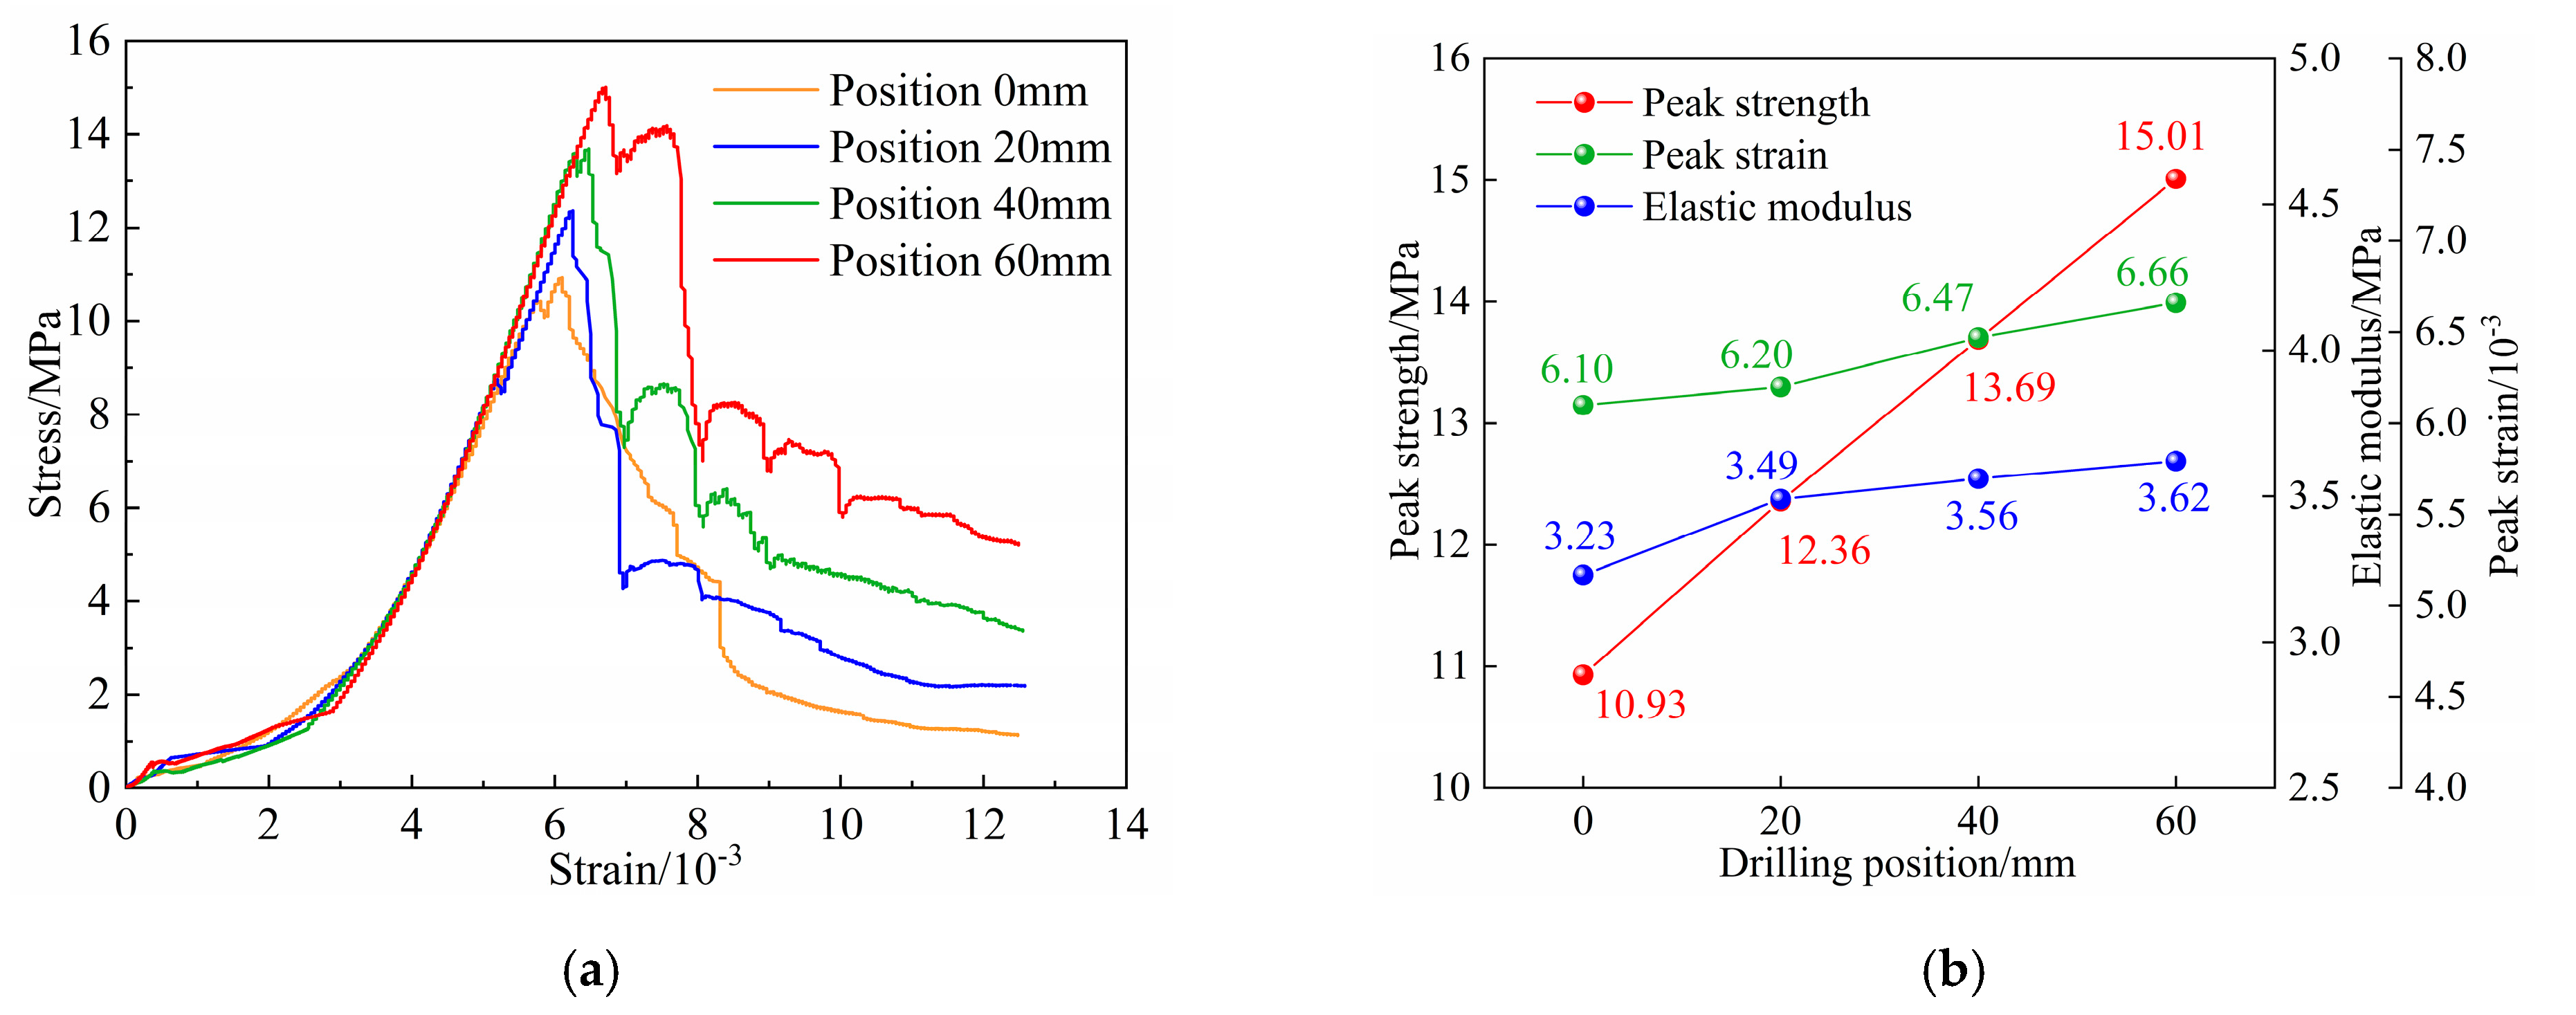
As shown in Figure 7a, the curve trend of specimens at different drilling positions under the fracture pressure tight stage and elastic deformation stage basically coincide. The change in drilling position has an obvious influence on the curve of the plastic deformation stage and post-peak failure stage. With the upward movement of the drilling position, the plastic deformation stage appears more and more late, and the curve of the plastic deformation stage is not obvious. With the upward movement of the drilling position, the trend of the post-peak curve becomes steeper obviously, indicating that the post-peak energy release rate of the sample is increasing. With the upward movement of the drilling position, the residual strength of the specimen increases gradually.
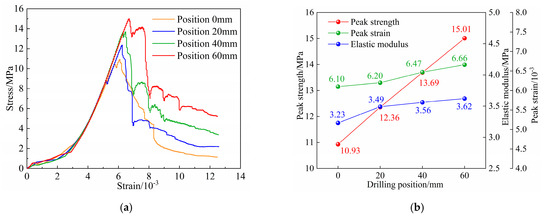
Figure 7.
Stress–strain curves (a) and mechanical parameters (b) of specimens with different drilling positions.
As shown in Figure 7b, there is a certain correlation between peak strength and drilling location. With the upward movement of the drilling position, the peak strength gradually increased to 10.93 MPa, 12.36 MPa, 13.69 MPa and 15.01 MPa, in that order. The peak strength is minimum when the drilling position is in the middle of the specimen, which may be caused by the maximum damage to the specimen by drilling in the middle position. The peak strain and elastic modulus are basically unchanged as the drilling position moves upward.
3.2. Influence of Drilling Parameters on Failure Characteristics of Specimens
3.2.1. Failure Characteristics Analysis of Specimens with Different Drilling Layouts
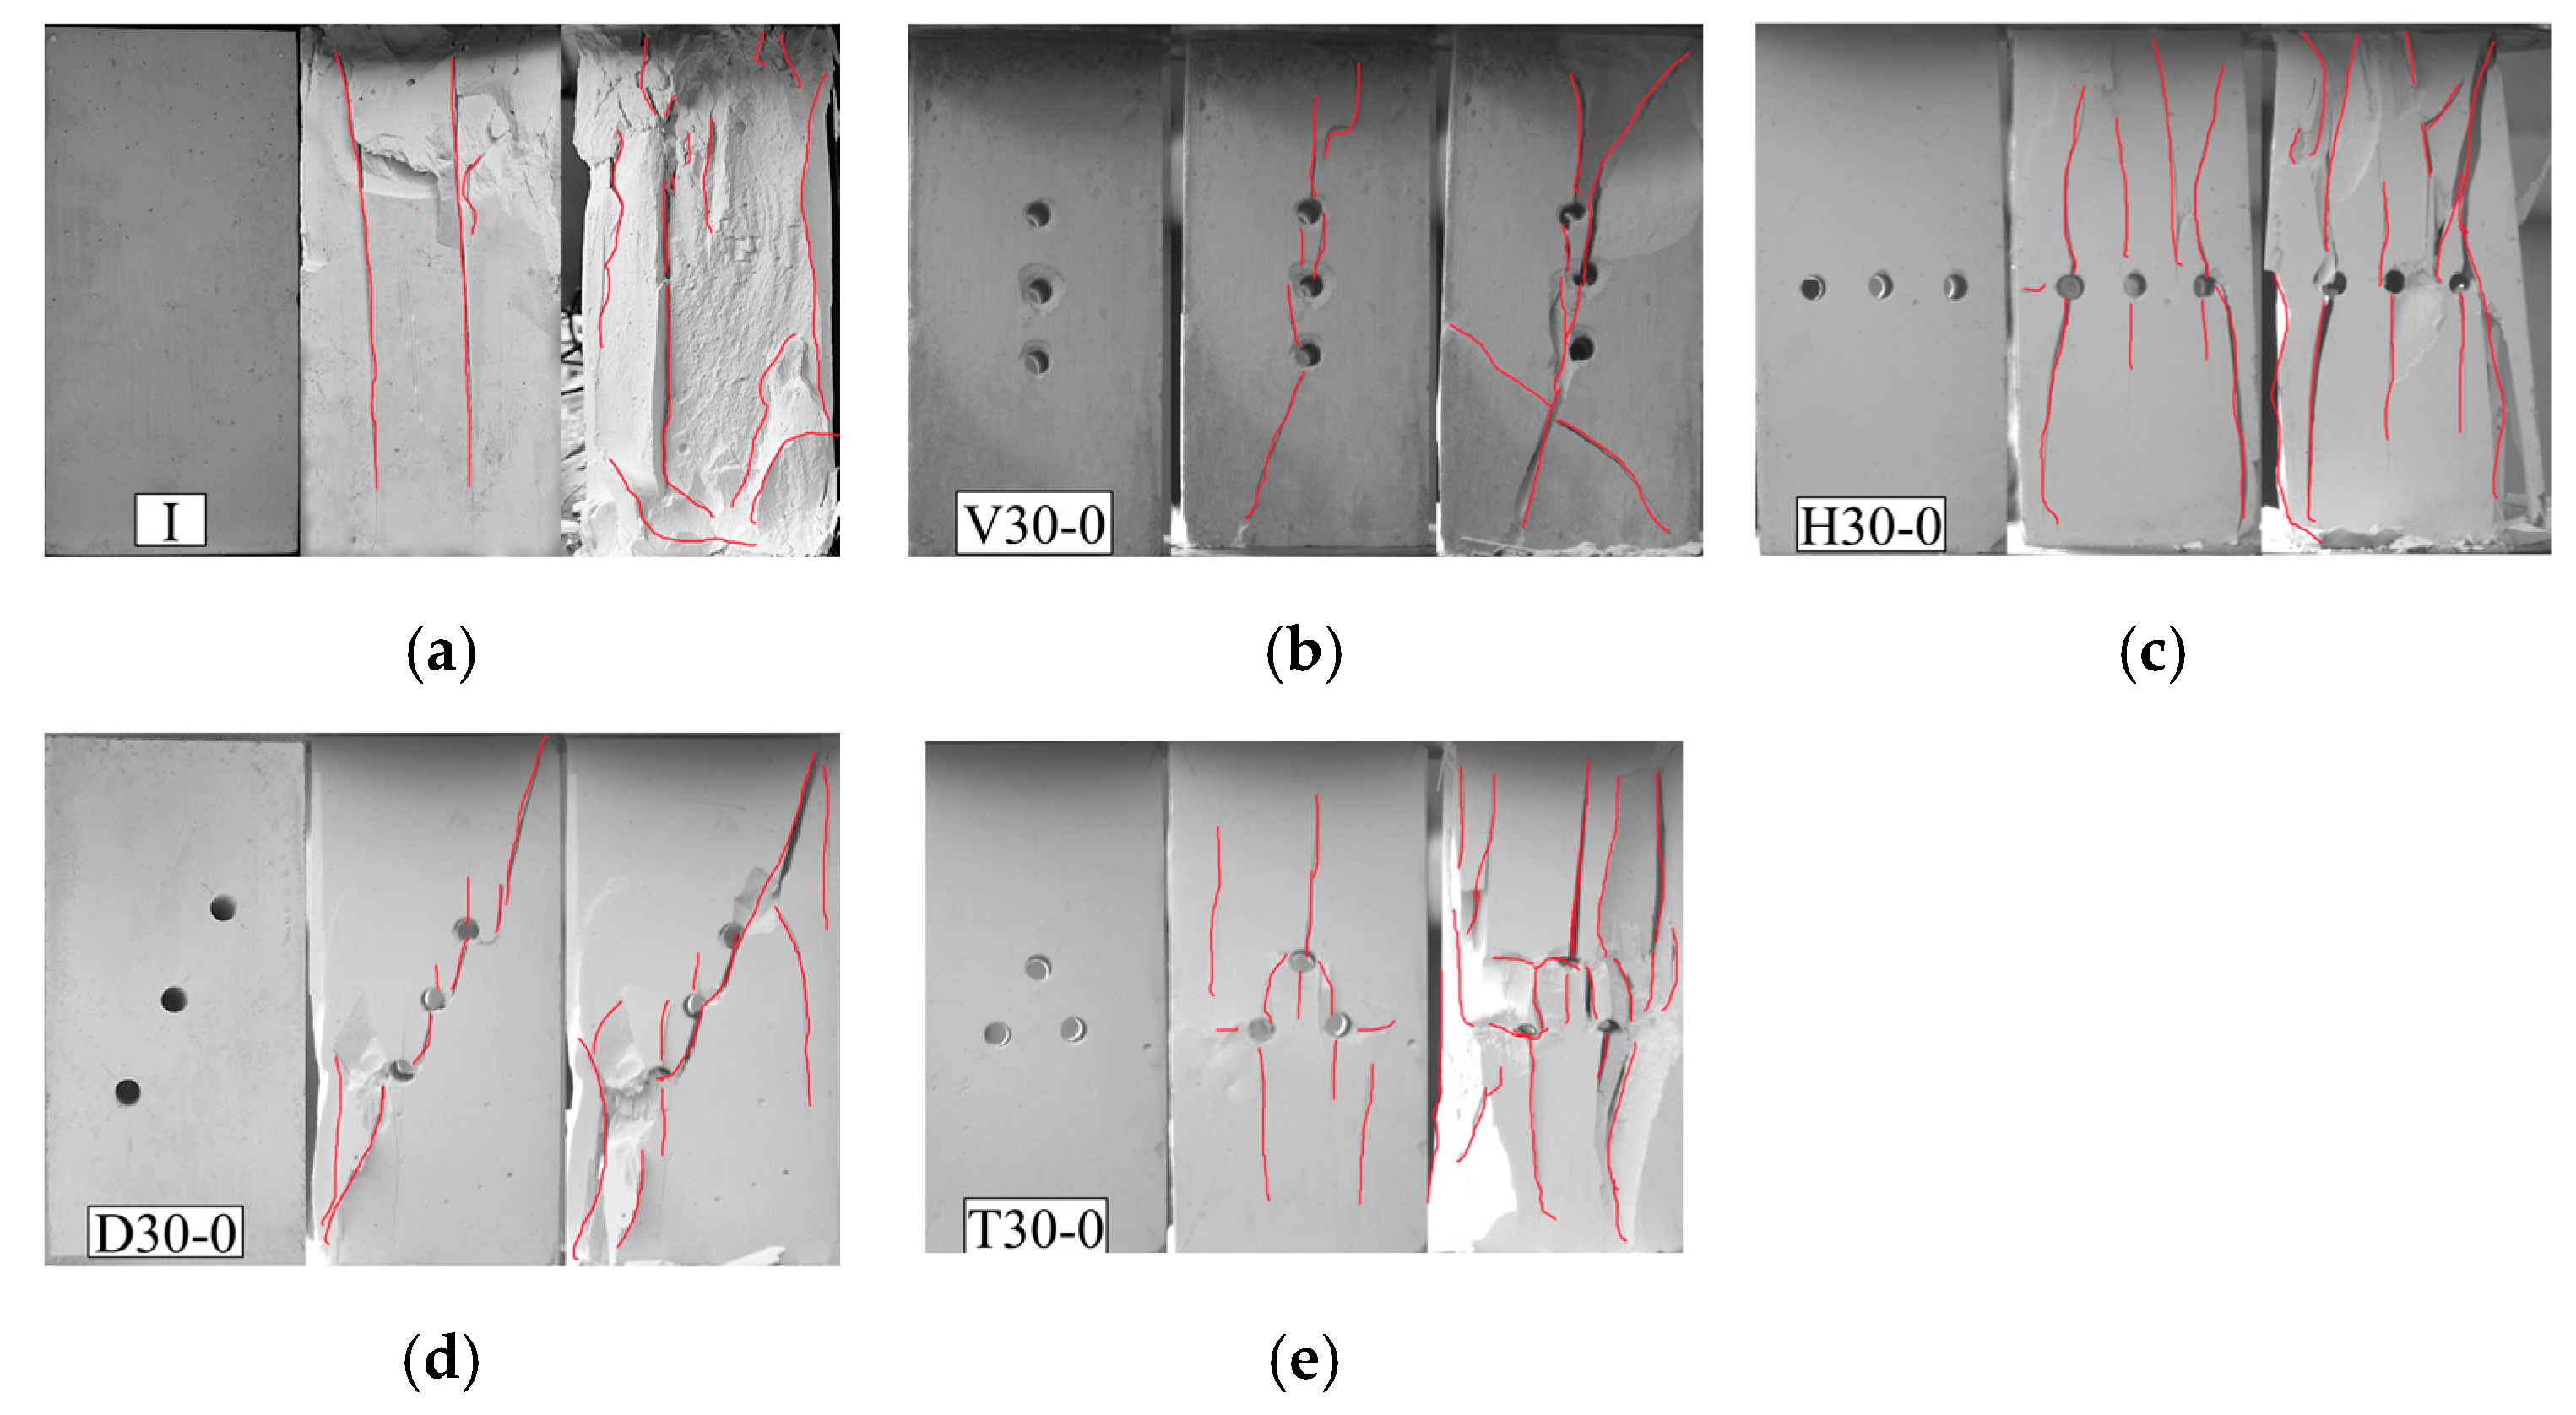
The shape of the specimens before and after the failure of the specimens with different drilling layouts is shown in Figure 8. Under axial compressive stress, the Poisson effect causes radial tensile stress in the intact specimen (Figure 8a), which results in the vertical distribution of surface failure cracks, showing a tensile failure mode caused by tensile stress. The surface of the specimen was spalling, a large amount of fragment was ejected, and the specimen was finally destroyed.
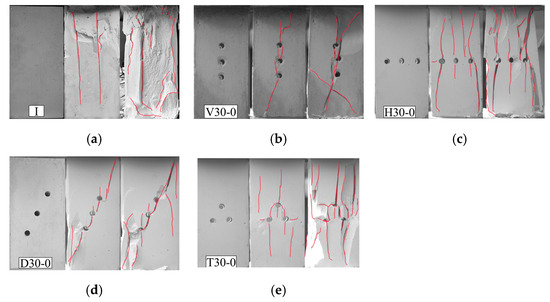
Figure 8.
Surface failure diagrams of specimens with different drilling layouts: (a) Intact; (b) V30-0; (c) H30-0; (d) D30-0; (e) T30-0.
For drilling specimens, under uniaxial compression, obvious stress concentration occurs around the borehole [34]. Compressive stress is applied to the left and right sides of the drilling, and its magnitude is three times that of the applied stress. The tensile stress of the upper and lower ends is equal to the applied stress, but the tensile strength of the specimen is much smaller than the compressive strength. Therefore, different drilling specimens first produce tensile cracks at the upper and lower ends of the drilling, and then other cracks appear on the left and right sides [10,11].
Different drilling layouts will form different weak-strength surfaces in the specimen, which will guide the crack propagation and lead to different failure modes of the specimen. The vertical-layout drilling specimen (Figure 8b) formed a weak-strength surface on the central axis of the specimen, has a strong tensile stress zone along the axial direction, and the cracks are mainly tensile cracks. The tensile crack penetrated through the vertical drilling to form a vertical pressure relief zone, resulting in the macroscopic failure mode of the specimen being tensile failure. There was strong compression interaction between the holes of the specimen with horizontal-layout drilling (Figure 8c), and basically no cracks occurred on the left and right sides of the drilling, but only on the upper and lower ends of the drilling. Although the horizontal-layout drilling formed a horizontal weak-strength surface in the middle of the specimen, the linkage failure could not be formed between the drillings. The cracks at the upper and lower ends continued to develop and form macroscopic cracks, resulting in the macroscopic failure mode of the specimen being an X-conjugated inclined-plane shear failure. Diagonal-layout drilling specimens (Figure 8d) artificially form a weak-strength surface in the diagonal direction of the specimen, resulting in strong tensile interaction along the diagonal direction. The shear stress is the largest in the diagonal direction of the drillings, so the cracks eventually penetrate along the diagonal direction of the drillings, forming a diagonal pressure relief zone, and the final failure mode of the specimen is single-inclined-plane shear failure. The drilling pressure relief zones of the triangular-layout drilling specimen (Figure 8e) overlap each other, thus forming a weak-strength area in the middle of the specimen. With the further increase in axial stress, tensile cracks and shear cracks are fully developed in this area, and the drillings are connected with each other. In the middle of the specimen, a large range of drilling pressure relief zone is formed, resulting in the final failure mode of the specimen being tensile shear mixed failure.
3.2.2. Failure Characteristics Analysis of Specimens with Different Drilling Spacings
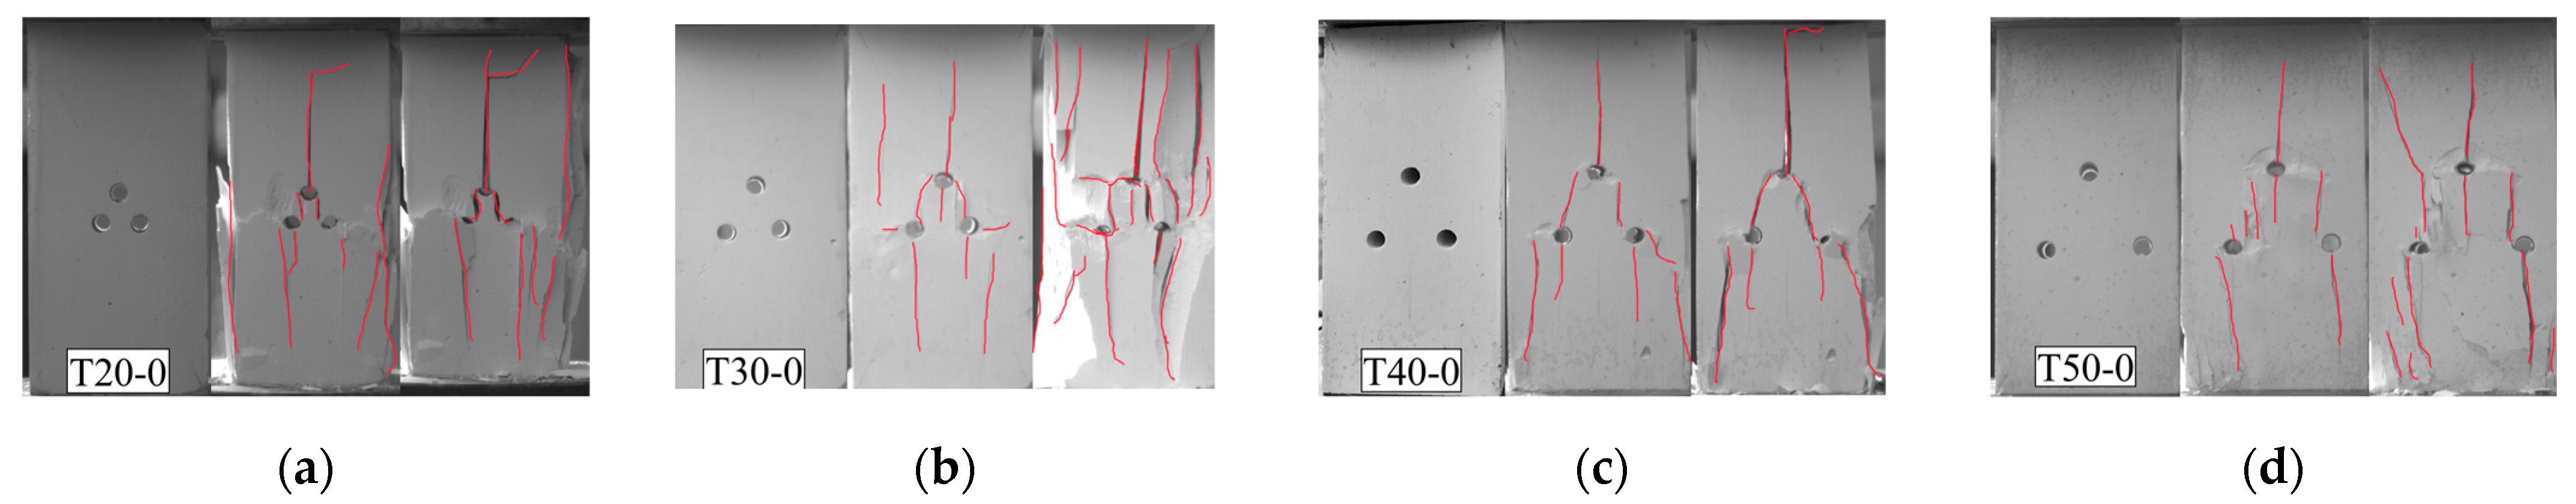
The surface failure of specimens with different drilling spacings is shown in Figure 9. The failure patterns of specimens with different drilling spacings can be divided into three categories: (1) Through-type failure: when the drilling spacing is small, it is easy to occur through-type failure; the specimens with a drilling spacing of 20 mm and 30 mm belong to this failure. The debris spalling on the surface of the specimen was obvious, and the secondary shear cracks developed and expanded around the boreholes, thus connecting the surrounding rock between the three boreholes. Finally, a large drilling pressure relief zone appeared in the middle of the specimen, resulting in a decrease in the bearing capacity of the specimen. (2) Independent-through-transitional-type failure: the failure mode of specimens with 40 mm drilling spacing belongs to this failure. The shear cracks between the boreholes were basically through, the tensile cracks in the lower two boreholes were not obvious, the debris spalling on the surface of the specimen was not obvious, and the middle area of the three boreholes was basically intact. (3) Independent-type failure: when the drilling spacing is large, it is easy to occur independent-type failure; the specimen with 50 mm drilling spacing belongs to this failure. Due to the large spacing between the boreholes, the interaction between the boreholes is weakened, and the stress state is gradually close to three independent boreholes. Although the specimen surface also showed the phenomenon of debris spalling, the cracks generated around the boreholes could not penetrate each other.
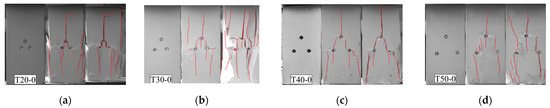
Figure 9.
Surface failure diagrams of specimens with different drilling spacing: (a) T20-0; (b) T30-0; (c) T40-0; (d) T50-0.
By comparing the four subfigures in Figure 9, it can be seen that the drilling spacing affects the interaction between boreholes, thus affecting the crack growth and failure mode of the specimen, and then affecting the failure degree and bearing capacity of the specimen.
3.2.3. Failure Characteristics Analysis of Specimens with Different Drilling Positions
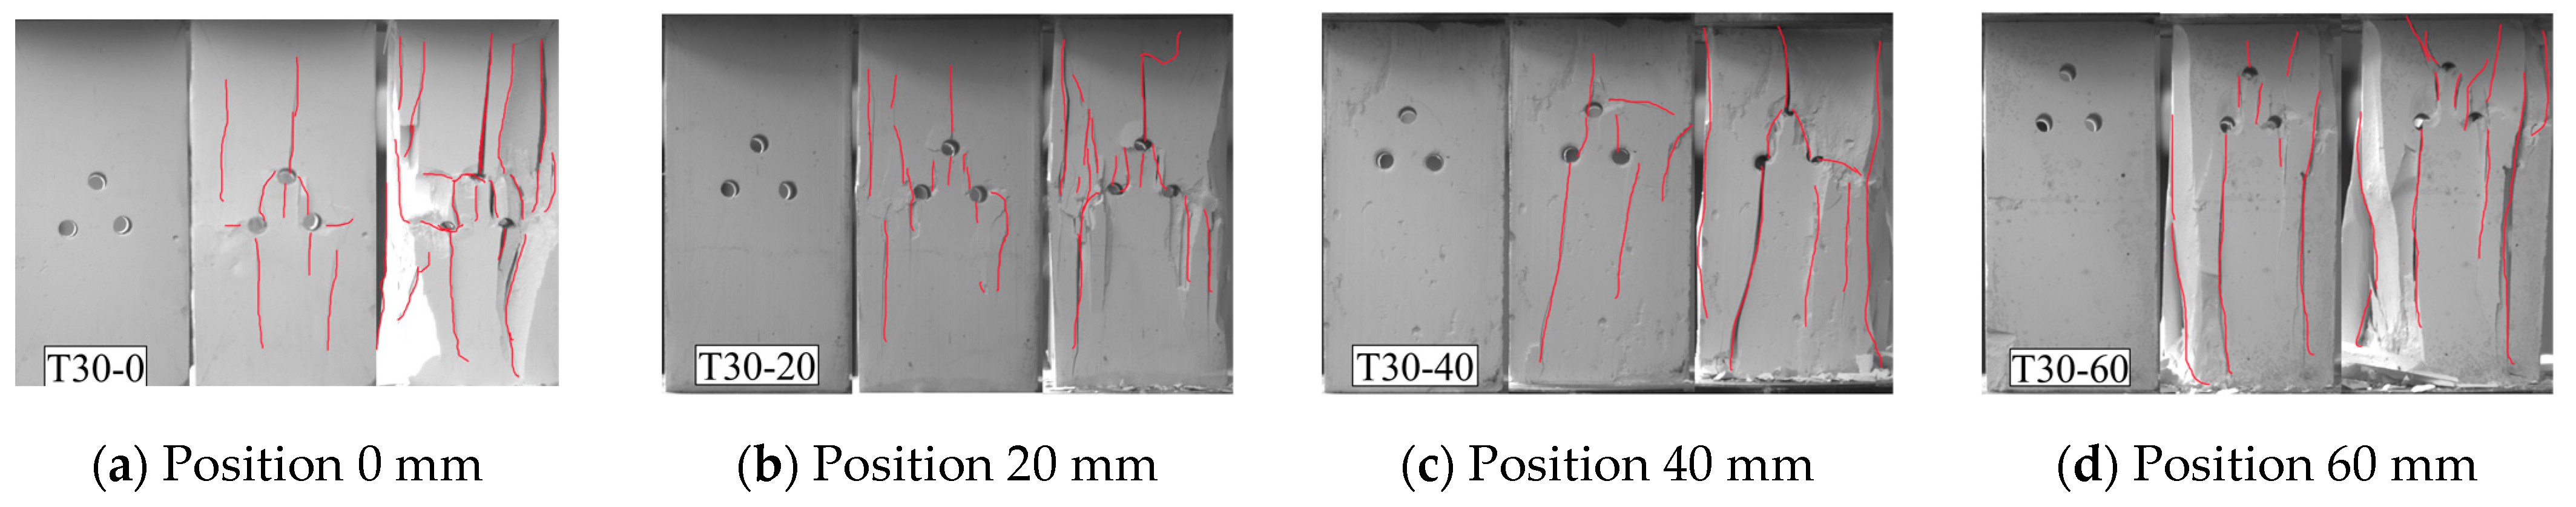
The surface failure of specimens with different drilling positions is shown in Figure 10. The drilling position has little effect on the failure form of the specimen. The closer the drilling position is to the middle of the specimen, the greater the overall damage degree of the specimen and the lower the peak strength of the specimen. This may be due to the following reasons: (1) During the loading process, the stress distribution inside the specimen will affect the stress concentration around the drilling hole, thus affecting the failure pattern and strength characteristics of the specimen. When the drillings are placed in the upper part of the specimen, the load around the drilling is higher, the crack propagation is limited, and the peak strength of the specimen is increased. (2) The location of drillings also has a certain effect on crack propagation. When the drillings are arranged in the middle area of the specimen, the crack growth can affect the whole structure of the specimen to the greatest extent, and the damage degree of the specimen is the greatest.
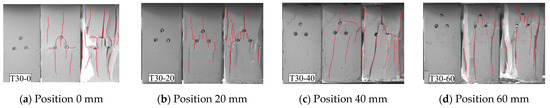
Figure 10.
Surface failure diagrams of specimens at different drilling positions: (a) T30-0; (b) T30-20; (c) T30-40; (d) T30-60.
3.3. Influence of Drilling Parameters on Acoustic Emission Characteristics of Specimens
3.3.1. Acoustic Emission Characteristics of Specimens with Different Drilling Layouts
AE signals are generated by crack initiation, expansion or merging of coal rock specimens, so the internal damage of specimens during loading can be evaluated based on the recorded acoustic emission signals. Two AE characteristic parameters, AE ringing count and AE energy, are selected in this paper. The former is used to characterize the frequency of microcrack activity in specimens, while the latter reflects the energy size and damage severity during the formation and expansion of microcracks in specimens.
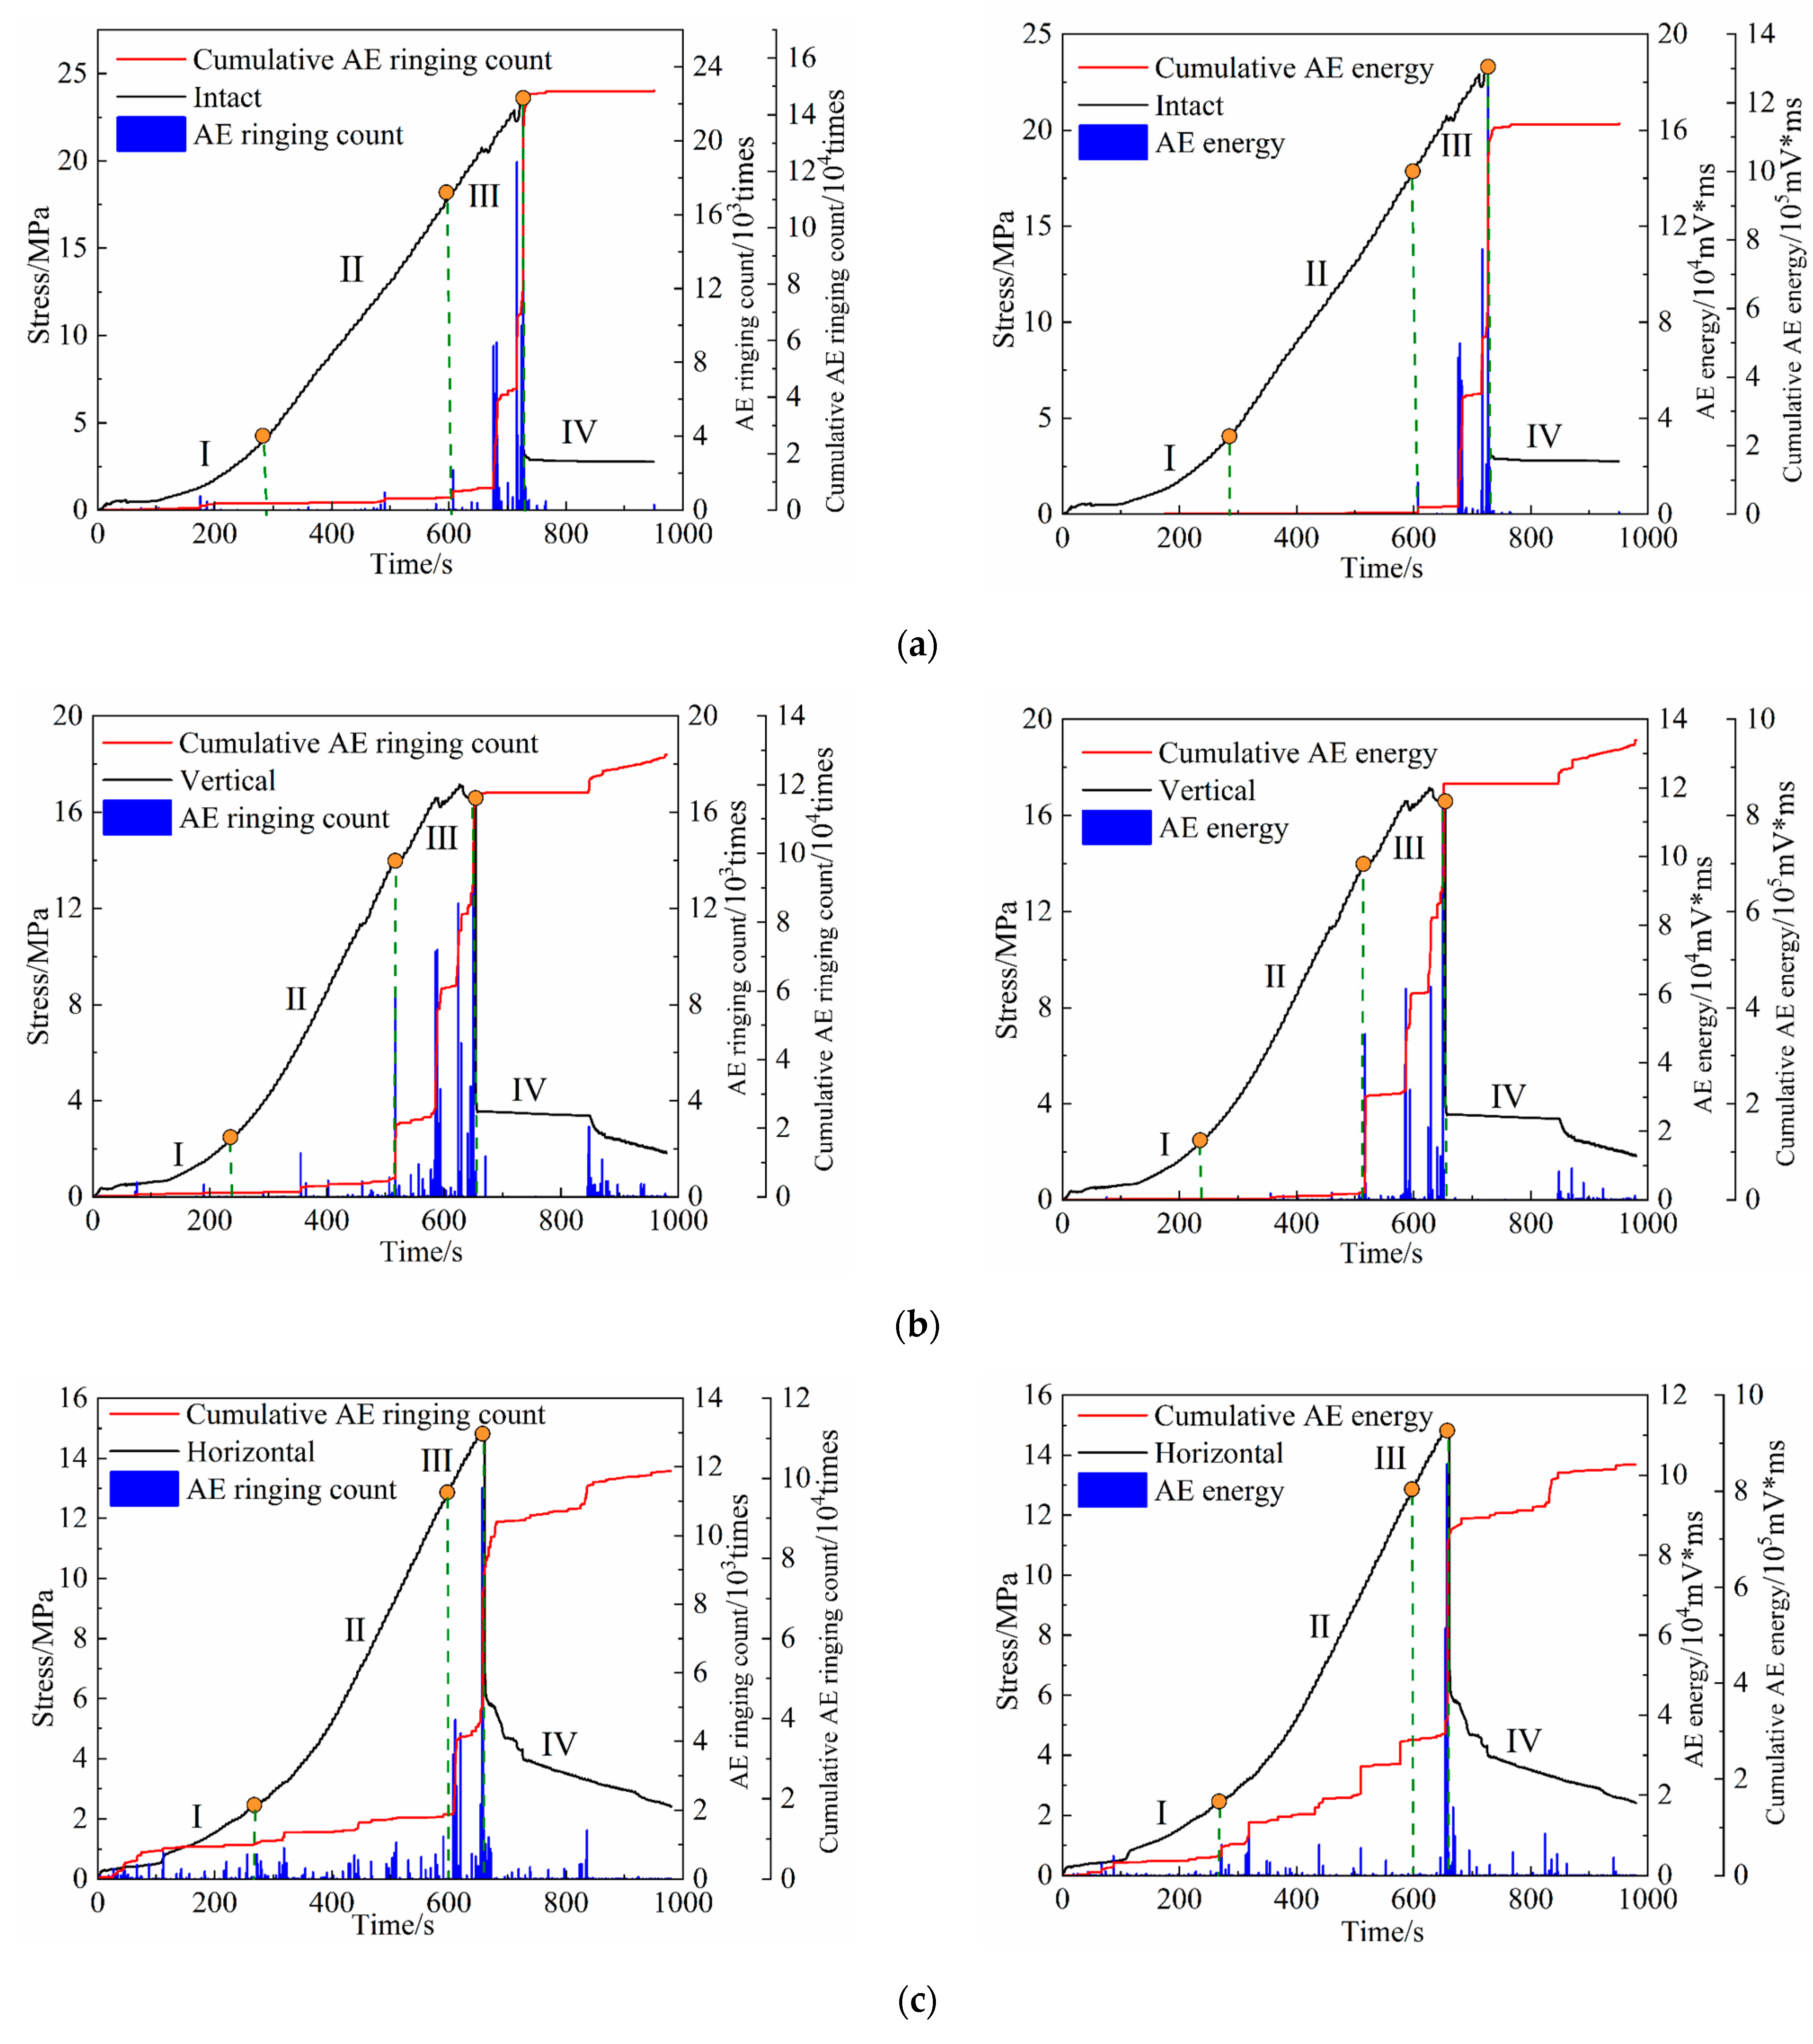
According to Figure 11, the AE activities of specimens with different drilling layouts during uniaxial loading were studied. The AE characteristic parameters of the specimens with different drilling layouts have a strong correlation with the time–stress curve, and the peak value of the AE ringing count, AE energy and stress basically coincide. According to the characteristics of the stress–time curve, cumulative AE ringing count and cumulative AE energy distribution, acoustic emission activity can be divided into four stages: stable stage, rising stage, active stage and vanishing stage.
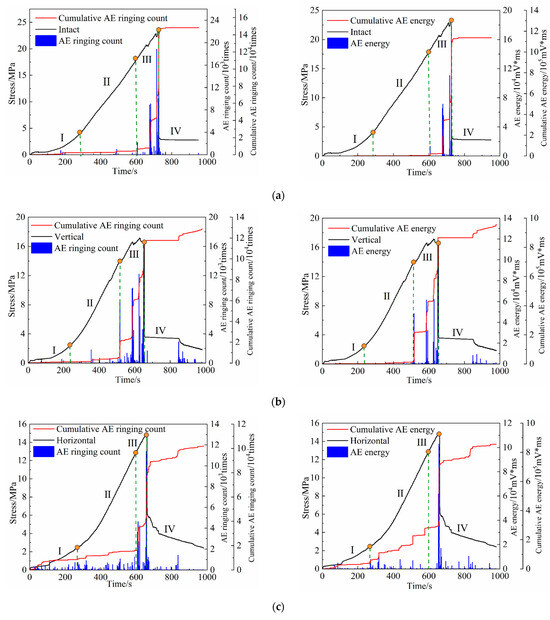
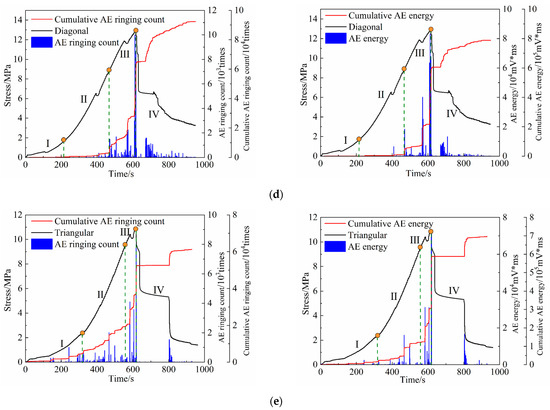
Figure 11.
Evolution law of stress and AE characteristic parameters with time under different drilling layouts: (a) I; (b) V30-0; (c) H30-0; (d) D30-0; (e) T30-0.
Stable stage (I): fracture pressure tight stage. The specimens were subjected to static load compaction, and the microcracks gradually closed. Due to the closure of natural defects, no significant AE activities were generated, and only a small amount of acoustic emission signals were recorded. The cumulative AE ringing count grows at a faster rate than the cumulative AE energy.
Rising stage (II): elastic deformation stage. The number of microcracks in the intact specimen increased steadily. Due to the small range and density of microcracks, only a small number of AE signals were recorded, and no macroscopic cracks occurred at this stage. For the drilling specimens at this stage, the tensile cracks around the drilling start and develop steadily along the loading direction, resulting in an increase in the number of AE signals compared with the number of intact specimens.
Active segment (III): plastic deformation stage. The internal damage of the specimen developed, resulting in a large number of cracks. The number of AE events increased significantly, and the AE ringing count and AE energy increased significantly.
Evanescent stage (IV): post-peak failure stage. For the intact specimen, a large number of AE signals are generated at the moment of failure, and basically no AE signals are generated at the post-peak failure stage. For different drilling specimens, the ratio of AE events in the post-peak failure stage to the total AE events is much higher than that of the intact specimens. This is because the drilling causes the failure process of the specimens to be more lasting, which weakens the failure strength, and the internal cracks continue to evolve in the post-peak failure stage. It can be well proved that different drilling layouts can reduce the impact inclination of specimens.
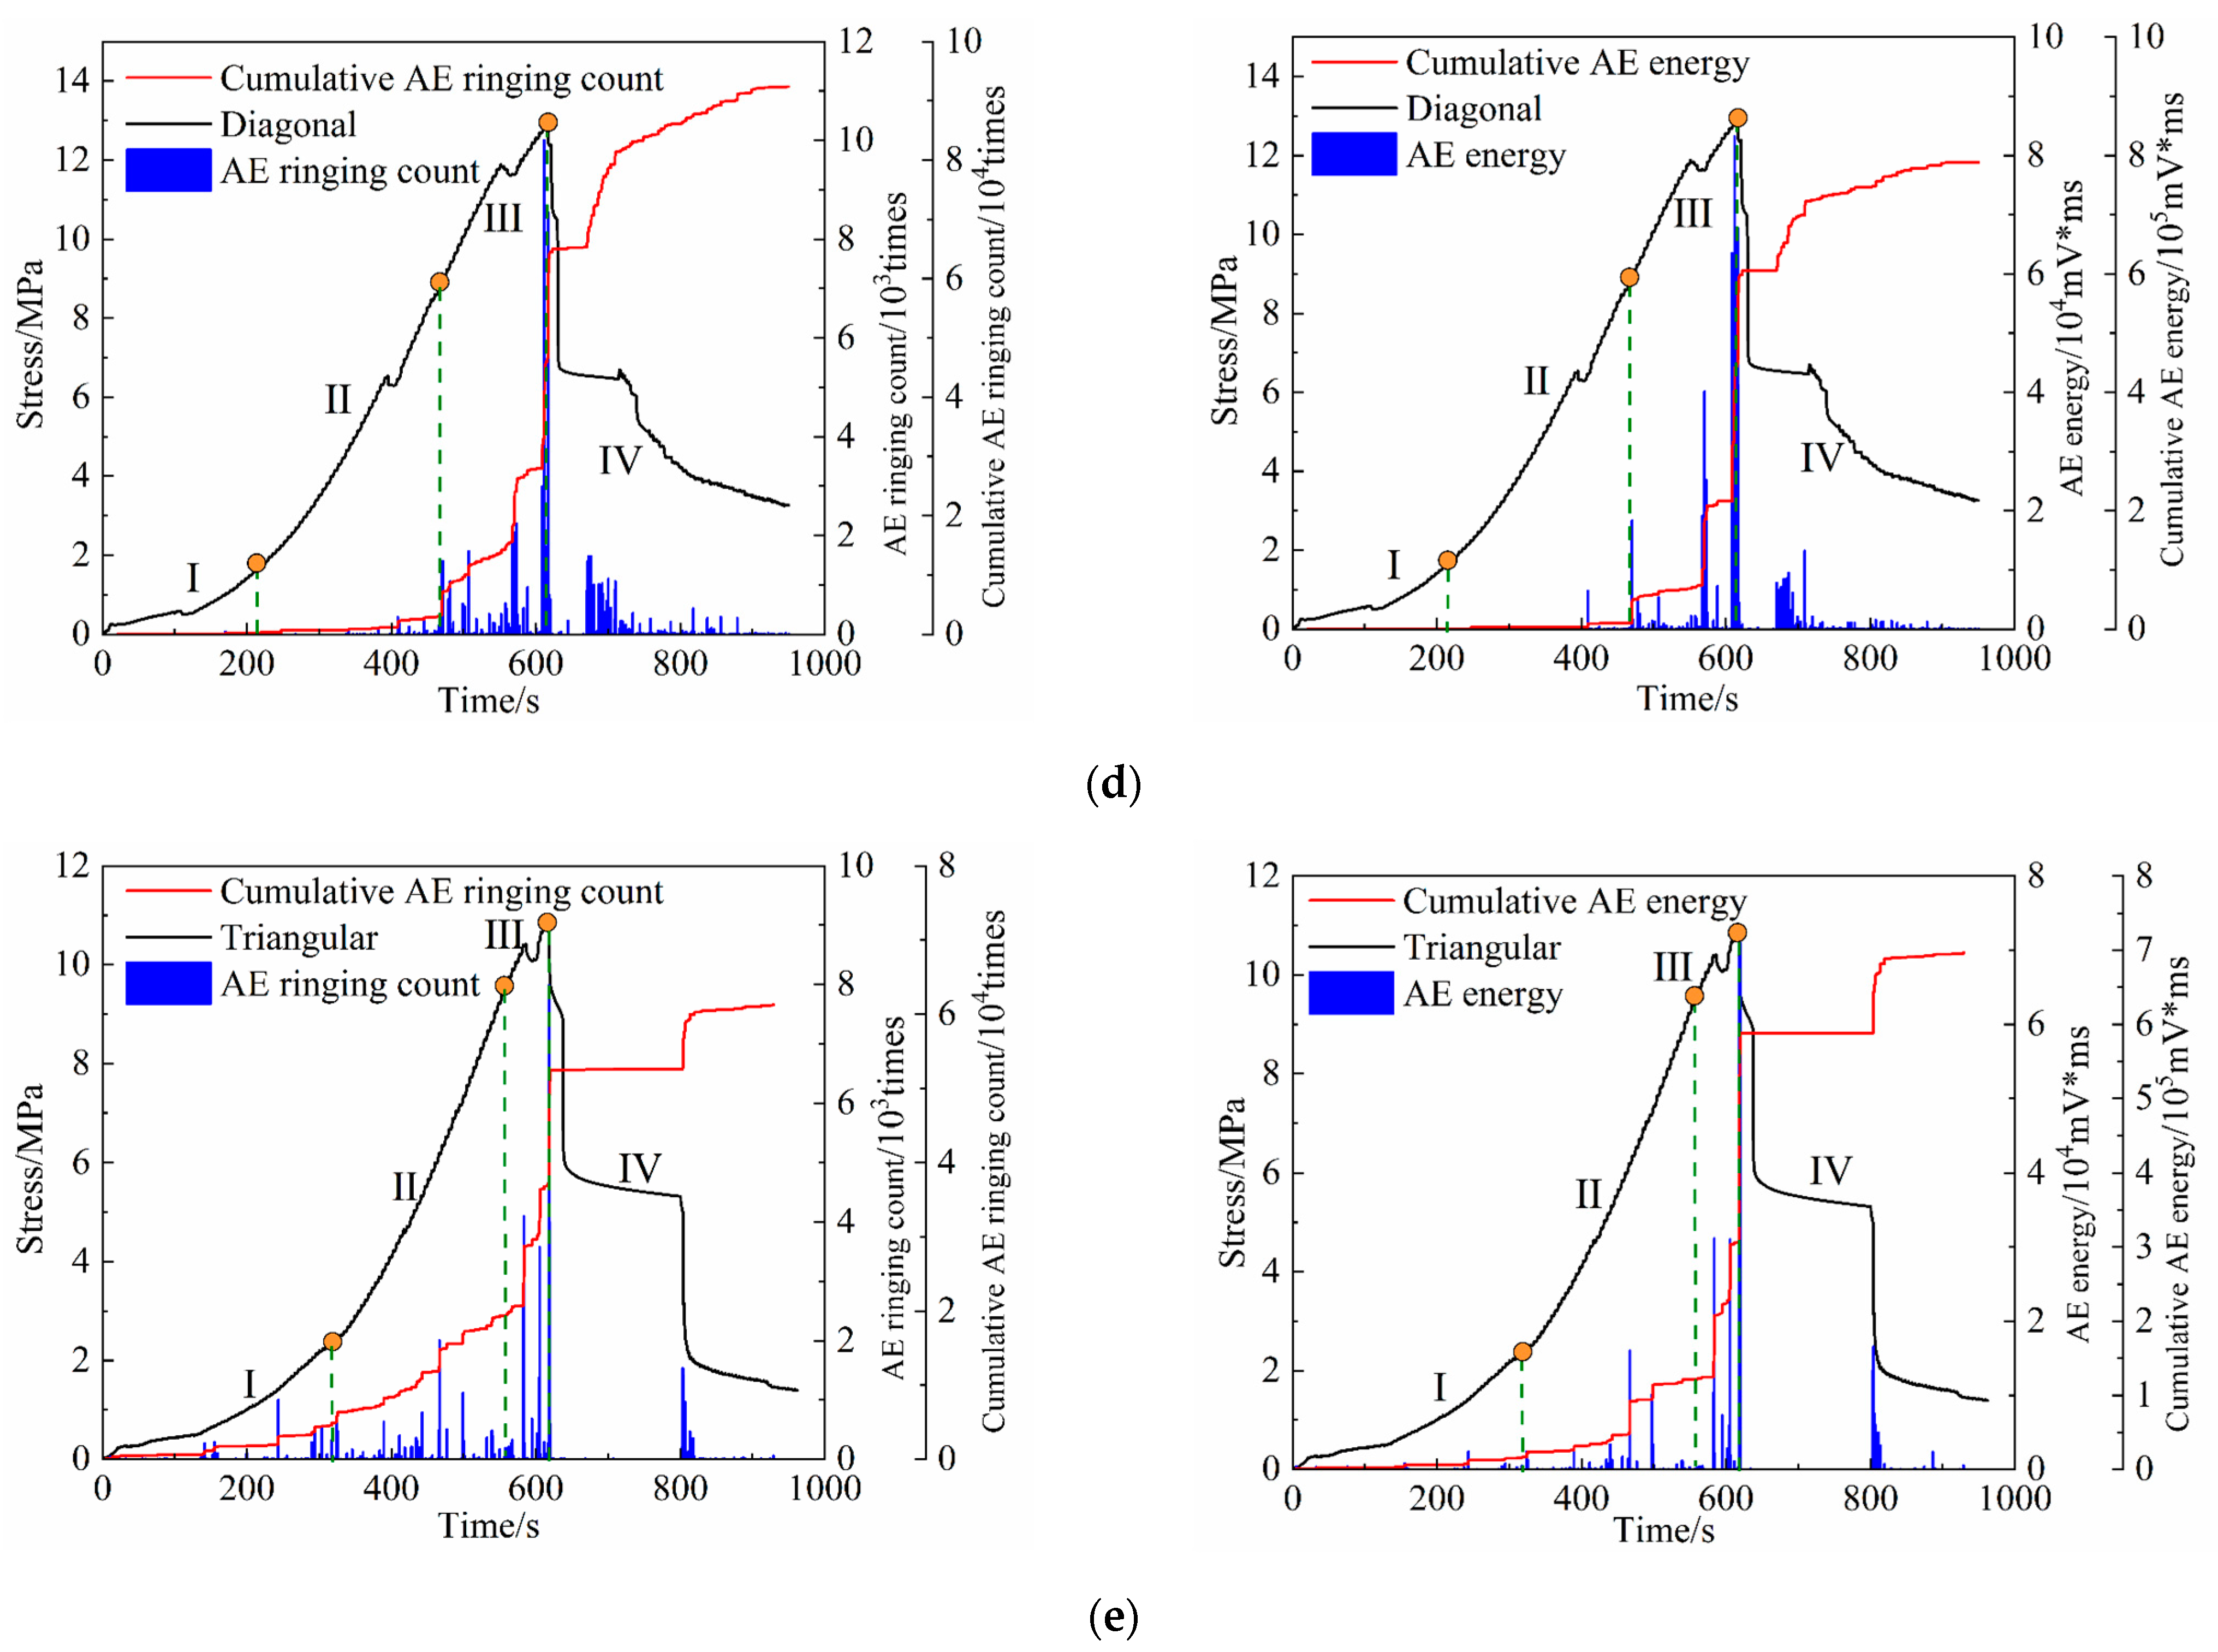
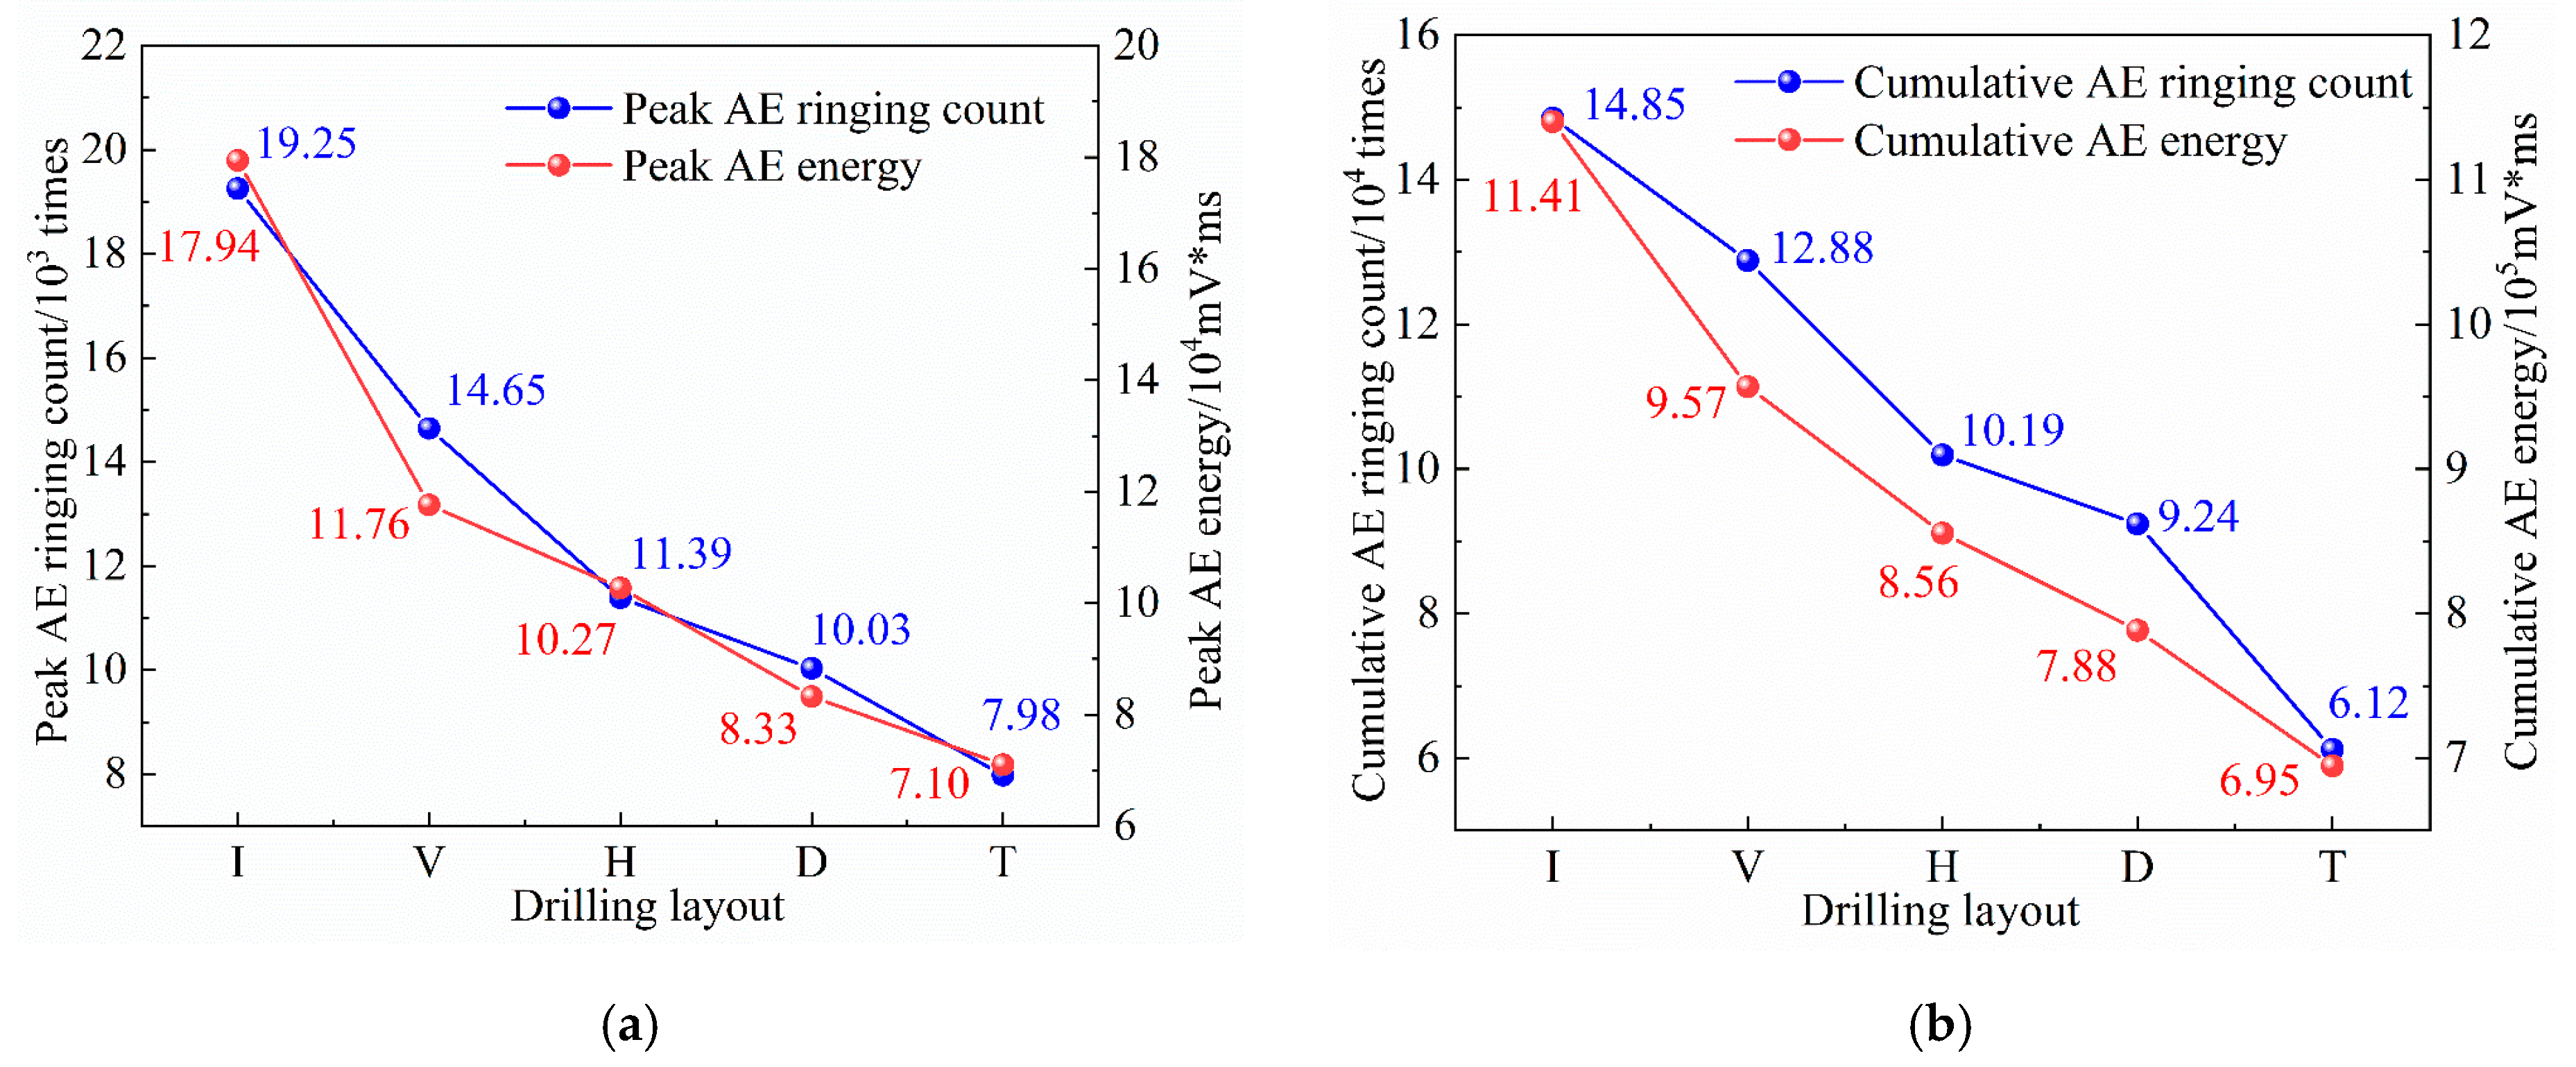
Figure 12 shows the variation rules of the peak AE ringing count, peak AE energy, cumulative AE ringing count and cumulative AE energy under different drilling layouts, which are used to reflect the AE activity events during loading. The four indexes of peak AE ringing count, peak AE energy, cumulative AE ringing count and cumulative AE energy of intact specimens were the largest, which were 19.25 × 10³ times, 17.94 × 10⁴ mV*ms, 14.85 × 10⁴ times and 11.41 × 10⁵ mV*ms, respectively. The four acoustic emission characteristic parameters of the vertical-layout, horizontal-layout, diagonal-layout and triangular-layout specimens decreased successively, and the peak AE ringing count, peak AE energy, cumulative AE ringing count and cumulative AE energy of the triangular-layout specimens were the smallest. They were, respectively, 7.98 × 10³ times, 7.10 × 10⁵ mV*ms, 6.12 × 10⁴ times and 6.95 × 10⁵ mV*ms.
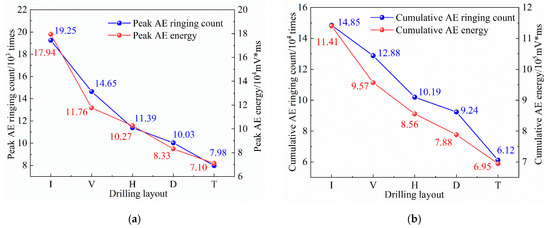
Figure 12.
The variation law of characteristic values of AE parameters under different drilling layouts: (a) Peak ringing count and peak energy of AE; (b) Cumulative ringing count and cumulative energy of AE.
The AE activity events of the intact specimen were the most active, and the AE activity of the triangular specimen was the weakest. The reason may be that the presence of drilling weakens the peak strength and energy accumulation capacity of the specimen, resulting in the reduction of the total strain energy stored in the specimen. The release of strain energy stored in the specimen is not limited to the moment of failure, but begins at the initiation of cracks around the drilling and gradually releases after the specimen is damaged. The presence of drilling also causes the cracks to spread intensively during the loading process, reducing the number of microcracks and thus reducing the occurrence of acoustic emission events. In addition, the volume reduction caused by the excavation of holes in the specimen may also lead to a reduction in the number of cracks.
3.3.2. Acoustic Emission Characteristics of Specimens with Different Drilling Spacings
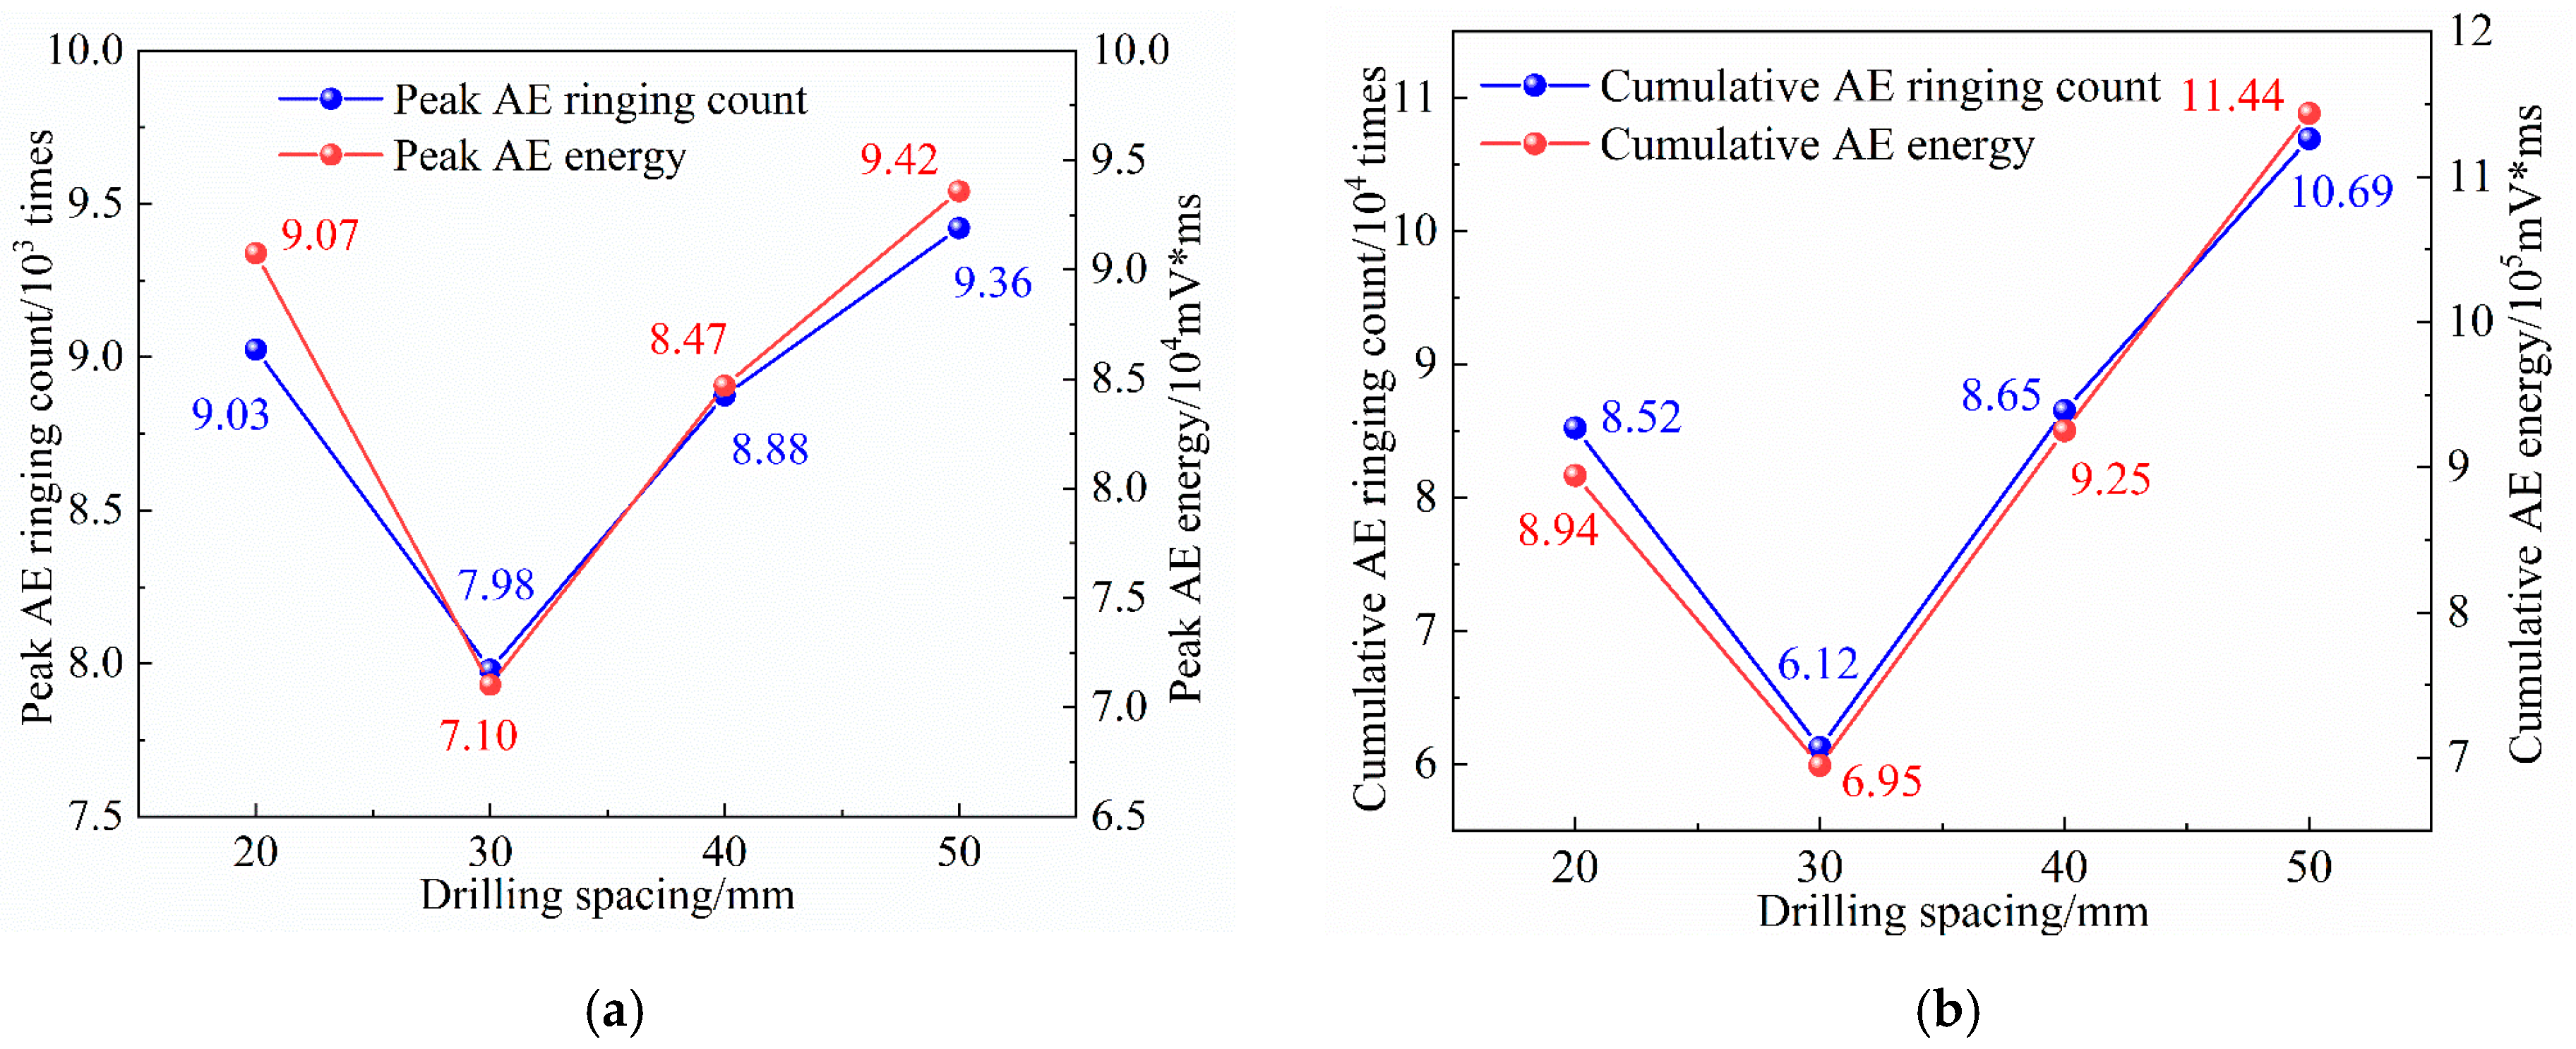
Figure 13 shows the changes in the peak AE ringing count, peak AE energy, cumulative AE ringing count and cumulative AE energy under different drilling spacings, which is used to reflect the activity of AE events in the loading process. With the increase in drilling spacing, the peak AE ringing count, peak AE energy, cumulative AE ringing count and cumulative AE energy decrease first and then increase. When the drilling spacing is three times the diameter, the four AE characteristic parameters are the smallest. The reason may be that the peak strength and pre-peak total strain energy of the specimen also decrease first and then increase with the increase in the spacing of the drillings, and the failure mode of the drillings gradually changes from through-type failure to independent-type failure, resulting in a decrease in the total strain energy stored in the specimen. However, when the spacing of the drillings is three times the diameter, the peak strength and pre-peak total strain energy of the specimen are the smallest, and the damage degree of the specimen is the largest.
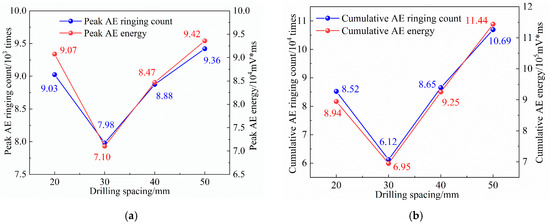
Figure 13.
The variation law of characteristic values of AE parameters under different drilling spacings: (a) Peak ringing count and peak energy of AE; (b) Cumulative ringing count and cumulative energy of AE.
3.3.3. Acoustic Emission Characteristics of Specimens at Different Drilling Positions
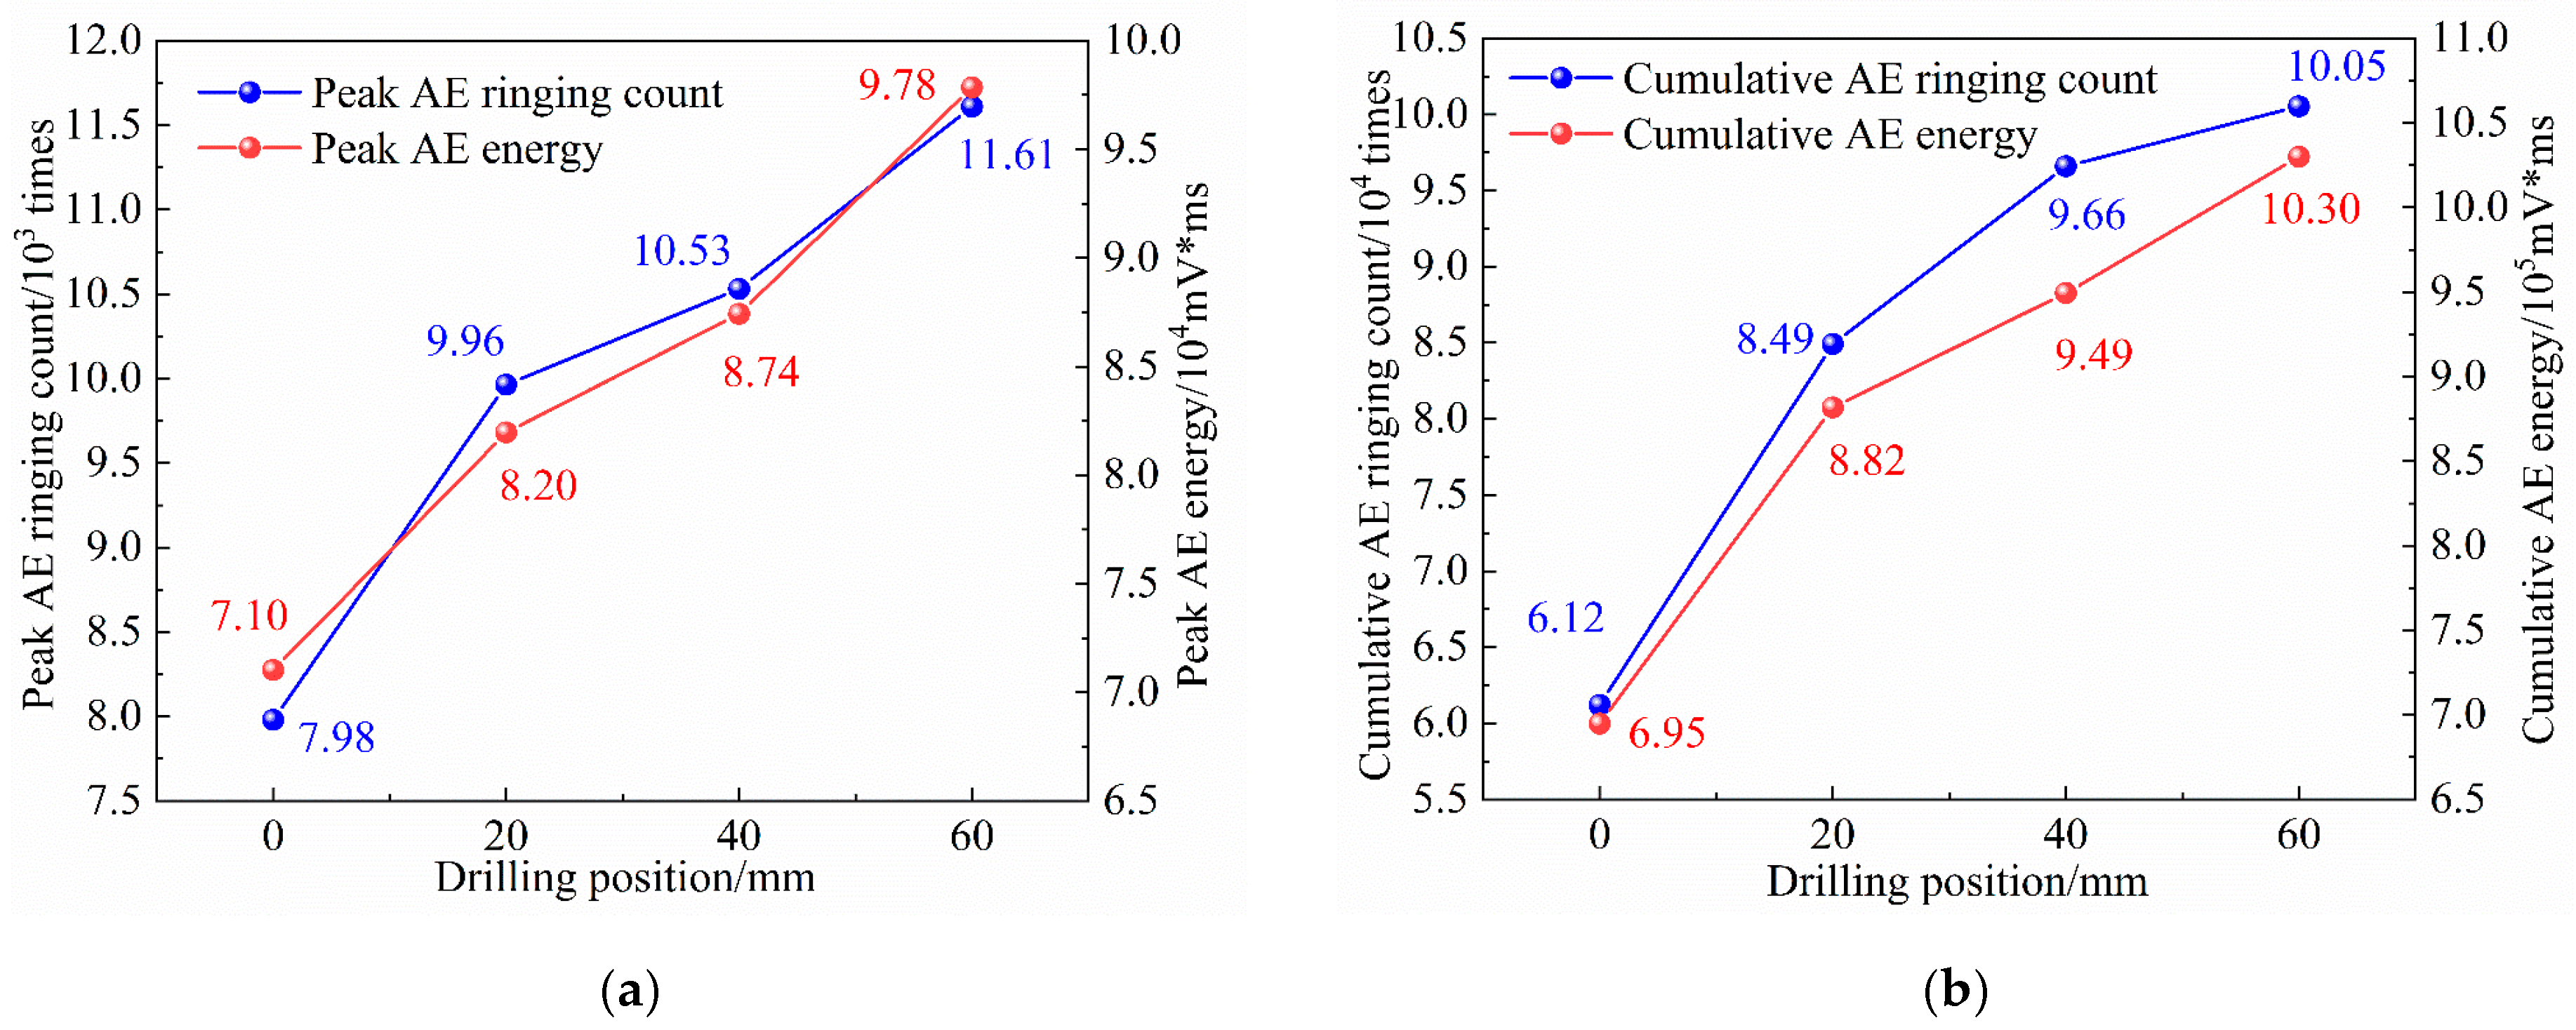
Figure 14 shows the variation law of the peak AE ringing count, peak AE energy, cumulative AE ringing count and cumulative AE energy at different drilling positions, which is used to reflect the activity of AE events in the loading process. The four parameters of peak AE ringing count, peak AE energy, cumulative AE ringing count and cumulative AE energy increase gradually with the upward movement of the drilling position. When the drilling position is in the middle of the specimen, the four AE characteristic parameters are the smallest. The reason may be that the drilling layout in the middle of the specimen weakens the peak strength and energy accumulation capacity of the specimen to the greatest extent, resulting in the reduction of the total strain energy stored in the specimen, and the best pressure relief effect is achieved during the failure process.
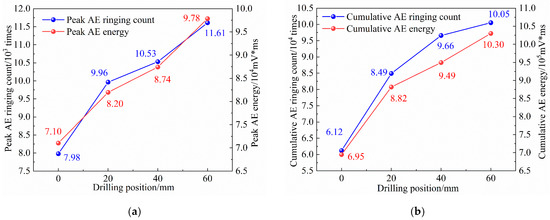
Figure 14.
The variation laws of characteristic values of AE parameters under different drilling positions: (a) Peak ringing count and peak energy of AE; (b) Cumulative ringing count and cumulative energy of AE.
4. Microscopic Cracks and Energy Evolution Law
4.1. Numerical Model Establishment and Mesoscopic Parameter Calibration
PFC2D 6.0 simulation software is capable of modeling the mechanical behavior of rock from a microscopic perspective, thereby revealing the underlying mechanisms of fracture propagation and energy evolution. Based on laboratory experiments, PFC software was employed to investigate the fracture propagation and energy evolution in samples with varying drilling parameters. A two-dimensional numerical model was constructed according to the dimensions of the experimental samples, with a simulated sample size of 100 mm × 200 mm. The model consisted of 14,132 randomly generated particles. Following the establishment of the model, the particles were bonded using a parallel-bond mode, and an initial equilibrium state was achieved. The boundary conditions of the model were consistent with those of the laboratory tests, where the lower boundary was fixed, a vertical downward velocity was applied to the upper boundary, and the loading rate matched that of the laboratory tests.
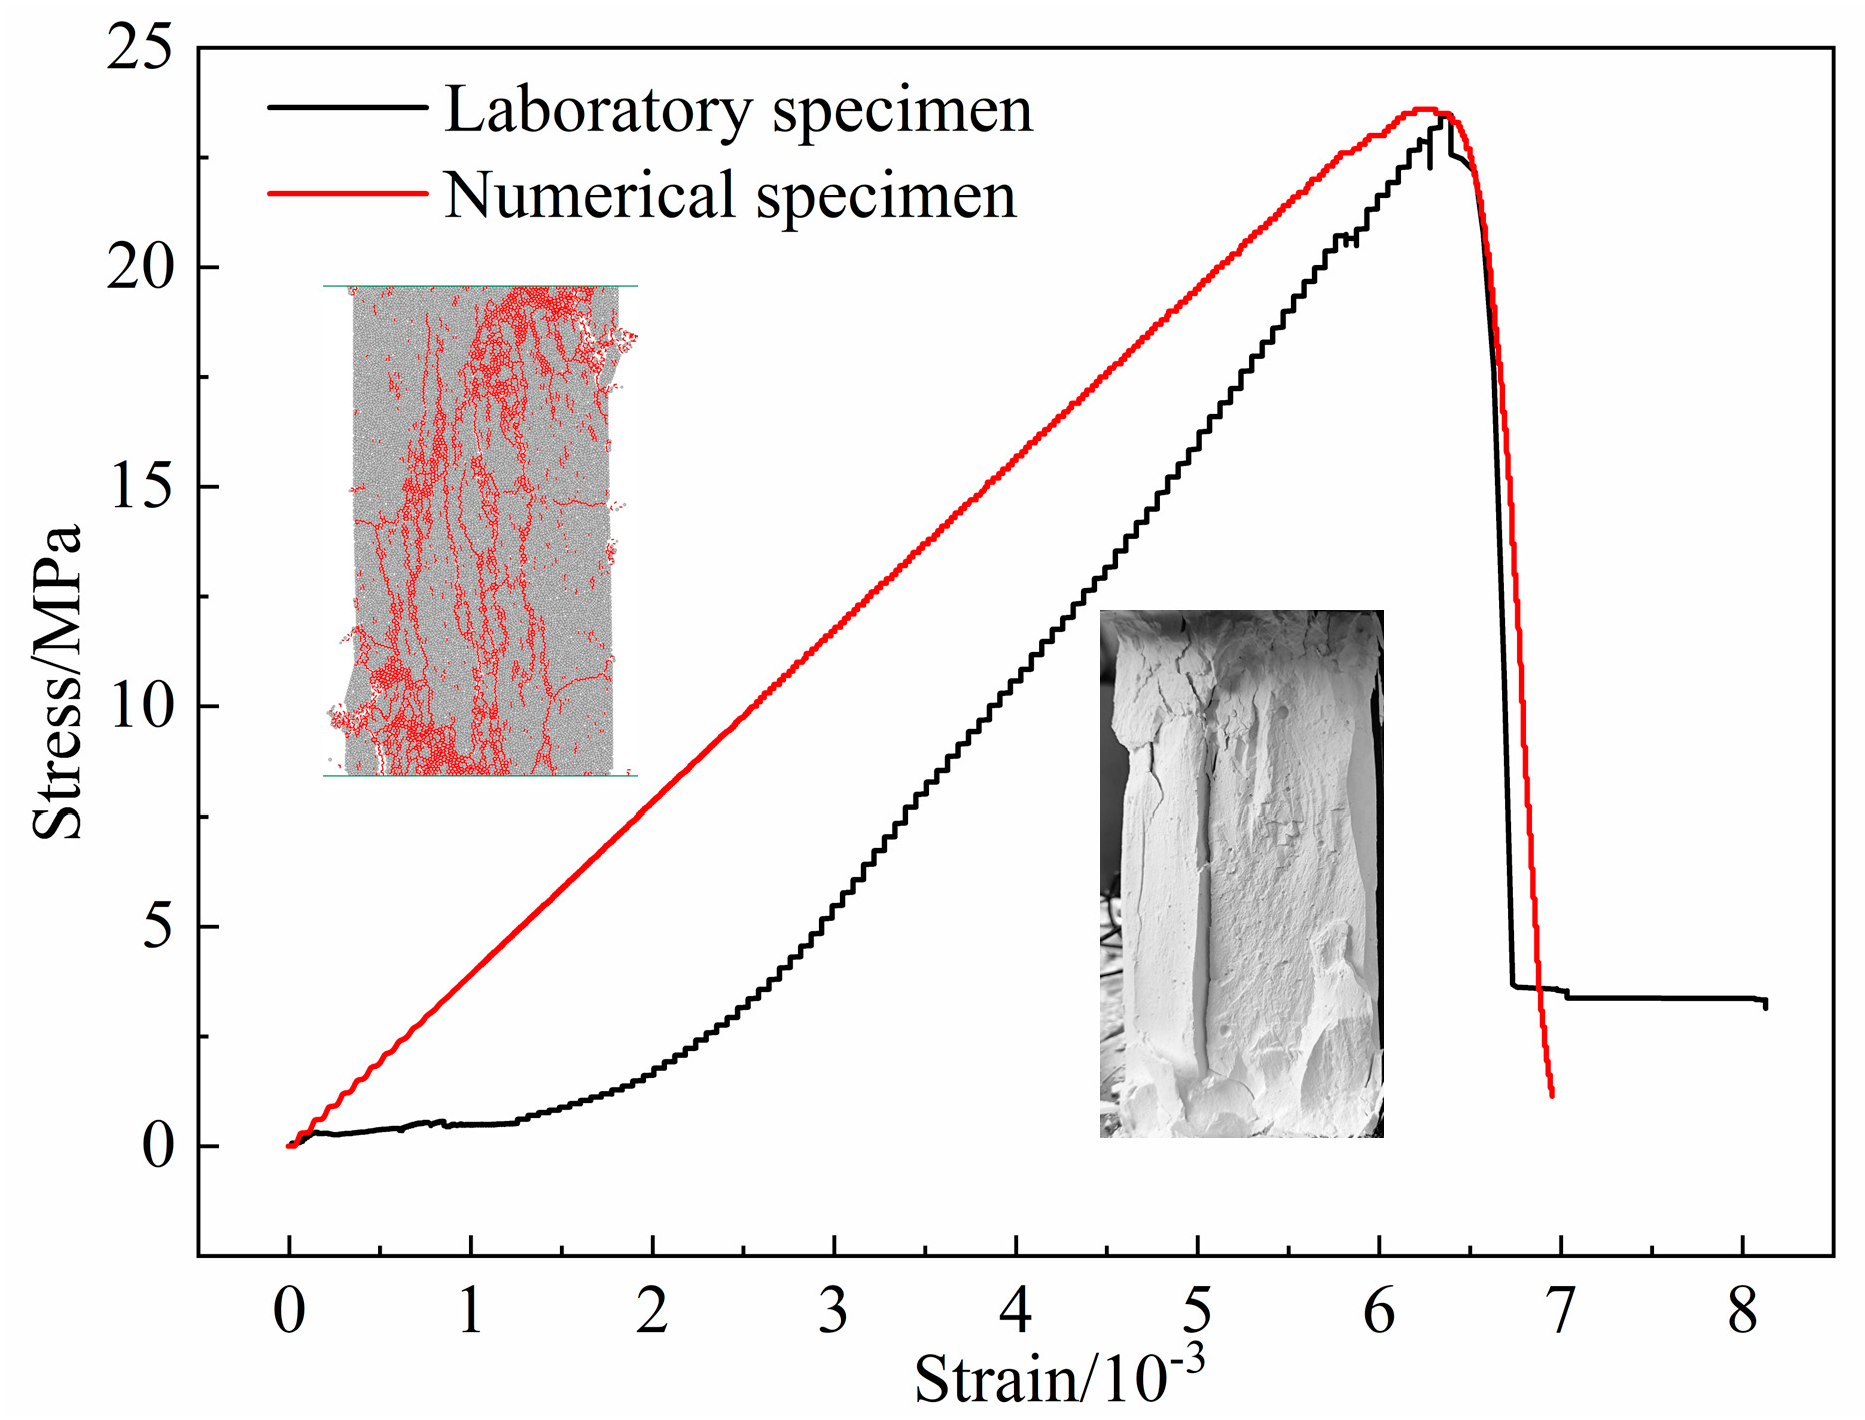
To calibrate the mesoscopic mechanical parameters of the model, a trial-and-error approach was utilized to establish the relationship between mesoscopic and macroscopic parameters. The calibrated mesoscopic parameters are presented in Table 3. The stress–strain curves obtained from the laboratory samples and the numerical simulation models are illustrated in Figure 15. The peak strength, peak strain and elastic modulus derived from the laboratory tests were 23.46 MPa, 6.39 × 10⁻³, and 4.53 GPa, respectively. In contrast, the corresponding values from the numerical simulations were 23.59 MPa, 6.27 × 10⁻³, and 3.91 GPa, respectively.
Table 3.
Micromechanical parameters of the model.

Figure 15.
Stress–strain curves of laboratory specimen and numerical simulation model.
4.2. Influence of Different Drilling Parameters on Microscopic Crack Distribution
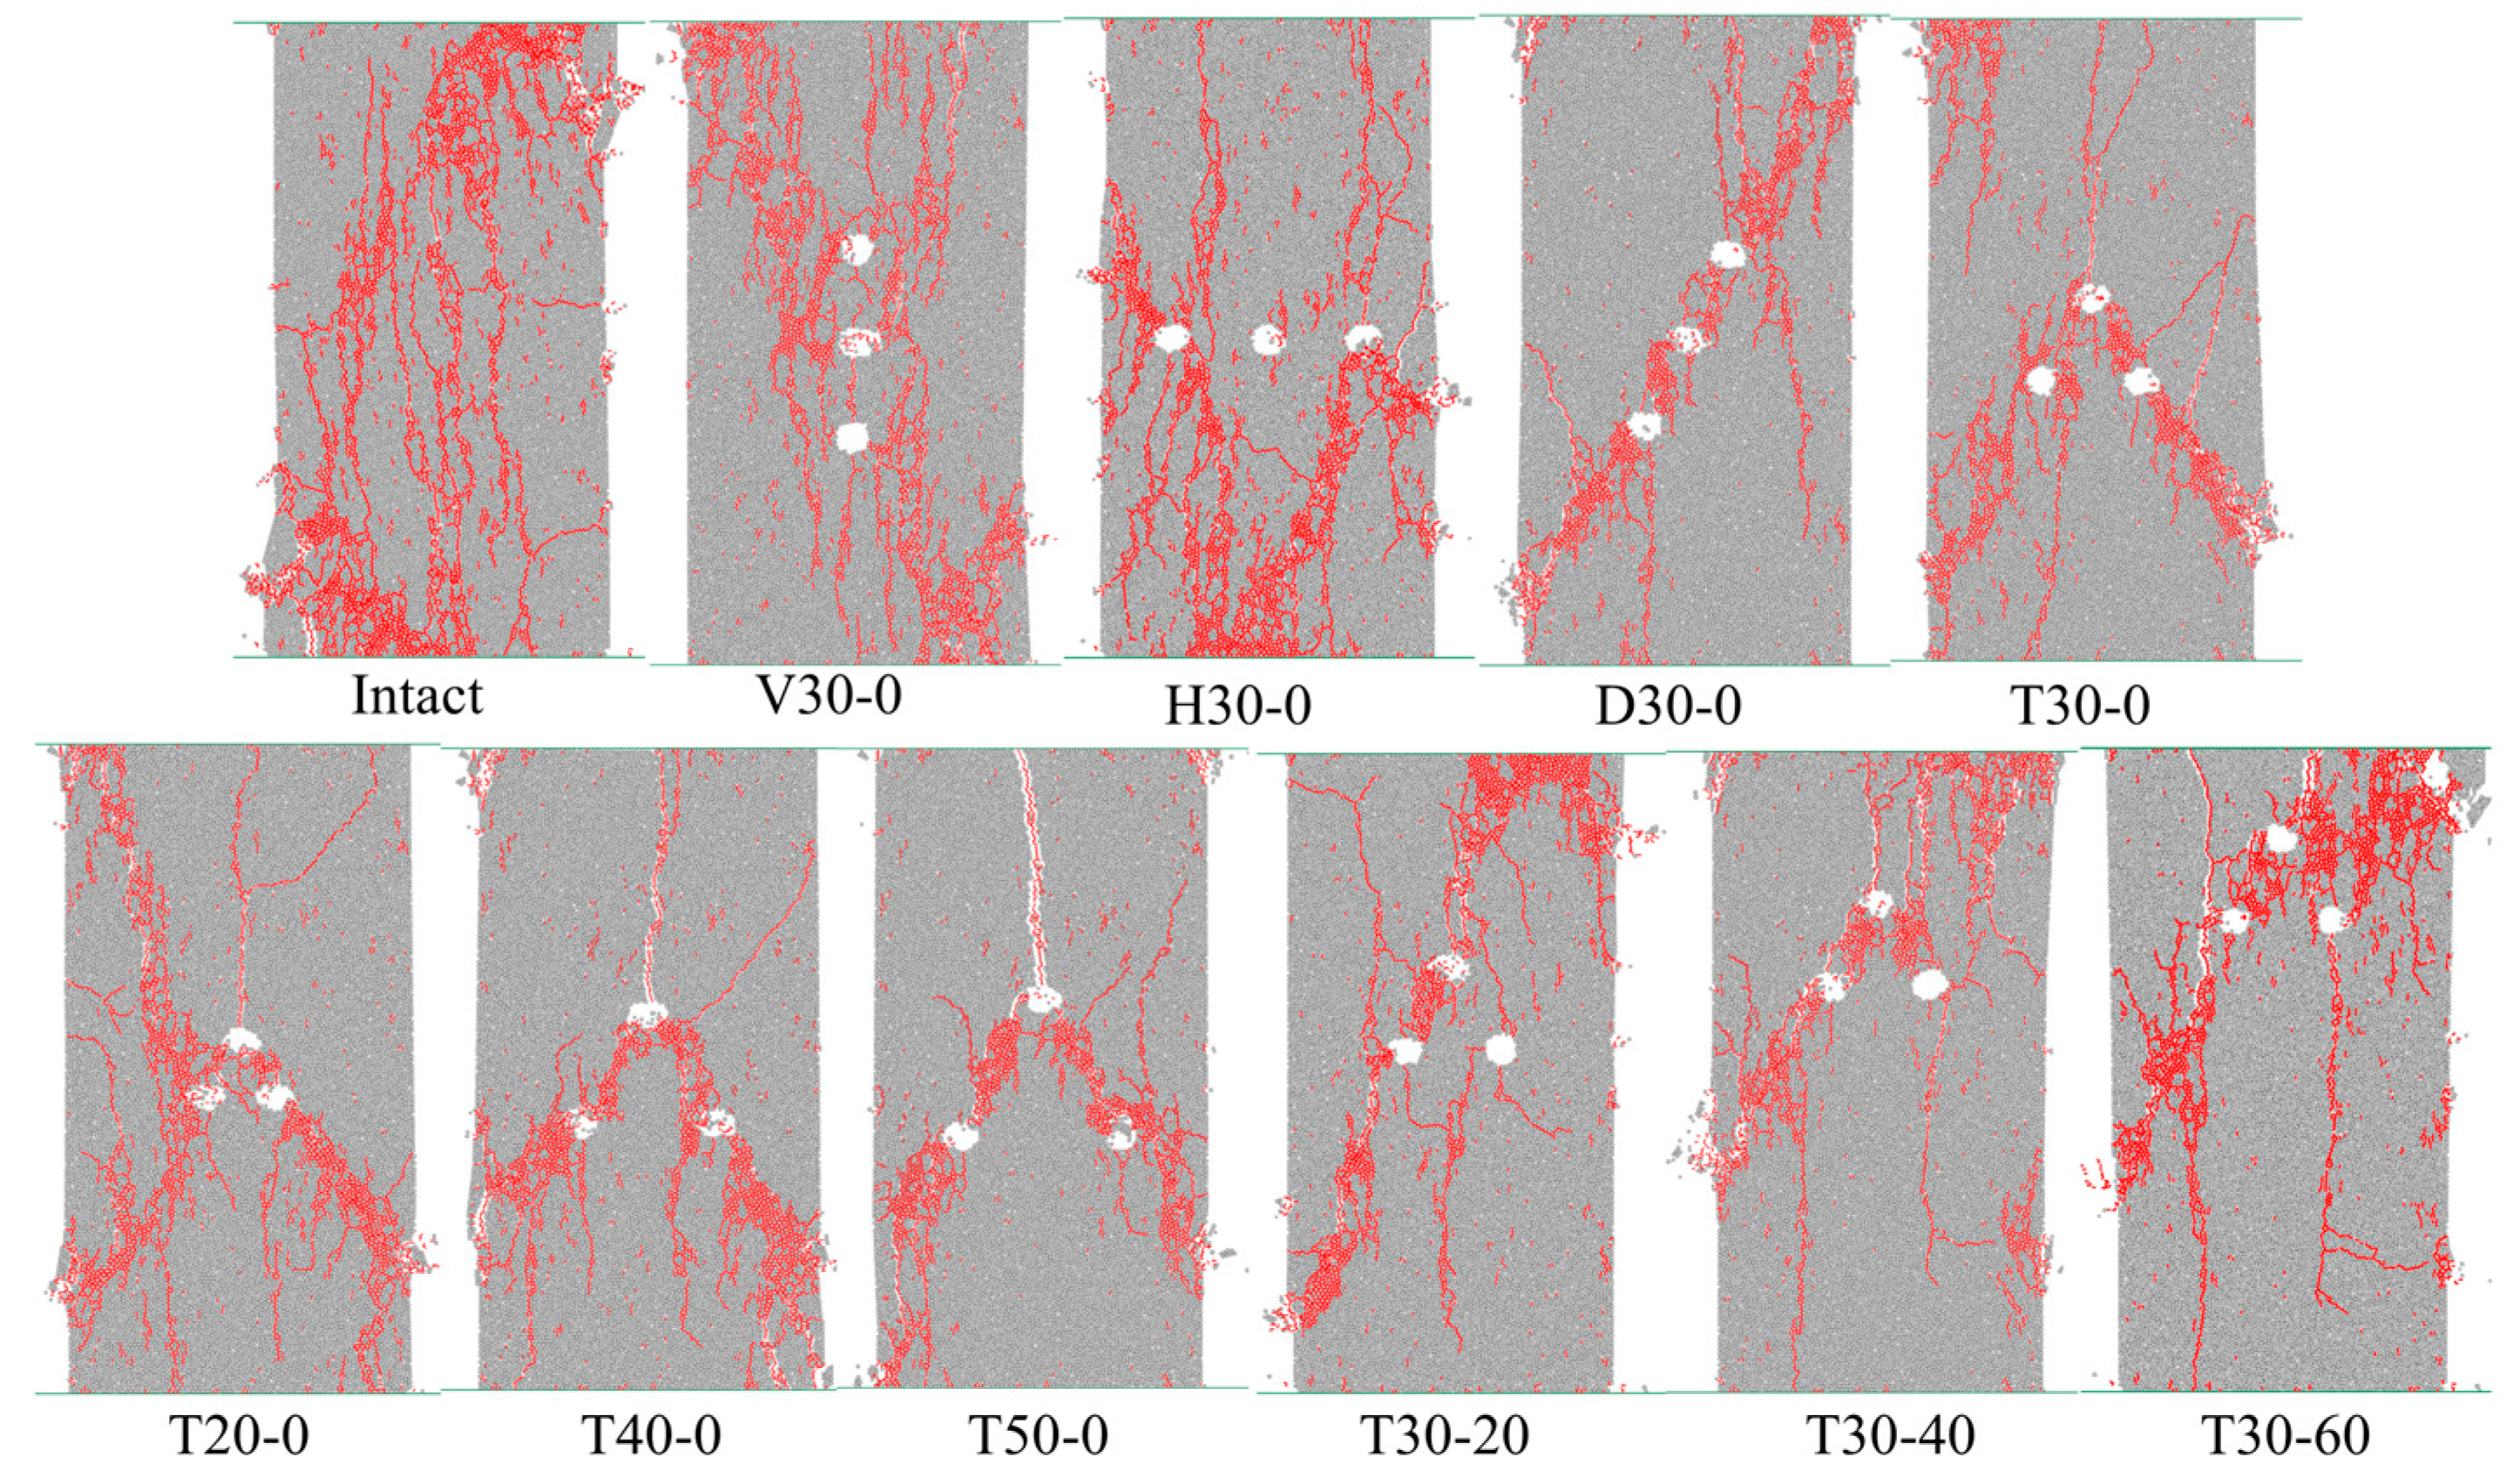
The microcrack distribution of the sample under different drilling parameters is shown in Figure 16. The microscopic crack distribution under the simulation is highly consistent with the macroscopic failure model shown in Figure 8, Figure 9 and Figure 10. The crack distribution of the intact specimen is more scattered and random, the crack propagation of the drilled specimens is more orderly, and the crack distribution changes with the change in the drilling layout.

Figure 16.
Microscopic crack distribution of specimen under numerical simulation.
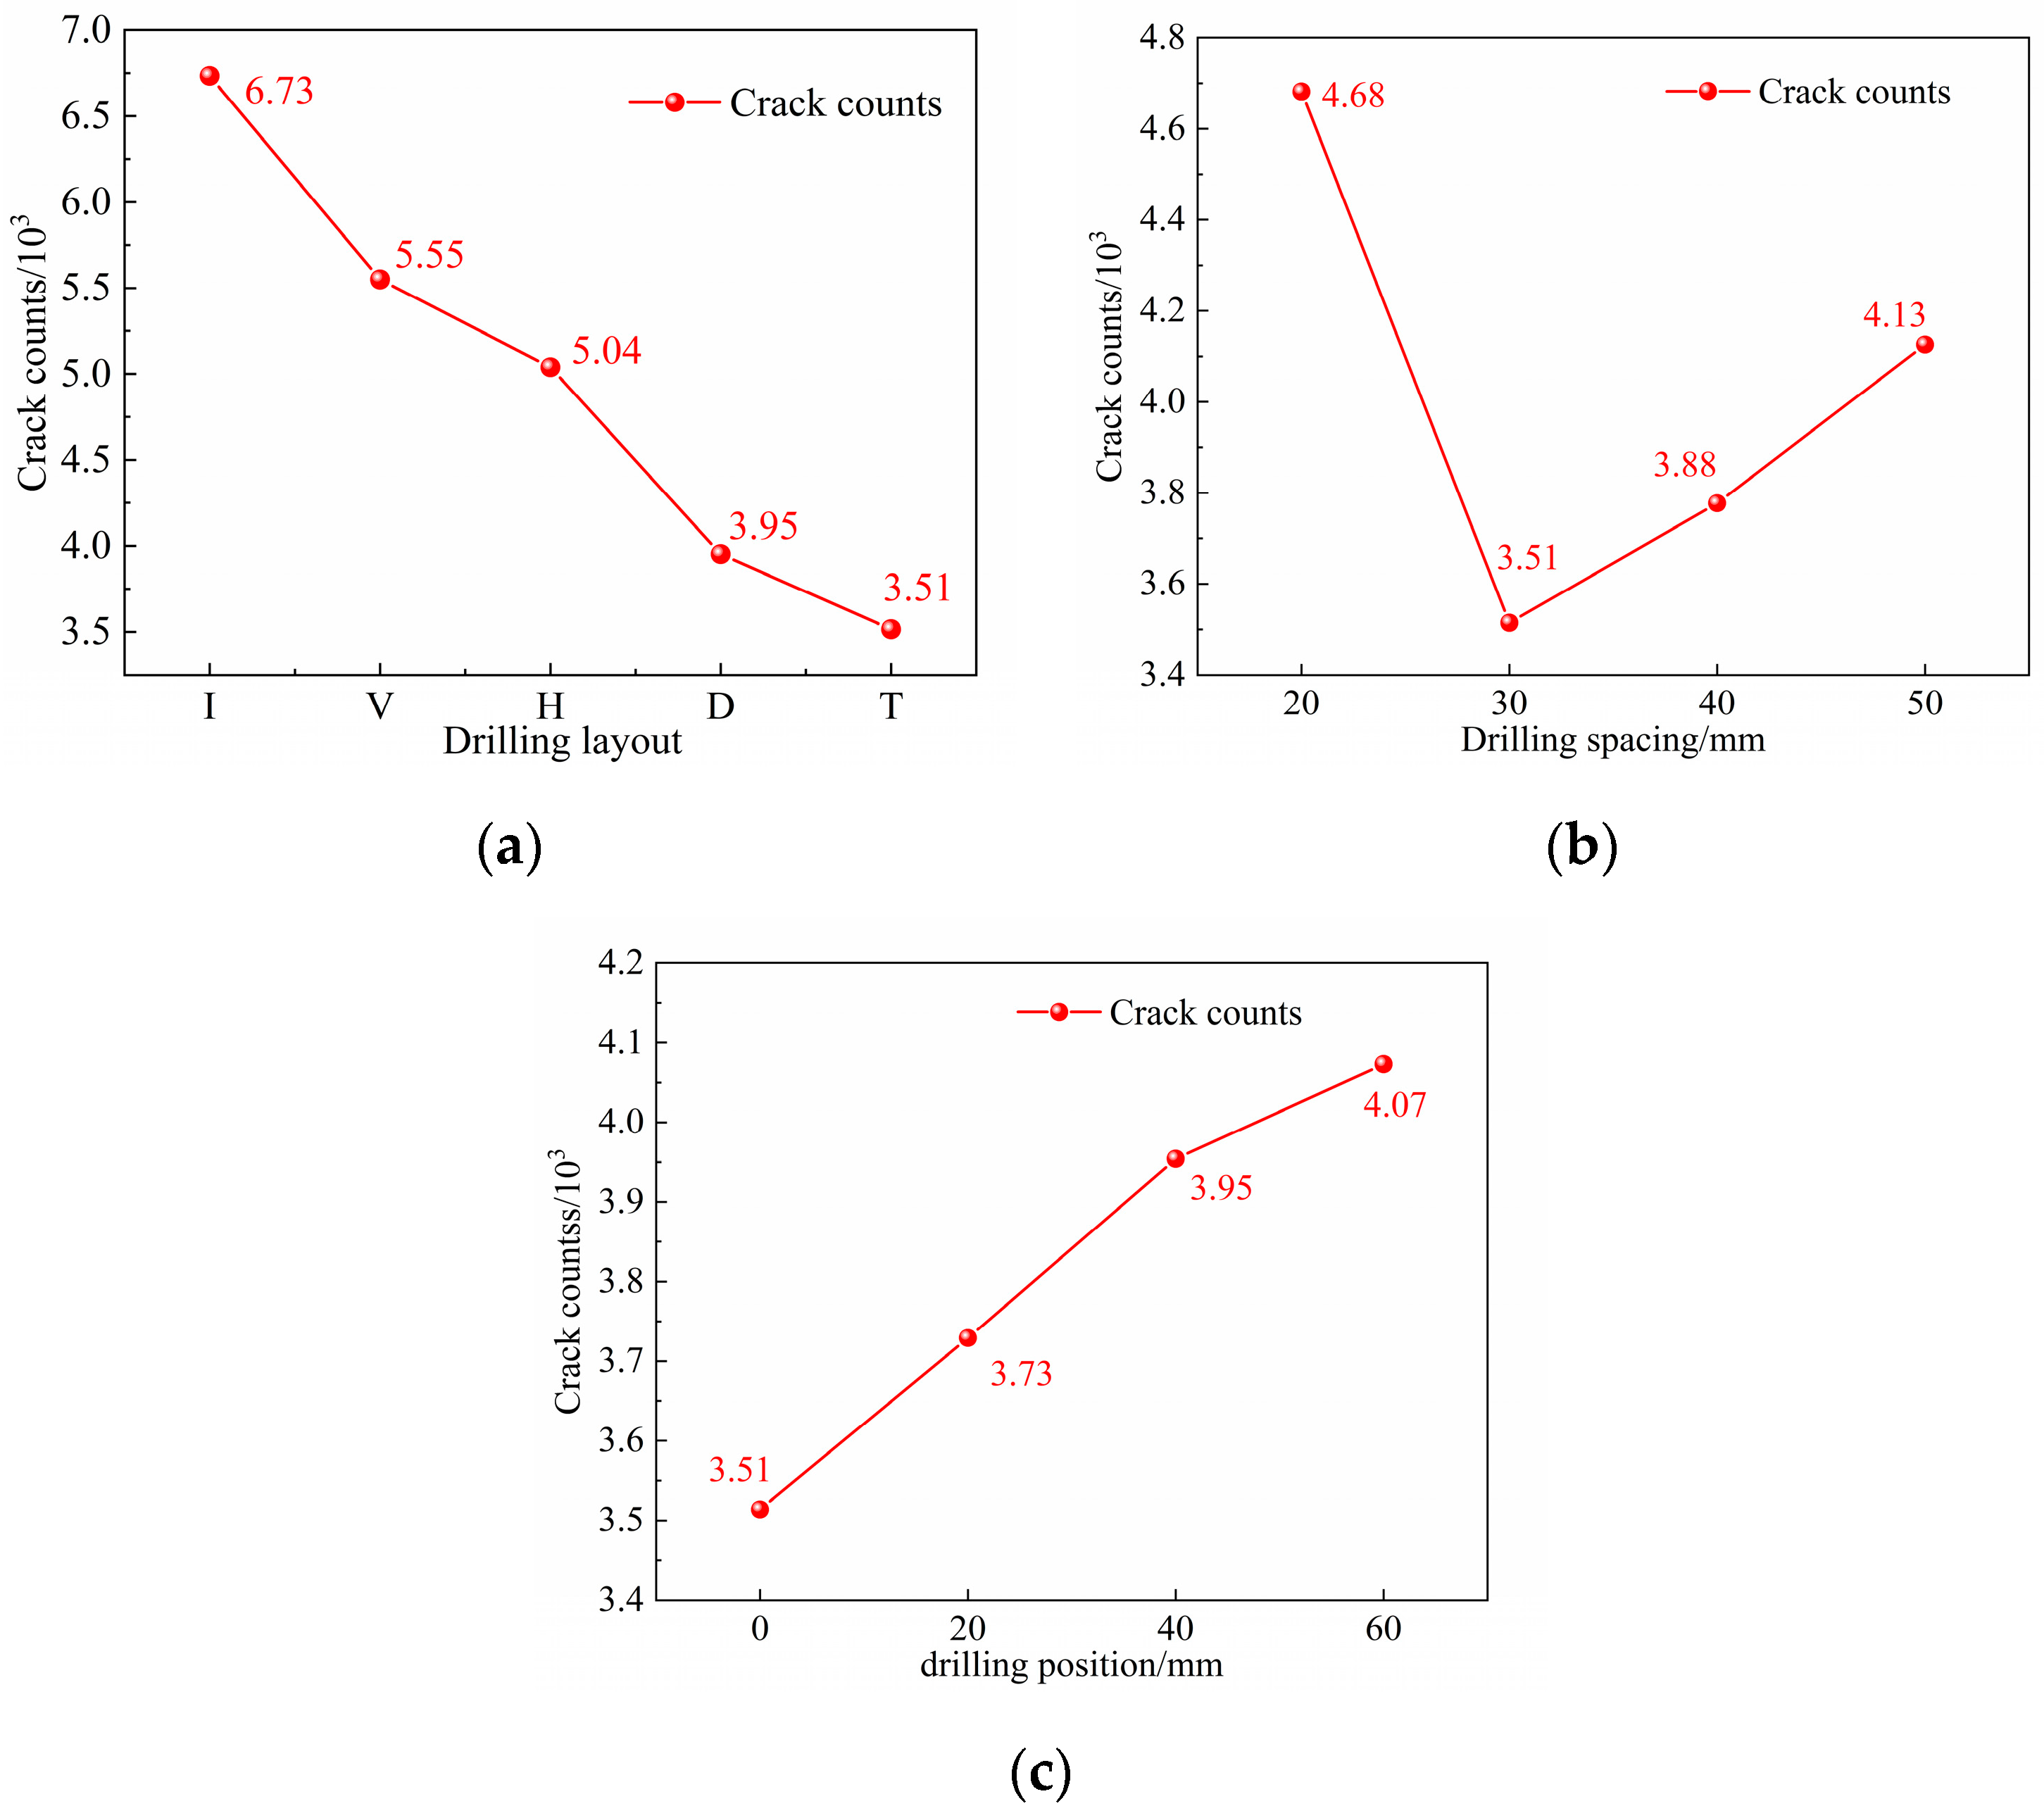
In order to quantitatively study the relationship between the number of microscopic cracks and drilling parameters, the Fish language was used to define the total number of cracks in the PFC simulation software. The number of cracks under different drilling parameters is shown in Figure 17. With the change in drilling layout, the number of cracks decreased from 6734 in the intact specimen to 3513 in the triangular-drilling specimen. With the change in drilling spacing, the number of cracks decreases first and then increases, and is the smallest when the drilling spacing is three times the hole diameter. The number of cracks increases gradually as the drilling position moves up. These phenomena reveal the guiding effect of the drilling distribution on the expansion and penetration of cracks. The cracks gradually become orderly from disorder in the process of expansion.
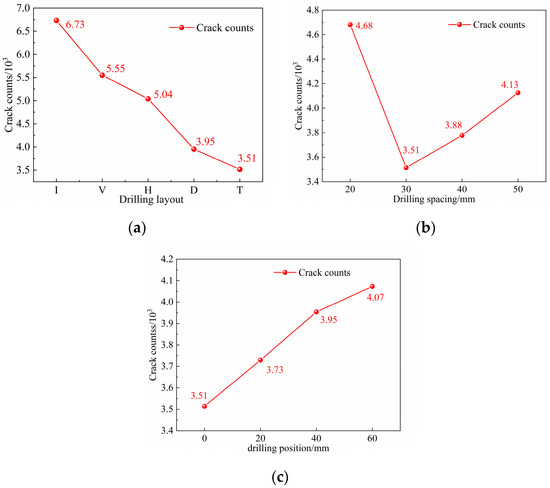
Figure 17.
Number of cracks under different drilling parameters: (a) Drilling layout; (b) Drilling spacing; (c) Drilling position.
4.3. Influence of Different Drilling Parameters on Energy Evolution
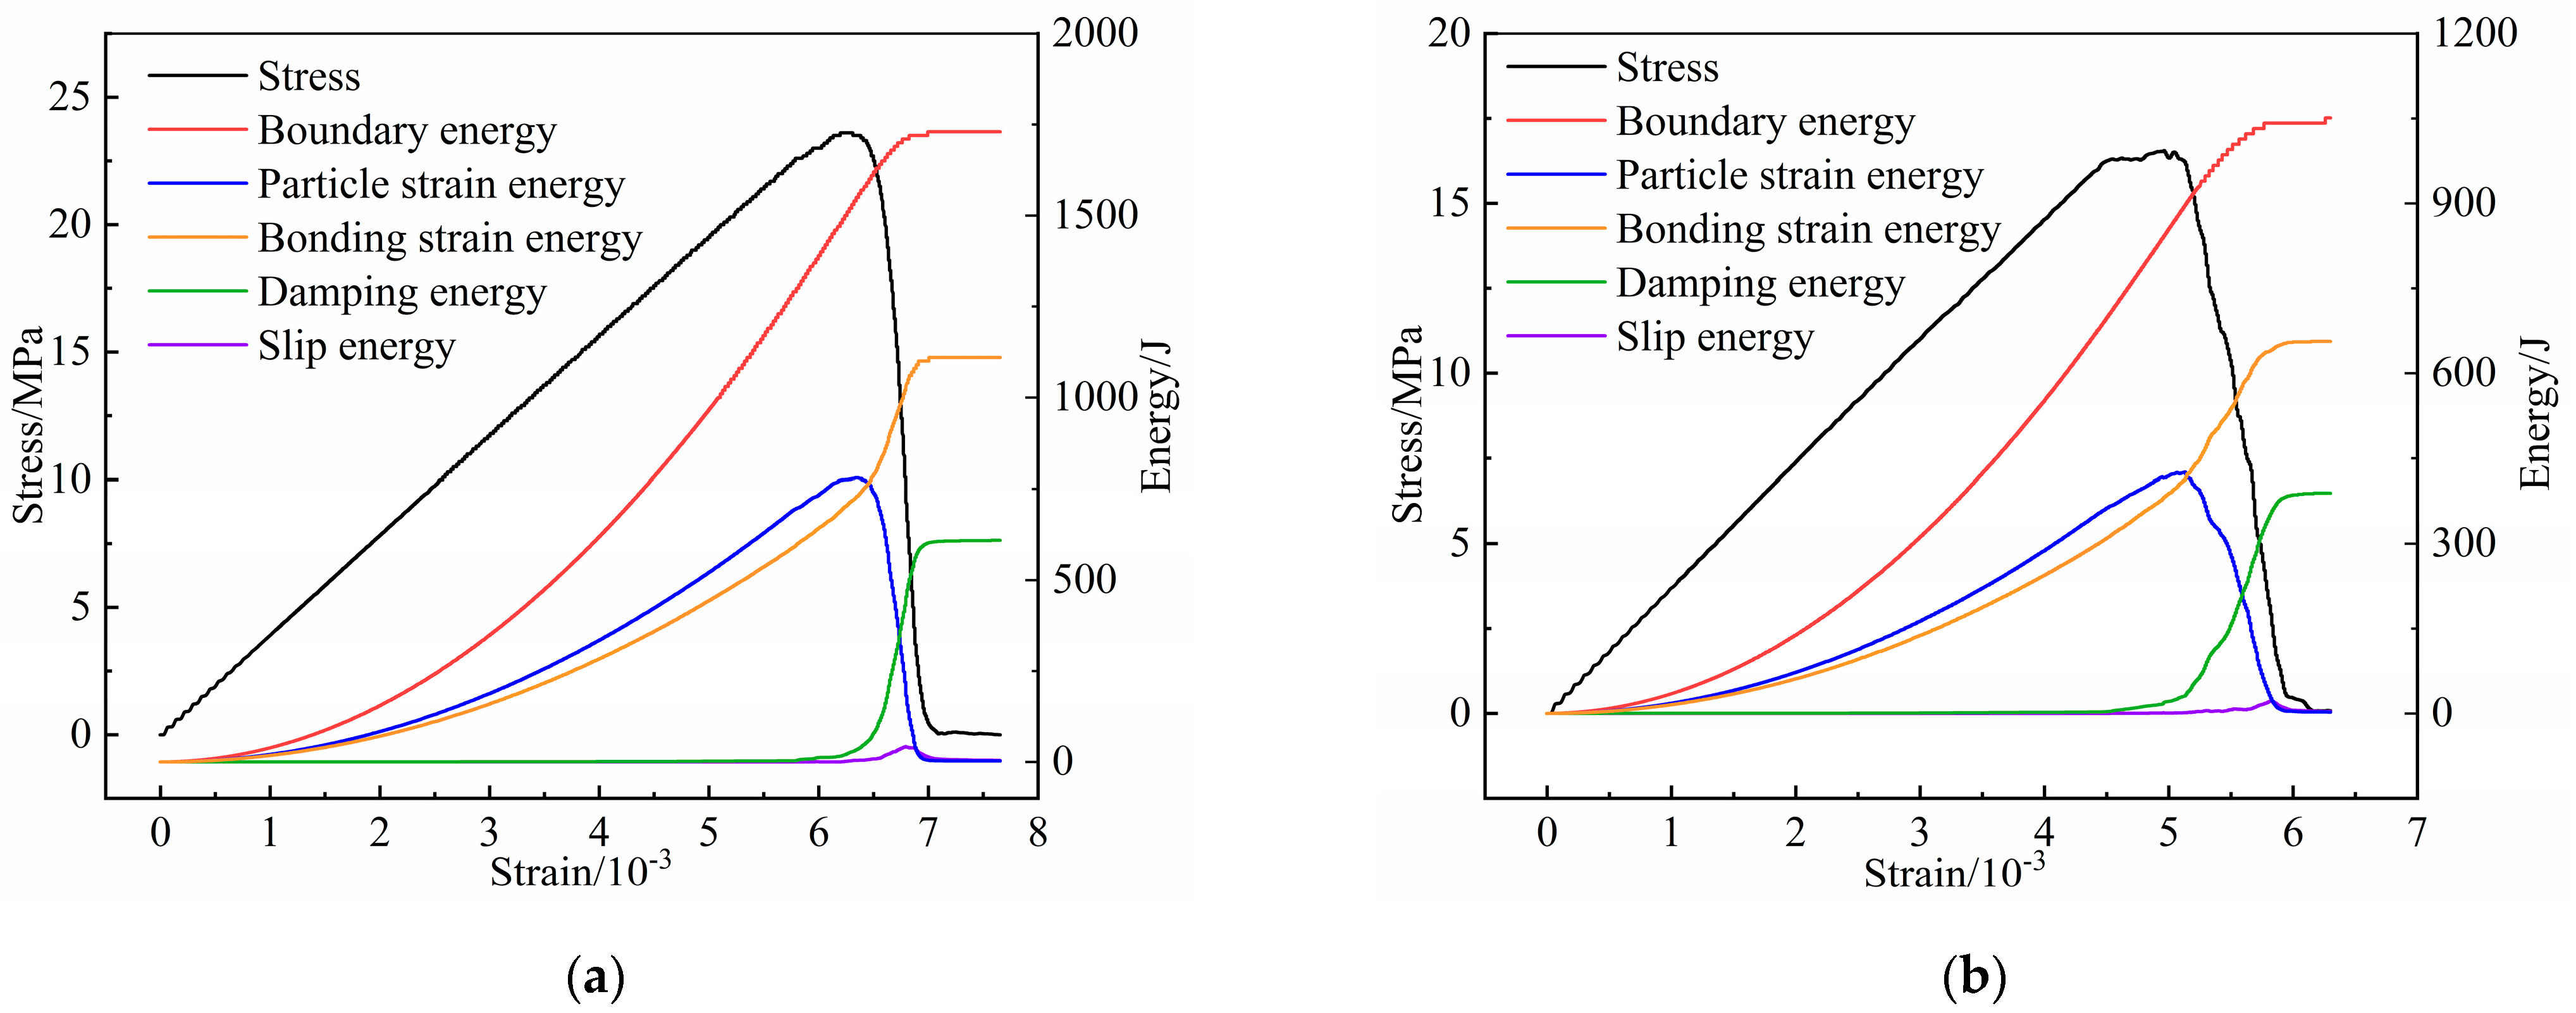
In the process of rock deformation and failure, energy is continuously exchanged with the external environment. Assuming negligible heat exchange between the testing system and the surroundings, the total energy input into the system during rock failure is represented by boundary energy. During loading, this boundary energy is distributed among particle strain energy, cementation strain energy and dissipated energy (including slip energy and damping energy). The Fish language in PFC software is employed to monitor the various energy data during uniaxial compression [35], providing an accurate reflection of the energy evolution process in loading. Figure 18 illustrates the energy evolution curves for both the intact specimen and the T30-0 specimen.
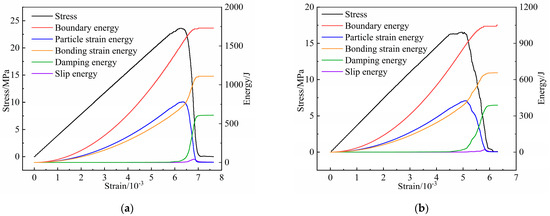
Figure 18.
Energy evolution curve: (a) Intact specimen; (b) T30-0 specimen.
The energy evolution curve of the drilling specimen exhibits a shape that is largely consistent with that of the intact specimen. Prior to specimen failure, the boundary energy and strain energy increase as the strain increases. This occurs because, during the loading process, external boundary energy is initially converted into the strain energy of the specimen. When the specimen fails, dissipative energy and bonding strain energy rise rapidly, while particle strain energy decreases sharply due to sliding friction between particles and energy dissipation during the failure process. Table 4 presents the energy peaks of specimens under various drilling parameters. All forms of energy peaks in drilling specimens are lower than those in intact samples. Specifically, the boundary energy of the T30-0 sample is the smallest, and the ratio of dissipated energy to total energy is the highest, 38.99%. These findings indicate that drilling can not only effectively reduce the energy accumulation capacity, but also enhance the degree of energy dissipation, thereby achieving an excellent pressure relief effect.
Table 4.
Various energy peaks under different drilling parameter combinations.
5. Analysis of Pressure Relief Effect and Discussion
5.1. Evaluation Method of Pressure Relief Effect
Burst tendency is an inherent attribute to determine whether rock burst can occur in coal, which is related to the mechanical properties of coal itself. The test process and classification standard of the burst tendency index of coal are provided [8]. The impact energy index (KE) reflects the ability of rock to store elastic strain energy and is a direct criterion of impact risk. A large number of rock burst cases show that the impact energy index has a strong positive correlation with the probability of accident occurrence. In this paper, the reduction degree of the impact energy index (XK) is used to evaluate the pressure relief effect.
where S is pre-peak accumulated strain energy, and Ax is the strain energy lost after the peak.
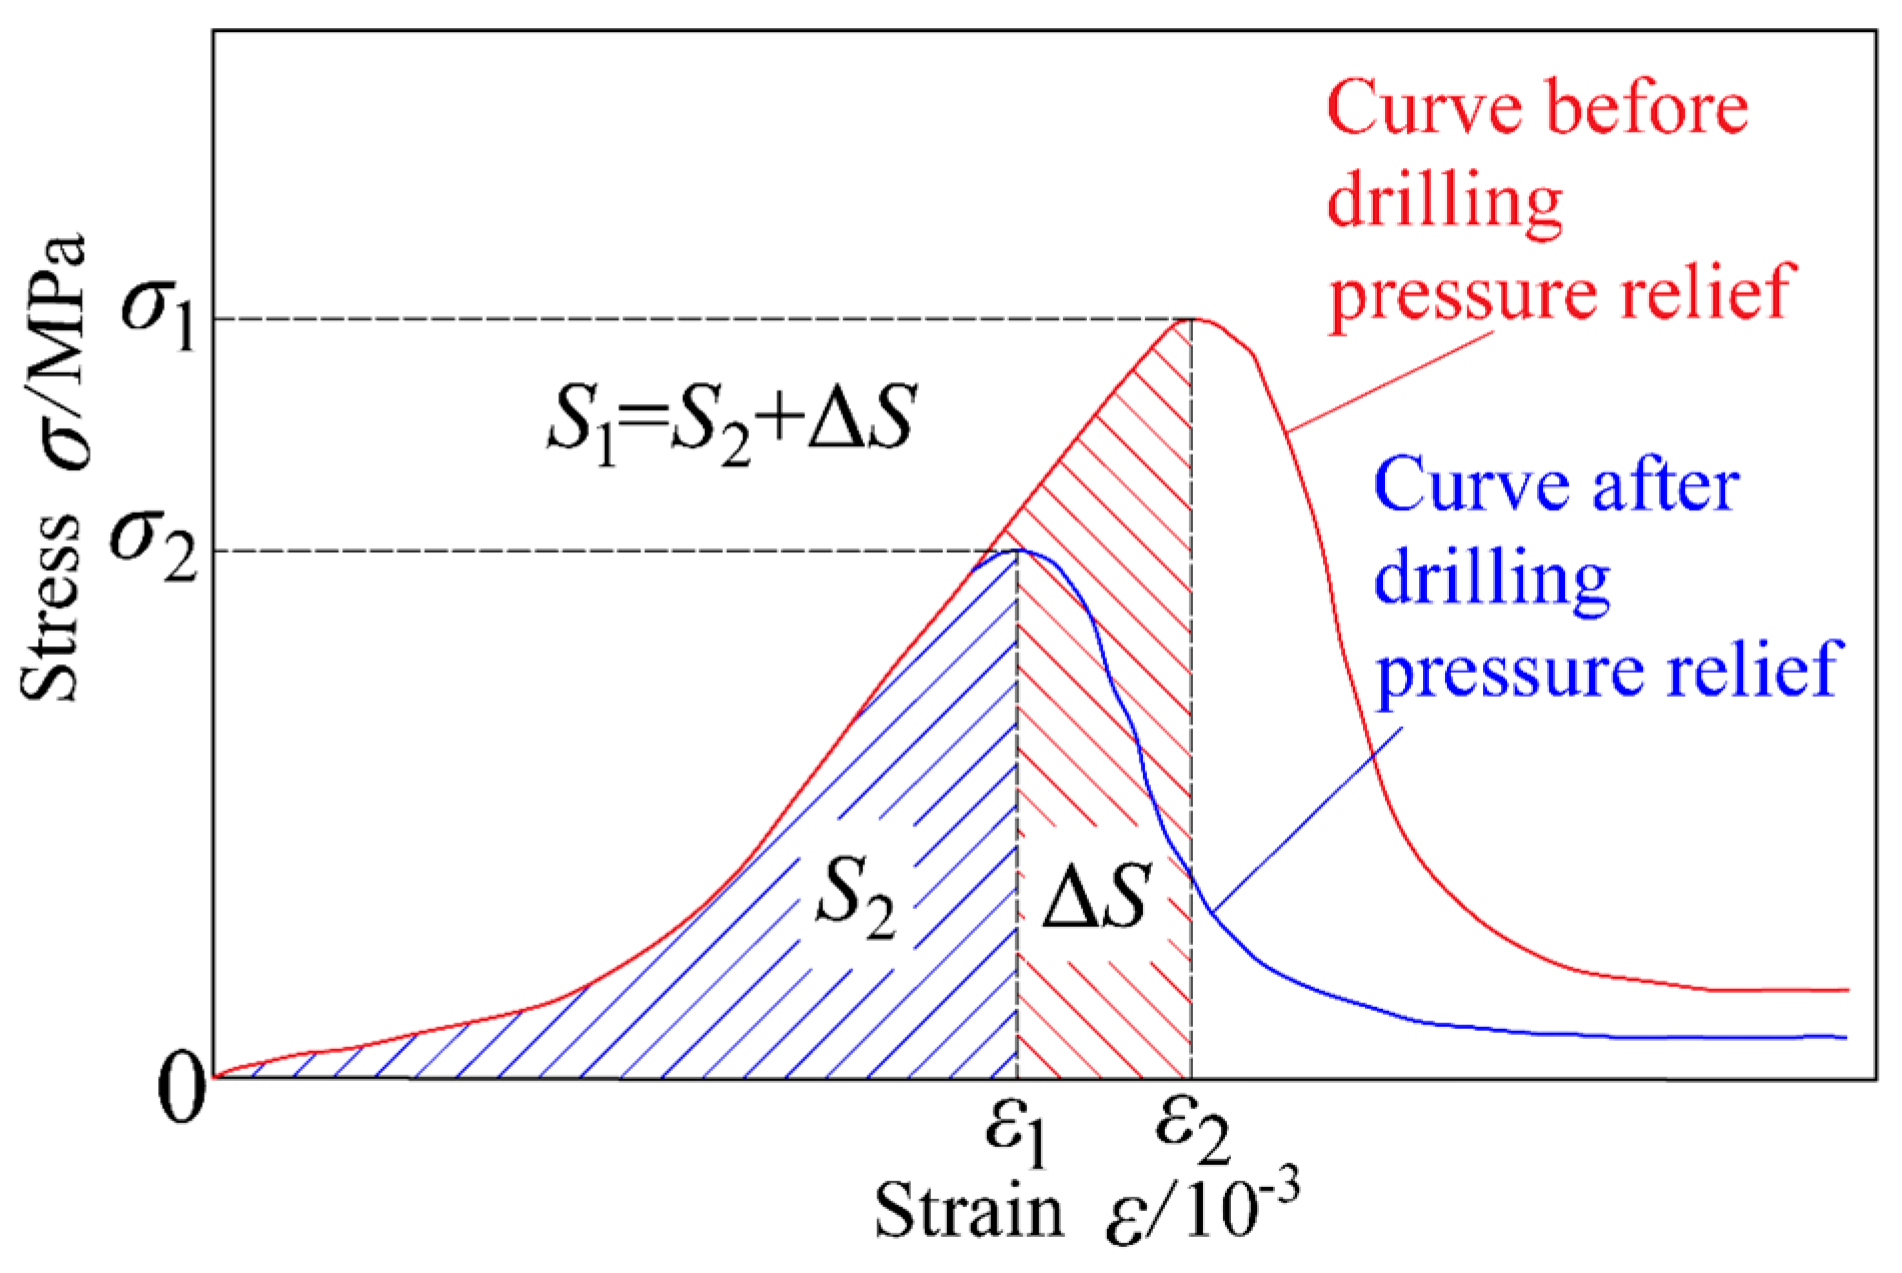
Zhu [15] first proposed the concept of the energy dissipation index method to evaluate the pressure relief effect. The energy dissipation index (XS) refers to the ratio of the strain energy released during the unloading process to the strain energy accumulated before the peak in the whole stress–strain curve under uniaxial compression. The energy dissipation index (XS) can reflect the proportion of energy consumed by plastic deformation in the process of pressure relief, reflecting the effectiveness of pressure relief measures. As shown in Figure 19, curve 1 is the stress–strain curve of coal rock before drilling pressure relief, and curve 2 is the stress–strain curve of coal rock after drilling pressure relief. The energy dissipation index is calculated by:
where σ1 is the peak strength before pressure relief; σ2 is the peak strength after pressure relief; ε1 is the peak strain before pressure relief; ε2 is the peak strain after pressure relief; and ΔS is the dissipated strain energy. S1 is the accumulated strain energy before the peak value of pressure relief, and S2 is the residual strain energy before the peak after pressure relief.
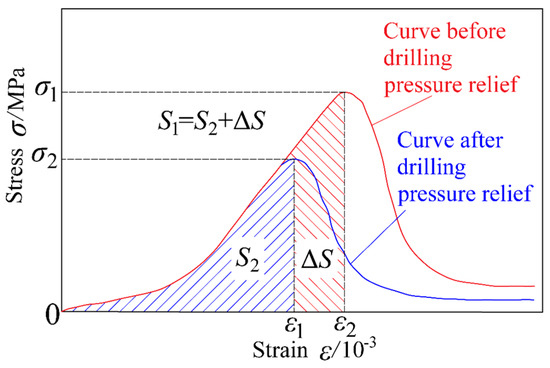
Figure 19.
Calculation of energy dissipation index.
Zhang [25] proposed the strength reduction index to evaluate the pressure relief effect. The strength reduction index (Xσ) is the ratio of the peak strength of coal and rock mass after pressure relief under uniaxial compression to the peak strength before pressure relief. The strength reduction index reflects the attenuation degree of the peak strength of the sample and should be controlled within a reasonable range.
Based on the above three indexes and considering the actual situation of drilling pressure relief in coal mines, applying different weights to the three indexes, the pressure relief effect evaluation index (X) is proposed. It can comprehensively consider the influence of drilling parameters on the energy storage capacity, energy dissipation capacity and peak strength of the specimen: the larger the X value, the better the pressure relief effect. The calculation formula of the pressure relief effect evaluation index (X) is as follows:
5.2. Influence of Drilling Parameters on Pressure Relief Effect
5.2.1. Influence of Drilling Layouts on Pressure Relief Effect
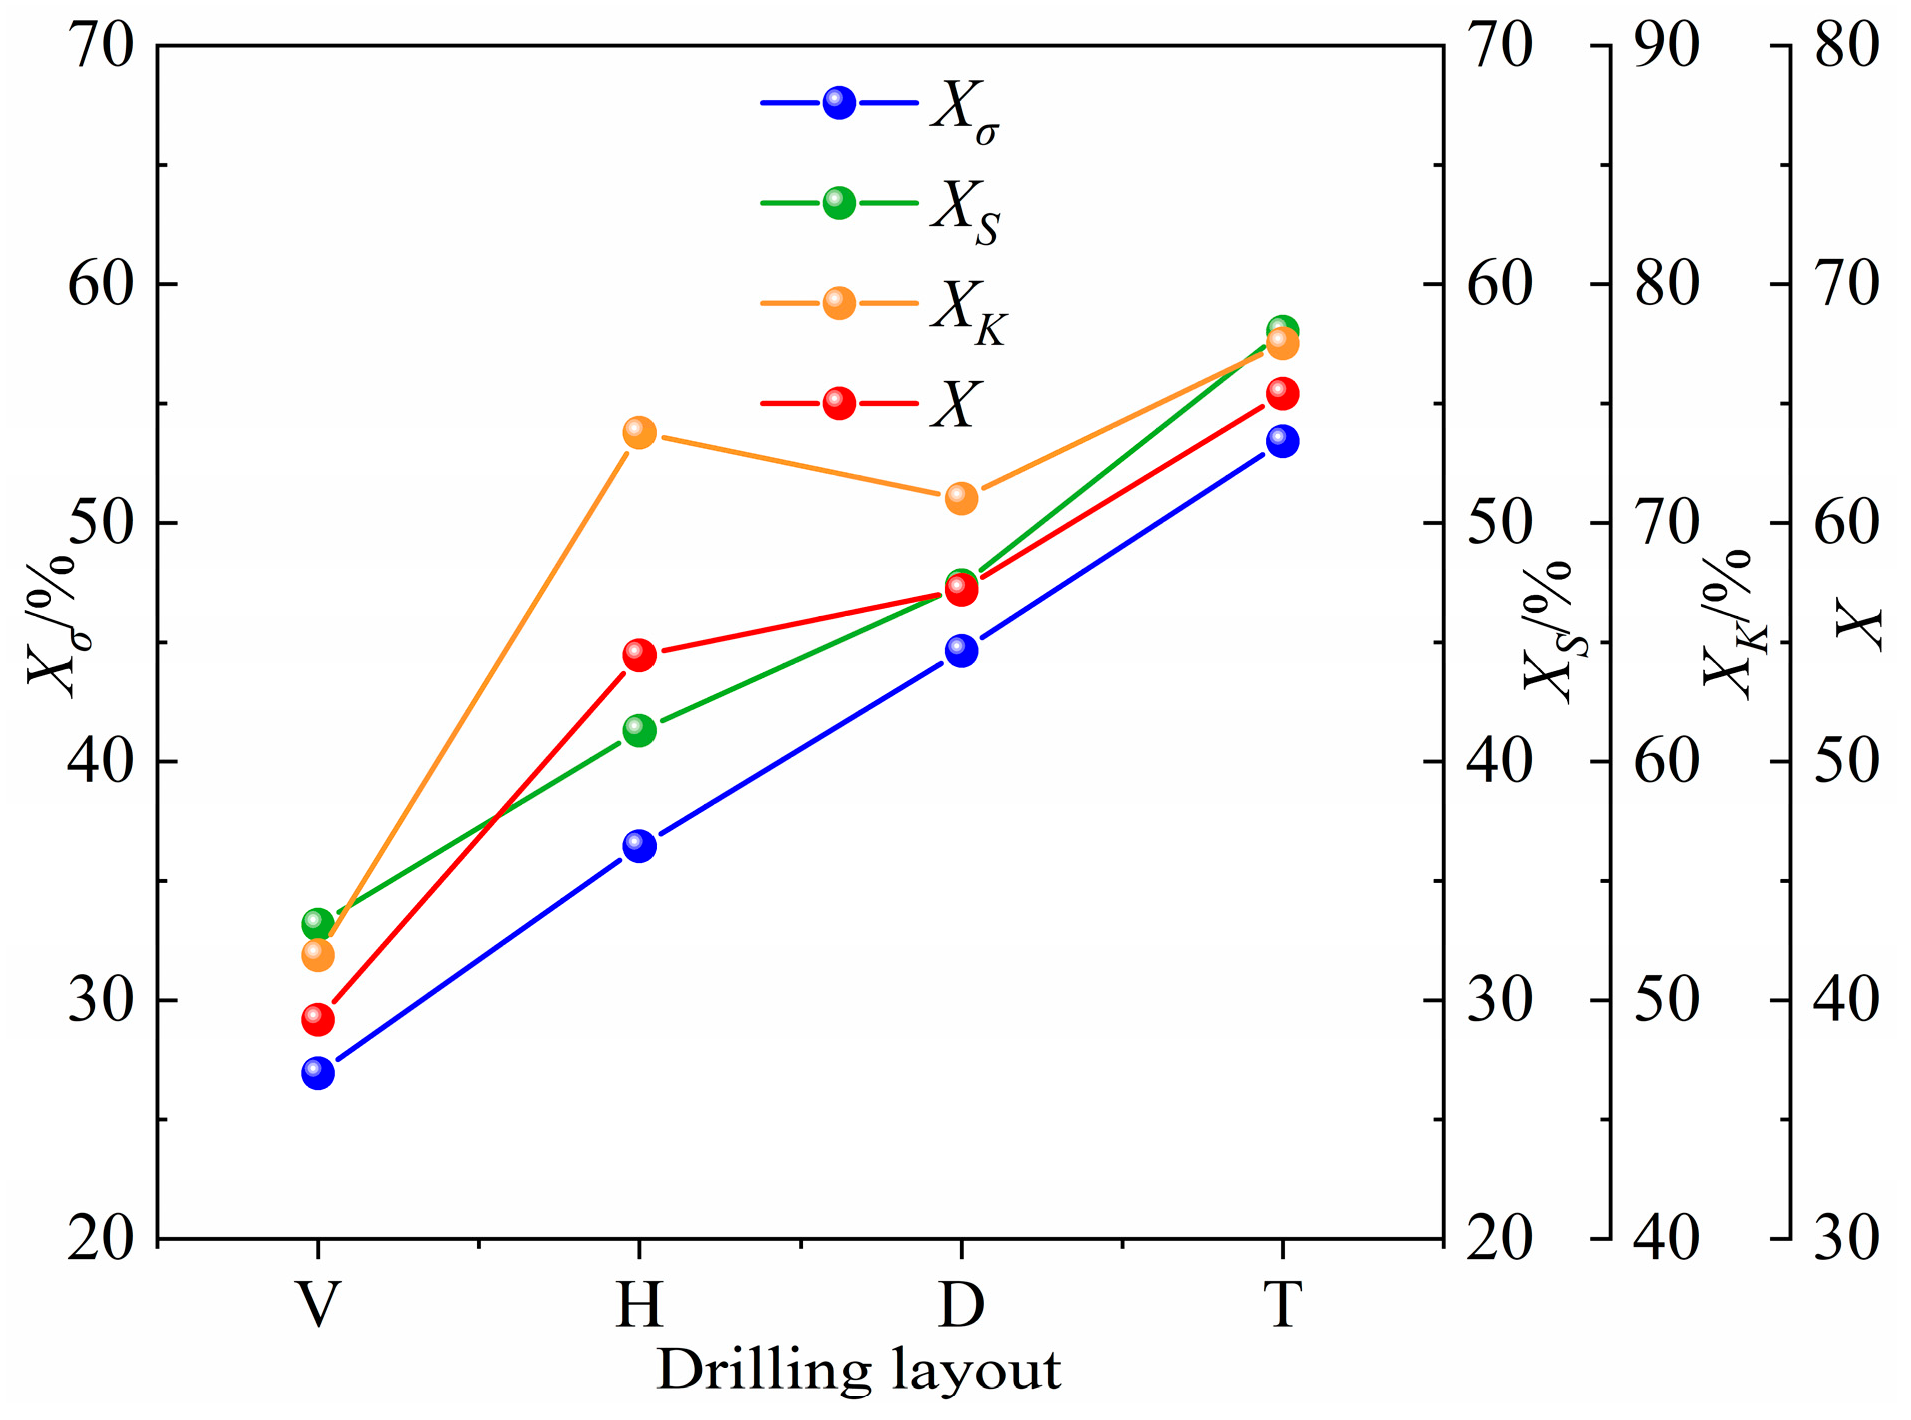
The change in drilling layout will form different artificial weak planes inside the specimen, which will interact with the potential weak plane of the specimen itself. It affects the peak strength, crack propagation and energy dissipation capacity of the specimen and the final pressure relief effect. The calculation results of the pressure relief effect indexes of specimens with different layout modes are shown in Table 5, where Δσ is the difference in peak strength before and after pressure relief. As shown in Figure 20, compared with the intact specimen, the strength reduction index of the vertical-drilling specimen, horizontal-drilling specimen, diagonal-drilling specimen and triangular-drilling specimen is 26.93%, 36.45%, 44.64% and 53.41%, respectively. The pre-peak accumulated strain energy of drilling specimens also decreased correspondingly, and the energy dissipation index was 33.17%, 41.29%, 47.39% and 58.01%, respectively. The impact energy index of the intact specimen, vertical specimen, horizontal specimen, diagonal specimen and triangular specimen decreased from 5.07 to 2.44, 1.33, 1.47 and 1.14, respectively. It can be seen that different drilling layouts can effectively reduce the burst tendency of the specimen.
Table 5.
Evaluation index for the pressure relief effect of specimens with different drilling layouts.
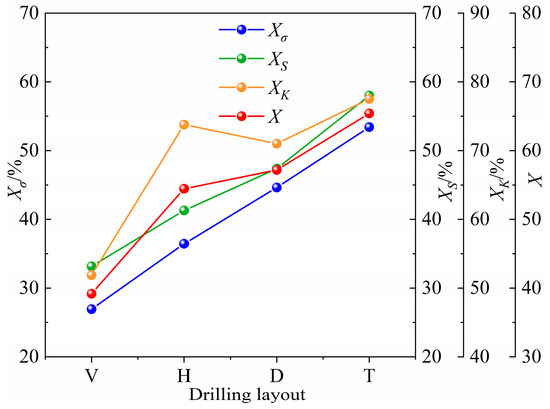
Figure 20.
Relationship between different drilling layouts and the evaluation index of pressure relief effect.
Compared with the intact specimen, the pressure relief effect evaluation index (X) of the vertical-drilling specimen, horizontal-drilling specimen, diagonal-drilling specimen and triangular-drilling specimen is 39.18, 54.45 57.45 and 65.41, respectively. Therefore, the triangular-layout drilling has the best pressure relief effect.
5.2.2. Influence of Drilling Spacings on Pressure Relief Effect
When the drilling layout is determined, the different drilling spacings will affect the stress interaction and the crack propagation process between the drillings, thus affecting the final pressure relief effect. The calculation results of the pressure relief effect indexes of specimens with different spacing modes are shown in Table 6. As shown in Figure 21, compared with the intact specimen, with the increase in drilling spacing, the pressure relief effect evaluation index (X) was first increased and then decreased, and was 59.66, 65.41, 64.09 and 57.06, in sequence. This indicates that the pressure relief effect is best when the drilling spacing is three times the diameter.
Table 6.
Evaluation index for the pressure relief effect of specimens with different drilling spacings.

Figure 21.
Relationship between different drilling spacings and the evaluation index of pressure relief effect.
5.2.3. Influence of Drilling Positions on Pressure Relief Effect
During the determination of drilling layout and spacing, because of the different stress states of specimens during uniaxial compression, the change in drilling position will also affect the pressure relief effect. The calculation results of the pressure relief effect indexes of specimens with different position modes are shown in Table 7. As shown in Figure 22, the strength reduction index and energy dissipation index decreased with the upward movement of the drilling position. The residual strength increases with the upward movement of the drilling position, and the post-peak strain energy is also increased, resulting in the impact energy index gradually decreasing with the upward movement of the drilling position. Compared with the intact specimen, the pressure relief effect evaluation index (X) decreased with the upward movement of the drilling position, and was 65.41, 60.67, 59.23 and 57.10, in sequence. It can be concluded that drilling in the middle of the specimen has the best pressure relief effect.
Table 7.
Evaluation index for the pressure relief effect of specimens with different drilling positions.
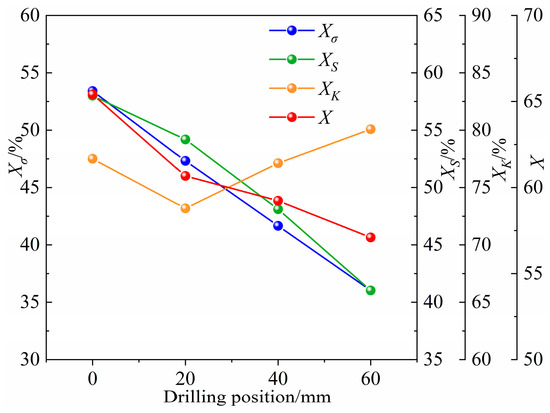
Figure 22.
Relationship between different drilling positions and the evaluation index of pressure relief effect.
5.3. Discussion
(1) According to the value of the pressure relief effect evaluation index (X) under different drilling parameters, it is determined the influence degree of the drilling layout, drilling spacing and drilling position on the pressure relief effect. The X values of different drilling layouts ranged from 35.72–65.41, with a range of 26.93. The X value of drilling spacing ranged from 57.06–65.41, with a range of 8.31, and the X value of hole position ranged from 57.10–65.41, with a range of 8.35. Therefore, the drilling layout has the greatest influence on the pressure relief effect, and the change in drilling layout can be given priority in the actual working condition.
(2) In the process of carrying out the tests, the poured specimens were first placed in a constant-temperature curing room for maintenance, and the test conditions (temperature, homogeneity of specimens) were ensured as much as possible to reduce the influence of possible errors on the test results. Therefore, during the test, the results were valid at room temperature. The test results can serve as a valuable reference for selecting drilling parameters when implementing the drilling pressure relief with a large diameter in rock burst mines. However, from the laboratory test results to the application of drilling pressure relief under practical engineering conditions, it is necessary to consider many factors, such as geometric similarity and coal seam occurrence conditions. Therefore, in order to make the research results better meet the actual engineering conditions on the site, in the further research plan, the influence of temperature, gas pressure, original rock stress and disturbance stress on the drilling parameters, the mechanical properties of coal and the effectiveness of drilling pressure relief methods will be studied.
6. Conclusions
(1) The stress–strain curve shape of the specimen is affected by the drilling parameters, especially the drilling layout. Compared with the intact specimen, the peak strength of the drilling specimen is significantly reduced, and the drilling layout has the greatest influence on the mechanical properties, followed by the drilling spacing and drilling position. The peak strength of the specimen with a triangular layout is the smallest (10.93 MPa). The peak strength decreases first and then increases with the increase in drilling spacing, and the peak strength is the smallest when the drilling spacing is three times the diameter. The peak strength increases gradually as the drilling position moves upward.
(2) In the process of uniaxial compression, the stress distribution inside the specimen will affect the stress concentration around the drilling. Different drilling layouts will form different weak-strength surfaces in the specimen, and lead the expansion and penetration of cracks, resulting in different failure modes of the specimen. The failure modes of the specimens in vertical layout, horizontal layout, diagonal layout and triangular layout are tensile failure, x-conjugate shear failure, single-diagonal-plane shear failure and tensile shear mixed failure. According to the different drilling spacings, the failure modes can be divided into independent-type failure, independent-through-transitional-type failure and through-type failure. The drilling position will affect the crack propagation and finally affect the damage degree of the specimen.
(3) Drilling can not only effectively reduce the energy accumulation capacity, but also enhance the degree of energy dissipation. The AE ringing counts and energy of the triangular-drilling specimens are the least. The AE ringing counts and energy decrease first and then increase with the increase in the drilling spacing, and are the smallest at three times the drilling diameter. The AE ringing counts and energy increase gradually with the upward movement of the drilling position.
(4) Under different combinations of drilling parameters, the drilling layout being triangular, the drilling spacing being three times the hole diameter and the drilling position being in the middle of the specimen have the best pressure relief effects. Compared with the intact specimen, the strength reduction index (Xσ) is 53.41%, the energy dissipation index (XS) is 58.01%, the reduction degree of impact energy index (XK) is 77.51%, and the pressure relief effect evaluation index (X) is 65.41.
Author Contributions
Conceptualization, Y.Z. and S.Z.; methodology, Y.Z. and Y.C.; software, Y.W. and S.Z.; validation, S.L. and Y.W.; investigation, Y.C., Q.W., Y.W., S.L. and L.Z.; resources, G.F. and Y.Z.; writing—original draft preparation, Y.C.; writing—review and editing, Y.Z., S.Z. and Y.C.; project administration, Y.Z., S.Z. and G.F.; funding acquisition, Y.Z., S.Z. and B.W. All authors have read and agreed to the published version of the manuscript.
Funding
This research was funded by the National Natural Science Foundation of China (Nos. 52374100, 52304150, 52204107), China Postdoctoral Science Foundation-funded project (No. 2020M682215) and Fundamental Research Program of Shanxi Province (No. 202203021212252).
Data Availability Statement
The data presented in this study are available on request from the corresponding author.
Conflicts of Interest
Author Liang Zhao was employed by the Yangcheng County Yangtai Group Industrial Co., Ltd. Author Yujiang Zhang is part of the Postdoctoral Centre at Shandong Energy Group Co., Ltd. The remaining authors declare that the research was conducted in the absence of any commercial or financial relationships that could be construed as potential conflicts of interest.
References
- Pan, Y.; Song, Y.; Liu, J. Pattern, Change and new situation of coal mine rock burst prevention and control in China. Chin. J. Rock Mech. Eng. 2023, 42, 2081–2095. [Google Scholar]
- Dou, L.; Tian, X.; Cao, A.; Gong, S.; He, H.; He, J.; Cai, W.; Li, X. Present situation and problems of coal mine rock burst prevention and control in China. J. China Coal Soc. 2022, 47, 152–171. [Google Scholar]
- Pan, J.; Liu, S.; Ma, W.; Xia, Y.; Wang, S.; Feng, M. Occurrence law and classification prevention of rock burst in coal mines of Shaanxi Province. Coal Sci. Technol. 2024, 52, 95–105. [Google Scholar]
- Zhao, T.B.; Guo, W.Y.; Tan, Y.L.; Yin, Y.C.; Cai, L.S.; Pan, J.F. Case studies of rock bursts under complicated geological conditions during multi-seam mining at a depth of 800 m. Rock Mech. Rock Eng. 2018, 51, 1539–1564. [Google Scholar]
- Gong, F.; He, Z.; Si, X. Experimental study on revealing the mechanism of rockburst prevention by drilling pressure relief: Status-of-the-art and prospects. Geomat. Nat. Hazards Risk 2022, 13, 2442–2470. [Google Scholar]
- Pan, Y. Disturbance response instability theory of rock burst in coal mine. Coal Sci. Technol. 2018, 43, 2091–2098. [Google Scholar]
- GB/T 25217.10-2019; Methods for Test, Monitoring and Prevention of Rock Burst—Part 10: Prevention Method of Drillhole Destressing on Coal-Seam. Standardization Administration of China: Beijing, China, 2019.
- GB/T 25217.2-2010; Methods for Test, Monitoring and Prevention of Rock Burst—Part 2: Classification and Laboratory Test Method on Bursting Liability of Coal. Standardization Administration of China: Beijing, China, 2010.
- Wang, M.; Wang, X.; Xiao, T. Borehole destressing mechanism and determination method of its key parameters in deep roadway. Coal Sci. Technol. 2017, 42, 1138–1145. [Google Scholar]
- Zhao, X.; Zhang, H.; Zhu, W. Fracture evolution around pre-existing cylindrical cavities in brittle rocks under uniaxial compression. Trans. Nonferr. Met. Soc. China 2014, 24, 806–815. [Google Scholar] [CrossRef]
- Lin, P.; Wong, R.H.; Tang, C.A. Experimental study of coalescence mechanisms and failure under uniaxial compression of granite containing multiple holes. Int. J. Rock Mech. Min. Sci. 2015, 77, 313–327. [Google Scholar]
- Jia, C.; Jiang, Y.; Zhang, X.; Wang, D.; Ruan, H.; Wang, C. Laboratory and numerical experiments on pressure relief mechanism of large-diameter boreholes. Chin. J. Geotech. Eng. 2017, 39, 1115–1122. [Google Scholar]
- Wang, P.; Jiang, Y.; Li, P.; Zhou, J.; Zhou, Z. Experimental analysis of pressure relief effect of surrounding rock in high-stress roadways under different drilling parameters. Appl. Sci. 2023, 13, 2511. [Google Scholar] [CrossRef]
- Zhu, Q.; Yin, Y.; Liu, J.; Wen, J.; Shi, J. Mechanism of hysteretic rock burst and outburst induced by surrounding rock stress returning. China Saf. Sci. J. 2017, 27, 99–104. [Google Scholar]
- Zhu, S.; Jiang, F.; Shi, X.; Sun, G.; Zhang, Z.; Cheng, X.; Zhang, H. Energy dissipation index method for determining rock burst prevention drilling parameters. Rock Soil Mech. 2015, 36, 2270–2276. [Google Scholar]
- Yao, J.; Yin, Y.; Zhao, T.; Ren, W.; Qiu, Y.; Guo, W. Segmented enlarged-diameter borehole destressing mechanism and its influence on anchorage support system. Energy Sci. Eng. 2020, 8, 2831–2840. [Google Scholar] [CrossRef]
- Ma, B.; Deng, Z.; Zhao, S.; Li, S. Analysis on mechanism and influencing factors of drilling pressure relief to prevent rock burst. Coal Sci. Technol. 2020, 48, 35–40. [Google Scholar]
- Wang, Q.; Zhang, Y.; Cui, D.; Feng, G.; Du, Y.; Zhang, S.; Chen, H.; Zhang, Z. Effect of Indenter Angle on Bearing Performance of Coal and Accompanying Rocks Under Point Load and Characterization of Mechanical Parameters. Energy Sci. Eng. 2024, 13, 374–391. [Google Scholar]
- Tai, L.; Li, C.; Hu, Y.; Yu, X.; Xu, Z.; Zhang, X.; Lu, S. Experimental study on the significance of pressure relief effect and crack extension law under uniaxial compression of rock-like materials containing drill holes. Sci. Rep. 2024, 14, 1104. [Google Scholar]
- Zhang, Y.; Cui, B.; Wang, Y.; Zhang, S.; Feng, G.; Zhang, Z. Evolution Law of Shallow Water in Multi-Face Mining Based on Partition Characteristics of Catastrophe Theory. Fractal Fract. 2023, 7, 779. [Google Scholar] [CrossRef]
- Yin, Y.; Chen, B.; Zhang, Y.; He, S.; Yao, C.; Liu, C. Experimental study and evaluation on the weakening of bursting liability of coal with boreholes. Eng. Fail. Anal. 2024, 155, 107754. [Google Scholar]
- Yin, Y.; Chen, B.; Han, Y.; Qiu, Y.; Li, C.; Chen, Y. Evolution Law of Stress Field and Pressure Relief Effect of Coal Seam After Drilling. Energy Sci. Eng. 2024, 12, 5493–5503. [Google Scholar]
- Ma, J.; Li, J.; Zhang, S.; Yang, S.; Dong, X.; Liu, D. Numerical simulation analysis of acoustic emission characteristics during the drilling pressure relief process in coal seams under different influencing factors. Processes 2023, 11, 3277. [Google Scholar] [CrossRef]
- Wu, H.; Zhao, G.; Liang, W. Mechanical properties and fracture characteristics of pre-holed rocks subjected to uniaxial loading: A comparative analysis of five hole shapes. Theor. Appl. Fract. Mech. 2020, 105, 102433. [Google Scholar]
- Zhang, S.; Li, Y.; Shen, B.; Sun, X.; Gao, L. Effective evaluation of pressure relief drilling for reducing rock bursts and its application in underground coal mines. Int. J. Rock Mech. Min. Sci. 2019, 114, 7–16. [Google Scholar]
- Nian, J.; Zhao, B.; Zhang, W. Numerical simulation research on the pressure relief and permeability enhancement mechanism of large-diameter borehole in coal seam. Geofluids 2022, 2022, 2926213. [Google Scholar]
- Wang, A.; Gao, Q.; Pan, Y.; Song, Y.; Li, L. Bursting liability and energy dissipation laws of prefabricated borehole coal samples. J. China Coal Soc. 2021, 46, 959–972. [Google Scholar]
- Zuo, J.; Hu, S.; Zhou, X.; Zhang, C.; Guo, Y. Effective evaluation of pressure relief drilling layout for reducing rock bursts and sensitive factor analysis. Arab. J. Geosci. 2021, 14, 2643. [Google Scholar]
- Gong, F.; He, Z.; Jiang, Q. Internal mechanism of reducing rockburst proneness of rock under high stress by real-time drilling pressure relief. Rock Mech. Rock Eng. 2022, 55, 5063–5081. [Google Scholar]
- He, Z.; Gong, F.; Luo, S. Evaluation of the rock burst proneness of red sandstone with prefabricated boreholes: An experimental study from the energy storage perspective. Geomat. Nat. Hazards Risk 2021, 12, 2117–2154. [Google Scholar]
- Lyu, J.; Qi, L.; Pan, Y.; Dai, L.; Tang, Z.; Wang, X. Study on the pressure relief energy dissipation law of variable-diameter boreholes in roadway surrounding rock under dynamic and static loads. PLoS ONE 2024, 19, e0306449. [Google Scholar]
- Chen, M.; Zhang, Y.; Zang, C.; Zhang, G.; Li, Q.; Jiang, B. Experimental investigation on pressure relief mechanism of specimens with prefabricated reaming boreholes. Rock Mech. Rock Eng. 2023, 56, 2949–2966. [Google Scholar]
- Qi, Y.; Jing, H.; Meng, B.; Dong, Z.; Liu, D. Experimental modelling on size effect of pressure relief hole. J. Min. Saf. Eng. 2018, 35, 538–544. [Google Scholar]
- Zhang, T.; Jing, C.; Zhang, L.; Ji, X.; Pan, H. Strain localization characteristics of perforation failure of perforated specimens. Coal Sci. Technol. 2020, 45, 4087–4094. [Google Scholar]
- Guo, J.; Feng, Z.; Li, X. Evolution of microcracks and energy of granite during shear test with PFC3D. Coal Sci. Technol. 2024, 52, 60–70. [Google Scholar]

Disclaimer/Publisher’s Note: The statements, opinions and data contained in all publications are solely those of the individual author(s) and contributor(s) and not of MDPI and/or the editor(s). MDPI and/or the editor(s) disclaim responsibility for any injury to people or property resulting from any ideas, methods, instructions or products referred to in the content. |
© 2025 by the authors. Licensee MDPI, Basel, Switzerland. This article is an open access article distributed under the terms and conditions of the Creative Commons Attribution (CC BY) license (https://creativecommons.org/licenses/by/4.0/).