Abstract
Pneumatic polishing tools are commonly used in traditional robot mold polishing systems, but they have problems with the stable control of mold surface roughness due to low precision and poor adaptability in polishing force adjustment. The integration of an adaptive hydraulic polishing (AHP) tool and robot system effectively solves the above problems, providing a robust solution for the high-precision polishing of various molds. This study systematically investigates the robotic polishing of NAK80 mold steel using an AHP-equipped robotic platform with 3M abrasive discs of progressively refined grit sizes (P180, P400, P800). Through single-factor experiments and response surface methodology, the effects of polishing force, rotational speed, and feeding speed on surface roughness were quantitatively analyzed. The relationship between surface roughness and the polishing parameters was derived to elucidate the roughness evolution before and after over-polishing. Orthogonal experiments combined with range analysis identified optimal parameter combinations for P180 (20 N polishing force, 5000 RPM rotational speed, and 5 mm·s−1 feeding speed) and P400 abrasives (10 N polishing force, 4000 RPM rotational speed, and 5 mm·s−1 feeding speed), achieving minimum surface roughness values of 0.08 µm and 0.044 µm, respectively. For P800 abrasives, a central composite design was used to develop a roughness prediction model with a ≤7.14% relative error, and the optimal parameters are a 20 N polishing force, a 5000 RPM rotational speed, and a 5 mm·s−1 feeding speed. The sequential application of the optimized parameters across all the grit sizes can reduce the surface roughness from an initial 0.4 µm to a final 0.017 µm, representing a 95.75% improvement in the surface finish.
1. Introduction
The mold constitutes the most pivotal component in the injection molding process, and its surface finish directly governs both the product quality and mold lifespan [1]. In order to eliminate tool marks and hardened layers resulting from machining operations on the mold cavity surface, polishing is indispensable for attaining the desired dimensions, shape, and surface roughness. Techniques for enhancing mold surface finish commonly include grinding, polishing, and lapping [2]. Traditional manual polishing suffers from unstable surface quality, low efficiency, and difficulty in meeting nanoscale surface requirements, leading to its gradual replacement by CNC polishing machines and robots, which effectively improve polishing efficiency and surface uniformity [3].
There are many ways to reduce the surface roughness of a mold. Currently, commonly employed methods include airbag polishing, magnetorheological polishing, and flexible disc polishing. Airbag polishing technology, initially proposed by Walker et al. [4], represents a flexible polishing technique. Through long-term research and development, it has demonstrated numerous advantages in the polishing domain due to its distinctive airbag structure. Nevertheless, it also gives rise to issues such as non-uniform stress distribution and unstable polishing trajectories, thereby rendering it less adaptable to the polishing of free-form surfaces [5]. Magnetorheological polishing, put forward by Kordonski et al. [6] based on the integration of electromagnetic and fluid dynamics theories, accomplishes the grinding and polishing of the workpiece surface via the frictional interaction between abrasive particles and the workpiece surface. However, this method is constrained by the size and curvature of the polishing wheel. It demands high surface shape accuracy of the workpiece, allows for only a small material removal amount, and suffers from low efficiency [7]. Flexible disc polishing is applicable to complex free-form surface workpieces, enabling uniform polishing and yielding a smooth and high-quality surface. This method chiefly depends on CNC centers to complete the automated polishing process [8]. Shiou et al. [9] accomplished the ultra-precision surface finishing of NAK80 mold steel by executing continuous ball polishing on CNC machining centers, optimizing parameters via orthogonal arrays and ANOVA to reduce average roughness from 0.06 μm to 0.016 μm. Huang et al. [10] developed a flexible polishing head chuck, achieving an Ra value of 0.006 μm on plastic mold steel. Zhao et al. [11] established a roughness prediction model for integrally bladed rotors utilizing response surface methodology, achieving a minimum roughness of 0.18 μm. Liu et al. [12] employed a nanosecond pulsed laser surface treatment to rectify polishing defects, offering new insights into laser polishing for roughness improvement.
The flexibility of high-precision mold polishing on CNC centers is relatively limited. In contrast, employing robots for mold polishing can effectively address the issue of the poor flexibility inherent in CNC machining. This offers a more adaptable solution for the complex requirements of mold polishing processes [13,14]. Xie et al. [15] optimized parameters for robotic mold steel polishing, achieving a roughness of 0.3 μm utilizing regression models. Qi et al. [16] proposed an integrated framework that integrates the L-BFGS-B optimization algorithm and image processing to predict the surface roughness of Inconel718. However, research on the roughness of molds polished by robots should not be limited solely to methods and experiments. Wang et al. [17] designed a contact motion planning strategy based on dynamic systems to generate trajectory routes during local polishing. This strategy ensures a constant contact force between the end effector of the polishing robot and the workpiece, enabling the robot to have flexible control. Wahballa et al. [18] put forward a robot polishing method for compound surfaces, including planes and curved surfaces, based on smooth trajectory planning, a constant force algorithm, and contour removal depth modeling. The method uses an online stiffness and inverse damping force impedance controller supported by a gravity compensation algorithm to achieve a constant polishing force. Mohsin et al. [19] proposed an effective approach for the robot polishing of complex curved surfaces, which relies on tool path planning with controlled forces and polishing parameter optimization using experiment design. Moreover, this theoretical modeling holds significant guidance for roughness reduction [20]. Verma et al. [21] investigated the contributions of various process parameters, materials, and geometric characteristics to the modeling of surface roughness obtained using pneumatic polishing processes. Based on Hertz’s contact theory for elastic surfaces, a mathematical model for predicting the surface roughness of molds was proposed, which is a function of workpiece characteristics (such as hardness and tool properties) and key process parameters (such as the working gap, applied pneumatic pressure, spindle speed, abrasive slurry concentration, abrasive mesh size, and dwell time). Savio et al. [22] established a relationship between the workpiece under friction and polishing parameters and proposed a model to evaluate the change in the surface roughness of abrasively polished glass molds as a function of the volume of material removed according to the Reye wear hypothesis. Feng et al. [23] deduced a pressure distribution model within the contact area between the polishing disc and the workpiece during both flat- and curved-surface polishing and established a removal depth distribution model along the vertical feed direction for each polishing process to minimize the fluctuation of the removal depth. Qi et al. [24] utilized elastic and plastic contact theory to establish a model for the maximum cutting depth of abrasive particles and developed a predictive model for surface roughness in belt polishing based on a backpropagation neural network. Wang et al. [25] considered the shape and distribution of abrasives as well as the effect of pressure on surface roughness. Based on abrasive cutting and probability theory, a surface roughness prediction model was established by calculating the indentation depth of abrasive particles on the workpiece surface. There has been extensive research on polishing roughness modeling, with most theories focusing on the removal of material surface profiles by abrasive particles to reduce surface roughness.
Nevertheless, traditional robot polishing predominantly employs pneumatic flexible polishing tools. Owing to the challenges in stably controlling the polishing force, these tools lead to a reduction in polishing accuracy. In contrast, the hydraulic flexible polishing tool offers an effective solution for high-precision robot polishing, which can markedly enhance both polishing efficiency and precision [26]. Additionally, previous experimental studies on polishing have largely overlooked the determination of the ideal surface roughness level to which each abrasive grade should polish the workpiece, thereby ensuring the attainment of the minimal possible surface roughness in the final product [27]. In essence, the polishing process necessitates a methodical and incremental decrease in the workpiece’s surface roughness, with specific and optimized polishing parameters for each abrasive grade.
In summary, this article focuses on research into the robot polishing of NAK80 mold steel using a self-developed adaptive hydraulic polishing (AHP) tool. Based on the fundamental principles of sandpaper polishing, this study calculated the cutting depth of abrasive grains under pressure, correlated this depth with surface roughness, derived a relationship between surface roughness and the parameters of polishing force, rotational speed, and feeding speed, and examined the variation patterns of roughness before and after over-polishing. Subsequently, AHP polishing experiments were conducted for each abrasive grain size, and regression models between the surface roughness and the above three polishing parameters were established using the response surface method. Ultimately, a series of process parameters, including polishing force, rotational speed, and feeding speed, were obtained to achieve the lowest surface roughness, and the prediction of surface roughness was realized.
2. Materials and Experimental
The experimental material was NAK80 mold steel with specimen dimensions of 300 × 100 × 30 mm3. The robotic polishing platform consisted mainly of a KR210 robot, a self-developed AHP tool, and a sandpaper tray. The key parameters of the AHP polishing tool included the following: an adjustable spindle speed from 2000 to 6000 RPM with a precision of 1 RPM, a spindle radial floating range of 0–20 mm with a precision of 0.01 mm, and an adjustable polishing force from 5 to 120 N with a precision of 1 N.
Before the experiment, the AHP polishing tool was mounted on the sixth axis of the KR210, with its feeding speed controlled by the KR210 robot and its rotational speed and polishing force regulated by the AHP. The sandpaper tray was installed on the output spindle of the AHP, with a piece of ceramic alumina round 3M sandpaper of 1-inch in diameter attached to its bottom for polishing. Three grit sizes of sandpaper, P180, P400, and P800, were used, and the surface roughness Ra of the sample was measured using a stylus-type surface roughness tester, JITAI810 (Jiahe Precision Instrument, Shenzhen, China). The tester has a measurement range for the roughness Ra from 0.005 to 16.000 μm, with an indication accuracy of 0.001 μm. The measuring stylus is diamond-tipped, characterized by a cone angle of 90° and a tip radius of 5 μm. During the measurement process, the speed is maintained at 1 mm·s−1. The sampling length is set to 2.5 mm, and the measurement length (also known as the evaluation length) is 10 mm, which is exactly four times the sampling length.
Polishing experiments were conducted sequentially from coarse to fine grits (namely, P180→P400→P800) with varying parameters of polishing force, rotational speed, and feeding speed. The polishing direction is illustrated in Figure 1. To determine the optimal polishing parameters and minimum achievable surface roughness for each grit, single-factor experiments were first conducted to determine rough parameter ranges. Then, orthogonal experiments were conducted within this range to obtain the optimal parameters.
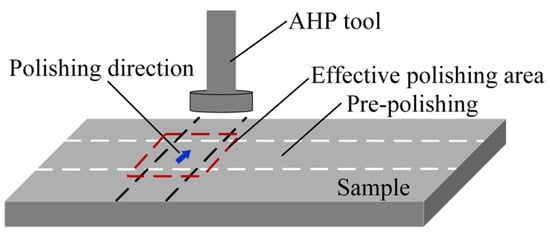
Figure 1.
Schematic of the polishing direction.
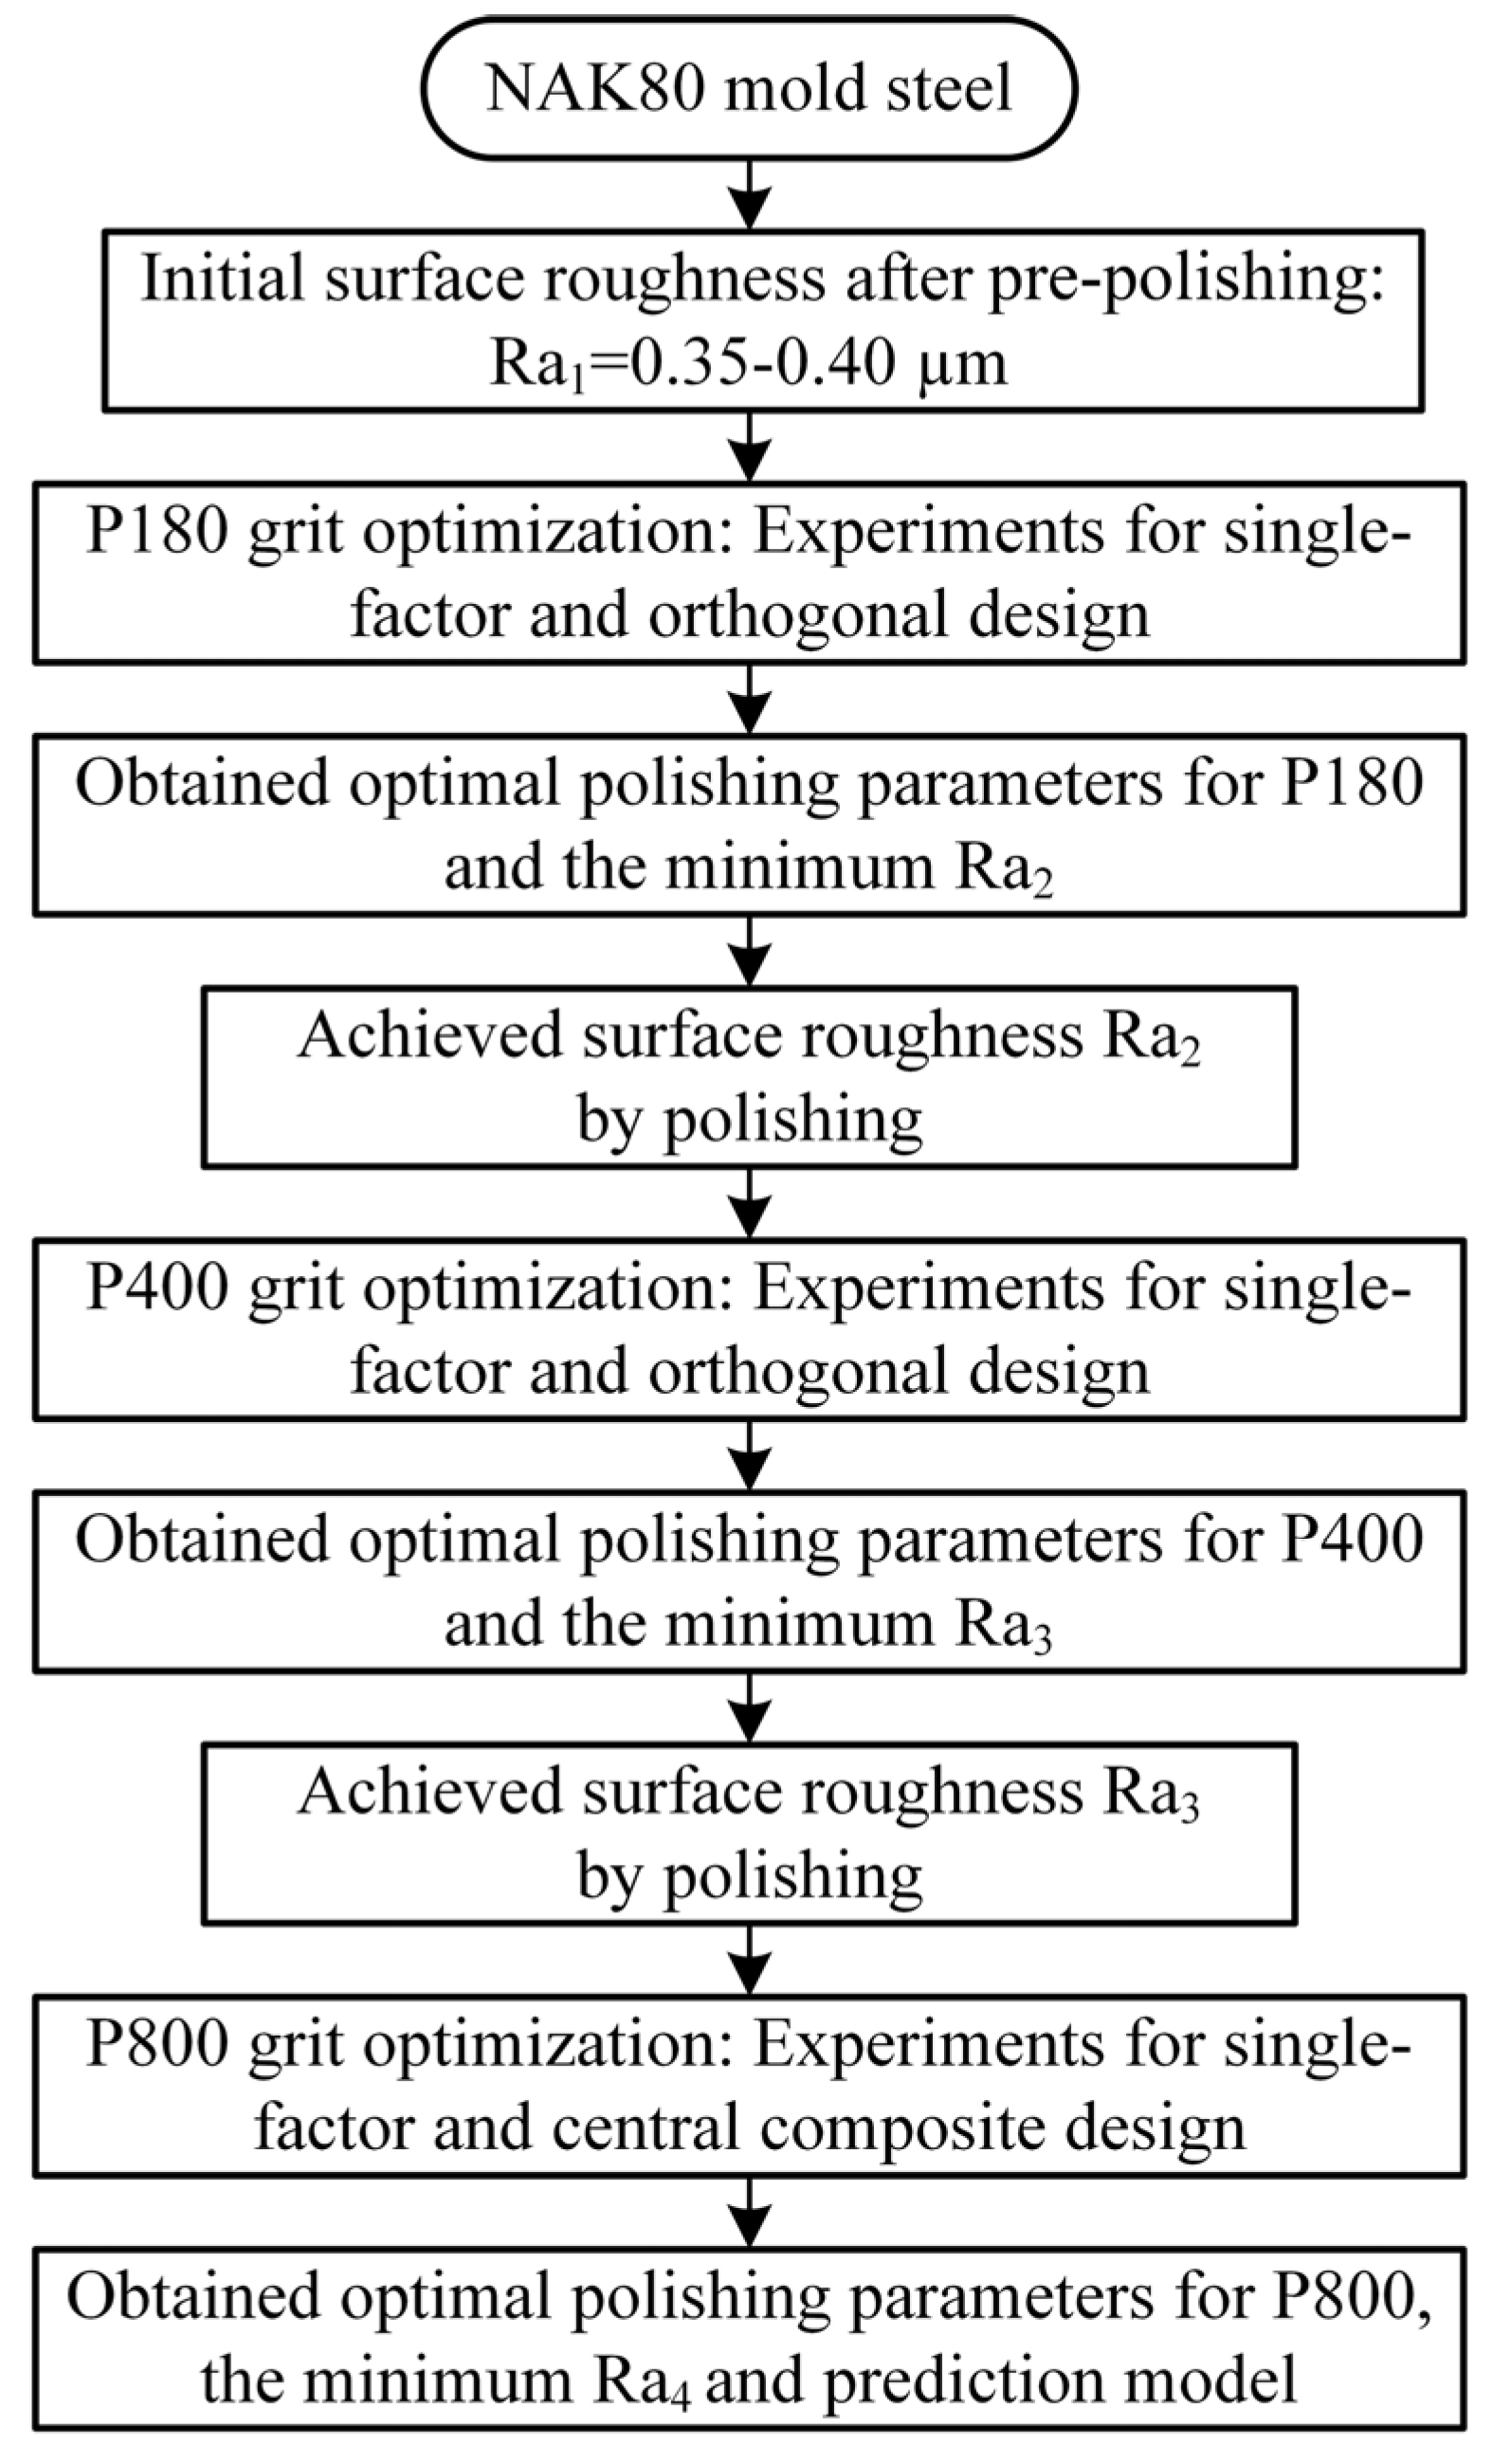
The samples were pre-polished to Ra1 = 0.35−0.40 μm as the initial roughness for the P180 grit tests. Subsequent experiments used the minimum roughness achieved by the preceding grits as the initial conditions; thus, the P400 experiments began at the minimum Ra2 from P180 and P800 at the minimum Ra3 from P400. Finally, the samples were polished with P800 to achieve a surface roughness of Ra4. The experimental polishing process is shown in Figure 2.
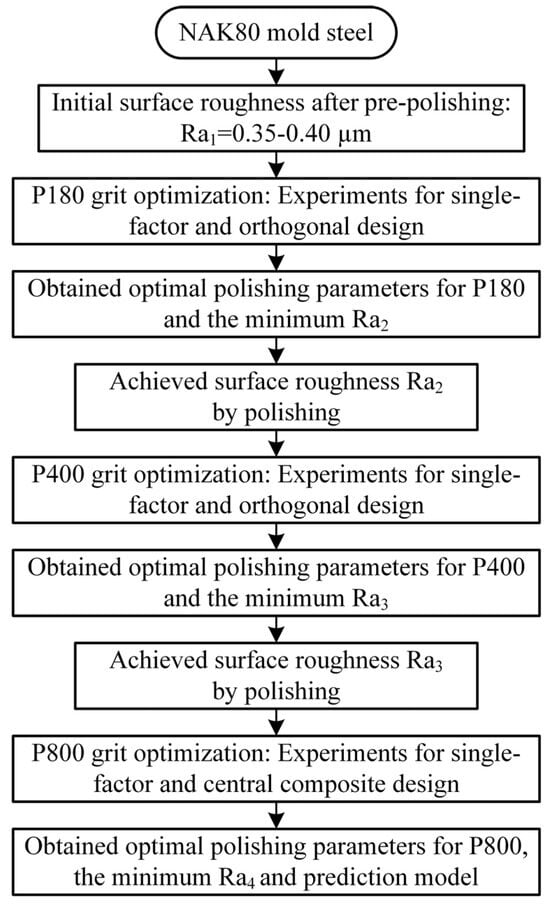
Figure 2.
Flowchart of the experimental polishing process.
The single-factor experiments were conducted iteratively without a predefined limit, ceasing when the roughness of the samples plateaued or began to increase. A new piece of sandpaper was used for each polishing iteration, the surface roughness of each experiment was measured five times, and the average value was determined as the effective Ra value. The single-factor experimental scheme is shown in Table 1.

Table 1.
Single-factor experimental scheme for the influence of polishing parameters on surface roughness.
Building on the single-factor results, the orthogonal experimental designs were implemented on the NAK80 samples with the P180 and P400 grits to obtain the optimal polishing parameters. The experimental scheme is shown in Table 2. A central composite design was adopted for the P800 grit, as shown in Table 3, including three replicates at central experimental points, to establish a mathematical relationship between the surface roughness and the polishing parameters and to obtain the optimal polishing parameters.
Table 2.
Factors and levels of orthogonal experimental design for the P180 and P400 grits.
Table 3.
Factors and levels of central composite design for the P800 grit.
3. Results and Analysis
3.1. Influence of the Polishing Process Parameters on Surface Roughness
The initial surface roughness of the polished samples with the P180, P400, and P800 sandpaper was maintained at 0.35–0.40 µm, 0.07–0.08 µm, and 0.040–0.045 µm, respectively. Figure 3, Figure 4 and Figure 5 demonstrate the influence of the polishing parameters on the minimum surface roughness and polishing iterations of the NAK80 samples.
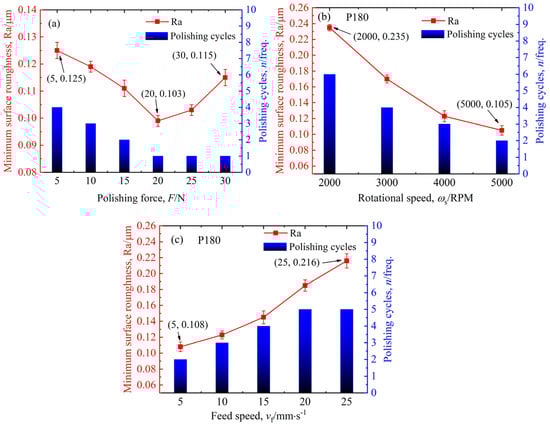
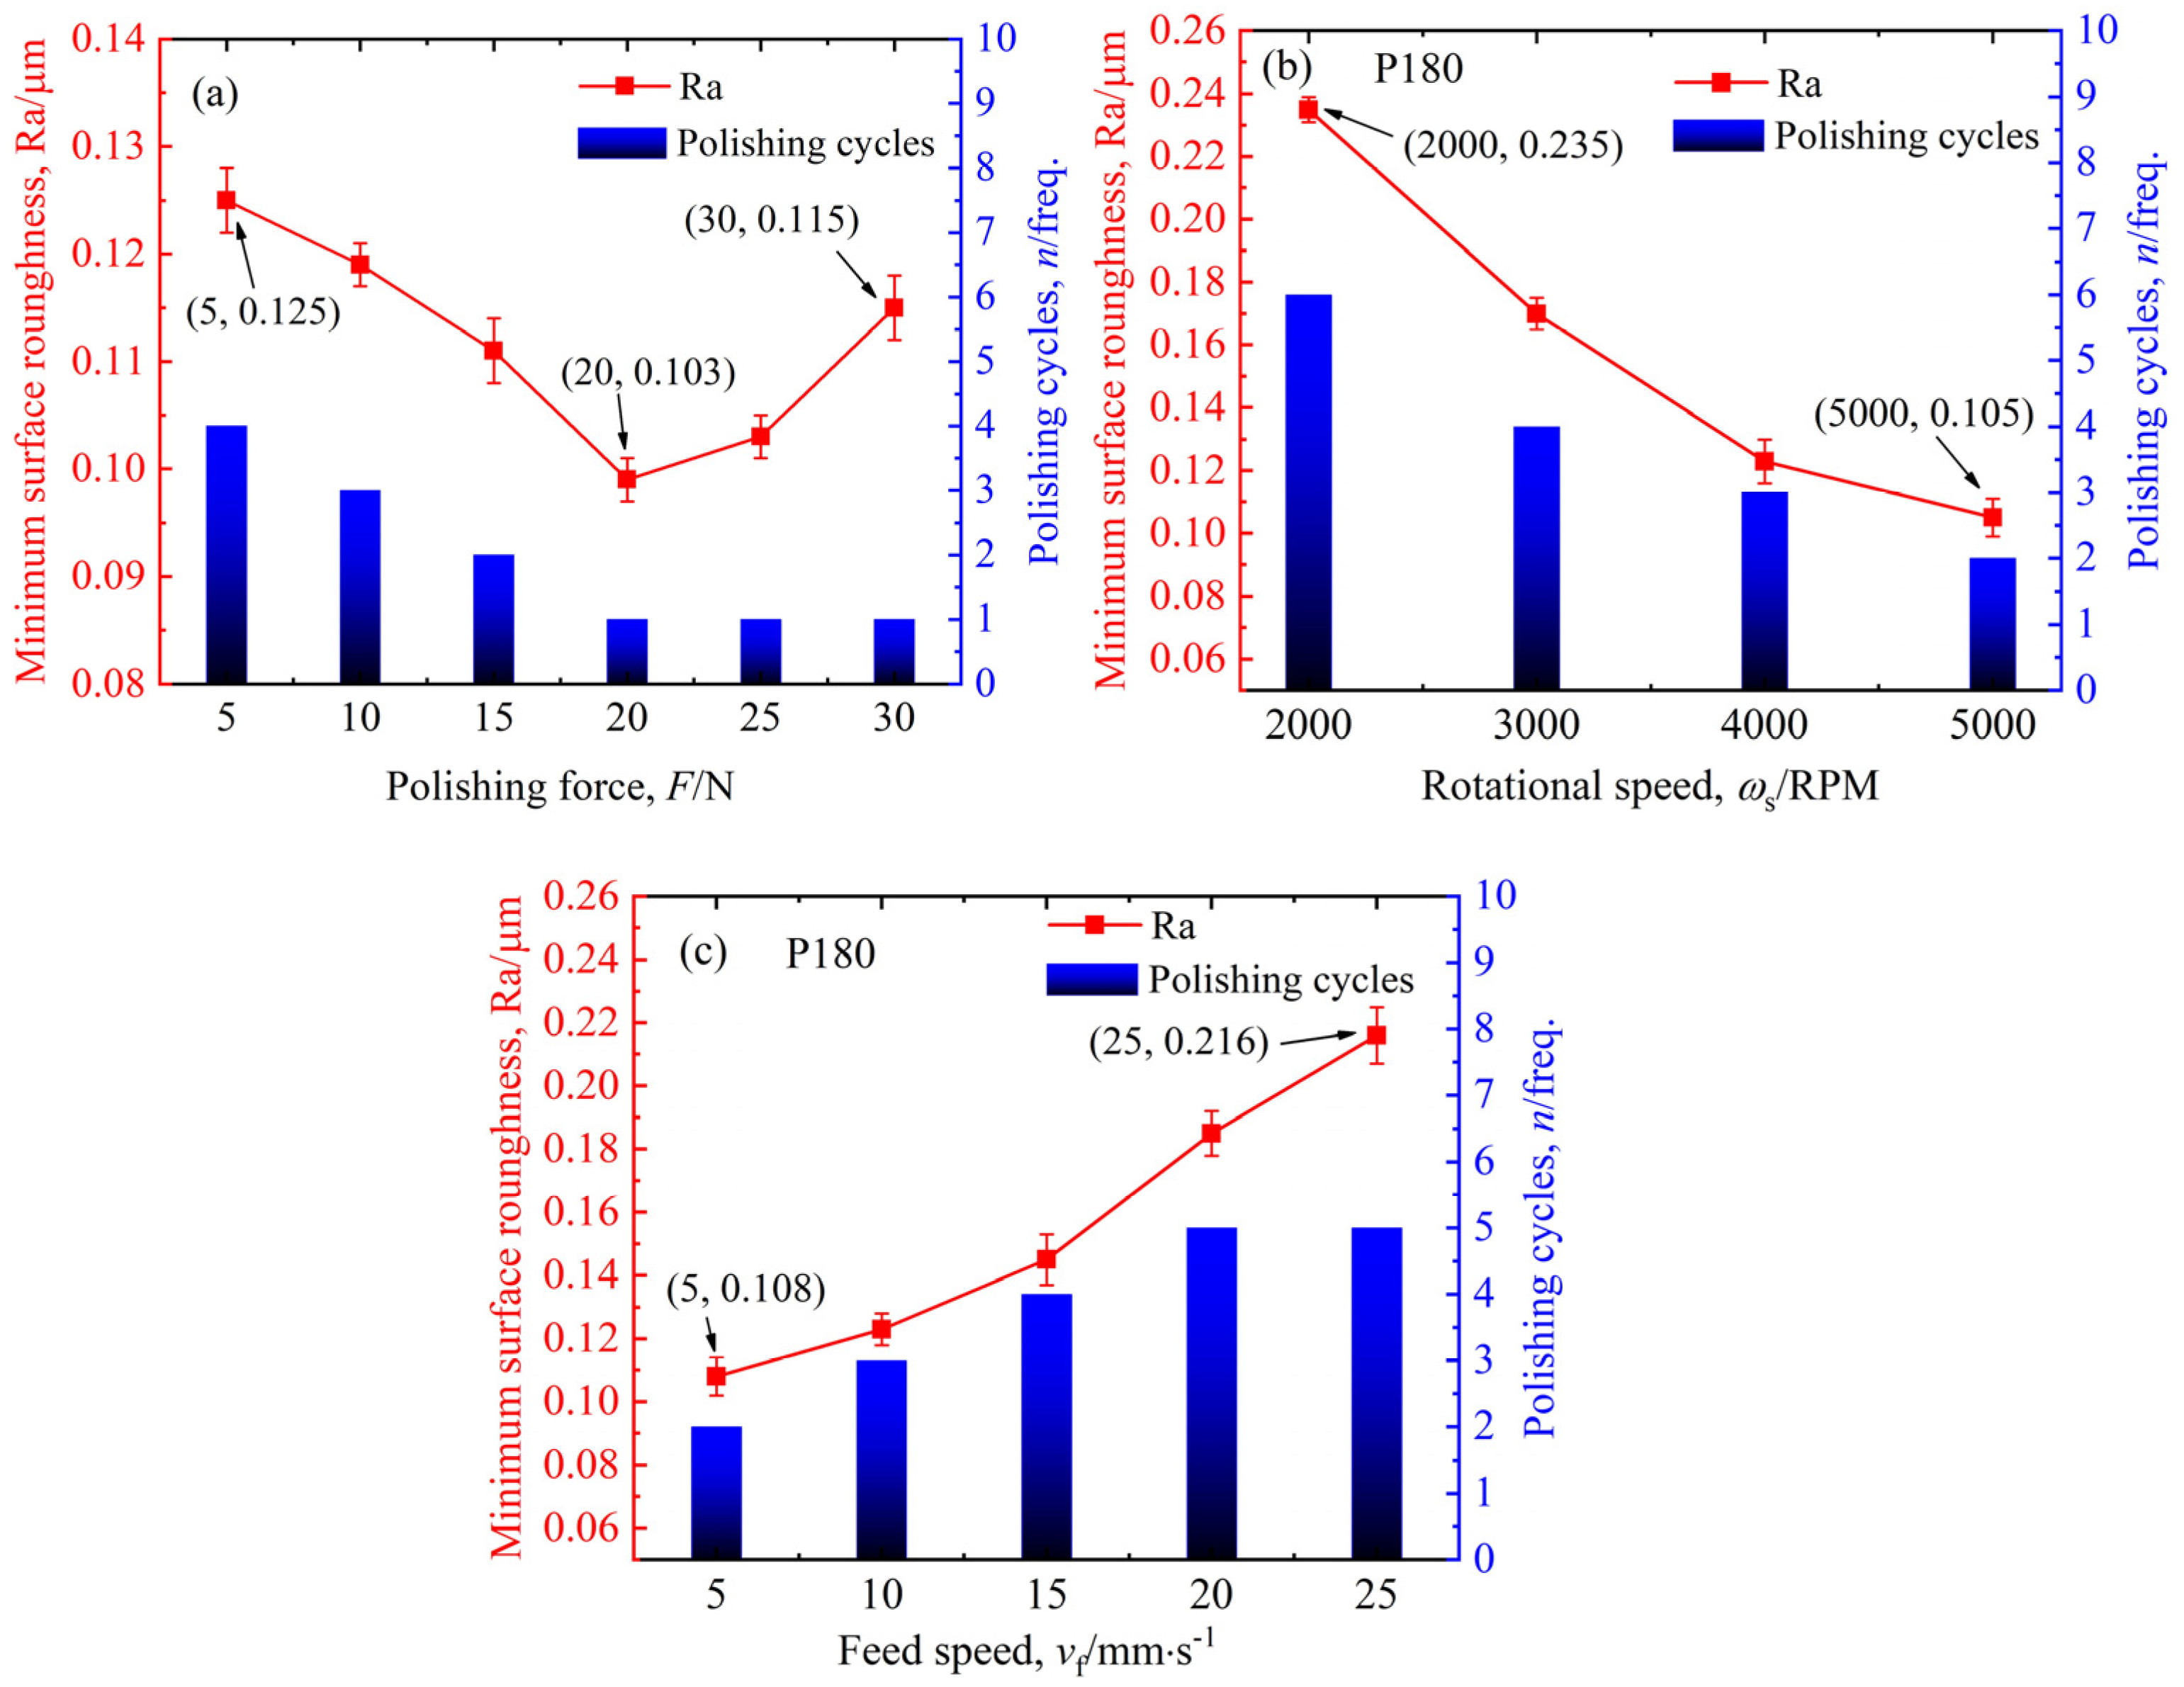
Figure 3.
Variations in minimum surface roughness and polishing cycles with the parameters of (a) polishing force, (b) polishing speed, and (c) feeding speed for P180.
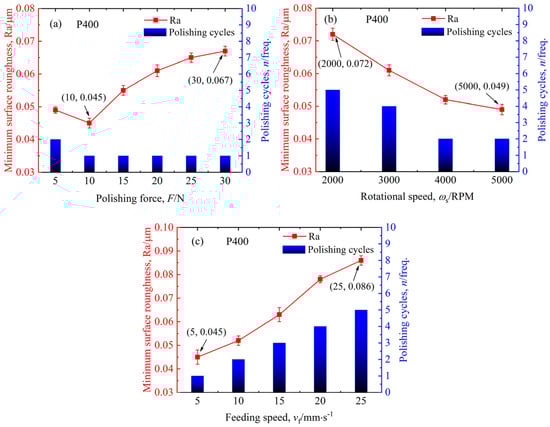
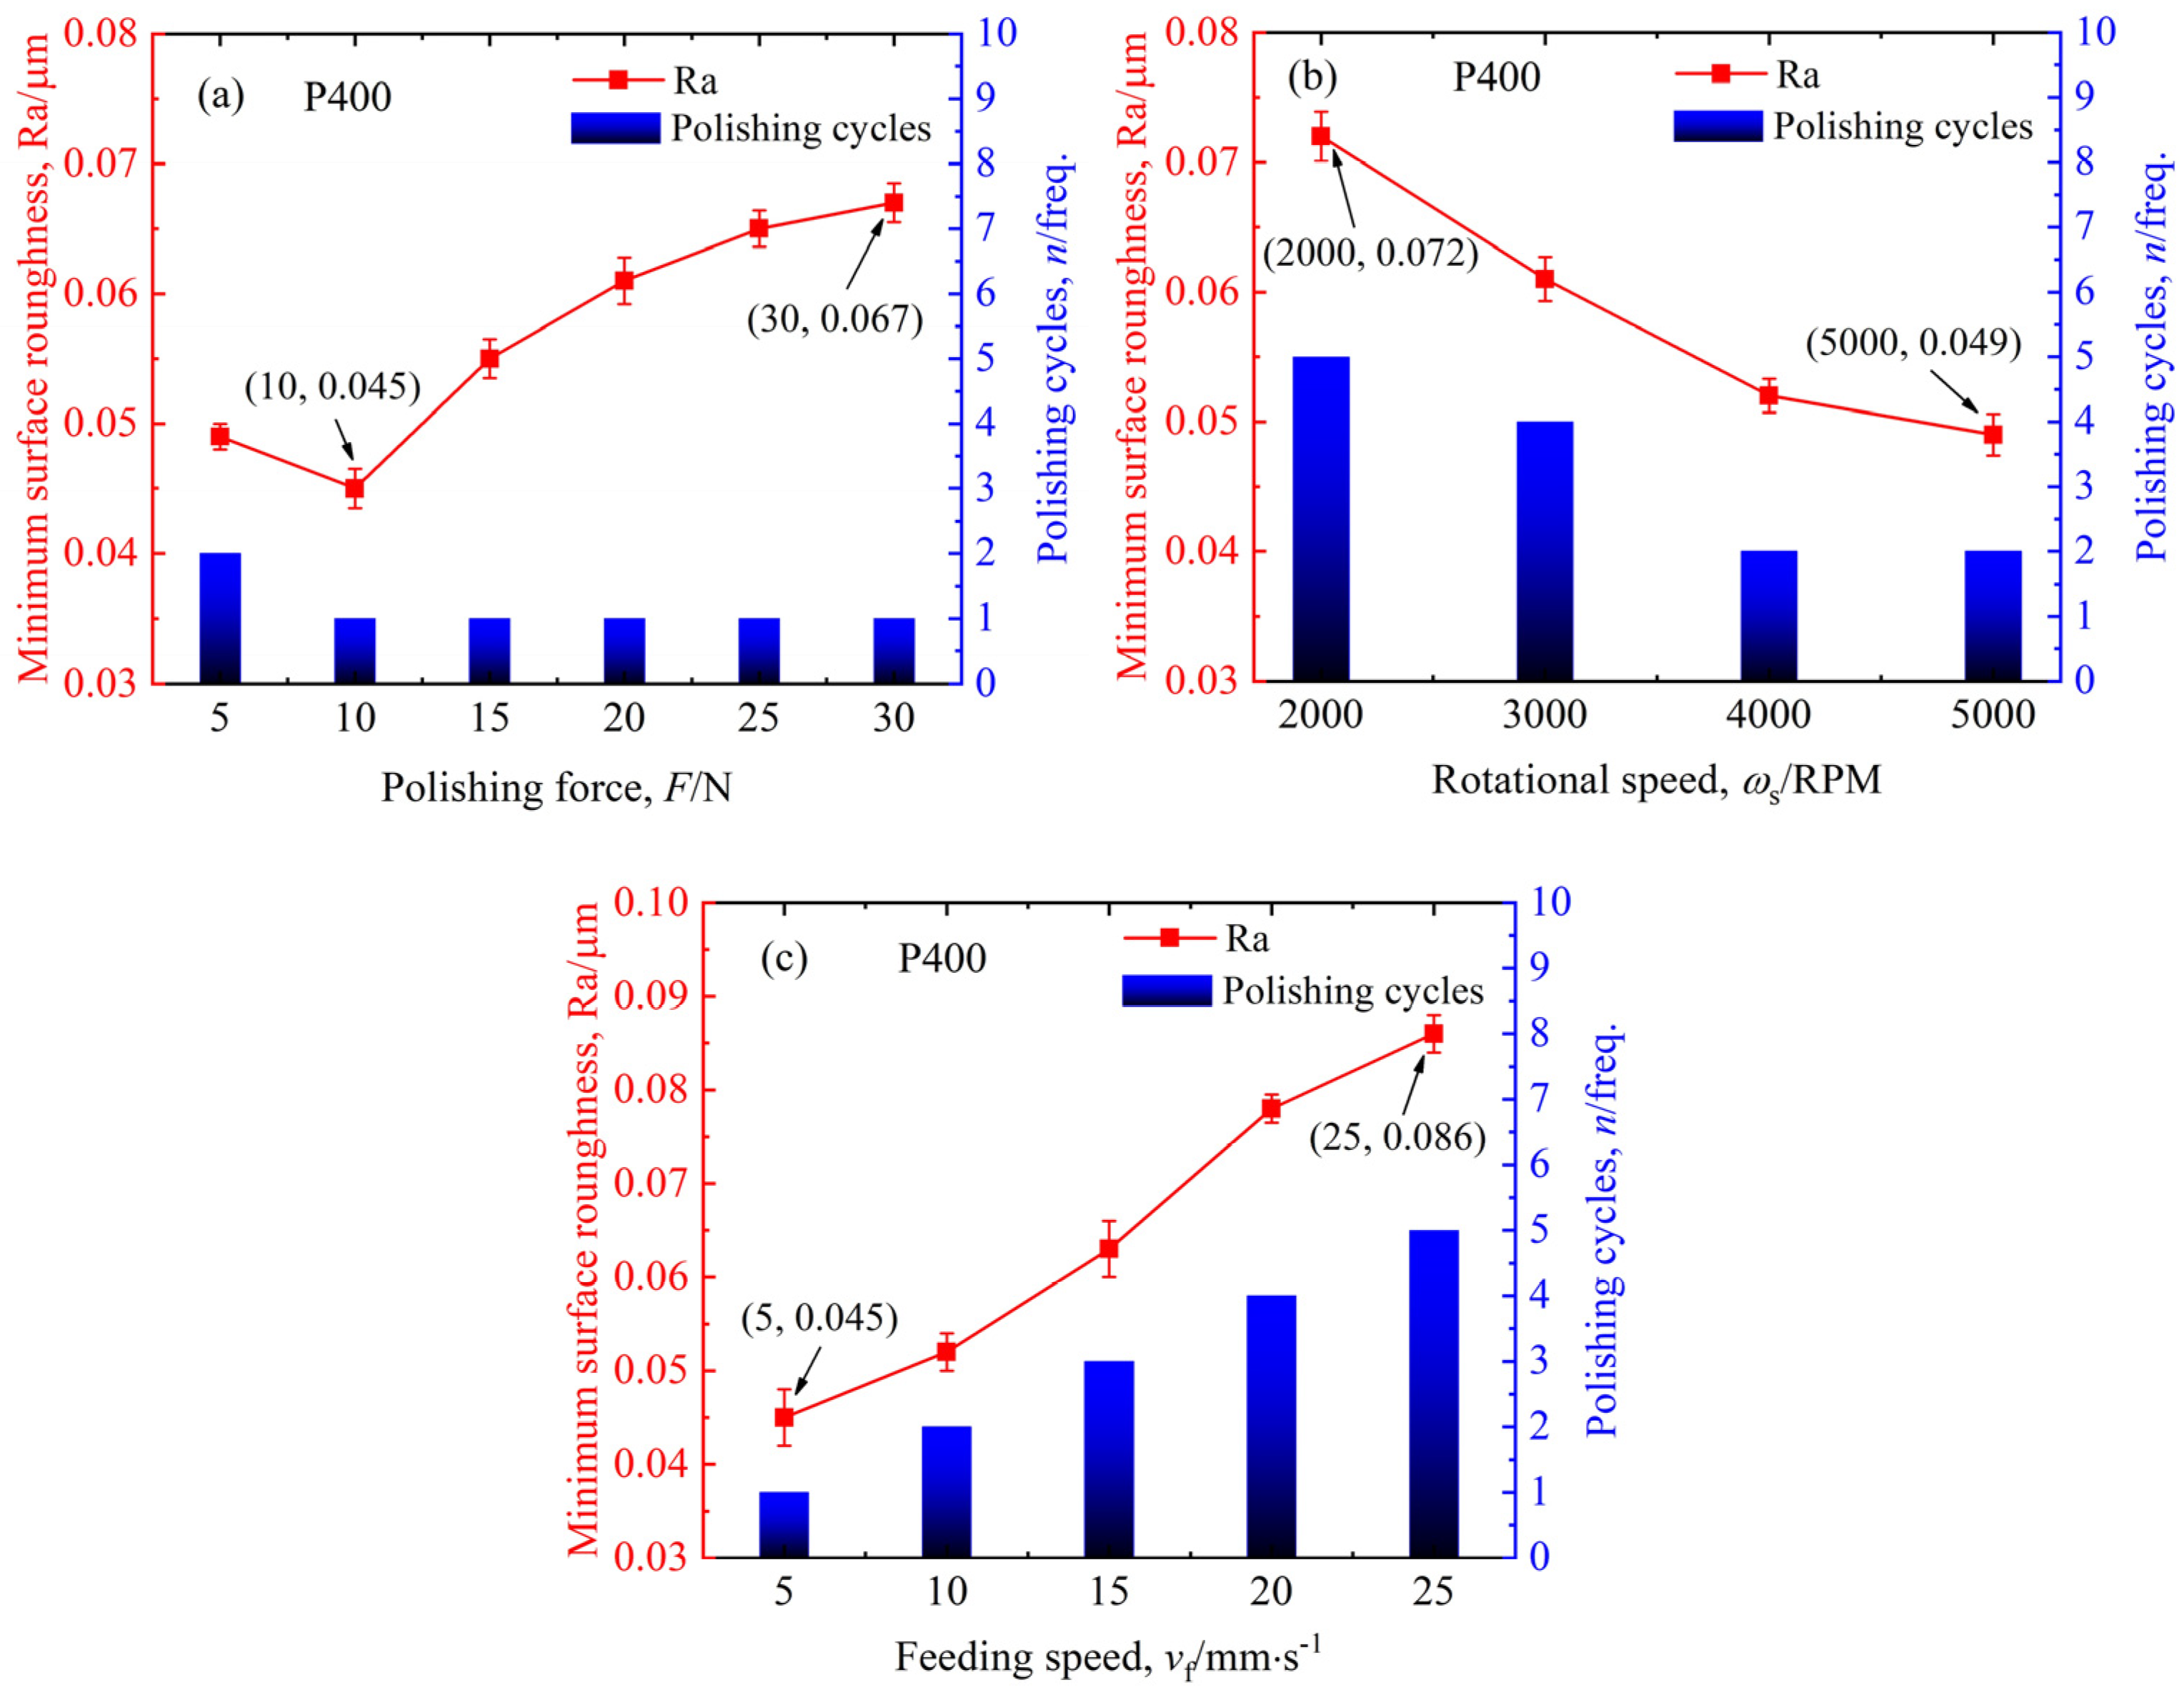
Figure 4.
Variations in minimum surface roughness and polishing cycles with the parameters of (a) polishing force, (b) polishing speed, and (c) feeding speed for P400.
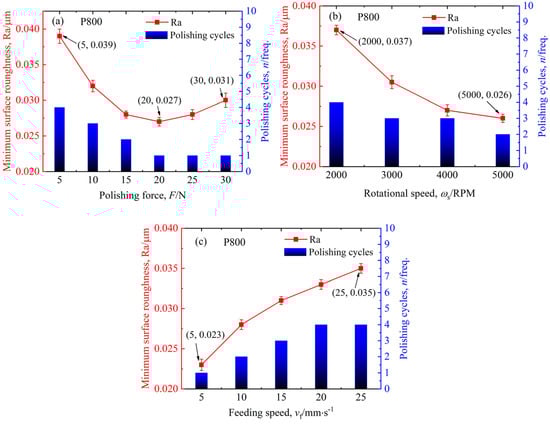
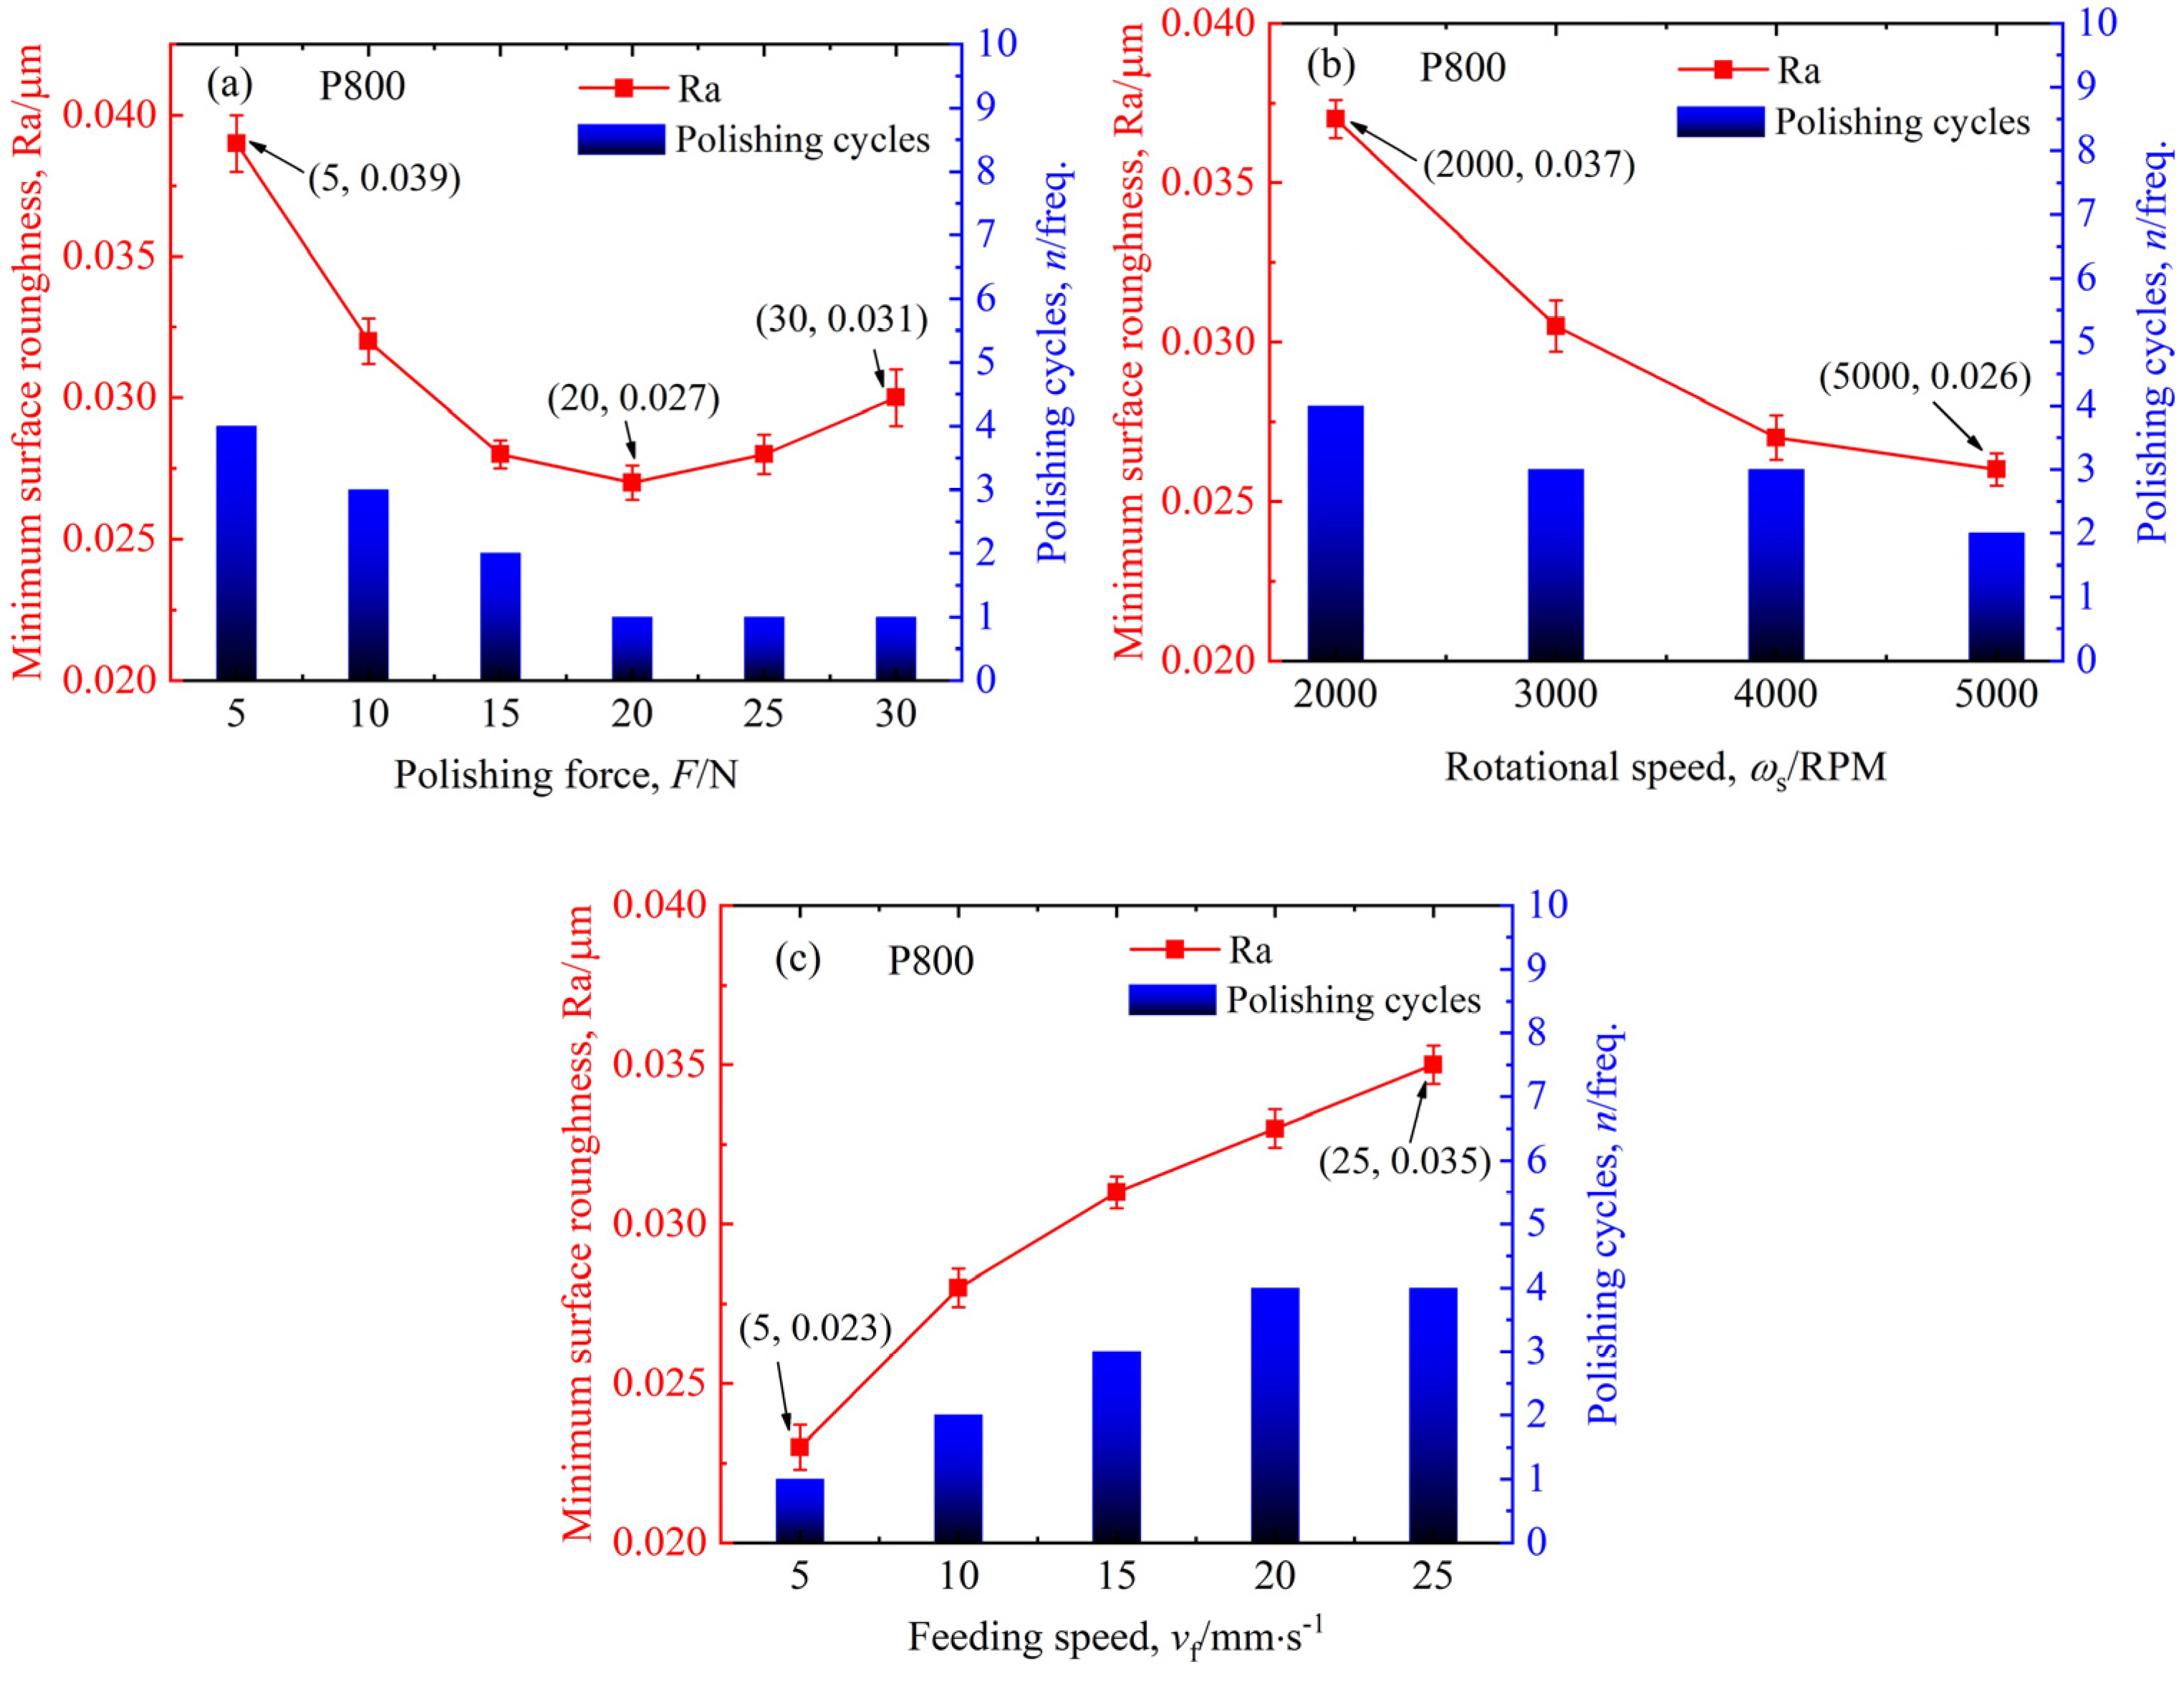
Figure 5.
Variations in the minimum surface roughness and polishing cycles with the parameters of (a) polishing force, (b) polishing speed, and (c) feeding speed for P800.
As shown in Figure 3, Figure 4 and Figure 5, the effects of polishing force, rotational speed, and feeding speed on the minimum surface roughness exhibit consistent trends across different grit sizes. With the increase in polishing force, the minimum surface roughness initially decreases and then increases. For the P180 sandpaper, when the polishing force is 20 N, the surface roughness of the sample decreases from 0.125 µm at 5 N to a minimum value of 0.103 µm, with a decrease of 82.4%. When the polishing force is increased to 30 N, the surface roughness of the sample actually increases to 0.115 µm. For the P400 sandpaper, when the polishing force is 10 N, the surface roughness reaches a minimum value of 0.045 µm. Afterward, as the polishing force increases, the surface roughness gradually increases. When the polishing force is 30 N, the surface roughness reaches a maximum value of 0.067 µm. For the P800 sandpaper, when the polishing force increases from 5 N to 20 N, the surface roughness of the sample decreases from the maximum value of 0.039 µm to the minimum value of 0.027 µm. As the polishing force continues to increase, the surface roughness increases, but the magnitude of the increase is not significant.
The surface roughness of the sample gradually decreases with the increase in AHP rotational speed. When the rotational speed of AHP increases from 2000 RPM to 5000 RPM, the surface roughness of samples polished with the P180, P400, and P800 sandpapers decreases from the maximum values of 0.235 µm, 0.072 µm, and 0.037 µm to the minimum values of 0.105 µm, 0.049 µm, and 0.026 µm, respectively, with a decrease of 44.7%, 68.1%, and 70.3%.
The surface roughness of the sample gradually increases with the increase in feeding speed. When the feeding speed is 5 mm·s−1, the surface roughness of the sample is the smallest. The P180, P400, and P800 sandpapers can achieve a minimum surface roughness of 0.108 µm, 0.045 µm, and 0.023 µm, respectively. When the feeding speed increases to 25 mm·s−1, the surface roughness of the sample reaches the maximum values, which are 0.216 µm, 0.086 µm, and 0.035 µm, respectively, increasing by 100%, 91.1%, and 52.2%.
When polishing the samples with different parameters, the number of polishing cycles to achieve the minimum surface roughness varies significantly, ranging from 1 to 6. For instance, Figure 3a reveals that the P180 sandpaper can attain its minimum roughness of 0.103 µm in one polishing cycle at 20 N while requiring four cycles at 5 N to reach a minimum roughness of 0.125 µm. As illustrated in Figure 3b, five polishing cycles are necessary for the rotational speed of 2000 RPM to reach a minimum surface roughness of 0.235 µm, whereas at a rotational speed of 5000 RPM, a minimum surface roughness of 0.105 µm is obtained after polishing twice. Figure 3c indicates that the feeding speed of 5 mm·s−1 enables a minimum roughness of 0.108 µm in two cycles, whereas a feeding speed of 25 mm·s−1 demands five cycles to achieve a minimum surface roughness of 0.216 µm; analysis of Figure 4 and Figure 5 yields the same conclusion. Therefore, to obtain the minimum surface roughness, the number of polishing cycles varies for different parameters. These findings indicate that parameter selection critically determines polishing efficiency, with the optimal parameters enabling the single-polishing achievement of the minimum surface roughness. Further analysis of Figure 3, Figure 4 and Figure 5 shows that when the P180, P400, and P800 sandpapers are used to polish the sample, the smallest number of polishing times achieves the minimum surface roughness for any of the polishing parameters of polishing force, rotational speed, and feeding speed.
To further elucidate the parametric dependence of surface roughness, a mathematical relationship for the polishing process was derived, which relates the surface roughness Ra of the sample to the polishing force, rotational speed, and feeding speed of the AHP tool and clearly explains the variation in surface roughness with polishing parameters.
The polishing process using sandpaper is actually the result of collective cutting by a large number of individual abrasive grains [28]. For analytical simplification, it is assumed that the sandpaper surface is a single layer of abrasives with uniform distribution, and each abrasive grain is perpendicular to the substrate, pointing outward at its tip, and has only one effective cutting edge. Thus, the number of effective cutting edges is equal to the number of abrasive grains on the surface.
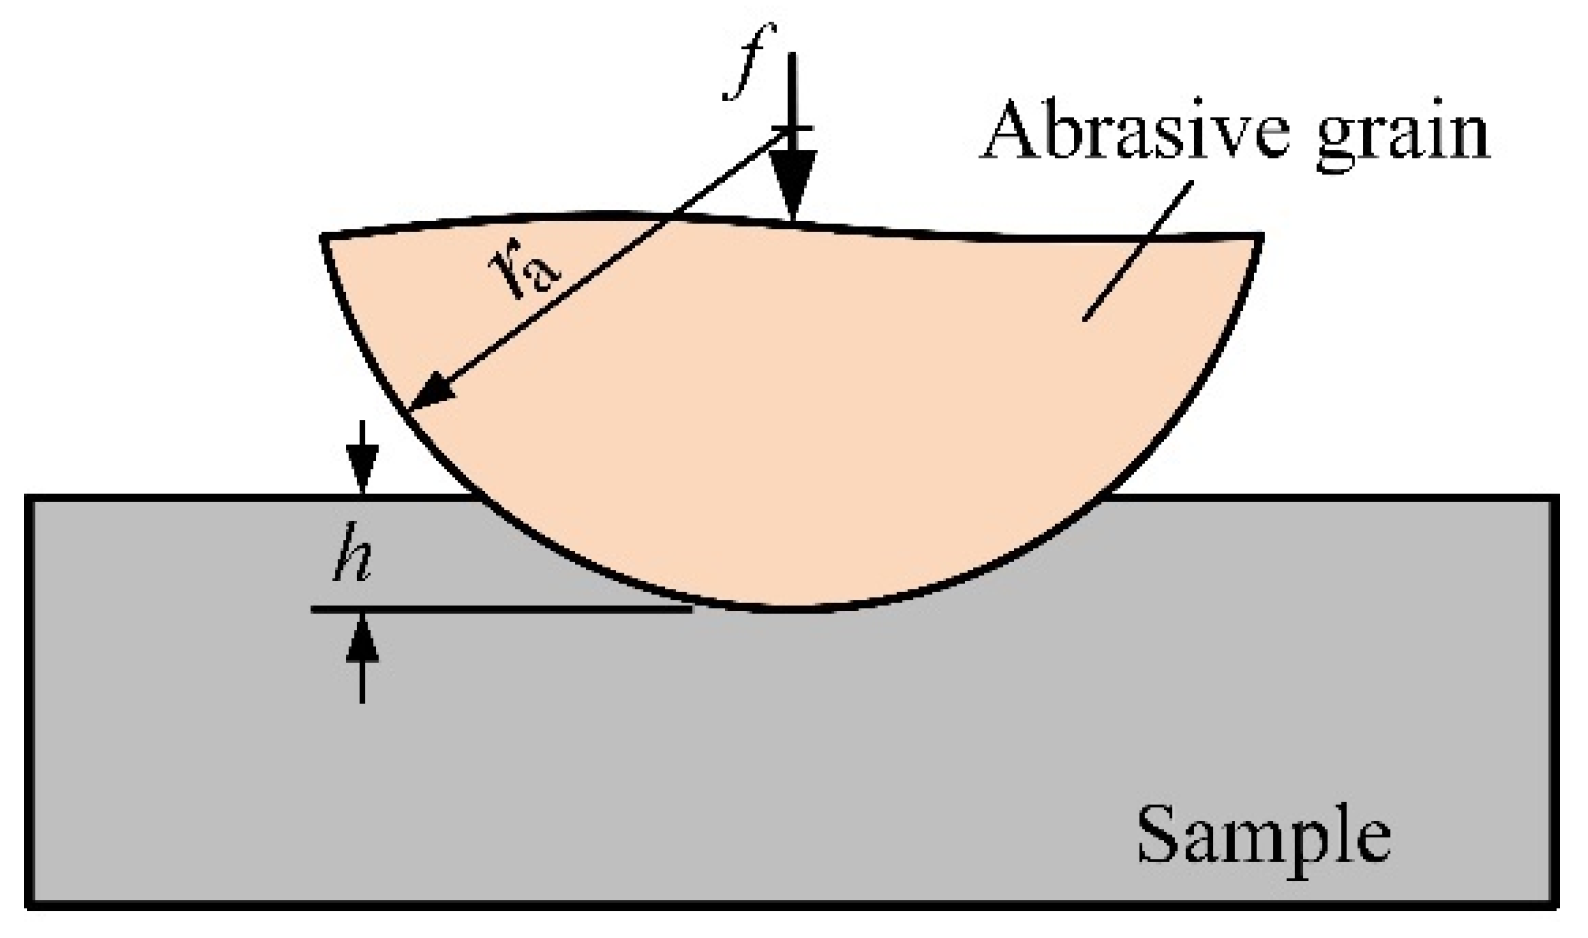
According to the research results of Baidakova et al. [29], spherical grain geometry provides a more realistic representation of abrasive grains. Figure 6 schematically illustrates the indentation mechanism of a simplified spherical abrasive grain into the sample surface during polishing.
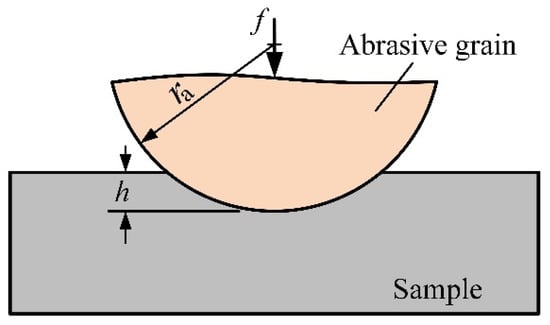
Figure 6.
Contact model between a simplified spherical abrasive grain and a sample.
The indentation mechanism of a single spherical abrasive grain into the sample resembles Brinell hardness testing. Given the significant difference in Brinell hardness between the alumina abrasive and NAK80 mold steel, the Brinell test model was adopted to determine the indentation depth of a single abrasive grain. The Brinell hardness HB of the sample can be calculated as the ratio of force f acting on the spherical grain to the projected area A of the spherical cap indentation:
where ra denotes the radius of the spherical grain, and h represents the indentation depth.
When external force F is applied to the abrasive tool, the force per grain f can be expressed as follows:
where N indicates the total number of grains within the circular contact area of radius R, and N0 represents the grain density per unit area, calculated by the following [30]:
where Vg denotes the volume fraction of abrasive grains, which is related to the structural number S of the abrasive tool [31].
Combining Equations (1)–(3), the indentation depth h can be derived as follows:
where dm represents the mean grain diameter, dm = 2ra.
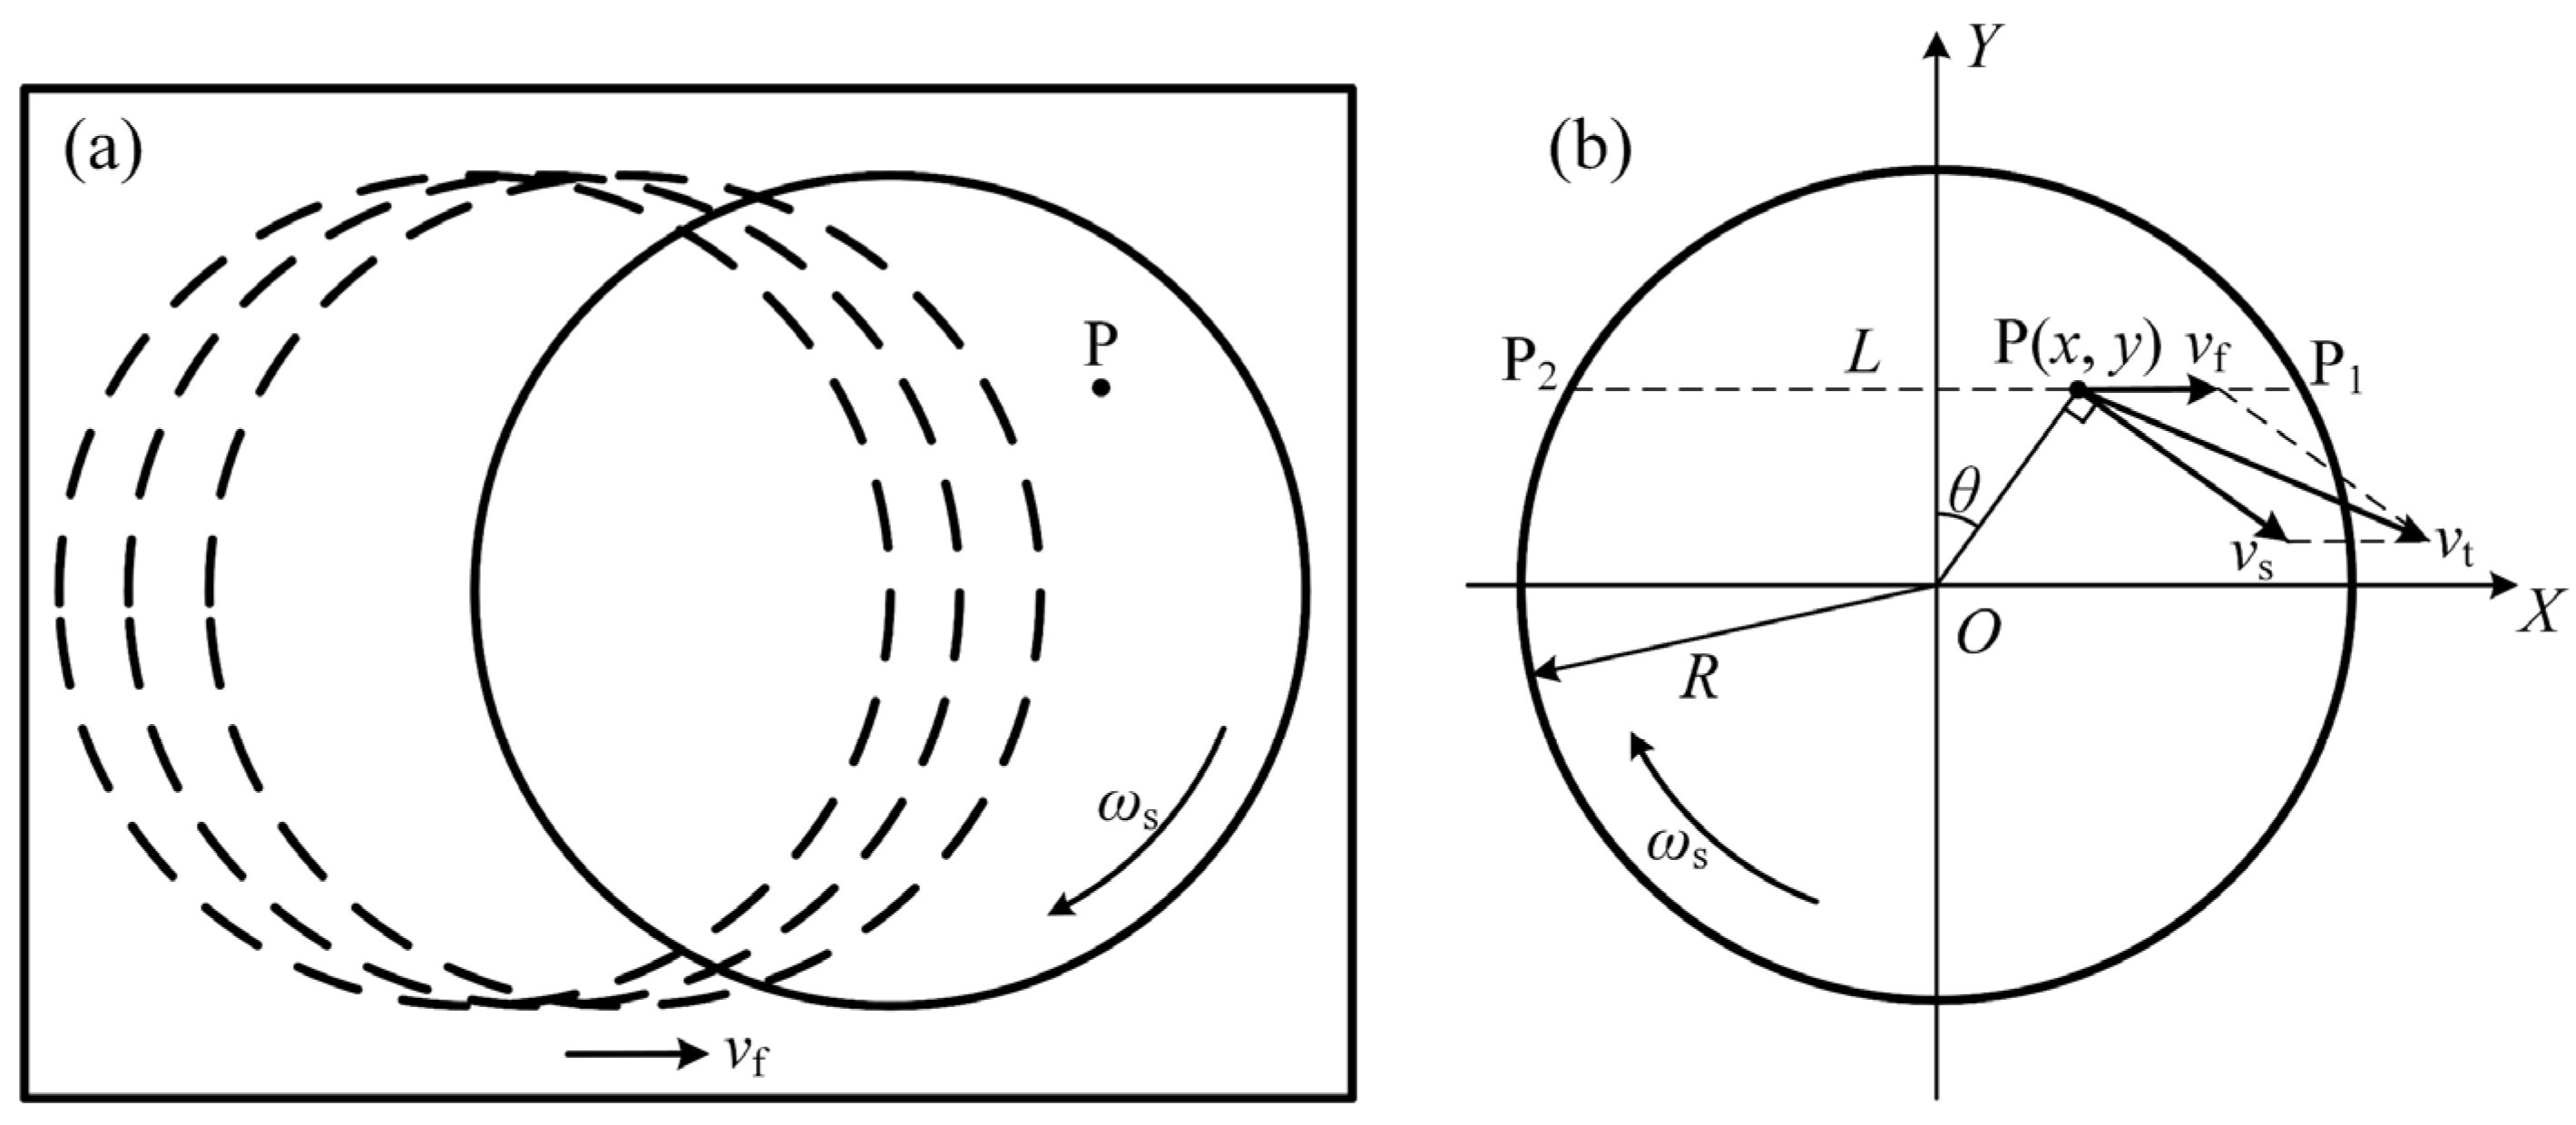
The relative linear velocity during polishing is governed by the rotational speed and feeding speed of the spindle. As shown in Figure 7, during linear feed polishing along the X-direction, the instantaneous relative velocity vt at any point P(x, y) within the circular polishing zone with the radius of R can be expressed as follows:
where vf is the robotic feeding speed, and vs denotes the tangential velocity at point P, given by the following:
where represents the rotational speed of the sandpaper.
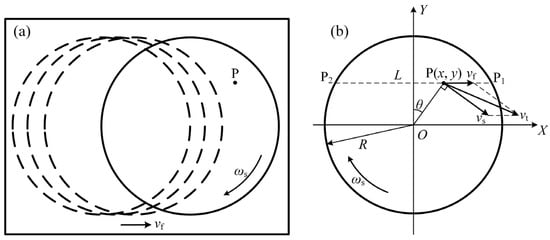
Figure 7.
Polishing diagram: (a) polishing trajectory diagram; (b) schematic of the circular contact area.
Substituting Equation (6) into Equation (5) yields the following:
According to Figure 7, x can be represented by the product of feeding speed and time t. Substituting this into Equation (7) gives the following:
Considering , Equation (8) simplifies to the following:
As shown in Figure 7, the length L of the polishing path between entry point P1 and exit point P2 can be calculated as follows:
Thus, the polishing duration tp at point P becomes the following:
The actual polishing length s at point P is obtained by integrating the relative velocity vt over tp, and it is expressed as follows:
The cumulative indentation depth H(y), equivalent to the surface roughness, results from integrating single-grain indentation h over the polishing length s:
Substituting Equations (4) and (12) into Equation (13) yields the following:
Surface roughness fundamentally arises from the irregular topography generated by abrasive material removal [32]. In this study, there is a uniform initial surface roughness of . As shown in Figure 8a, it is assumed that the initial surface of the sample exhibits a semicircular contour with a height of 2H0, where H0 = . When the sample is polished, the surface peaks progressively reduce under the cutting action of the abrasive grains, leading to a gradual decrease in surface roughness, as depicted in Figure 8b. Once the surface peaks are completely removed, subsequent polishing creates new surface irregularities, as illustrated in Figure 8c. Therefore, as the cutting depth increases, the surface roughness of the sample initially decreases and then increases.
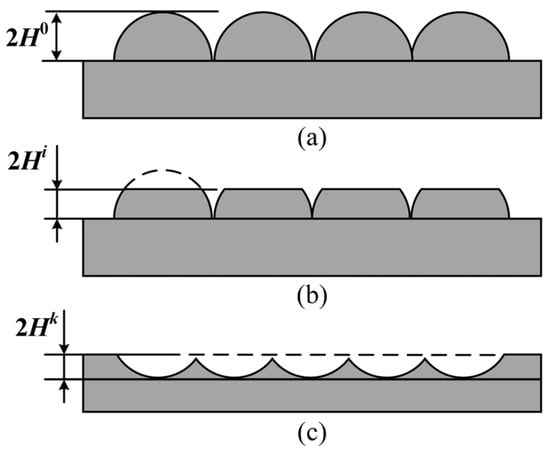
Figure 8.
Sample surface profile: (a) with uniform semicircular peaks; (b) with the contour after polishing i times; (c) with the new surface contour.
After n polishing cycles, the surface profile height becomes the following [33]:
where 2Hi and 2Hk represent the height of the surface profile of the sample after polishing, and they are equal to the surface roughness Ra of the sample.
Substituting Equation (14) into Equation (15) gives the evolution model of the surface roughness as follows:
where F represents the polishing force, represents the rotational speed, and vf denotes the feeding speed.
The model (16a) represents the process where the surface roughness gradually decreases before the peaks on the sample surface are completely removed, and the model (16b) expresses the process where the surface roughness gradually increases after the surface peaks are completely removed, also called over-polishing. Summarily, the model reveals that surface roughness decreases with increasing polishing force and rotational speed but increases with feeding speed before over-polishing. The inverse relationship holds after over-polishing. Notably, over-polishing initiates when the single-grain indentation depth exceeds the initial surface profile height.
In practical polishing, achieving the minimum surface roughness under given parameters typically requires multiple polishing cycles. When the sample undergoes repeated polishing, the surface roughness initially decreases, followed by stabilization or a subsequent increase, indicating the onset of over-polishing.
For Figure 3a, Figure 4a and Figure 5a, the surface roughness progressively decreases with the increasing polishing force until reaching a minimum value. This is consistent with Equation (16a), confirming the absence of over-polishing. After reaching a minimum value, the surface roughness becomes proportional to the polishing force, with minimum roughness achieved in a single polishing cycle. This aligns with Equation (16b), demonstrating irreversible over-polishing where further polishing cannot reduce roughness below this limit.
Figure 3b, Figure 4b and Figure 5b indicate that the surface roughness of the samples continuously decreases with the increase in rotational speed, and the number of polishing cycles is greater than 1, which remains consistent with Equation (16a), confirming no over-polishing occurrence. Similarly, Figure 3c, Figure 4c and Figure 5c demonstrate gradual roughness elevation with higher feeding speeds, also adhering to Equation (16a) without over-polishing.
3.2. Orthogonal Test Results and the Surface Roughness Prediction Model
The initial surface roughness of the samples for the P180, P400, and P800 sandpapers was controlled within 0.35–0.40 µm, 0.07–0.08 µm, and 0.040–0.045 µm, respectively. The orthogonal experimental results for the P180 and P400 sandpapers are summarized in Table 4.
Table 4.
Orthogonal test results and range analysis for the P180 and P400 sandpapers.
Range analysis was conducted to identify the influence of the process parameters, the optimal combinations, and the corresponding minimum roughness values. For the P180 sandpaper, the optimal parameter combination yielding the minimum Ra of 0.08 µm was determined as a 20 N polishing force, a 5000 RPM rotational speed, and a 5 mm·s−1 feeding speed, with factor significance ranked as C₁₈₀ (feeding speed) > B₁₈₀ (rotational speed) > A₁₈₀ (polishing force). For the P400 sandpaper, the optimal parameters achieving Ra = 0.044 µm were a 10 N polishing force, a 4000 RPM rotational speed, and a 5 mm·s −1 feeding speed, with a significance order of C₄₀₀ > A₄₀₀ > B₄₀₀.
Analysis of variance (ANOVA) is primarily used to assess the fitting accuracy of a model. Larger F-values and smaller p-values indicate superior model significance. The ANOVA results for the orthogonal experiments using the P180 and P400 sandpapers are presented in Table 5 and Table 6, respectively.
Table 5.
ANOVA results of surface roughness for P180.
Table 6.
ANOVA results of surface roughness for P400.
As shown in Table 5 and Table 6, at a significance level of α = 0.05, the models for P180 and P400 exhibit F-values of 84.129 and 106.167, respectively, which are greater than the critical value F0.05 = 4.459. Moreover, the p-values are 0.012 and 0.009, respectively, both of which are less than 0.05, confirming that the models have high significance. Furthermore, all three factors in both orthogonal experiments have F-values greater than F0.05, indicating that all of them are also significant.
The results of the central composite design (CCD) for the P800 sandpaper are presented in Table 7, where the number of central experiments is three.
Table 7.
Results of the central composite design for the P800 sandpaper.
Given the coupled effects of the polishing parameters on surface roughness, a quadratic regression was used to derive a prediction model for surface roughness. To improve the reliability of the prediction model, it is necessary to eliminate nonsignificant factors in the model via stepwise selection, thus obtaining a refined prediction model. The ANOVA results for the P800 sandpaper is shown in Table 8.
Table 8.
ANOVA results of the regression model for P800.
At a significance level of α = 0.05, the regression model yields a statistical F-value of 23.21, which exceeds the critical value F0.05 = 4.459, indicating the model is highly significant. The lack-of-fit test produces an F-value of 2.33, confirming that the lack-of-fit of the model is not significant. Combined, these statistical evaluations demonstrate that the regression model not only aligns well with the experimental data at the tested points but also maintains good predictive capability across the entire experimental range. The coefficient of determination (R2 = 0.976) signifies that 97.6% of the experimental variability is explained by the model, leaving only 2.07% unexplained. The predicted R2 = 0.951 indicates that the model can account for 95.1% of variability when applied to new observations. Furthermore, the ratio of adequacy to precision is 16.203, which is much bigger than the threshold of 4. Therefore, these collectively validate the model’s reliability for predicting surface roughness within the defined parameter space.
If the p-value of partial regression coefficients in the model exceeds 0.05, it is deemed statistically nonsignificant to the predictive model. As shown in Table 8, the partial regression coefficients for polishing force A800, rotational speed B800, feeding speed C800, and the interaction term A800C800 and demonstrate that the p-values are below 0.05, indicating significant effects on the response variable. These terms were retained. Conversely, the interaction terms A800B800, B800C800, , and demonstrate that the p-values are above 0.05, showing that they are not significant and should be excluded. The finalized predictive model after eliminating nonsignificant factors is expressed as follows:
Based on the experimental results in Table 8 and the roughness prediction model, response surfaces for the polishing parameters were generated, as illustrated in Figure 9. Figure 9a demonstrates that surface roughness decreases with increasing feeding speed and rotational speed, though the rate of reduction diminishes progressively. These trends align with the single-factor experimental results. The minimum surface roughness of 0.017 µm is achieved at a 5000 RPM rotational speed and a 5 mm·s−1 feeding speed. Figure 9b reveals that the roughness decreases with a higher rotational speed and polishing force, reaching its minimum value of 0.017 µm at a 20 N polishing force and a 5000 RPM rotational speed. Consequently, the optimal polishing parameters for the P800 sandpaper are identified as a 20 N polishing force, a 5000 RPM rotational speed, and a 5 mm·s−1 feeding speed, yielding the minimum surface roughness of 0.017 µm.
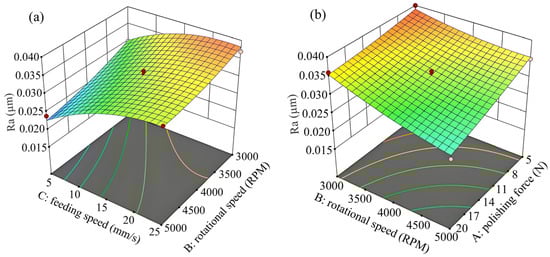
Figure 9.
The response surfaces between surface roughness and the polishing parameters of (a) rotational speed and feeding speed, (b) polishing force and rotational speed.
To validate the accuracy of the surface roughness prediction model, five randomly selected polishing parameters were tested, and the results are shown in Table 9. The relative errors range from 3.70% to 7.14%, all within acceptable limits, demonstrating the reliability of the surface roughness prediction model.
Table 9.
Results of the polishing experiments for model verification.
4. Conclusions
In this study, the integration of an AHP polishing tool and a robot system was used to analyze the effects of polishing force, rotational speed, and feeding speed on the surface roughness of NAK80 steel, and a relationship model between surface roughness and the polishing parameters was derived. Before over-polishing, surface roughness exhibits direct proportionality to the polishing force and rotational speed but inverse proportionality to the feeding speed. These relationships were reversed after over-polishing. For the P180 sandpaper, the optimal polishing parameters are a 20 N polishing force, a 5000 RPM rotational speed, and a 5 mm·s−1 feeding speed, achieving a minimum surface roughness of 0.08 µm. For the P400 sandpaper, the optimal parameters of a 10 N polishing force, a 4000 RPM rotational speed, and a 5 mm·s−1 feeding speed yielded a minimum surface roughness of 0.044 µm. The optimal parameters for the P800 sandpaper are a 20 N polishing force, a 5000 RPM rotational speed, and a 5 mm·s−1 feeding speed. By sequentially applying the optimal parameters to all three grit sizes, the surface roughness of the sample can be reduced from 0.4 µm to 0.017 µm, representing a 95.75% improvement. In addition, the error of the surface roughness prediction model established according to the central composite method for the P800 sandpaper is less than 7.14%.
The above research provides a new polishing framework for the AHP high-precision polishing of mold steel, which helps to meet the high-precision polishing requirements of molds. However, this study only focuses on the optimal polishing parameters obtained for NAK80 using P180, P400, and P800 sandpaper. After replacing the polishing material and sandpaper, parameter optimization still needs to be carried out based on the obtained results.
Author Contributions
Conceptualization, X.Z.; methodology, D.S. and H.Z.; validation, X.Z. and H.Z.; formal analysis, X.Z. and X.W.; investigation, D.S. and X.W.; data curation, X.W.; writing—original draft, X.Z.; writing—review and editing, D.S.; supervision, D.S. and H.Z. All authors have read and agreed to the published version of the manuscript.
Funding
This study was partially supported by the Key Technology Research and Development Program of Heilongjiang Province (GA21A103).
Data Availability Statement
The original contributions presented in the study are included in the article; further inquiries can be directed to the corresponding author.
Conflicts of Interest
The authors declare that they have no known competing financial interests or personal relationships that could appear to influence the work reported in this paper.
References
- Wang, K.; Ding, L.; Dailami, F.; Matthews, J. A Methodology to Support Robotic Polishing of Molds Integrated with CAD/CAM. J. Adv. Manuf. Syst. 2024, 23, 349–390. [Google Scholar]
- Li, J.; Huang, W.; Xie, Y.; Yang, J.; Zhao, M. The Parameters Optimization of Robotic Polishing with Force Controlled for Mold Steel Based on Taguchi Method. J. Braz. Soc. Mech. Sci. 2024, 46, 313. [Google Scholar]
- Li, C.L.; Nan, R.; Wei, Y.Y.; Li, L.; Liang, J.X.; Li, N. Application Research of Vision-Guided Grinding Robot for Wheel Hub Castings. Processes 2025, 13, 238. [Google Scholar] [CrossRef]
- Walker, D.; Brooks, D.; King, A.; Freeman, R.; Kim, S.W. The ‘Precessions’ Tooling for Polishing and Figuring Flat, Spherical and Aspheric Surfaces. Opt. Express 2003, 11, 958–964. [Google Scholar] [PubMed]
- Lee, H.; Kim, J.; Kang, H. Airbag Tool Polishing for Aspherical Glass Lens Molds. J. Mech. Sci. Technol. 2010, 24, 153–158. [Google Scholar]
- Kordonski, W.I.; Golini, D. Fundamentals of Magnetorheological Fluid Utilization in High Precision Finishing. J. Intell. Mater. Syst. Struct. 1999, 10, 683–689. [Google Scholar]
- Wang, W.; Ji, S.; Zhao, J. Review of Magnetorheological Finishing on Components with Complex Surfaces. Int. J. Adv. Manuf. Technol. 2024, 131, 3165–3191. [Google Scholar]
- Wu, D.; Wang, H.; Zhang, K.; Lin, X. Research on Flexible Adaptive CNC Polishing Process and Residual Stress of Blisk Blade. Int. J. Adv. Manuf. Technol. 2019, 103, 2495–2513. [Google Scholar]
- Shiou, F.J.; Cheng, C.H. Ultra-Precision Surface Finish of Nak80 Mould Tool Steel Using Sequential Ball Burnishing and Ball Polishing Processes. J. Mater. Process. Tech. 2008, 201, 554–559. [Google Scholar]
- Huang, H.Y.; Fuh, K.H.; Wu, J.S.; Tai, Y.H. A New Integrated Polishing Process Design for Plastic Mold Steel to Mirror-Like Surface. Int. J. Adv. Manuf. Technol. 2014, 73, 1633–1645. [Google Scholar]
- Zhao, T.; Shi, Y.; Lin, X.; Duan, J.; Sun, P.; Zhang, J. Surface Roughness Prediction and Parameters Optimization in Grinding and Polishing Process for IBR of Aero-Engine. Int. J. Adv. Manuf. Technol. 2014, 74, 653–663. [Google Scholar] [CrossRef]
- Liu, Z.; Hu, Y.; Zhang, M.; Zhang, W.; Wang, J.; Lei, W.; Wang, C. Surface Morphology Evolution Mechanisms of Pulse Laser Polishing Mold Steel. Int. J. Mech. Sci. 2024, 269, 109039. [Google Scholar] [CrossRef]
- Zou, L.; Liu, X.; Huang, Y.; Fei, Y. A Numerical Approach to Predict the Machined Surface Topography of Abrasive Belt Flexible Grinding. Int. J. Adv. Manuf. Technol. 2019, 104, 2961–2970. [Google Scholar] [CrossRef]
- Yin, T.F.; Zhang, H.Q.; Hang, W.; To, S. A Novel Approach to Optimizing Grinding Parameters in the Parallel Grinding Process. Processes 2024, 12, 493. [Google Scholar] [CrossRef]
- Xie, Y.; Chang, G.; Yang, J.; Zhao, M.; Li, J. Process Optimization of Robotic Polishing for Mold Steel Based on Response Surface Method. Machines 2022, 10, 283. [Google Scholar] [CrossRef]
- Qi, B.; Huang, X.; Guo, W.; Ren, X.; Chen, H.; Chen, X. A Novel Comprehensive Framework for Surface Roughness Prediction of Integrated Robotic Belt Grinding and Burnishing of Inconel 718. Tribol. Int. 2024, 195, 109574. [Google Scholar] [CrossRef]
- Wang, X.; Wang, X.; Yang, Z.; Zou, Y. An Investigation of Real-Time Robotic Polishing Motion Planning Using a Dynamical System. Machines 2024, 12, 278. [Google Scholar] [CrossRef]
- Wahballa, H.; Duan, J.; Dai, Z. An Automatic Robot Polishing Control Method for Compound Surface Comprising Plane and Curved Surfaces. Int. J. Adv. Manuf. Technol. 2024, 132, 3801–3819. [Google Scholar] [CrossRef]
- Mohsin, I.; He, K.; Li, Z.; Du, R. Path Planning Under Force Control in Robotic Polishing of the Complex Curved Surfaces. Appl. Sci. 2019, 9, 5489. [Google Scholar] [CrossRef]
- Fernandez, A.; Dieste, J.A.; Javierre, C.; Santolaria, J. Surface Roughness Evolution Model for Finishing Using an Abrasive Tool on a Robot. Int. J. Adv. Robot. Syst. 2015, 12, 119. [Google Scholar] [CrossRef]
- Verma, T.; Chawla, O.; Jha, S. Mathematical Modelling for Prediction of Surface Roughness in Pneumatically Configurable Polishing Process. Wear 2022, 504, 204434. [Google Scholar]
- Savio, G.; Meneghello, R.; Concheri, G. A Surface Roughness Predictive Model in Deterministic Polishing of Ground Glass Moulds. Int. J. Mach. Tools Manuf. 2009, 49, 1–7. [Google Scholar]
- Feng, D.; Sun, Y.; Du, H. Investigations on the Automatic Precision Polishing of Curved Surfaces Using a Five-Axis Machining Centre. Int. J. Adv. Manuf. Technol. 2014, 72, 1625–1637. [Google Scholar] [CrossRef]
- Qi, J.; Zhang, D.; Li, S.; Chen, B. Modeling and Prediction of Surface Roughness in Belt Polishing Based on Artificial Neural Network. Proc. Inst. Mech. Eng. Part B J. Eng. Manuf. 2018, 232, 2154–2163. [Google Scholar]
- Wang, G.; Zhou, X.; Meng, G.; Yang, X. Modeling Surface Roughness for Polishing Process Based on Abrasive Cutting and Probability Theory. Mach. Sci. Technol. 2018, 22, 86–98. [Google Scholar] [CrossRef]
- Zhang, X.; Sun, Y. Development of Pneumatic Force-Controlled Actuator for Automatic Robot Polishing Complex Curved Plexiglass Parts. Machines 2023, 11, 446. [Google Scholar] [CrossRef]
- Shang, Y.R.; Hu, S.B.; Qiao, H. Sensitivity Study of Surface Roughness Process Parameters in Belt Grinding Titanium Alloys. Metals 2023, 13, 1825. [Google Scholar] [CrossRef]
- Yang, Z.Y.; Xu, X.H.; Zhu, D.H.; Yan, S.J.; Ding, H. On Energetic Evaluation of Robotic Belt Grinding Mechanisms Based on Single Spherical Abrasive Grain Model. Int. J. Adv. Manuf. Technol. 2019, 104, 4539–4548. [Google Scholar]
- Baidakova, N.V.; Kryukov, S.A. Wear of Abrasive Grains. Russ. Eng. Res. 2024, 44, 1550–1552. [Google Scholar]
- Doman, D.A.; Warkentin, A.; Bauer, R. A Survey of Recent Grinding Wheel Topography Models. Int. J. Mach. Tools. Manuf. 2006, 46, 343–352. [Google Scholar]
- Han, Y.X.; Yang, Y.S.; Lyu, B.; Hang, W.; Wang, X.; Yuan, J.L. Optimization of Shear-Thickening Polishing Parameters for Optical Glass Based on Grey Relational Analysis. Machines 2025, 13, 40. [Google Scholar] [CrossRef]
- Qiao, H.; Hu, S.B.; Xiang, Y.; Liu, S.S.; Zhang, L. Research on the Analysis and Prediction Model of Machining Parameters of Titanium Alloy by Abrasive Belt. Metals 2023, 13, 1085. [Google Scholar] [CrossRef]
- Xi, F.; Zhou, D. Modeling Surface Roughness in the Stone Polishing Process. Int. J. Mach. Tools Manuf. 2005, 45, 365–372. [Google Scholar]


Disclaimer/Publisher’s Note: The statements, opinions and data contained in all publications are solely those of the individual author(s) and contributor(s) and not of MDPI and/or the editor(s). MDPI and/or the editor(s) disclaim responsibility for any injury to people or property resulting from any ideas, methods, instructions or products referred to in the content. |
© 2025 by the authors. Licensee MDPI, Basel, Switzerland. This article is an open access article distributed under the terms and conditions of the Creative Commons Attribution (CC BY) license (https://creativecommons.org/licenses/by/4.0/).