1. Introduction
The increasing volume of organic waste, driven by rapid industrialization and population growth, has created a need for advanced waste-to-energy technologies [
1,
2,
3]. The growing demand for biofuels highlights the strategic importance of hydrothermal liquefaction (HTL) technology in climate and waste management initiatives [
4]. HTL is a thermochemical conversion process that transforms wet biomass, such as sewage sludge, waste food, and pinewood, into biocrude oil at temperatures between 473 and 673 K and pressures between 5 and 20 MPa, which allows water to be kept under subcritical conditions [
5,
6,
7]. In the hydrothermal liquefaction (HTL) process, water plays a key role as a reaction medium and solvent for biomass degradation products, enabling the efficient conversion of organic matter into bio-oil. In such conditions, water exhibits reduced viscosity and increased dielectric constants, which promote hydrolysis, depolymerization, and rearrangement reactions of compounds As a result of the HTL process, four main reaction phases are obtained: aqueous, organic, gaseous, and solid. Moreover, this process can be applied to biomass with high water content, which makes it more versatile. Biocrude oil has a heating value of about 19–36 MJ/kg, which can be enhanced through catalysis to biofuels suitable for the transportation sector [
5]. The aqueous fraction, rich in dissolved organic matter and nutrients such as nitrogen and phosphorus, can be reused as fertilizer in agricultural applications [
8,
9]. The hydrothermal liquefaction (HTL) of sewage sludge, food waste, and pinewood into biocrude oil presents a promising waste valorization pathway; however, its economic feasibility and production efficiency compared to alternative methods, such as landfill leachate processing, require further justification. Despite the potentially higher costs and lower production rates, HTL offers significant advantages, including higher energy recovery, reduced greenhouse gas emissions, and minimized landfill reliance. Additionally, advancements in catalyst development, reactor design, and process optimization are continuously improving HTL’s efficiency and scalability, making it a more competitive alternative. A comprehensive techno-economic assessment is therefore crucial to validate HTL’s viability as a sustainable and efficient waste-to-energy conversion technology. Extensive research over the last few decades has focused on increasing the yield of HTL products from biowaste that can be upgraded to biofuels for aviation, marine, and land transportation blending [
10,
11,
12]. The HTL process utilizes batch and tubular reactors, with tubular reactors being preferred due to their continuous production capabilities. Typically, the HTL process in tubular reactors [
13,
14] provides more stable and uniform operating conditions, such as temperature and pressure, resulting in better control of chemical processes, due to the continuous flow and flexible control residence time. Batch reactors are inherently limited by their discontinuous operation, necessitating repetitive charging and discharging of materials, coupled with restricted reaction volumes. This operational paradigm mandates energy-intensive thermal cycling for process control. Conversely, tubular reactors, particularly those operating in a plug flow regime, offer substantial improvements in process efficiency. The continuous nature of these systems affords enhanced operational flexibility and significantly reduces energy consumption associated with thermal management. Specifically, the cyclic heating and cooling requirements characteristic of intermittent feedstock handling in batch reactors are obviated in plug flow tubular reactors. This design eliminates the need for oscillatory thermal adjustments, thereby minimizing energy dissipation and promoting process sustainability. The simple construction of tube reactors, low capital and operating costs, and high mixing efficiency make them suitable for various mixing applications, especially in the production of multiphase systems such as emulsions and suspensions, where conventional mixers may be uneconomical [
15,
16]. Therefore, comprehensive simulations of the HTL process, including kinetic mechanisms, reactor mass, and energy balances, provide detailed insights into the composition and properties of the materials involved. Computational fluid dynamics (CFD) is becoming increasingly important for modeling multiphase flows [
17]. Simulation results can optimize reactor design and identify zones of intense mixing in multiphase processes [
7,
18]. The integration of CFD with the discrete element method (DEM) facilitates the analysis of solid–liquid interactions and particle dynamics within the system, which is essential for industries such as mining, pharmaceuticals, and food processing, where handling of bulk materials is critical.
Optimizing the hydrothermal liquefaction (HTL) process requires a comprehensive approach integrating classical optimization techniques, heuristic methods, mathematical modeling, and artificial intelligence. The choice of method depends on process-specific factors, available data, and optimization objectives, such as maximizing biofuel yield, reducing costs, or enhancing product quality. Achieving optimal biocrude yield and quality necessitates a precise understanding of key process parameters: temperature, pressure, and residence time in relation to feedstock composition. Since biocrude properties are significantly influenced by these variables, balancing biomass components such as proteins, carbohydrates, and lipids or co-liquefying with a complementary material can enhance yield. Identifying critical process factors, including reagent flow and biomass concentration, is essential; however, variations in reactor types, residence times, and feedstock compositions across studies make establishing universal HTL conditions for optimal biocrude production challenging [
19].
Lababpour and Patel [
19] conducted an in-depth analysis of key operational factors, including thermal settings, system pressure, biomass concentration, and reaction duration. Chen et al. [
20] and Ruiz et al. [
21] investigated the influence on feedstock types on the HTL process, performing experiments in small reactors to obtain optimal product composition. Deep understanding of fluid and thermal dynamics along with reaction kinetics is a critical aspect of continuous reactor design. Ranganathan and Savithri [
22] developed a two-dimensional CFD model integrating HTL kinetics of sewage sludge slurry flow rate in a continuous tube reactor and investigated the effect of temperature, pressure, and slurry flow rate on biocrude yield production. Xiao et al. [
23] examined the correlation between temperature profiles and reaction rates in tubular reactors using CFD models. Joshi et al. [
24] employed a CFD model to simulate the impact of process parameters, such as temperature, pressure, and residence time, on biocrude oil yield in relation to Prandtl number. Recent studies on HTL processes in continuous pilot-scale reactors have applied various process parameters to feedstock HTL reaction conditions compared with experimental data [
7,
17]. These simulations can improve process design by identifying optimal HTL conditions and reactor geometries. Modeling and simulation are critical for developing feasible HTL process simulations, which are critical for scaling up process production and commercialization. Akhtar et al. [
25] optimized HTL conditions, while Pedersen and Rosendahl [
26] investigated the influence of different feedstocks on biocrude yields in the HTL process. Vardon et al. [
16] investigated the influence of catalysts on yield and efficiency, and Barreiro et al. [
15,
16] investigated reactor development and upgrading for HTL conditions. Wodołażski [
27] presented multiphase simulation of the HTL process using numerical computational fluid dynamics (CFD) in order to show the influence of process parameters on the yield of the resulting biocrude oil in the tubular reactor. Optimal HTL performance is achieved through the precise control of process parameters, including temperature, pressure, and reaction time. The process operates under hydrothermal conditions where temperature and pressure must be meticulously tuned to achieve maximum conversion efficiency and product quality. Additionally, reaction time plays a critical role; therefore, optimizing this parameter ensures the maximization of biocrude oil yield and minimization of unwanted by-products.
This paper presents an optimization simulation of the HTL (hydrothermal liquefaction) process in a tubular reactor involving adjusting the reaction conditions, such as temperature, pressure, reaction time, substrate concentration, and reagent flow, in order to maximize the yield and quality of the obtained biofuel to minimize operating costs and energy consumption. The optimization includes the impact of temperature, pressure residence time, and convective heat transfer on biocrude yield in a plug flow tubular reactor. The efficiency of biocrude oil production from biomass feedstock was analyzed under optimal conditions considering the process parameters. We suggest how to design reactors for optimal process conditions to maximize biocrude oil yields.
The scientific values of this manuscript lie in the simulation multiphase flow of the HTL (hydrothermal liquefaction) process in a tubular reactor involving adjusting the reaction conditions, such as temperature, pressure, reaction time, substrate concentration, and reagent flow, in order to maximize the yield and quality of the obtained biofuel. The optimization included the impact of slurry flow rate, temperature, residence time, and convective heat transfer on product yield in a plug flow tubular reactor. These simulations allowed for the visualization of temperature, pressure, and concentration profiles of the HTL process, especially in areas inaccessible for measurement or impossible experimentally due to the high temperatures and pressures occurring during the process: experimental measurements are only possible at designated measurement points and not for the entire reactor profiles. It is also crucial to limit char deposition, which in the presence of a gas phase (e.g., water vapor bubbles) can create local hot spots, leading to uncontrolled precipitation of char and increasing clogging risk.
3. Results
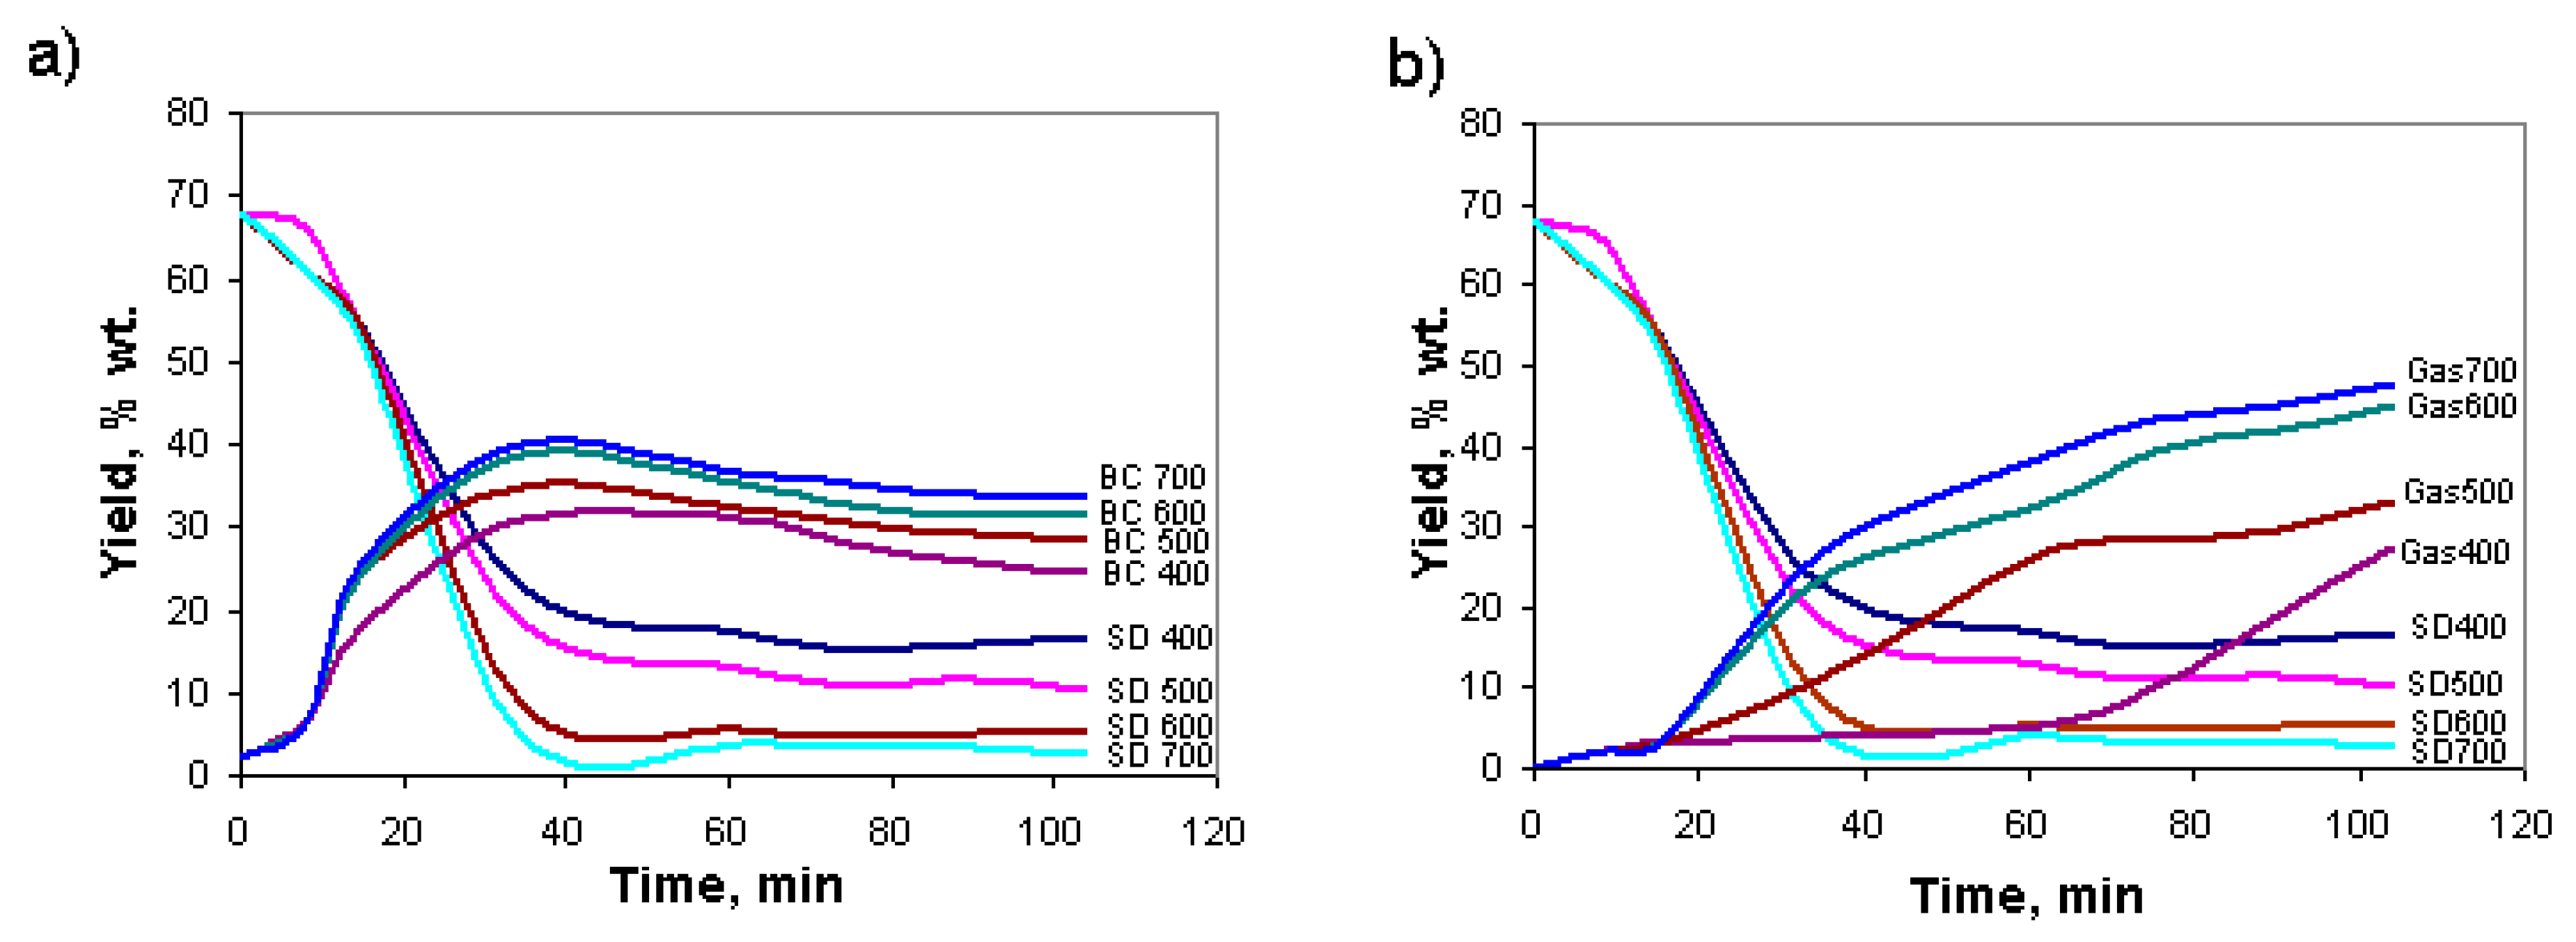
Figure 3 clearly shows changes in the gas, volatile, biocrude oil, aqueous, and solid phases during the conversion of sewage sludge to biocrude oil over 100 min at temperatures of 500 K and 700 K. The graph vividly illustrates the dynamics of reagent concentration changes with increasing temperature, where there is a significantly higher degree of sewage sludge reactivity, consequently leading to a substantially larger amount of gas phase formation. As the temperature increased from 500 to 700 K, the gas production rose by 15.71%. However, the maximum biocrude oil yield reached 40.32% at 32 min, although it subsequently decreased moderately to 33% after 100 min. These findings indicate that there is an optimal reaction time for achieving the maximum concentration of biocrude oil. Nevertheless, it is challenging to determine this optimal point in experimental studies (high temperature and pressure conditions) due to the inability to continuously monitor the biocrude oil concentration every minute, especially when conducting the process under non-steady-state conditions. With the increase in temperature by 200 K, the conversion rate of sewage sludge also increased by 18.7%
Temperature and residence time are critically key parameters influencing the efficiency of the conducted process. The dynamic concentration changes in individual phases of the reaction mixture reflect the rapid alterations in the chemical component involved in the hydrothermal liquefaction (HTL) process. The influence of temperature, pressure, and residence time, which were significantly influenced by the effect of convective heat transfer in the HTL process, on biocrude yield was noteworthy.
Figure 4 clearly illustrates the impact of the temperature range (from 400 K to 700 K) on biocrude oil production. As the temperature steadily increases from 400 K to 700 K, there is a noticeable of biocrude oil production from 22% to 34.8% depending on the process duration, where biocrude oil changes dynamically over time. A longer process, however, requires greater energy inputs. Although extending the process time might improve certain outcomes, the increased energy demand must be carefully considered to ensure overall process efficiency. The proportion of solid phase of the primary feedstock decreased from 18.29% to 4.63%. Temperature and residence time distribution are crucial factors significantly affecting the biomass conversion rate in the HTL process. Temperature and residence time are critically important parameters that contribute substantially to optimizing conditions of the HTL process. However, clogging caused by increasing solid particle size and kinematic viscosity can be mitigated by reactor scale-up, increasing the tube diameter and length, optimizing feedstock preparation, and adjusting temperature and feedstock composition. When the liquid phase disappears, the risk of intense polymerization and carbonization increases, leading to char deposition on the reactor wall.
Contour plots of the fluid velocity, temperature, and gas mass fraction in the HTL process are shown in
Figure 5.
As depicted in
Figure 5a, due to the characteristic of the velocity distribution for laminar flow, the maximum velocity of the suspension occurs in the center of the pipe. Pressure drop in the tube reactor depends mainly on solid particle size distribution, kinematic viscosity, and reactor slurry flow rate. Therefore, pressure drop can significantly identify the degree of reactor clogging. An overall high ash content raises flow obstruction in a tubular reactor (>24.1%). In addition, there is a higher chance of clogging with rising kinematic viscosity (above 8.6 mm
2/s) and solid particle diameter. Thus, ash content significantly impacts the potential for reactor clogging. Potential solutions include increasing reactor heating efficiency to allow rapid feedstock liquefaction, reducing the feedstock ash content, or enlarging the reactor tube diameter.
Figure 5b shows the temperature distribution in the reactor, indicating the temperature gradient. Heat transfer occurs from the reactor wall to the slurry mixture, which enters the reactor at approximately 300 K. Predominantly, the sludge suspension exhibits behavior consistent with the thermodynamic properties of subcritical water.
Figure 5c illustrates the heat transfer coefficient, which plays a crucial role in the hydrothermal liquefaction (HTL) process, directly influencing the efficiency and quality of the resulting biocrude oil. Effective heat transfer from the heating medium (reactor wall) to the reactant (biomass in water) is essential for optimizing thermal efficiency, preventing overheating, and minimizing undesirable side reactions. Additionally, optimizing the heat transfer coefficient (
h) reduces char deposition, which can lead to reactor clogging. If the heat transfer coefficient is too low, uneven heating of the biomass suspension occurs, resulting in increased char formation and a higher risk of reactor blockage. Conversely, excessive heat transfer may accelerate secondary pyrolysis, leading to the degradation of biocrude into gaseous products.
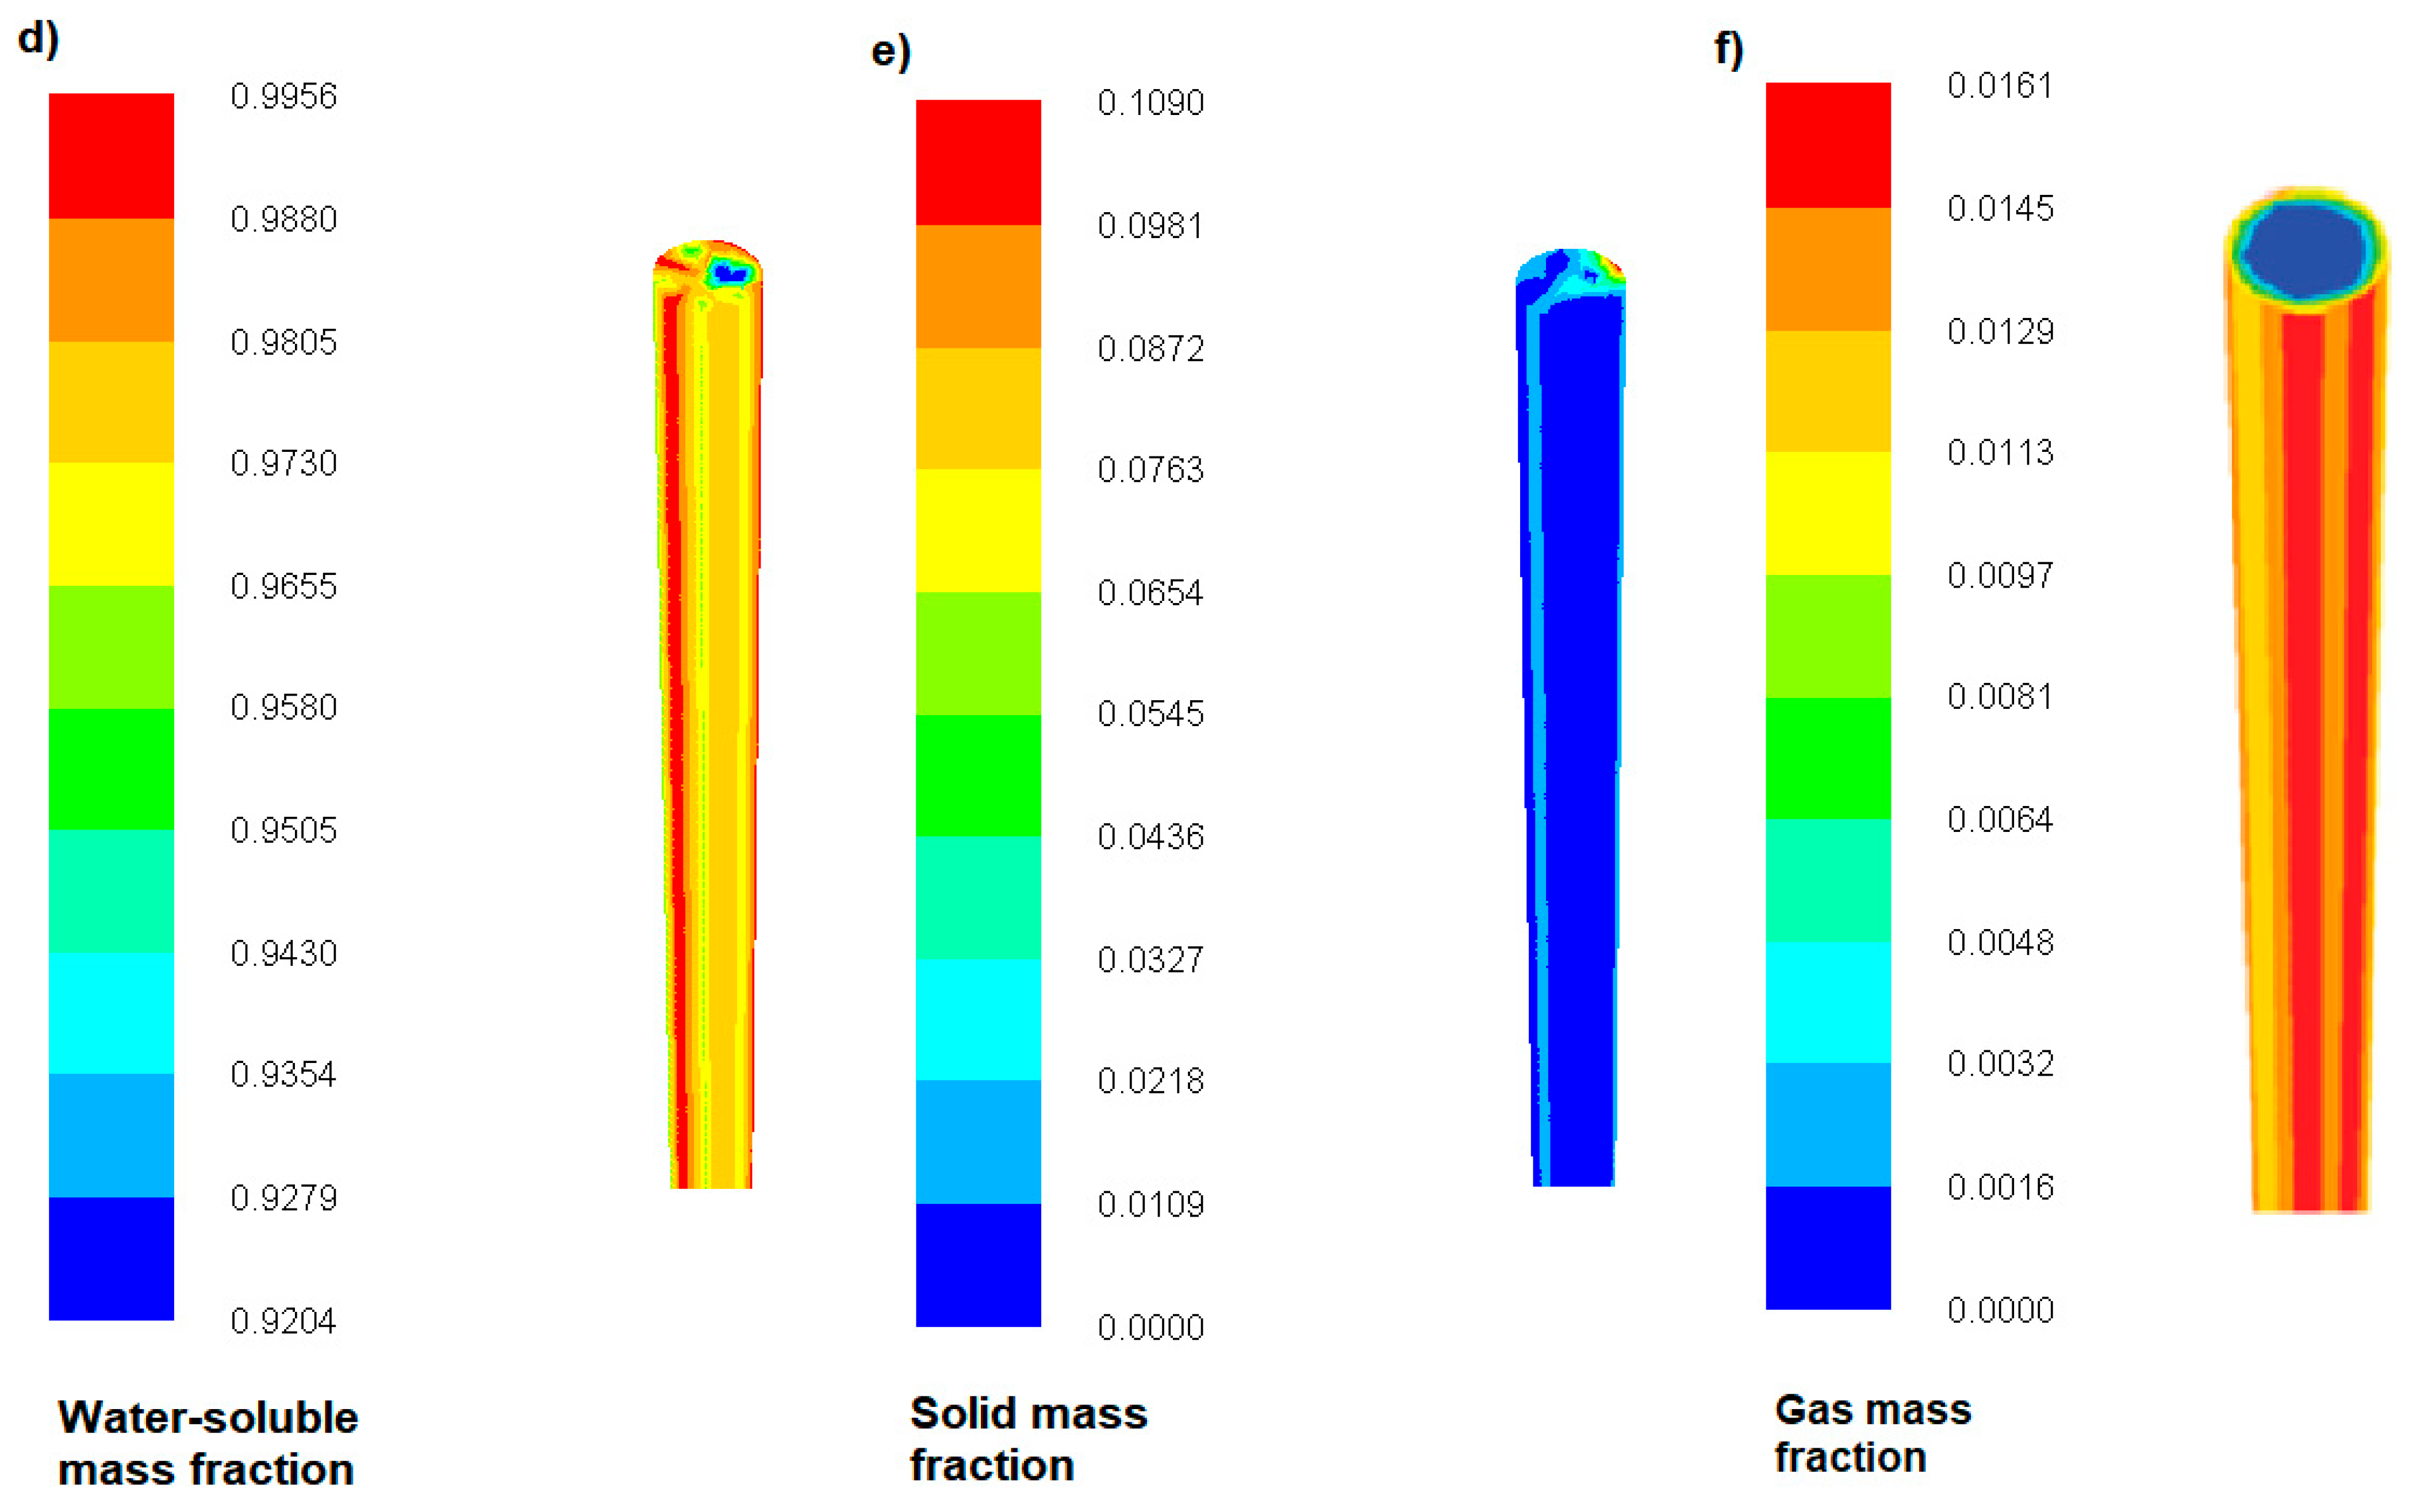
Figure 5d–f present the mass fractions of water, solid, and gas phases. As the suspension moves along the reactor wall, it exhibits a lower velocity but a longer residence time, promoting enhanced reaction progress. Each phase plays a distinct role in the HTL process and significantly affects biomass conversion efficiency. Among these, the liquid phase is the most desirable product, as prolonged exposure to elevated temperatures and extended residence times may trigger secondary reactions, degrading biocrude into gaseous components. The solid phase forms primarily due to incomplete biomass degradation or secondary carbonization of reaction intermediates. Inefficient heat transfer and inadequate mixing further increase char deposition on reactor walls, exacerbating flow resistance and reducing process efficiency.
Figure 5f presents contour plots of the gas mass fraction, illustrating both the external view of the reactor and its cross section. The results indicate that fluid velocity decreases near the warmer reactor wall, where gas accumulation is more pronounced. In hydrothermal liquefaction (HTL) processes, which operate under extremely high pressures and temperatures, significant temperature and pressure gradients are often observed. Elevated temperatures near the reactor walls promote more rapid evaporation of water and other volatile components, leading to increased local gas concentrations. In contrast, within the reactor core, where temperature tends to be more uniform, density differences between phases result in gas migrating towards the heated walls. Additionally, due to the parabolic velocity profile characteristic of laminar flow, fluid elements near the walls exhibit lower velocities and consequently longer residence times compared to those in the reactor center. As the suspension (slurry) flows through the reactor, its viscosity may increase due to changes in temperature and phase composition or reactions occurring within the reactor. Higher viscosity can impede flow, contributing to higher pressure drops. Temperature and pressure conditions in the tubular reactor in the HTL process change very dynamically. Clogging is one of the sensitive points that is a disadvantage of tubular reactors.
Increasing the reactor length from 8 to 16 m is crucial for biomass conversion efficiency, product selectivity, and operational stability. In the HTL process, the residence time of the reactants directly affects the degree of biomass decomposition; therefore, extending the reactor allows for increased conversion of biomass to bio-oil at higher flow rates. This allows for an increase in the reactor production capacity.
Optimization of the reactor’s geometry, in particular its length, allows for a reduction in the required temperature and pressure, because the extended residence time of the reactants compensates for the slower course of the reaction. In a shorter reactor, higher temperatures and pressures are necessary to achieve full biomass conversion, which can lead to lower process stability, product degradation, and increased gas production.
A longer reactor provides a more uniform temperature distribution, which allows for gradual liquefaction of the biomass, thus increasing the efficiency of the hydrothermal liquefaction process.
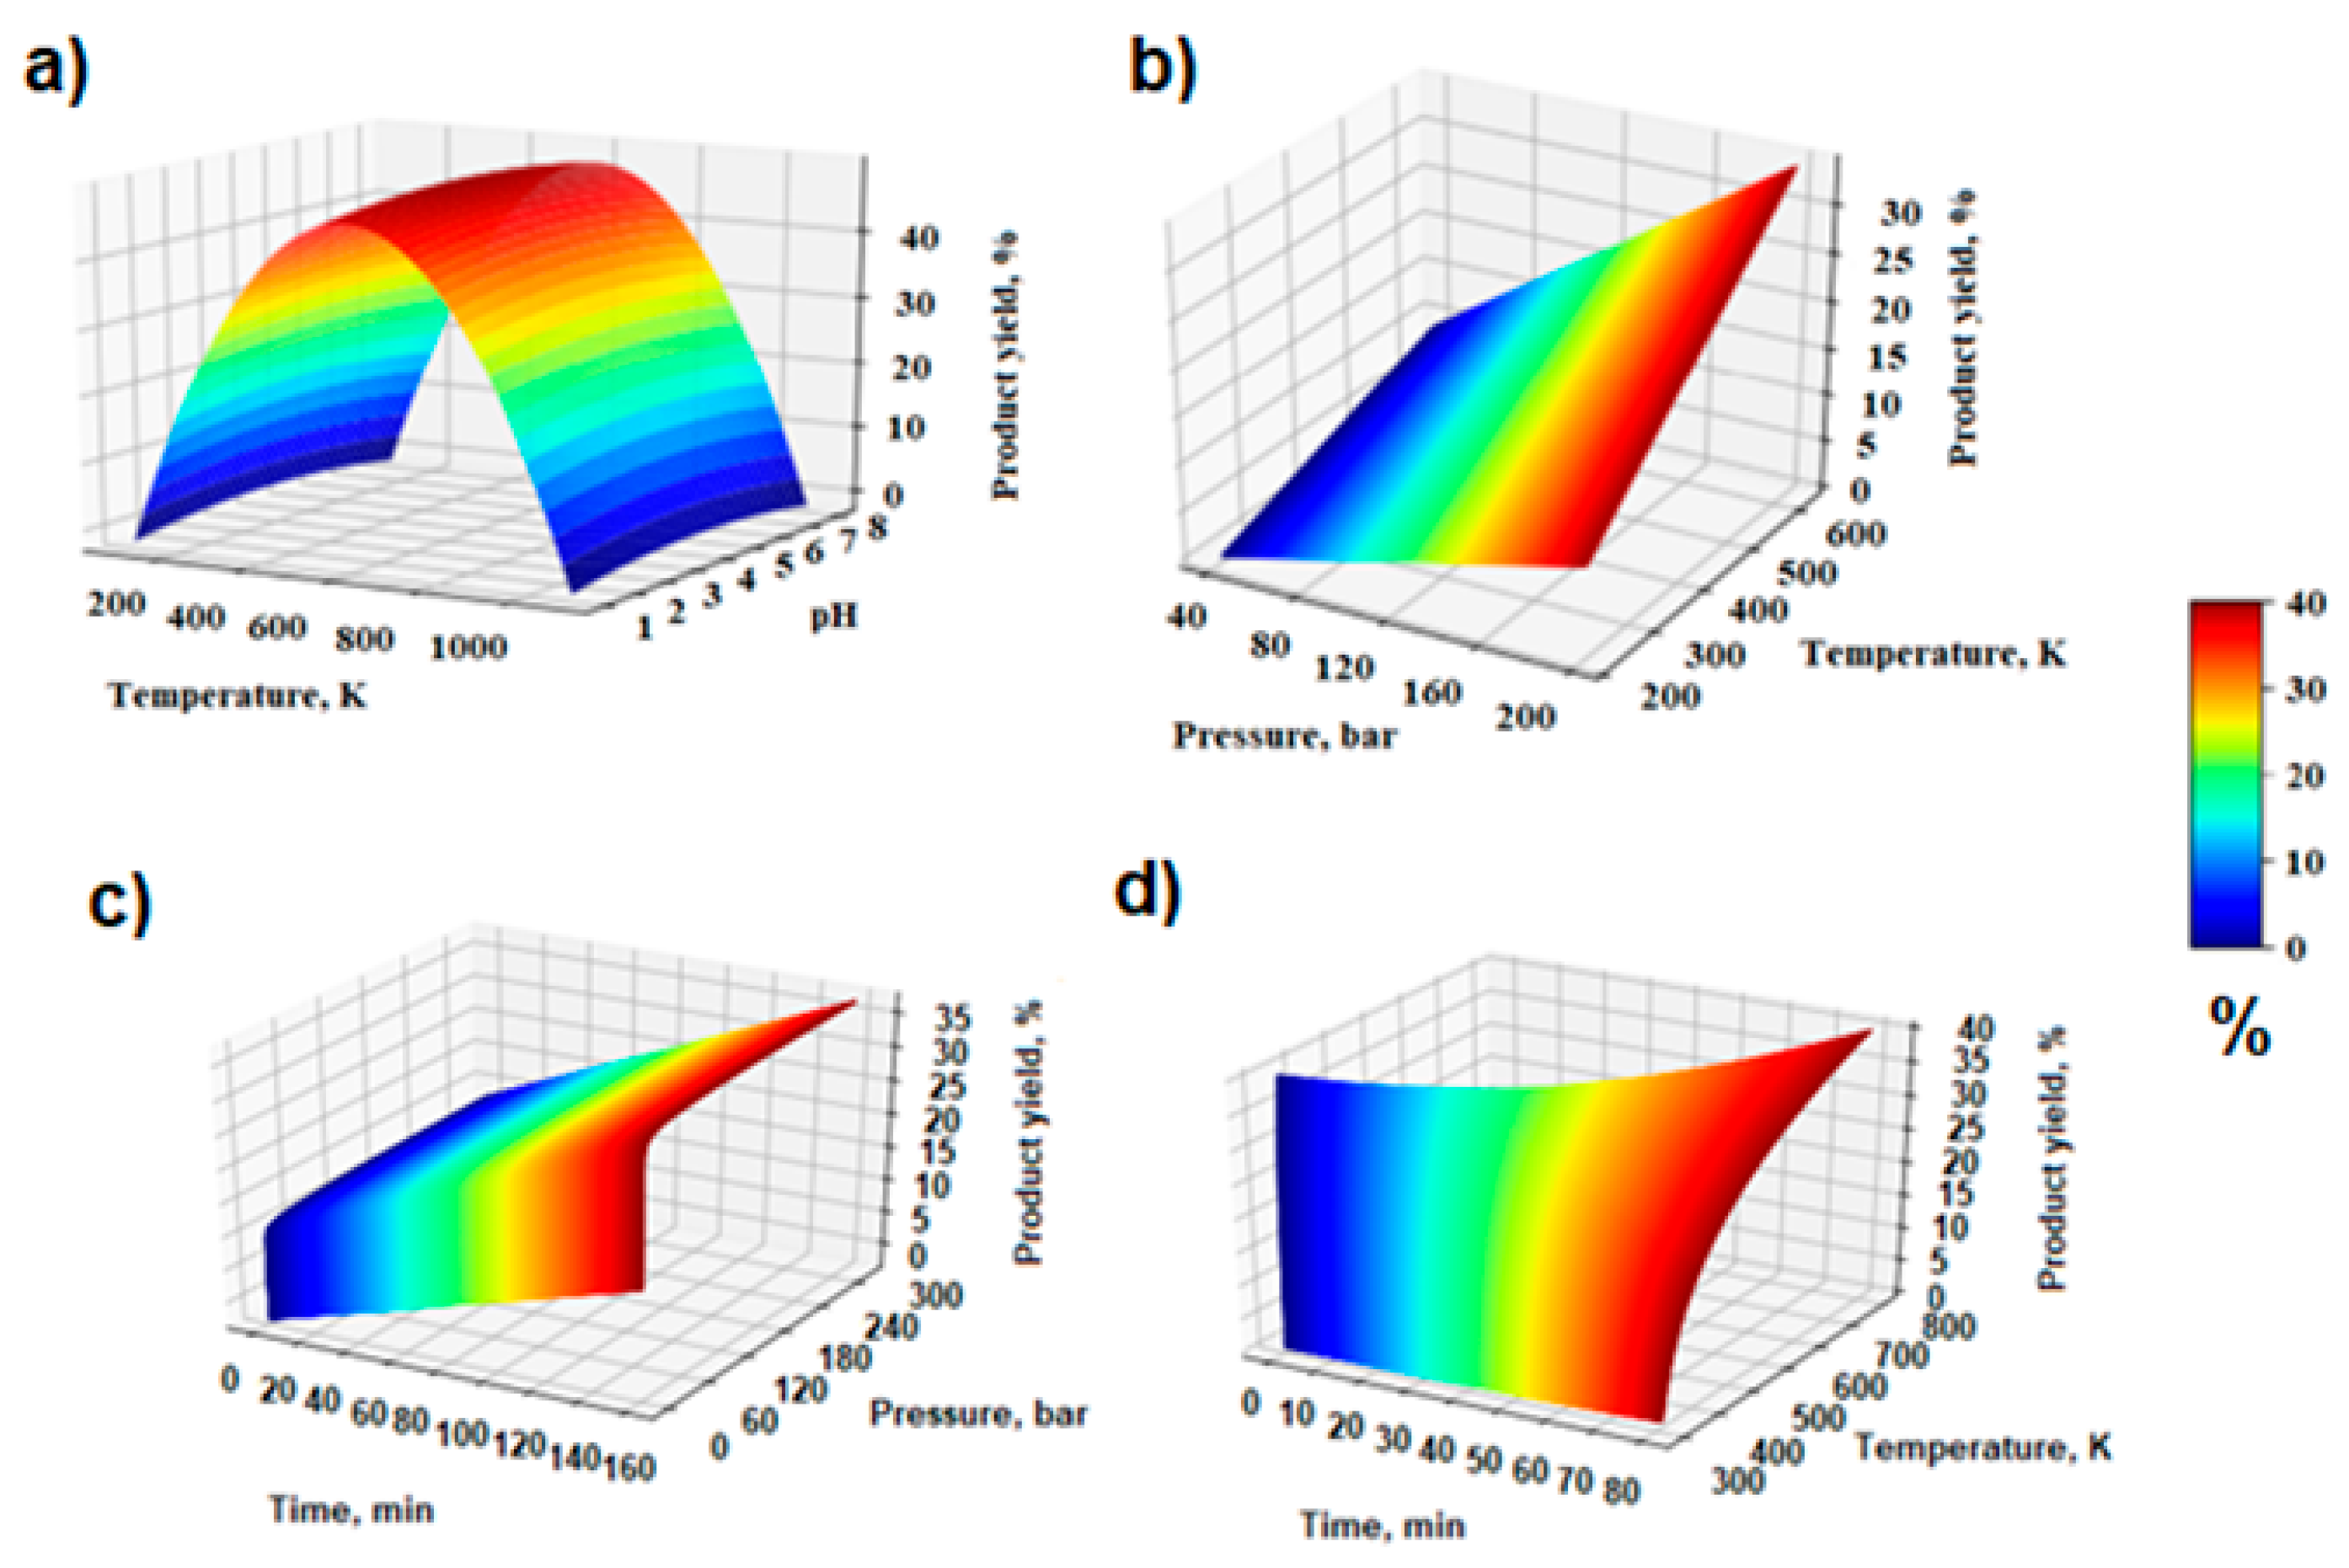
Figure 6a,b show the effects of temperature, pH, and pressure on biocrude yield. As the pressure and temperature increase, the amount of biocrude oil also increases.
Figure 6a shows the optimal temperature, where the biocrude oil yield is at its highest concentration at a pressure of 200 bar. As the temperature increases from 200 to 682 K, the amount of biocrude oil produced increases. Above this temperature, repolymerization reactions begin to predominate, which cause a decrease in the biocrude oil produced. In
Figure 6b, a significant effect of pressure on the amount of biocrude oil produced can be seen. Although the effect of temperature is also significant, it allows the reactants to be maintained in the liquid phase, which contributes to a greater degree of conversion of sewage sludge to biocrude oil. Upon surpassing the 500 K mark within 3 min, a solid conversion rate of 58.3% was accomplished. At an anticipated temperature of 300° C, the gas output surged from 6.6 wt.% to 20.2 wt.% as the reaction period extended from 9 min to 68 min. The temperature had a more pronounced influence on achieving a heightened gas yield than the duration of the process. For higher flow rates of 32 cm
3/min, the rate of biocrude oil produced was lower and the desired temperature was achieved over a longer period. As the flow rate increased, the amount of biocrude oil produced decreased, which was associated with a decrease in the heat and mass transfer coefficient of the suspension flow.
Figure 6c shows the influence of time-varying parameters of pressure at a constant temperature of 680 K on the yield of produced biocrude oil.
Figure 6d shows the influence of time-varying parameters of temperature at a constant pressure of 210 bar on the yield of produced biocrude oil. The increase in temperature led to the acceleration of chemical reactions, such as depolymerization, hydrolysis, and redox reactions, which increased the efficiency of the process. Higher pressure prevents water from boiling at higher temperatures, which allows for better process control and increased biomass dissolution efficiency. Maintaining water in a liquid state is necessary for dissolving and decomposing biomass in the HTL process. Both temperature and pressure have a significant influence on the selection and optimization of process conditions.
Char formation is mainly due to the polymerization and condensation of organic compounds. Process optimization aims to minimize the formation of carbon deposits (char deposition), which can be achieved by appropriate reaction conditions. A key factor is to maintain the post-reaction mixture in the liquid phase, as this limits the formation of char. Excessive char deposition affects the stability of the process and can lead to reactor clogging, which negatively affects the efficiency and continuity of production.
Figure 7 illustrates the influence of process optimization parameters on the hydrothermal liquefaction (HTL) of sewage sludge to biocrude oil. Biocrude oil yields are presented for specified reaction times and temperatures.
In
Figure 7a, a clear trend emerges where increased temperature and reaction time leads to an increase in biocrude oil yield.
Figure 7b highlights the significant combined effect of pressure and temperature. A notable increase in biocrude oil yield is observed at 160 bar and temperatures exceeding 250 °C. This yield continues to rise, surpassing 45%, at temperatures above 350 °C and pressures exceeding 180 bar. Conversely,
Figure 7c demonstrates that increasing slurry flow rate and kinematic viscosity coefficient results in a decrease in biocrude oil production. This is a result of complex interactions of physicochemical processes. The increase in the flow rate of the suspension causes shorter residence of the reactants in the reactor, which affects the uneven distribution of temperature and pressure and in consequence negatively affects the efficiency of chemical reactions. The increase in medium viscosity reduces the mobility of the molecules, which slows the processes of diffusion and chemical interactions in the mixture. The higher viscosity of the reaction medium favors the formation of solid products instead of the liquid phase. This results from the limitations in the decomposition of polymers or in the condensation of intermediate products. Optimization of process parameters, specifically a temperature of 412 °C (685.15 K) and pressure of 198 bar with a suspension flow rate of F = 32 cm
3/min, yielded the highest efficiency, reaching 48%. However, under more challenging conditions (T > 420 °C, p > 210 bar), the biocrude yield decreased as molecules transformed into the water phase or gaseous products. It is crucial to note that these parameters are interrelated and their optimal values will vary with the suspension flow rate. Conducting the process under optimal conditions at the appropriate flow rate, temperature, and pressure will significantly reduce the installation and operational costs.
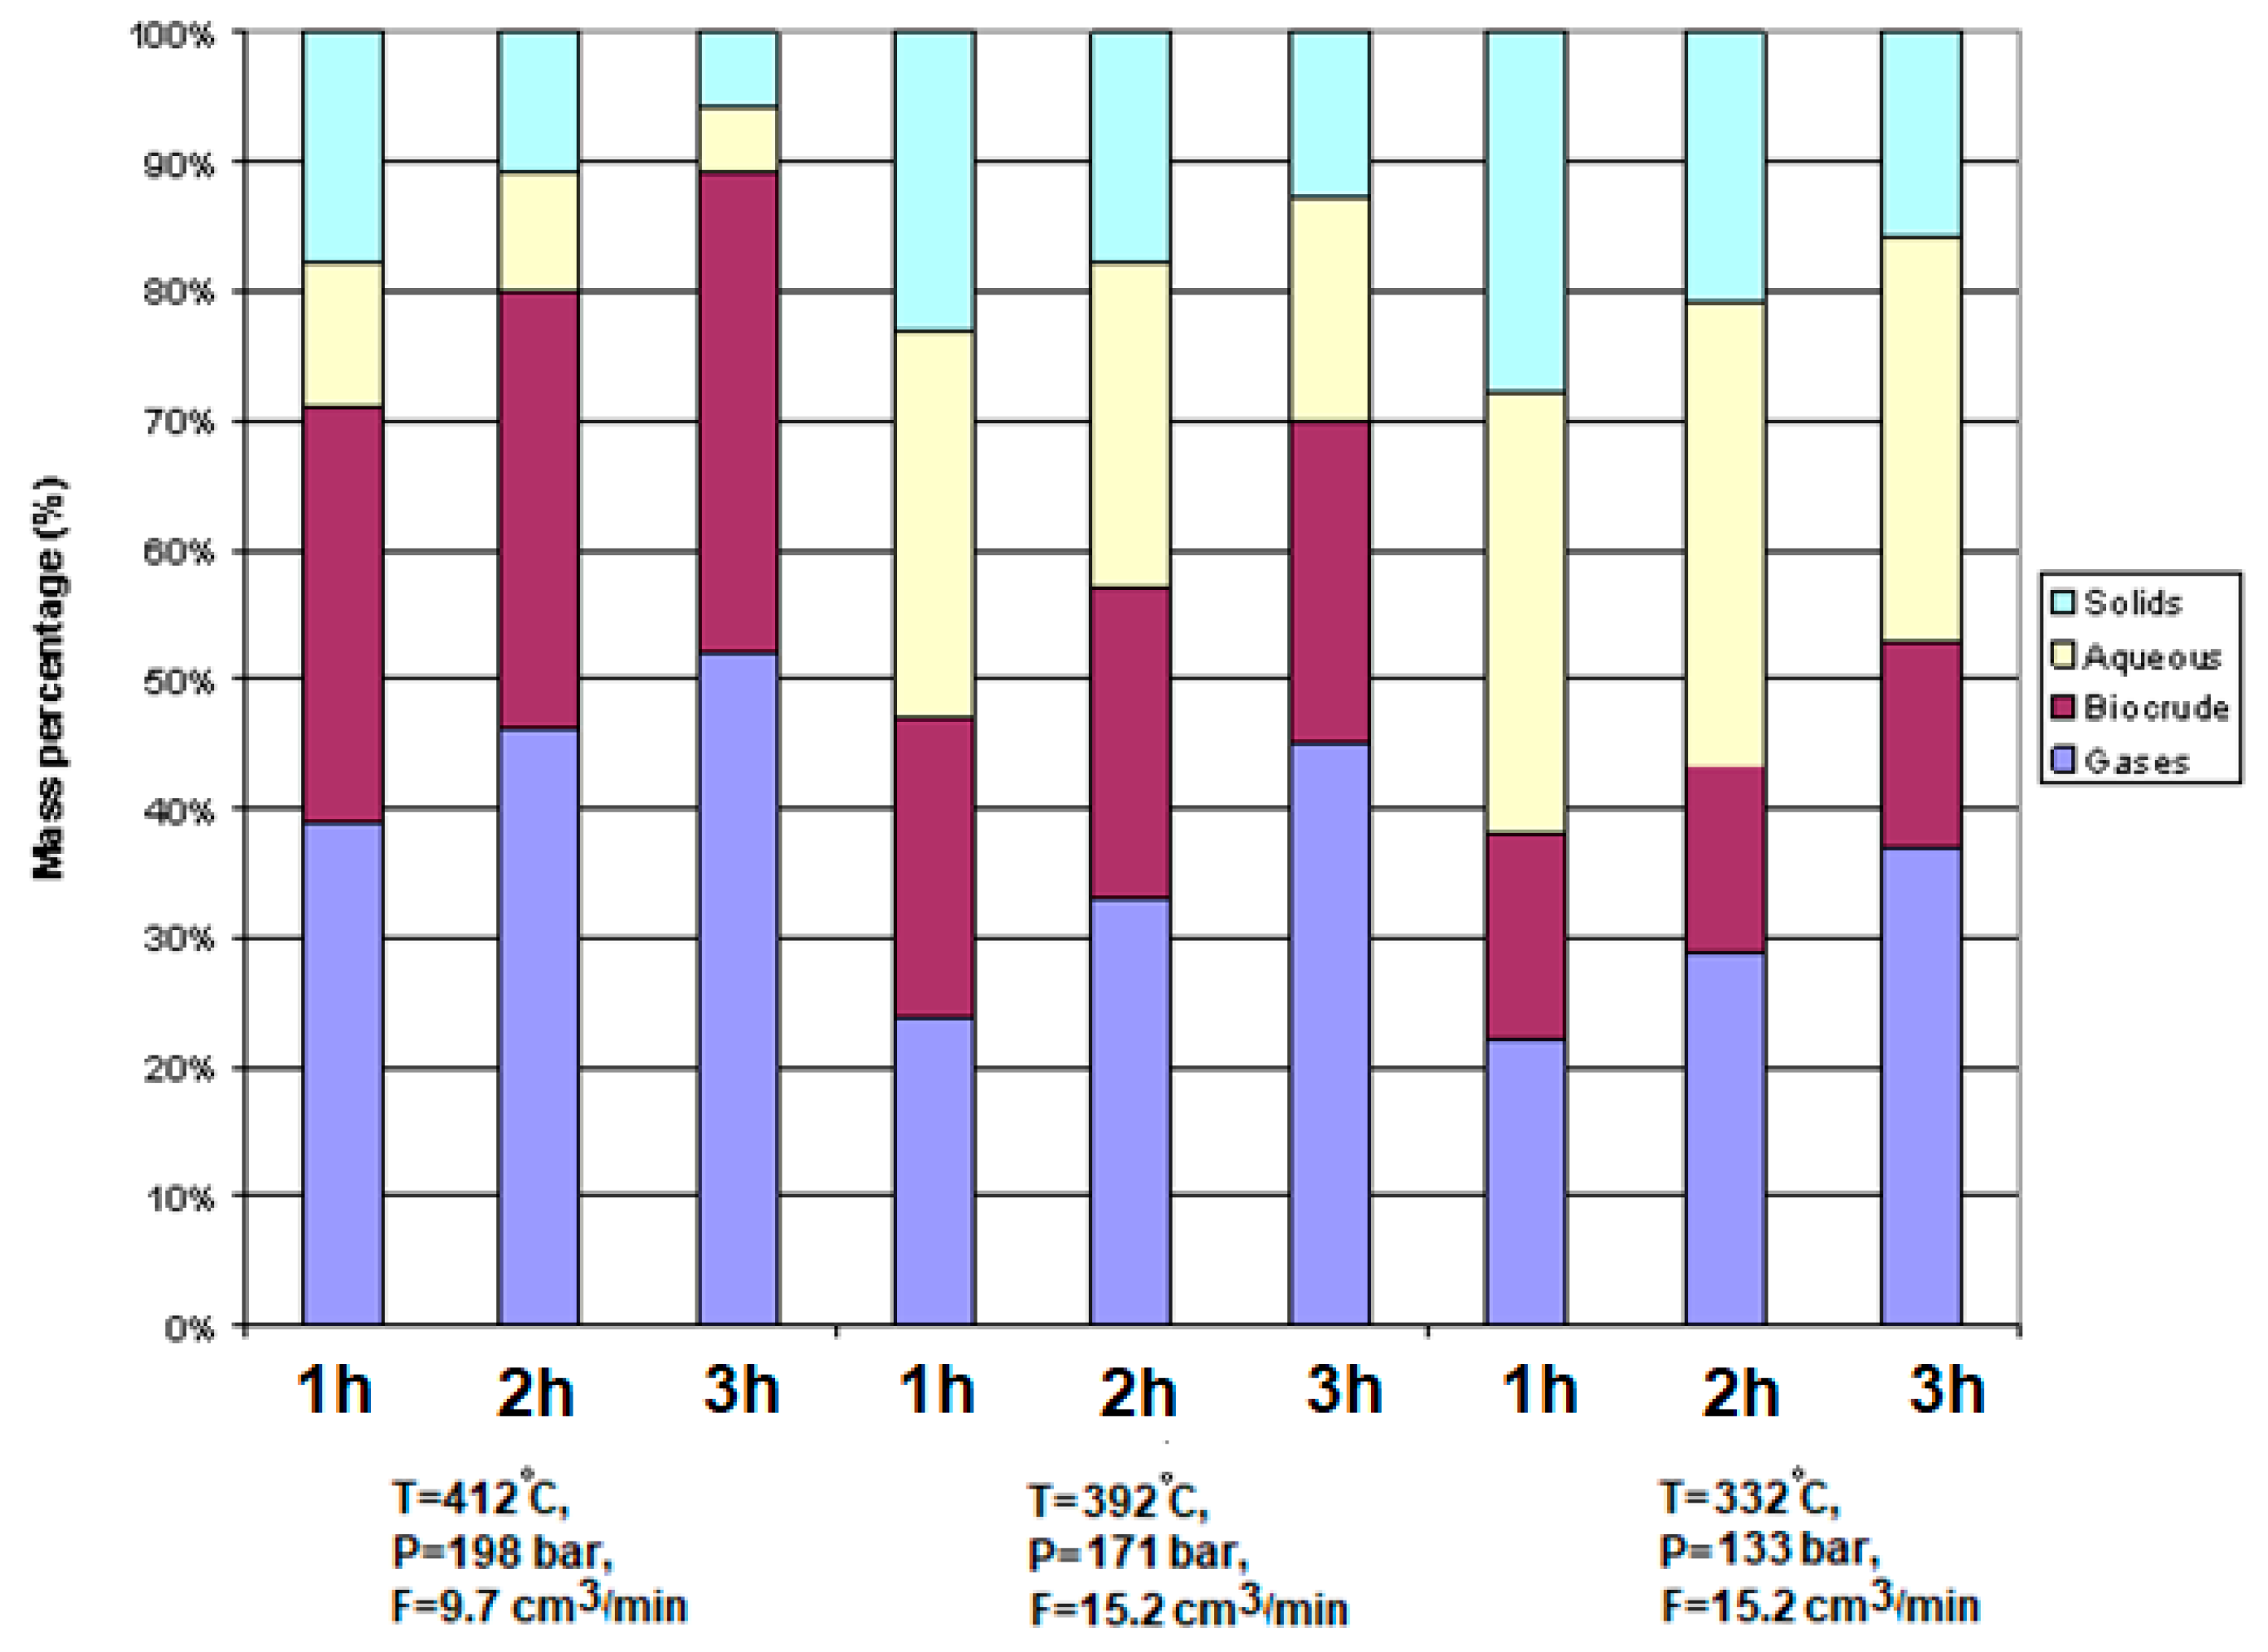
Figure 8 shows the mass percentage distribution of solids, aqueous phase, biocrude oil, and gases derived from the liquefaction process under different process conditions. The most biocrude oil was obtained at a temperature of 412 °C, pressure of 198 bar, and flow rate of 9.7 cm
3/min. When the flow rate was increased to 15.2 cm
3/min and the temperature and pressure were reduced by 21.5 °C and 27.8 bar, respectively, the amount of produced biocrude oil decreased by 12%. With a further reduction in temperature by 60 °C and pressure by 38 bar, the amount of produced biocrude oil decreased by 16%. An important indicator here is the amount of remaining solid phase, which is a measure of the amount of reacted feedstock. Exceeding a temperature of 420 °C in the process leads to the dominance of unfavorable recombination and polymerization reactions, which reduce the yield of the produced biocrude oil.
Figure 9 illustrates the effects of variation in slurry flow rate and convective heat transfer coefficient in the axial direction on the Reynolds number in tubular reactor. The slurry convective heat transfer coefficient showed an increase from 550 to 676 W/m
2K with an increasing suspension flow rate from 0 to 50 cm
3/min. A reduction in the HTL reaction temperature and residence time within the reactor constrained the extent of raw material conversion. Hence, maintaining an appropriate reaction temperature of the suspension is imperative in the HTL process.
Figure 9 also depicts the impact of slurry flow rate and Reynolds number in the axial direction on the convective heat transfer coefficient in the tubular reactor. As the flow rate increases, the Reynolds number also increases, leading to an augmentation in the convective heat transfer coefficient. However, temperature increases are restrained due to the heat flow rate. It is crucial to maintain a uniform temperature throughout the reactor to ensure process stability.
4. Conclusions
The CFD multiphase model integrated with an HTL kinetic mechanism to simulate heat transfer and optimization process conditions of sewage sludge conversion to maximized biocrude oil production for various operating parameters was investigated. This study demonstrated the following.
The highest yield of biocrude oil per reactor volume was obtained at 412 °C (685 K) and 198 bar pressure with a sludge flow rate of F = 32 cm3/min.
The efficiency of the HTL process is influenced by reaction time, temperature, pressure, and biochemical composition of the feedstock. Stable process operation with appropriate technological parameters is critical for successful implementation of the HTL process for efficient biomass conversion into valuable products, such as biofuels, oils, and other chemicals. Biocrude oil yield is highly dependent on feedstock composition and technological parameters in a tubular reactor.
The proposed CFD multiphysics simulation model accurately predicts flow patterns and concentration profiles, optimizing flow patterns and operational parameters such as flow rate, temperature, feedstock composition, residence time, and pressure to maximize biocrude oil production. The use of higher water pressure (>180 MPa) promotes the dissolution of organic compounds and maintains water in a liquid state, which is crucial for a stable process. In the liquid phase, chemical reactions occur evenly, and by-products such as char are less likely to settle on the reactor walls.
Additionally, the liquid phase allows for stabilization of reaction parameters, because water in this state transfers heat to the biomass more efficiently, which improves process control. Maintaining pressure above the water saturation pressure prevents evaporation and heat loss, which significantly increases energy efficiency.
Extended residence time of the reactants in the system reduces soot deposition and the risk of line plugging, which improves process stability. The ability to operate at lower temperatures and pressures reduces the intensity of product degradation and allows for more precise reaction control. Although a longer reactor is associated with higher capital and maintenance costs, in the long term, it can lead to significant improvements in operational efficiency and reduced operating costs. With increased heat transfer efficiency and better reaction control, reactor length optimization is an important part of HTL system design.
Understanding the influence of process conditions and parameters allows for better management to achieve higher biocrude oil yields. These findings provide guidance for designing and operating continuous HTL systems with suspended solid content, which should be strictly adapted to the quality of the used raw material.
Furthermore, modeling studies will be carried out to conduct HTL processes for various biomass feedstocks (such as food waste, pinewood, algae, and brewer’s grain) to compare the influence of the individual composition of raw materials on the yield of produced biocrude oil to compare and optimize reactor thermal energies and enhance economic feasibility, process scalability, and environmental impact using techno-economic analysis. Additionally, integrating computational fluid dynamics (CFD) with advanced kinetic models could provide more precise predictions of reaction dynamics, aiding in reactor design improvements. Finally, comparative assessments of HTL with alternative waste valorization techniques, taking into account the diversity of biomass feedstock co-liquefaction with different biomass sources, are necessary to establish its long-term viability in large-scale applications.


