Article

Experimental and Simulation Study of Particle Deposition Characteristics and Pressure Drop Evolution in Pleated Filter Media

1
School of Light Industry and Engineering, South China University of Technology, Guangzhou 510641, China
2
State Key Laboratory of NBC Protection for Civilian, Beijing 100191, China
*
Authors to whom correspondence should be addressed.
Processes 2025, 13(4), 975; https://doi.org/10.3390/pr13040975
Submission received: 25 February 2025 / Revised: 18 March 2025 / Accepted: 20 March 2025 / Published: 25 March 2025
(This article belongs to the Section Separation Processes)

Abstract

:
Pleated filter media are widely used in particulate filtration, but the particle deposition and pressure drop during particle loading remain insufficiently explored. This study visualizes the particle deposition patterns in pleated filter media, along with the evolution of pressure drop and the effective filtration area (EFA) using simulations. The results indicate that, as the volume of deposited particles increases, the pressure drop of the pleated filter media initially grows linearly, but this rate of increase accelerates as particle deposition continues. The particle deposition characteristics are related to the pleat ratio. A smaller pleat ratio results in a smaller initial EFA, leading to a high initial resistance growth rate. Conversely, a larger pleat ratio leads to faster aggregation of particles, resulting in a faster rise in the resistance growth rate. The dust-holding capacity is optimal at a pleat ratio of 6.67. When the inlet flow rate or the particle size increases, it is more favorable to reduce the pleat ratio. The reliability of the results is verified using experiments, and the error is within 20%. The findings provide theoretical and practical insights for optimizing the design of pleated filter media for better performance in particulate filtration.

1. Introduction

The sources of particulate pollution in the atmosphere are diverse [1]. This kind of pollution presents a serious risk to human health [2,3,4,5,6,7,8] and causes considerable damage to industrial production [9,10]. Regulating air quality is of paramount importance in protecting public health and promoting the development of human society [11]. Fiber filtration technologies, owing to their high filtration efficiency, low manufacturing costs, and straightforward structure, have seen extensive adoption [12,13,14]. Among these, pleated filter media present distinct advantages, such as a space-efficient design, a larger filtration area, an extended service life, and superior performance compared to other filter types.
Key parameters of pleated filter media include filtration efficiency, pressure drop, and service lifetime [15]. All of these parameters are predominantly governed by two factors: the intrinsic properties of the filter media, including fiber characteristics [16,17] and filter structure [18,19,20], and the structural attributes of the pleated filter media, including pleat height (PH), pleat width (PW), pleat angle (θ), and pleat ratio (α, the ratio of pleat height to pleat width) [21,22,23,24,25,26,27,28,29,30], as shown in Figure 1. Théron et al. [31] conducted a study using a combination of experimental and numerical simulations to examine the impact of pleat height and pleat width on the pressure drop of pleated filter media under clean conditions. They concluded that the geometric configuration of the pleats alters the velocity distribution within the internal flow field, and there exists an optimal pleat geometry that can minimize the pressure drop. These findings align with those of S. Fotovati et al. [32]. Zhiyong Shu et al. [33] found that the resistance of pleated filter media initially decreased and then increased as the pleat angle increased, indicating the existence of an optimal pleat angle. Furthermore, the pleat angle also affected the morphology of particle deposition. Ye-Lin Kim et al. [34] conducted research based on an electret filter material to examine the impact of pleat height and pleat ratio on the performance of pleated filter media. They found that both factors influenced the pressure drop and filtration efficiency. According to the filter quality factor evaluation criterion, the optimal pleated geometry was observed when the value of α was between 6 and 8.
In addition to the studies that focus on examining the impact of pleat structure on pressure drop under clean conditions, the performance of pleated filter media in practical filtration scenarios varies with the accumulation of particles. Therefore, investigating the influence of pleat structure on the filtration performance during particle deposition is also of great significance. S. Fotovati et al. [32] found that the pressure drop growth rate of pleated filter media decreased as the pleat width increased. However, a higher pleat rate resulted in higher flow velocities within the pleat channels, leading to increased uneven deposition of dust at the pleat locations. Saleh et al. [35] investigated the effect of particle size on the dust-holding performance of pleated filter media during particle loading. Their comparison of polydisperse and monodisperse aerosols showed that particle size distribution had a significant effect on particle deposition morphology, but the study lacked an exploration of the formation of a deeper particle cake within the pleated filter media by larger particles. Shihang Li et al. [36], when examining small-scale pleat structures (PH = 20 mm), observed that there is an inflection point in the pressure drop growth rate as the pleat ratio increases, with the best performance occurring at α between 1.15 and 1.59.
However, there is still a lack of systematic studies and comprehensive discussions regarding the dynamic development of particle deposition within pleated filter media. Also, the influence of pleat parameters and inlet air velocity on this process has not been adequately explored. This study conducts a simulation-based investigation of the pleated filter media structure. It provides a thorough analysis of the particle deposition characteristics and the patterns of pressure drop growth within the pleated filter media. Moreover, this research delves into how the pleat ratio, inlet air velocity, and particle size affect the particle accumulation characteristics, the growth of pressure drop, and the effective filtration area (EFA). Experiments are conducted to verify the simulation results. The objective of this research is to provide robust solid theoretical support and practical guidance for the optimization of pleated filter media design and its efficient application.

2. Experiment and Numerical Simulation

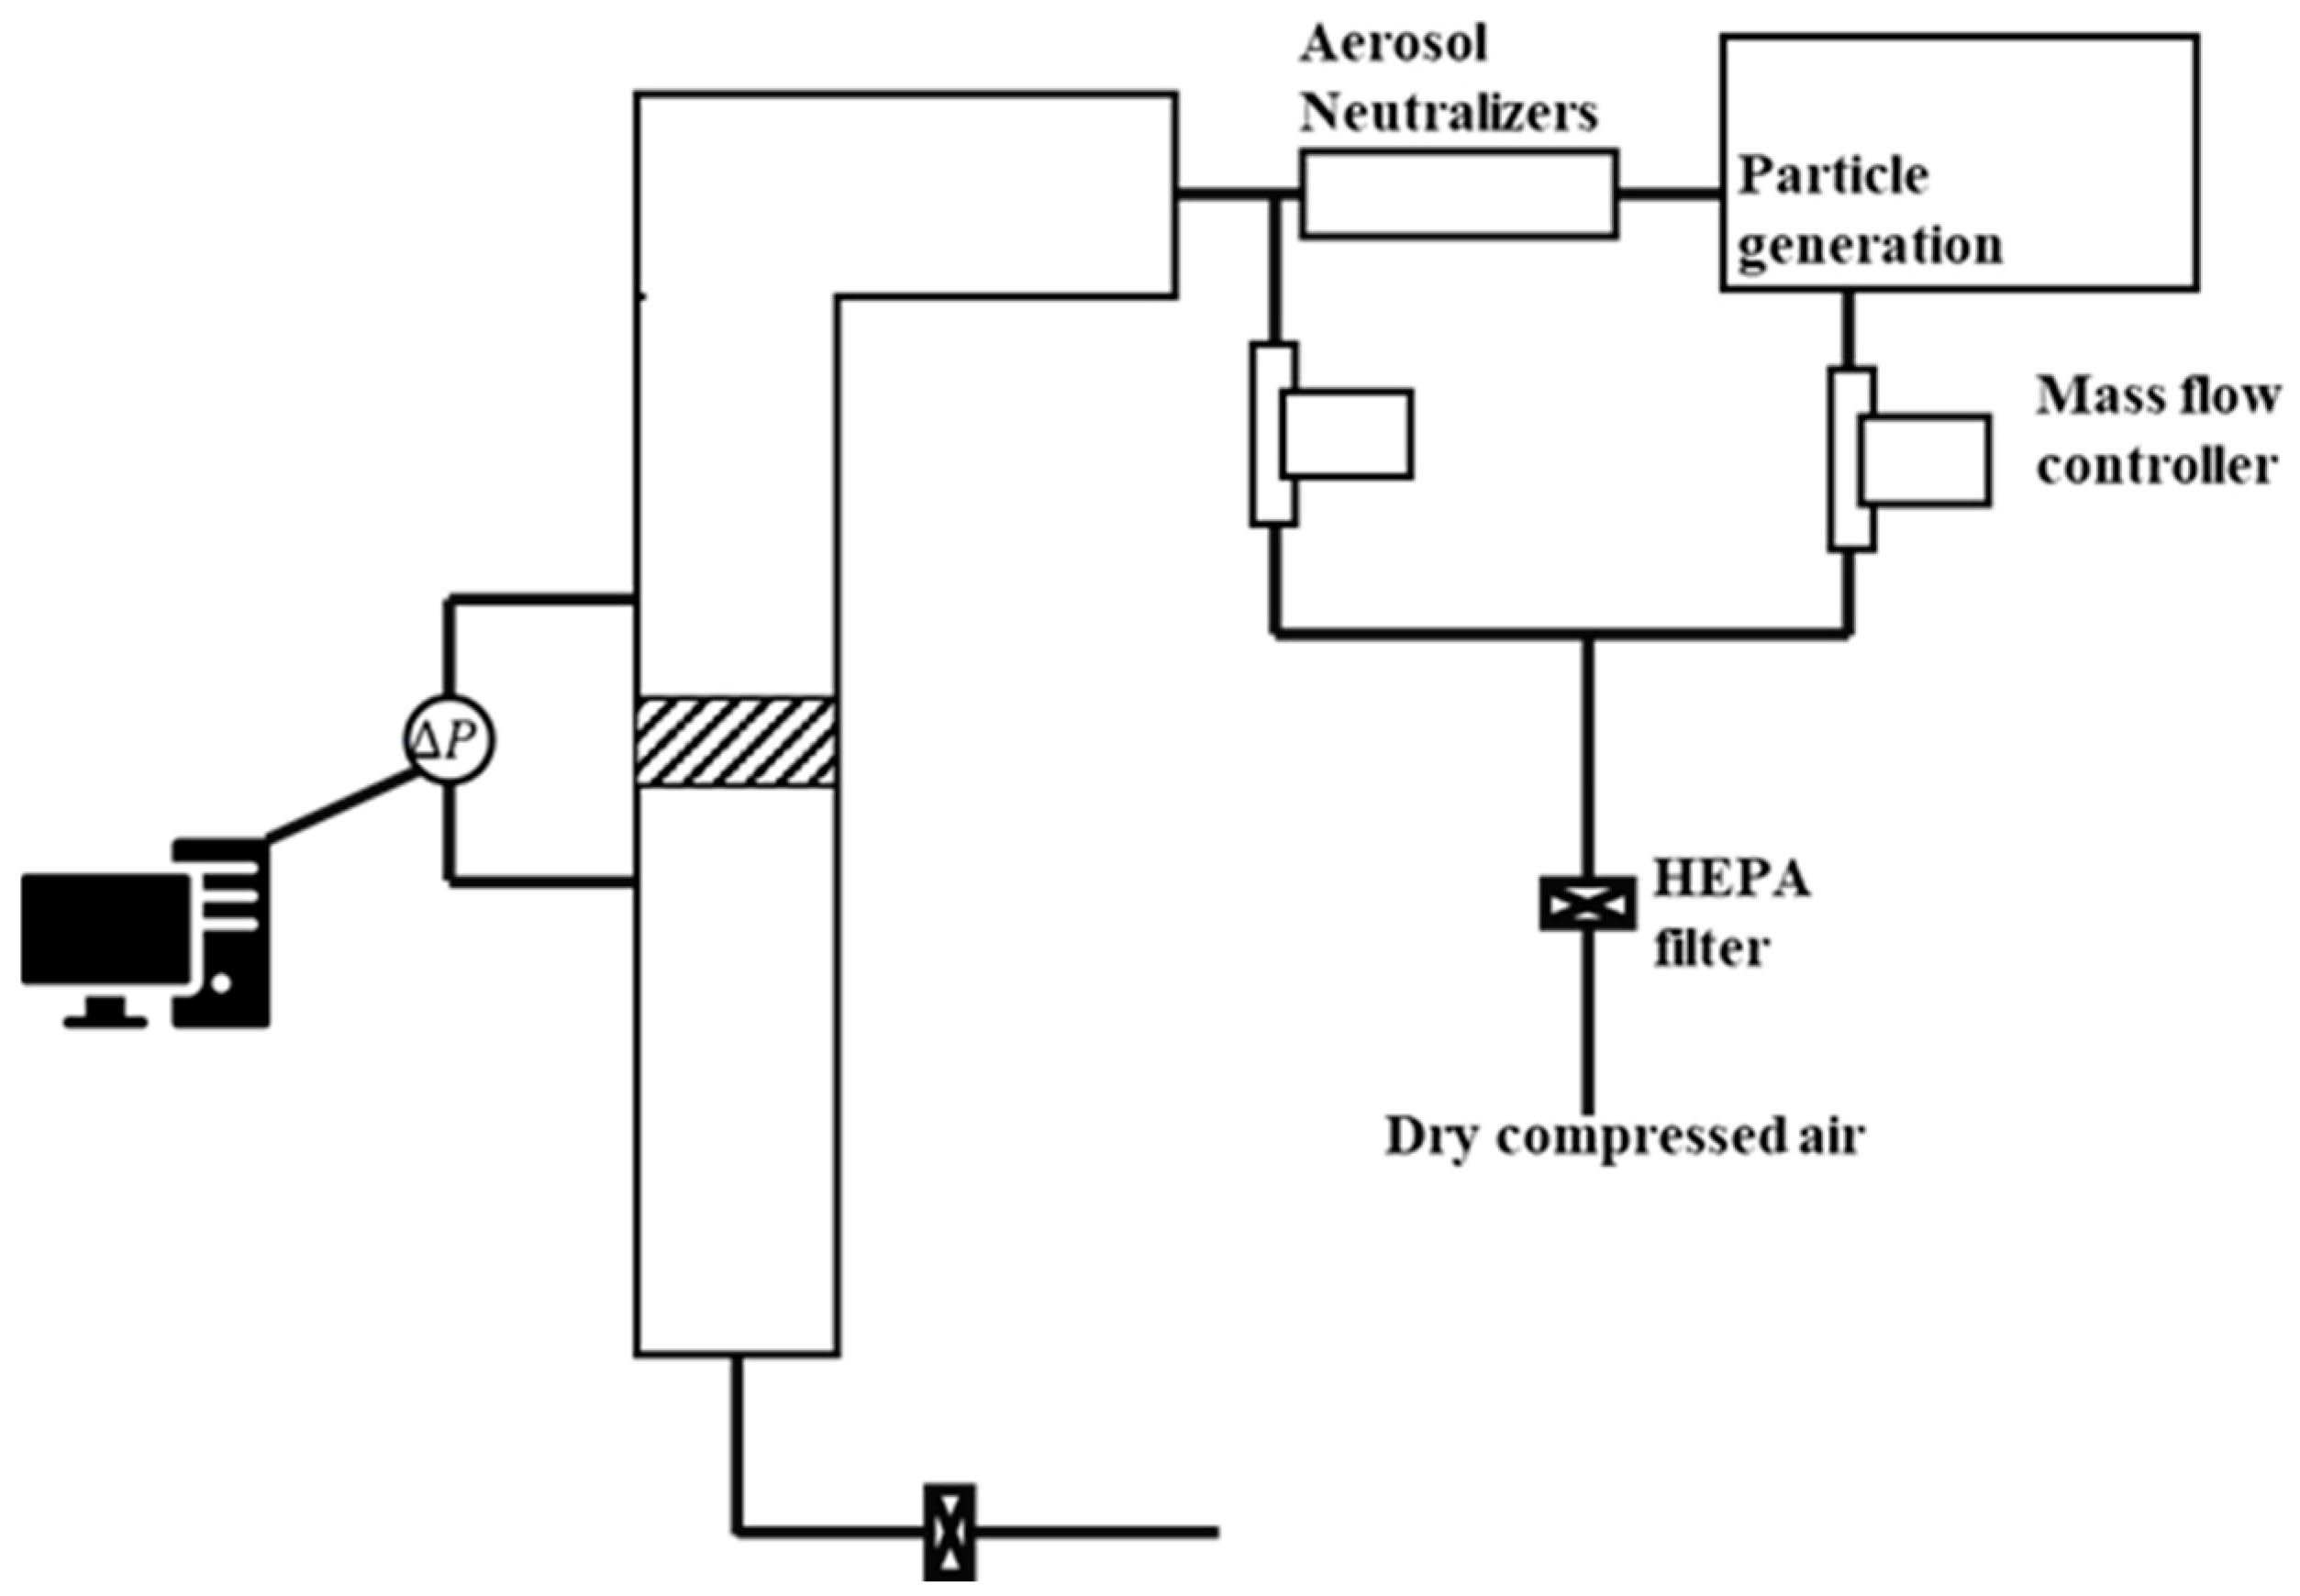
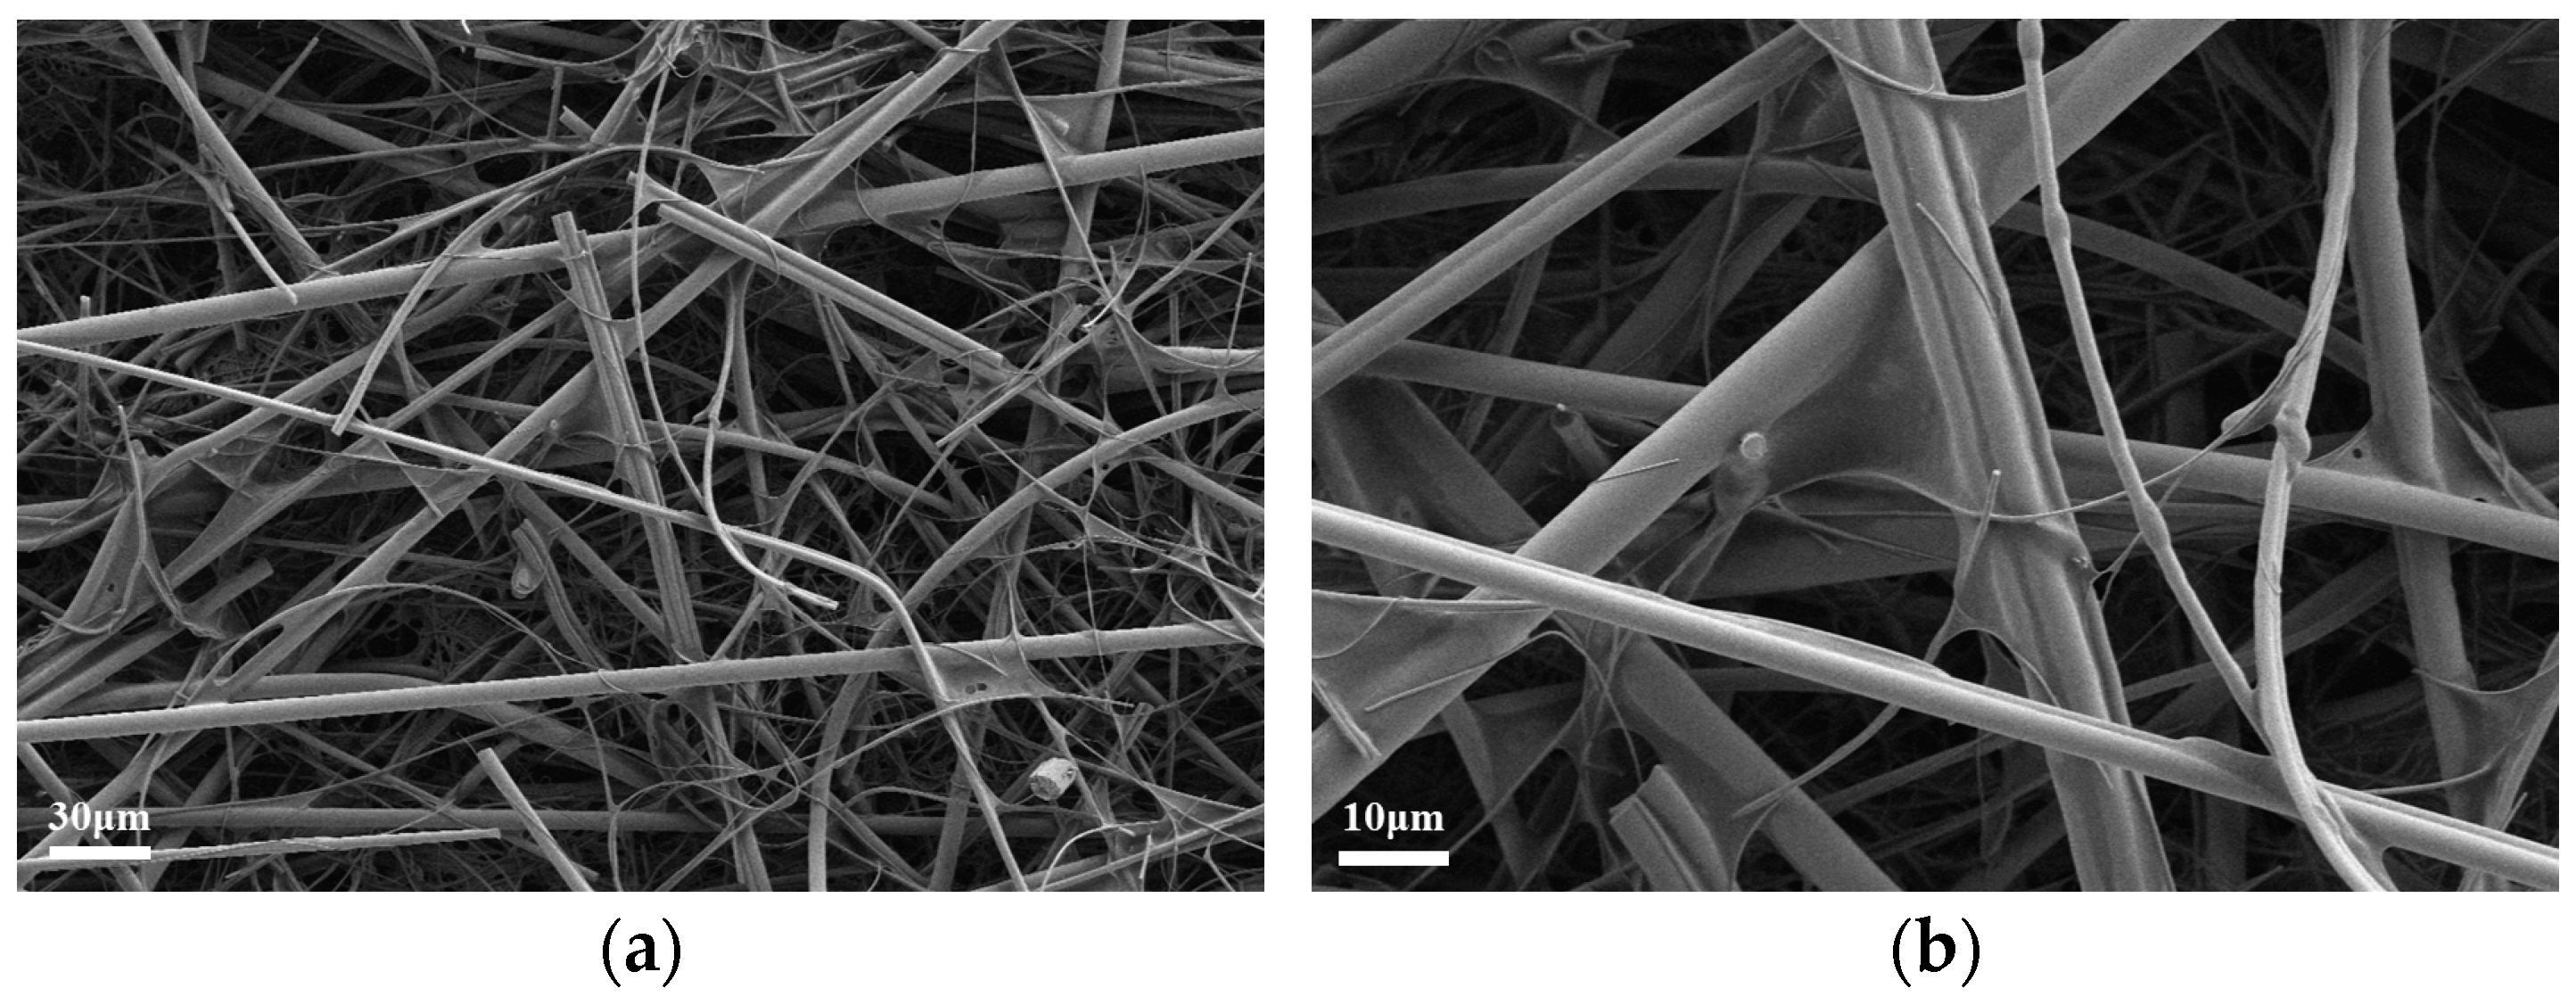
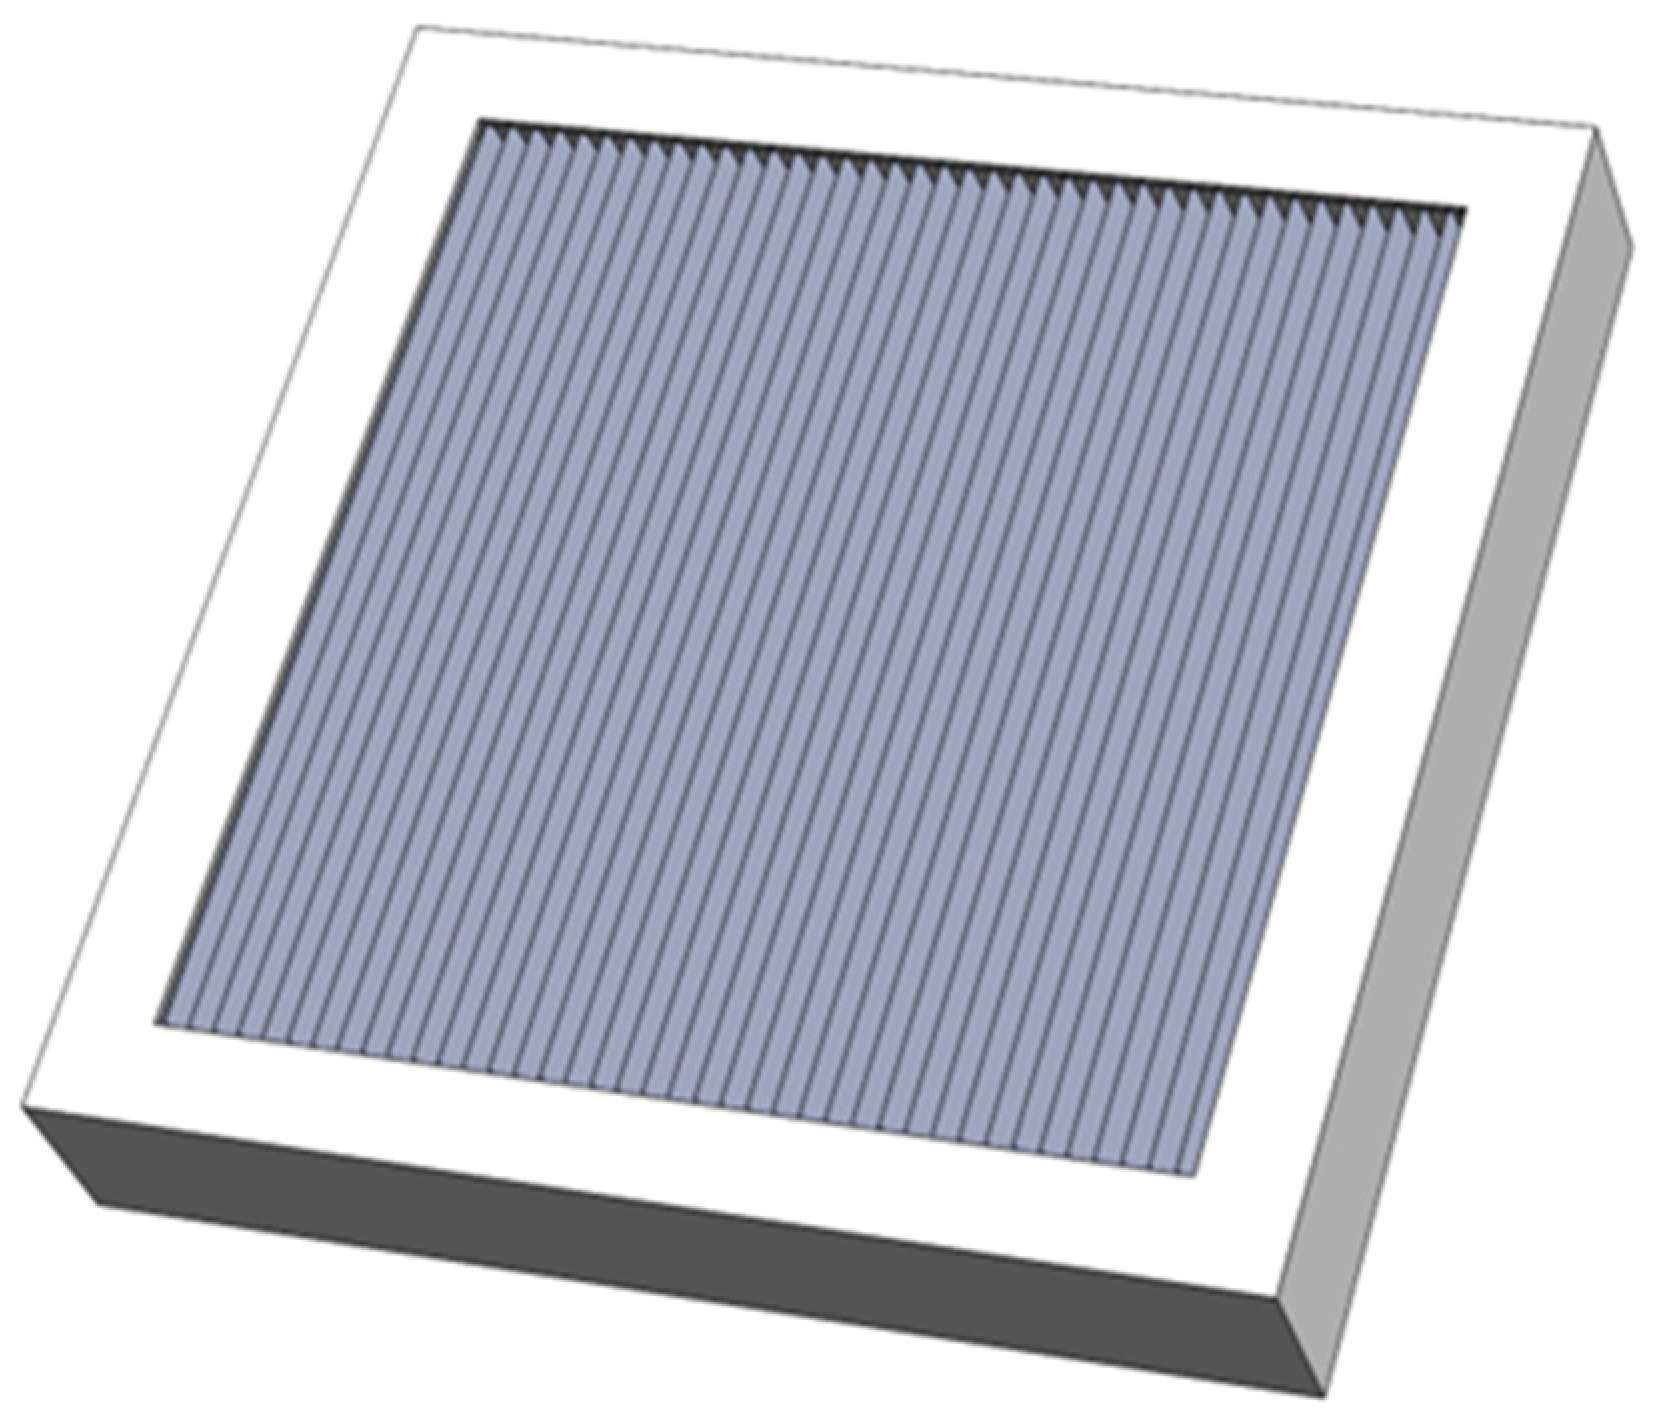
2.1. Experimental System and Preparation of Pleated Filter Element

The dust-loading performance testing system (Figure 2) consists of three components: the dust generation system, the sample testing system, and the detection system. Initially, the high-pressure air from the air compressor is regulated into a constant low-pressure airflow using a pressure-regulating valve. The airflow then passes through a drying tube and a high-efficiency filter, producing clean, dry compressed air, which is subsequently divided into two distinct airflow streams. One of the airflows is subsequently adjusted using a mass flow controller before entering the dust generator. The dust is dispersed using the dust generator. After that, the particles are introduced into the electrostatic neutralizer (Model 1090, PALAS, Karlsruhe, Baden-Württemberg, Germany) corona chamber, where they attain a Boltzmann charge equilibrium distribution. This process eliminates the influence of electrostatic forces, after which the particles are directed into the mixing pipeline. Additionally, the other stream of clean, dry compressed air is regulated using a mass flow controller and introduced into the mixing pipeline to dilute the particulate matter within the pipeline, thereby maintaining a constant particulate concentration in the experimental system. In this study, ISO 12103-1 [37], A1 ultrafine test dust, A2 fine test dust, and A3 medium test dust (Pow-der Technology Inc., Arden Hills, MN, USA), are selected as the particulate for loading. The mass concentration of dust is consistently maintained at 1 g/m3. A pressure sensor (Model 166, Alpha Instruments, Acton, MA, USA) is employed to record the sample’s pressure drop, and the collected data are subsequently transmitted to a computer using a data acquisition card. The mass of the sample is measured using an electronic balance (MR104, Mettler Toledo, Zurich, Switzerland).
The filter media utilized in this study is fiberglass, which is characterized by an average pore diameter of 9.27 μm, a thickness of 0.36 mm, and a permeability of 1.8532 × 10⁻¹¹ m2. The structure of the filter material is shown in Figure 3 (Sigma 360, ZEISS, Oberkochen, Germany, accelerating voltage: 3.0 kV). A self-made pleated square filter element is employed, and its housing is constructed from stainless steel. The inlet dimensions measure 80 × 80 mm, and the structure of the pleated filter element is shown in Figure 4.

2.2. Numerical Simulation

The numerical simulations are conducted using three-dimensional digital structural modeling and simulation software, GeoDict (Version 2024, Math2Market). Specifically, the PleatGeo, FlowDict, and FilterDict modules within GeoDict are employed for model creation, flow field calculations, and particle loading, respectively.
The pleated filter media represent a complex macroscopic structure involving numerous structural parameters, with characteristic dimensions that are significantly larger than the pore structure within the filter media. Therefore, the filter medium is described as a porous medium, and the flow through the filter media is simulated with porous media (Darcy) flow [38] by giving the mesh a permeability that allows air to pass through the mesh with a corresponding resistance. The porous media model is illustrated in Figure 5a. The resistance obtained from the simulation is compared with the experimental test values. The n results of the porous media model fit well with the experimental test values, and the fitting results are shown in Figure 5b.
The dimensions of pleated filter media range from centimeters to millimeters, whereas particulate matter is in the micrometer scale. In numerical modeling, the dimensional scale is accurately defined by the resolution of the computational grid. In order to reduce the computational workload and control the number of grids, the computational grid size is larger than the particle size, and the computational grid does not fully resolve the particulate matter. Consequently, the “Unresolved” particle model is employed to simulate the particle deposition process. The resolution of modeled particles in the computational domain is shown in Figure 6. In this particle model, a voxel may describe pore space, solid material, or porous material. The Brinkman term is used to describe flow in an unresolved porous material [39].
The dust loading process is simulated in batches, with each batch considered as a static calculation to approximate the complex dynamic nature of dust loading. Each batch contains the following processes [40]:
  • Precise calculation of the flow field information.
  • Particle loading at the inlet, with particle trajectories computed based on the flow field.
  • Particles are captured and deposited according to their trajectories.
  • New flow field information is calculated based on the structure after particle deposition.
These steps are repeated, adding more deposited particles in each batch, until the simulation termination conditions are met [41].

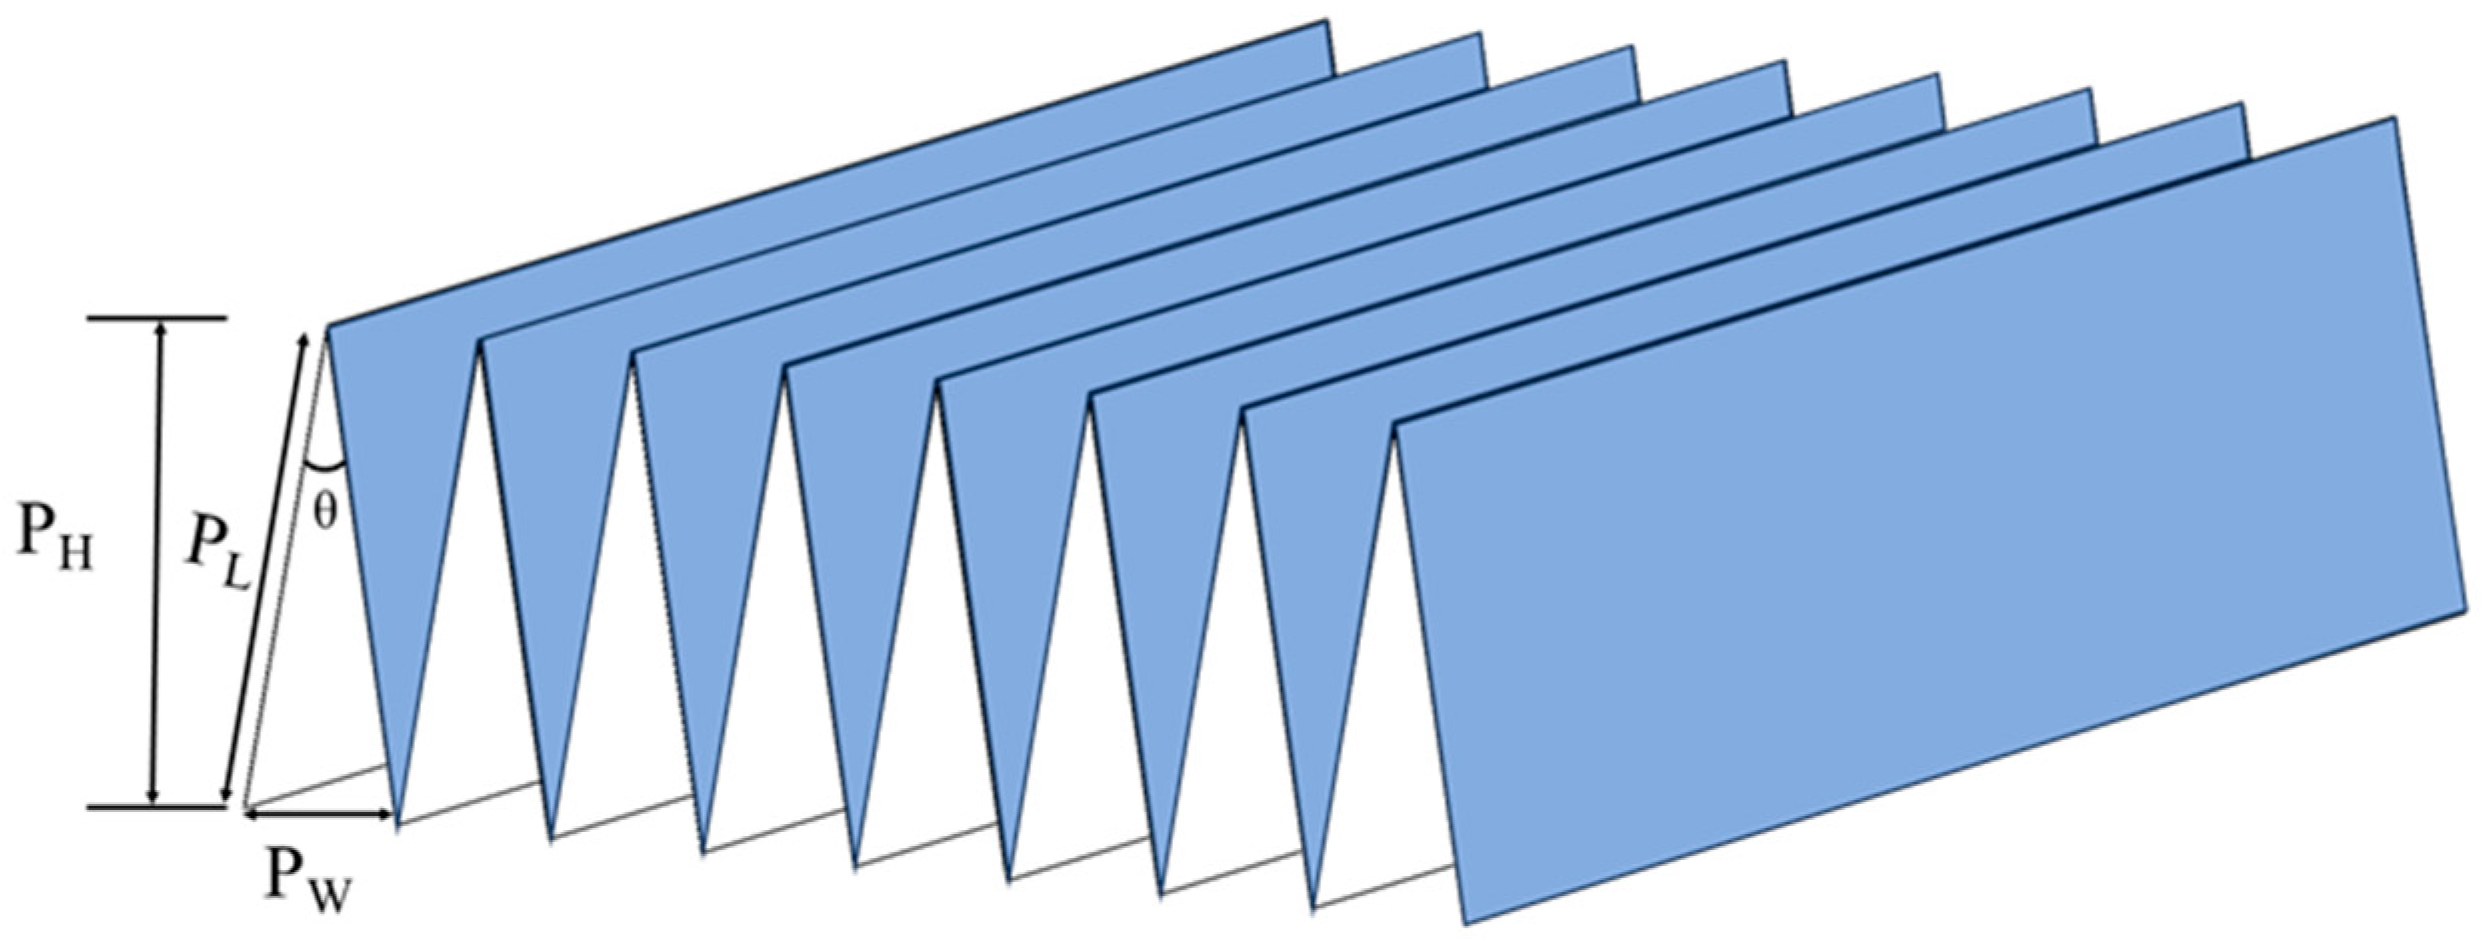
2.2.1. Geometric Parameters of Pleated Filter Media and Boundary Conditions

In this study, a three-dimensional model of pleated filter media is developed based on the PleatGeo module of GeoDict software. Considering that the pleated filter media represents a periodic array structure, comprehensive modeling of the entire filter element would entail substantial computational effort. Therefore, this study focuses on a single pleat structure for analysis.
This study focuses on investigating the effect of the pleat ratio on the particle deposition and pressure drop characteristics of pleated filter media. Therefore, the pleated filter media were established with a pleat height of 20 mm and pleat widths of 2, 3, 4, 6, 8 and 10 mm, corresponding to pleat ratios of 10.00, 6.77, 5.00, 3.34, 2.50 and 2.00, respectively. The specific geometric parameters of the models are presented in Table 1.
The boundary conditions in the flow direction of the computational domain are defined as velocity inlet and pressure outlet, with periodic boundary conditions applied to the remaining four surfaces (Figure 7). The LIR solver [42], which is integrated into GeoDict, is employed to solve the system of equations governing fluid flow. The residuals are used to determine the convergence of the numerical calculations, which are set to 0.01 here, i.e., when the residuals are less than 0.01, the calculations are converged. Voxel regions with thicknesses of 500 and 500 voxels are added to the inflow and outflow regions, respectively, to ensure stationary flow conditions at the boundaries and prevent computational instability caused by the abrupt closure of the flow channels at the inlet and outlet surfaces [43]. The voxel length was set to 10 μm. The fluid considered is air, with a density of 1.204 kg/m3 and a kinematic viscosity of 1.834 × 10⁻⁵ Pa·s.

2.2.2. Fluid Flow Calculation

This study utilizes the FlowDict module in GeoDict to simulate the internal flow field. The fluid is assumed to be viscous and incompressible and in a steady state. The governing equations for its flow, including the continuity equation based on the law of mass conservation and the differential form of the Navier–Stokes equation, are as follows [44]:
μ Δ u + ρ u u + p = f
u = 0
where ρ is the air density, kg/m3; u is the velocity of the airflow, m/s; μ is the dynamic viscosity, Pa·s; p is the pressure, Pa; and f represents the external force applied to the fluid, Pa.
In step 3, the deposited particles are added to the computational grid, forming an unresolved porous media. Subsequently, during the recalculation of the flow in step 4, it must be modeled using the Navier–Stokes–Brinkman equation as follows [39]:
μ Δ u + ρ u u + p + σ u = f
Here, σ represents the local flow resistivity, Pa·m/s, which depends on the volume of particles deposited within the voxel. The following linear relationship between σ and the local solidity f is chosen:
σ = f f m a x σ m a x 0 < f < f m a x σ m a x f m a x f 1   f = 1
Here, f m a x represents the maximum solidity that the particles within a voxel can achieve; σ m a x represents the maximum flow resistivity when the voxel is filled to its maximum solidity.
When the fluid flow is in a slow laminar state, i.e., under low Reynolds number conditions ( R e f = v d f ρ a μ 1 ), the Stokes–Brinkman equation simplifies to the Stokes equation as follows [45]:
μ Δ u + p = f
The Navier–Stokes–Brinkman equation simplifies the Stokes–Brinkman equation is as follows:
μ Δ u + p + σ u = f

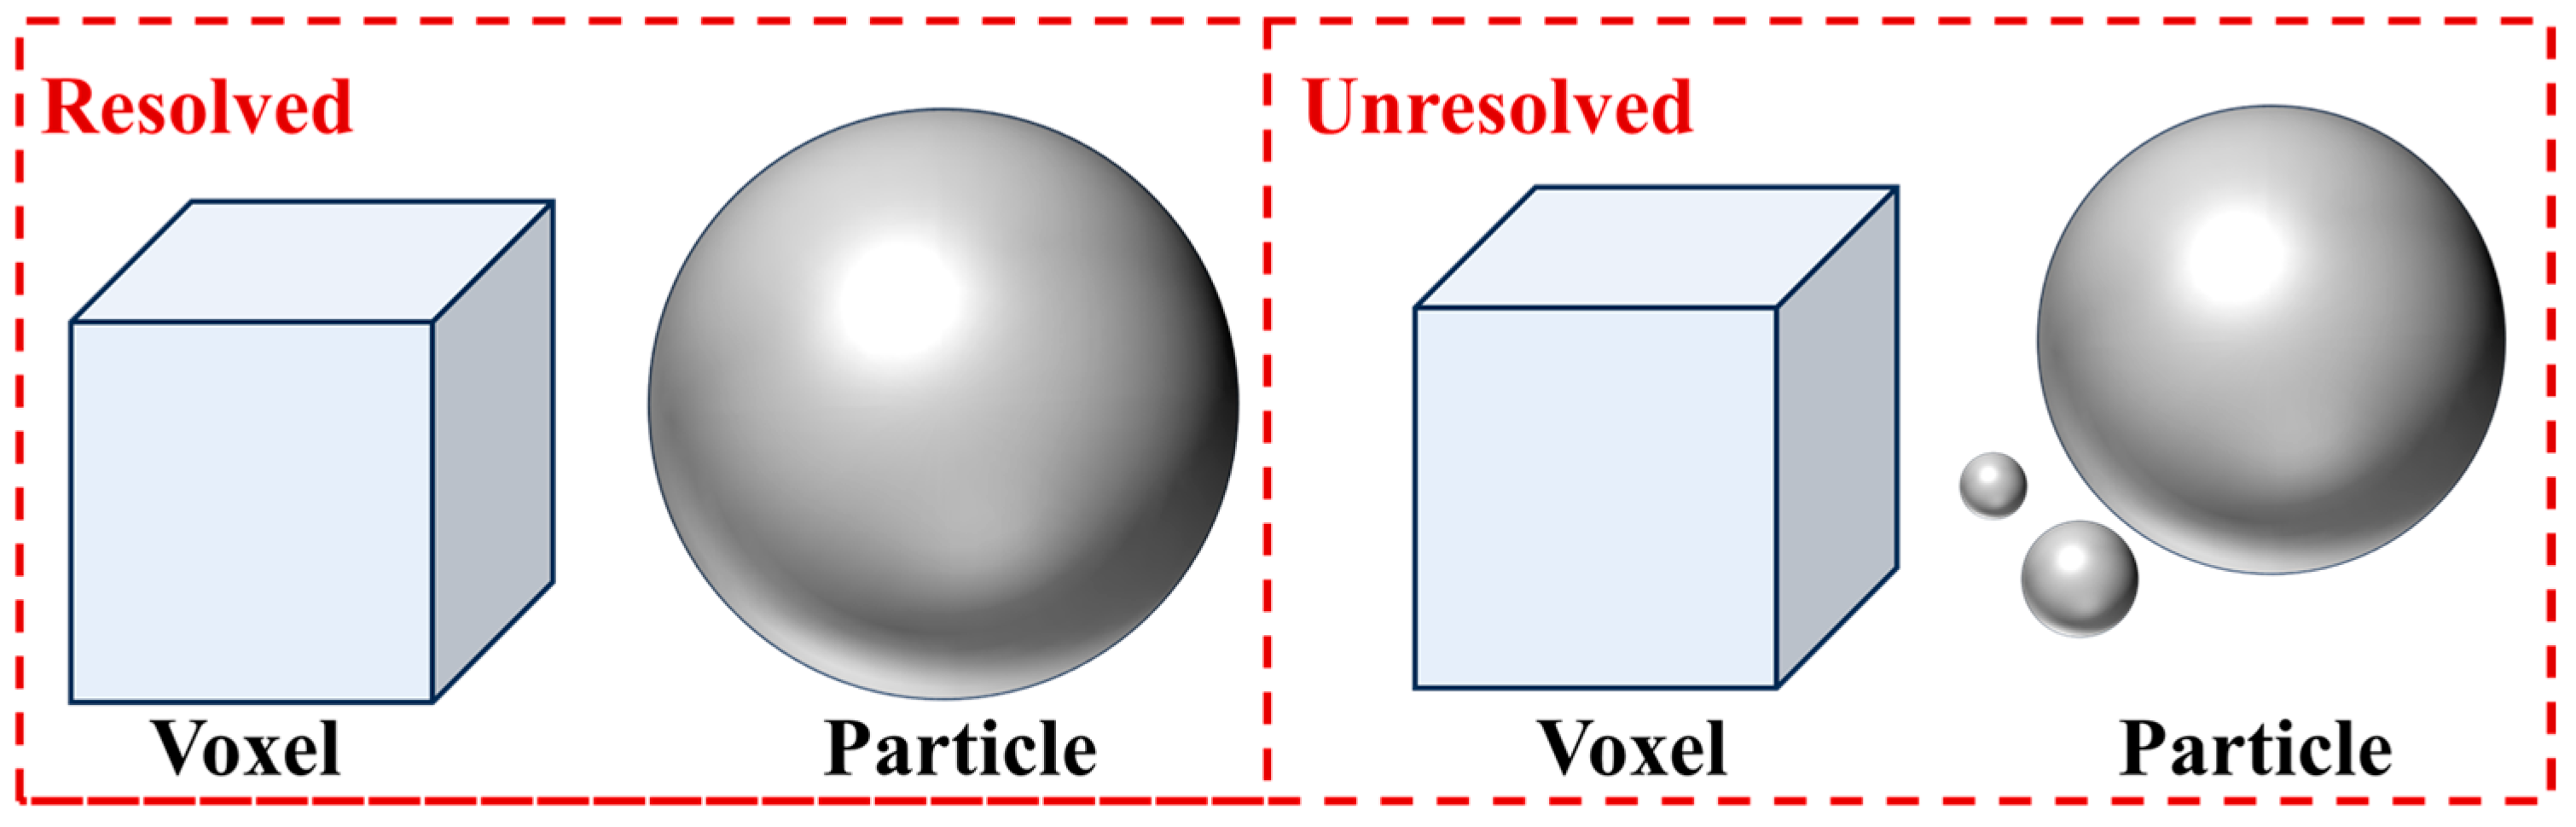
2.2.3. Particle Movement

In this study, the particle trajectories are determined using the FilterDict module in GeoDict, which also handles the collision model between particles and the filter media. It should be emphasized that the simulations in this study are based on the following assumptions: within a single batch, the particle concentration is sufficiently low such that the particles are treated as independent entities with no interactions between them; the number of captured particles in each batch is minimal, thus the impact of deposited particles on the internal flow field is neglected; the effects of previously deposited particles on the flow field are only considered when the next batch begins; and electrostatic forces acting on the particles are not considered.
Building upon the calculated flow field, the particle trajectories are determined by considering both the flow field and the forces acting on the particles. Consequently, the motion of the particles can be described using the following equation [46]:
m p d u p d t = 3 π μ d p C c u a u p + 2 k B T γ d W t d t
d x p d t = u p
where m p is the particle mass, kg; u a is the air velocity, m/s, u p is the particle velocity, m/s; d p is the particle diameter, m; k B is the Boltzmann constant, J/K; T is the temperature (K), γ is the friction factor; d W is the Wiener measure, which is used to describe Brownian motion; and x p is the displacement of the particle, m.
C c is the Cunnigham correction factor, which is used to model the reduction of friction for very small particles [47]. This correction factor is defined as follows:
C c = 1 + λ d p 2.34 + 1.05 e 0.39 d p λ
where C c represents the mean free path of air molecules, which is equal to 66 nm.
The interactions between particles and the filter media, as well as between particles themselves, are described using a collision model. In this study, the Hamaker model is employed to characterize these interactions, considering both the adhesive effects after contact and elastic collisions, which may lead to sliding or detachment. Upon collision, particles experience energy loss until their energy is sufficiently reduced for capture. The energy loss resulting from the collision is determined by the collision loss coefficient, defined as the ratio of the rebound velocity to the incident velocity, as shown in Equation (10). When the kinetic energy of a particle is less than the adhesive force either between the particle and the fiber or among particles, the particle will be trapped [48], as shown in Equation (11).
I = v 2 v 1
u p 2 < H π ρ p a 0 d p 2

3. Results and Discussion

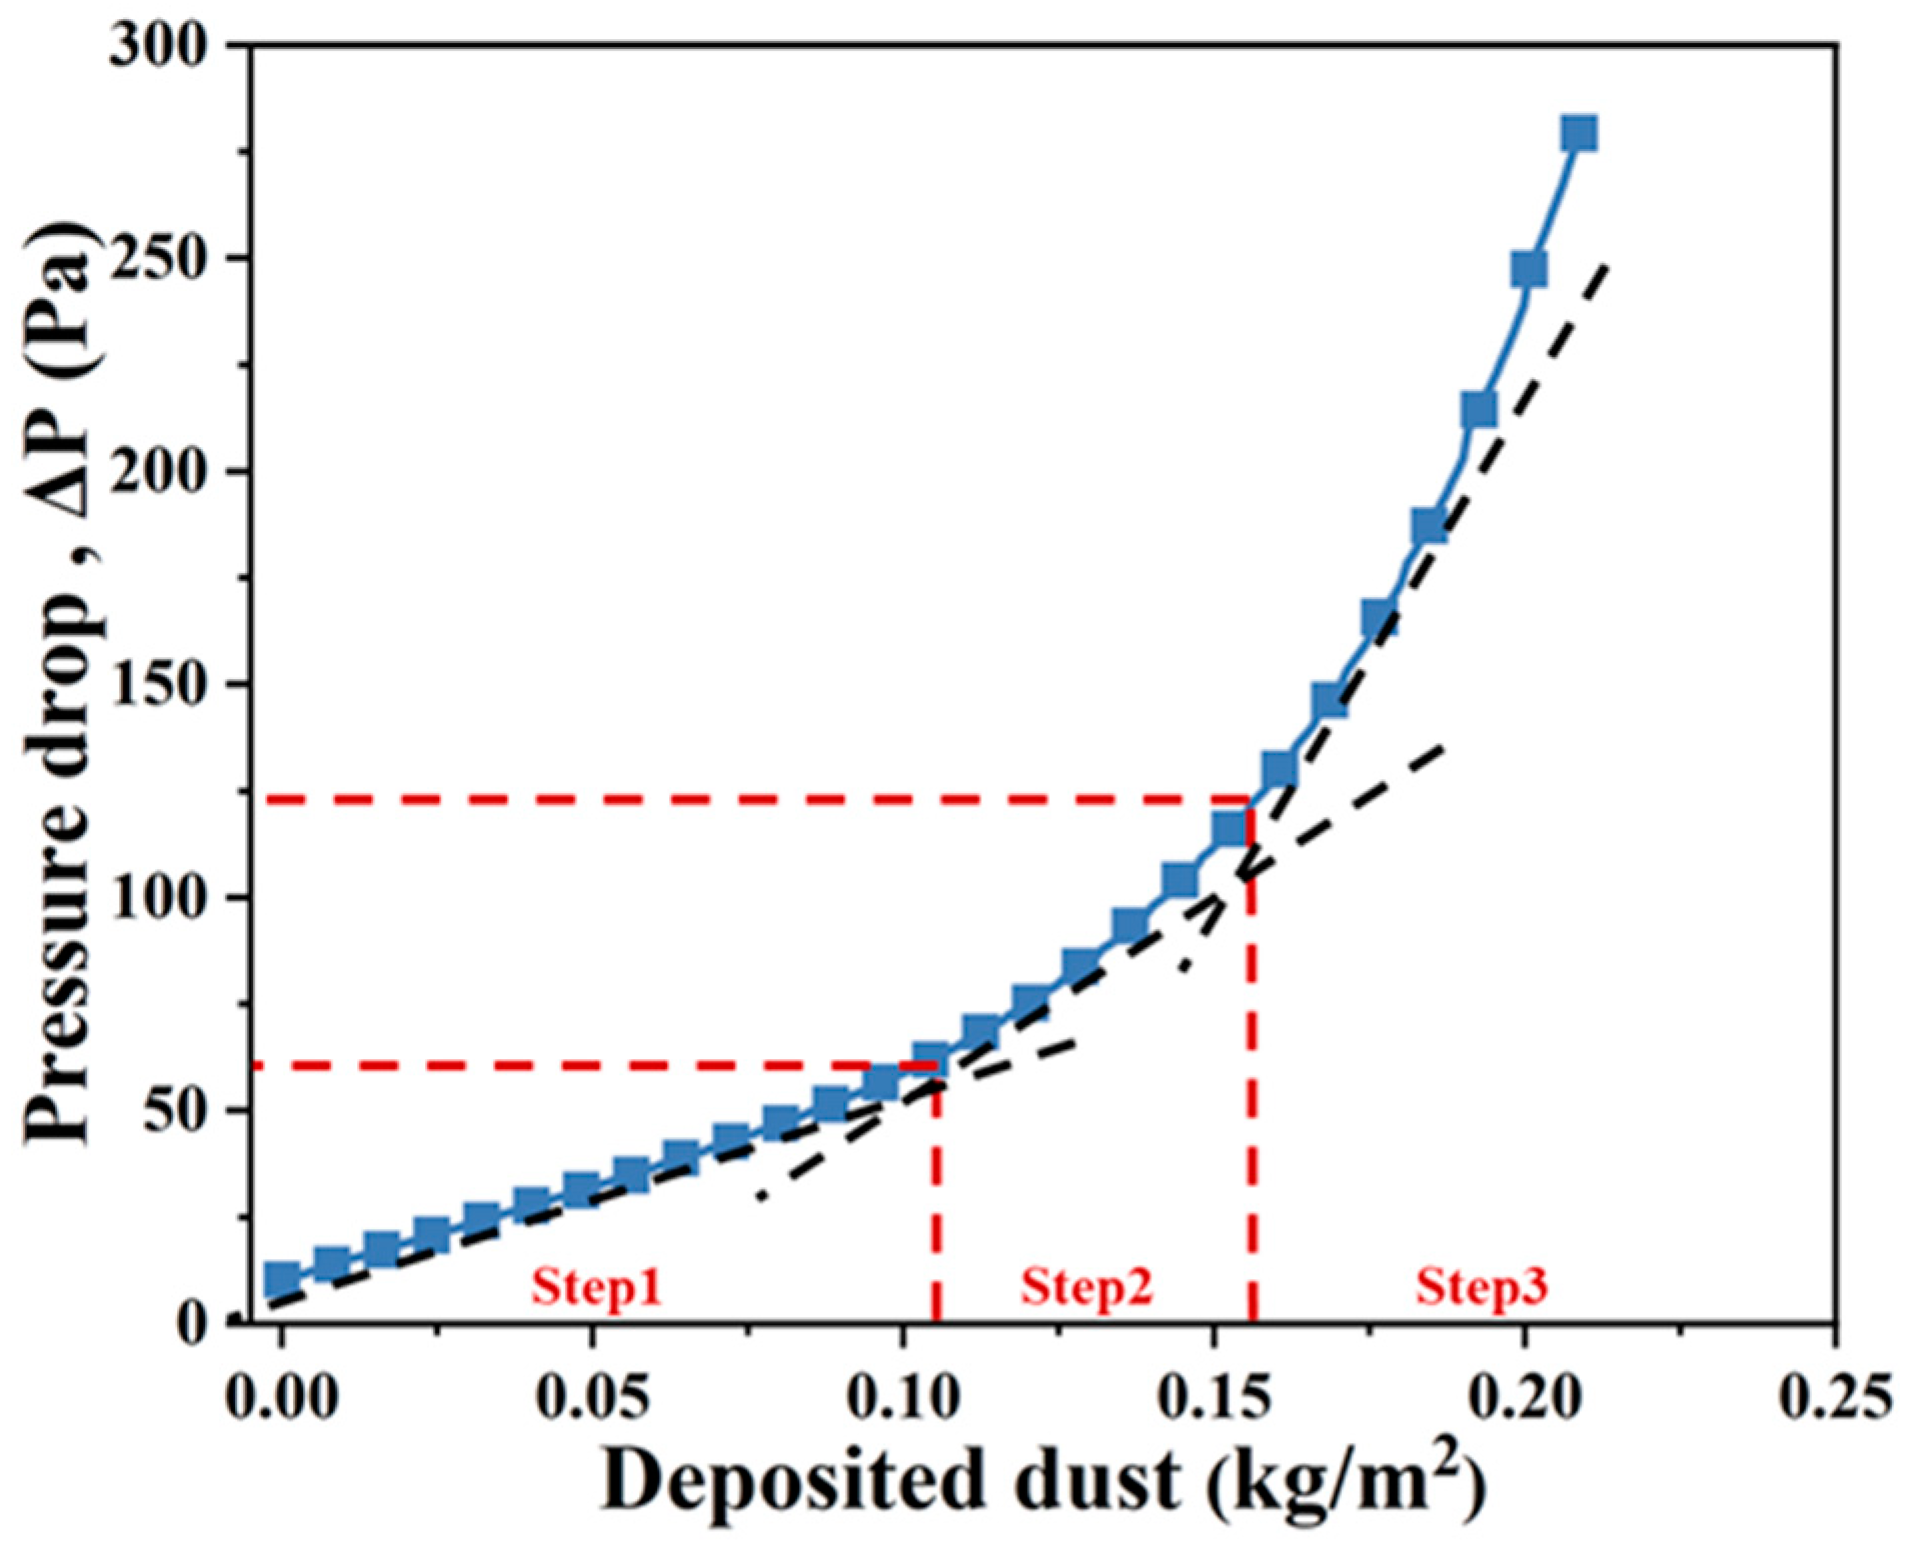
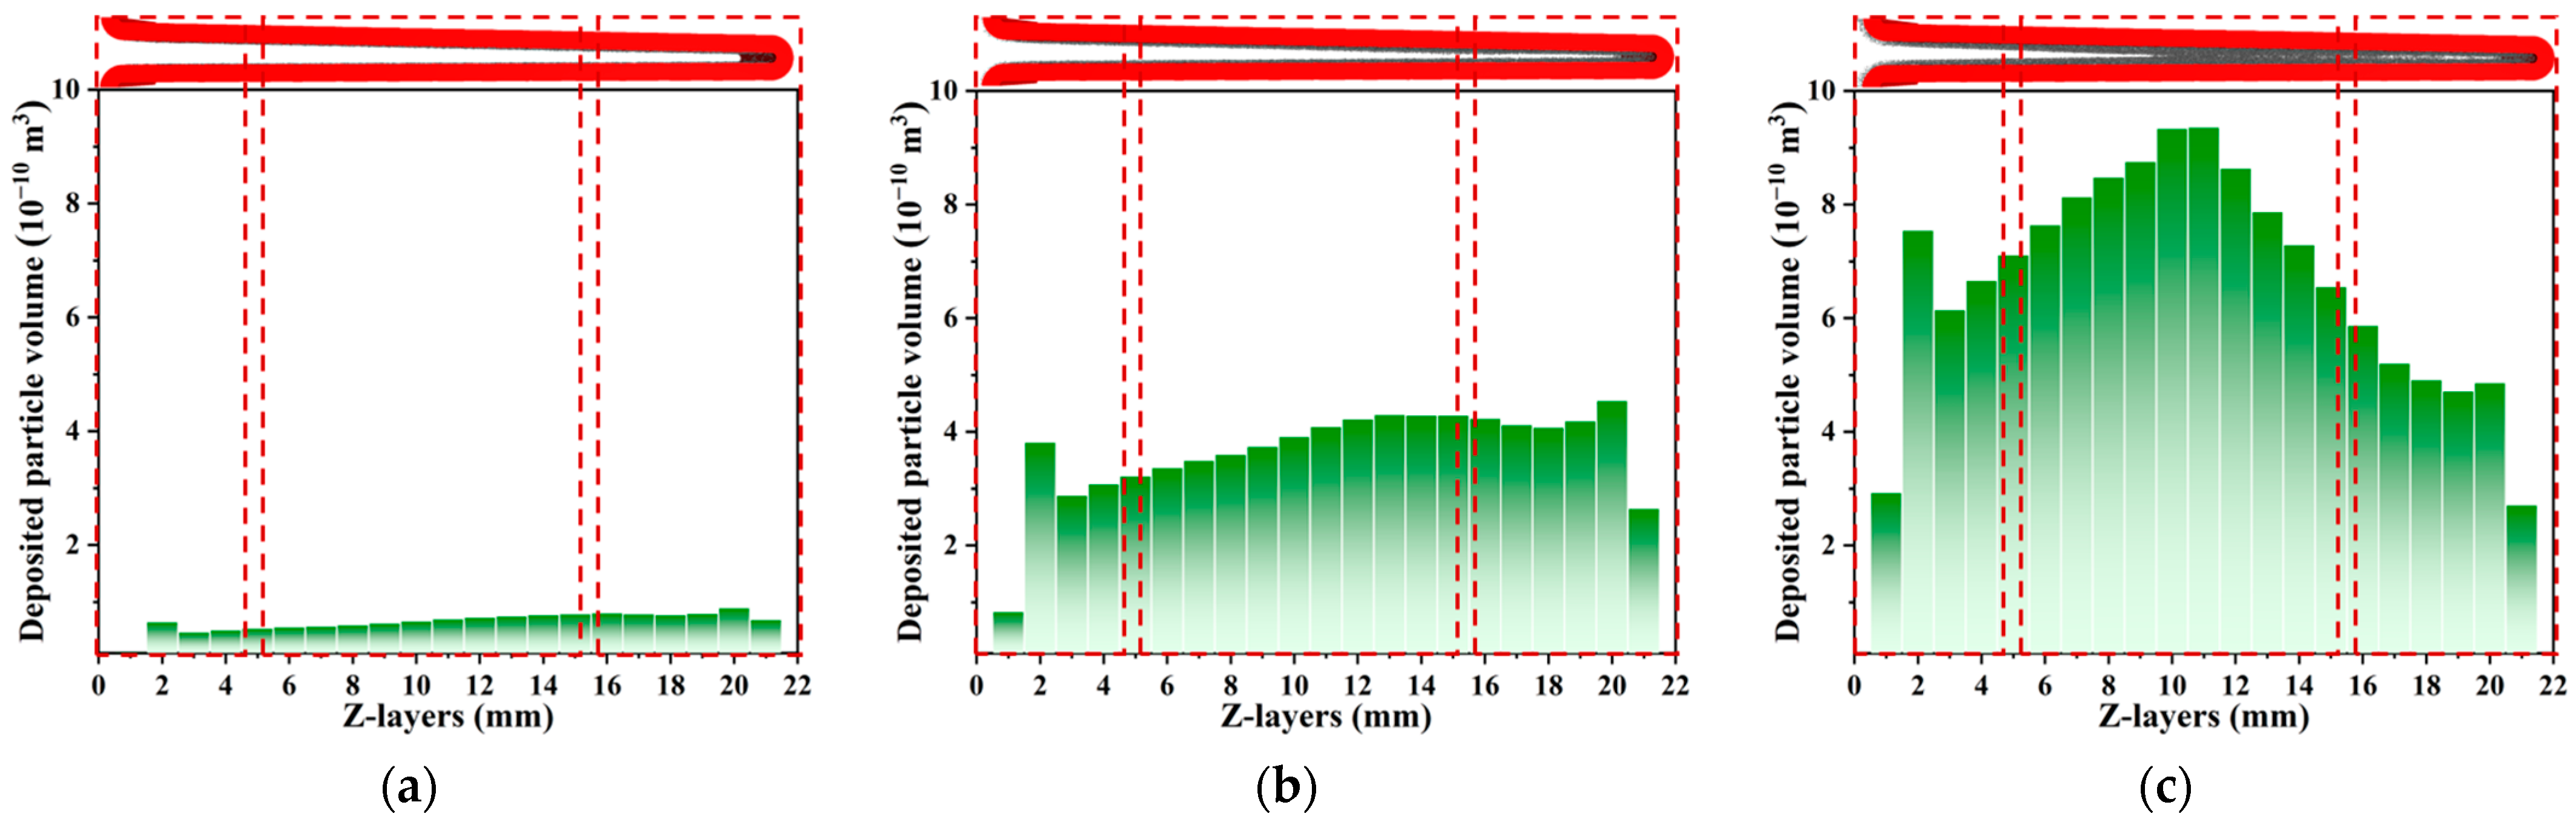
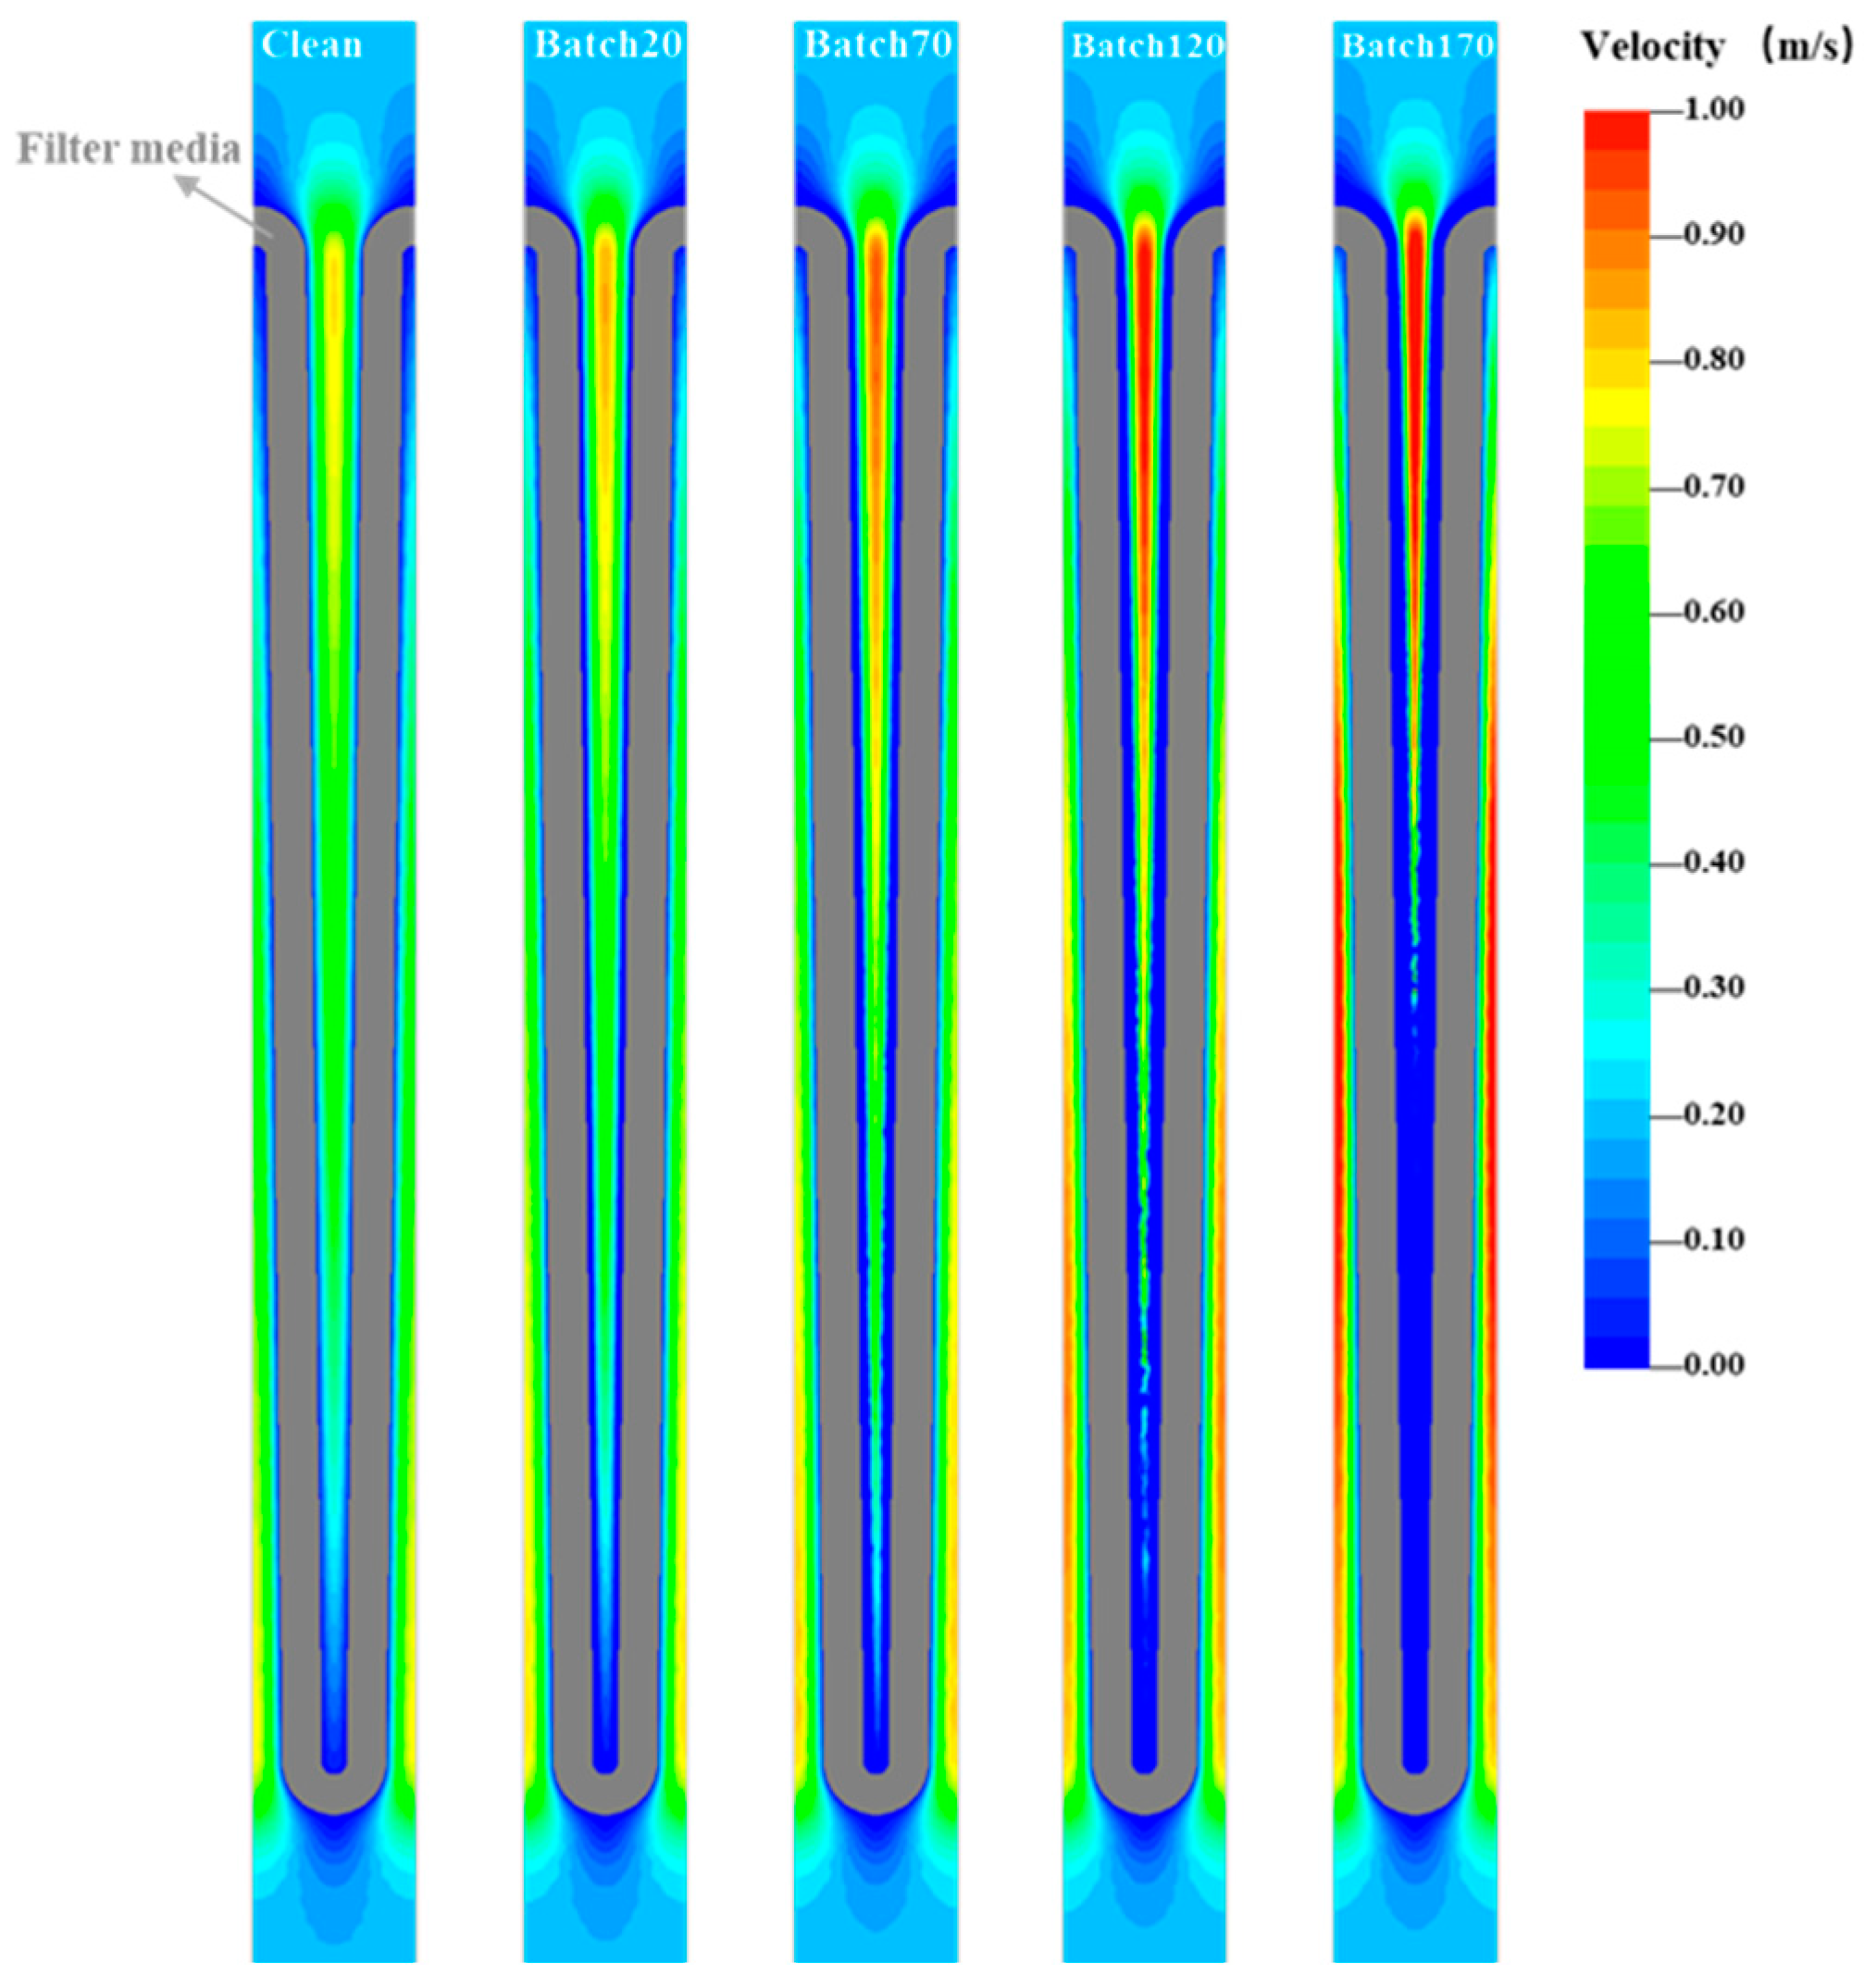
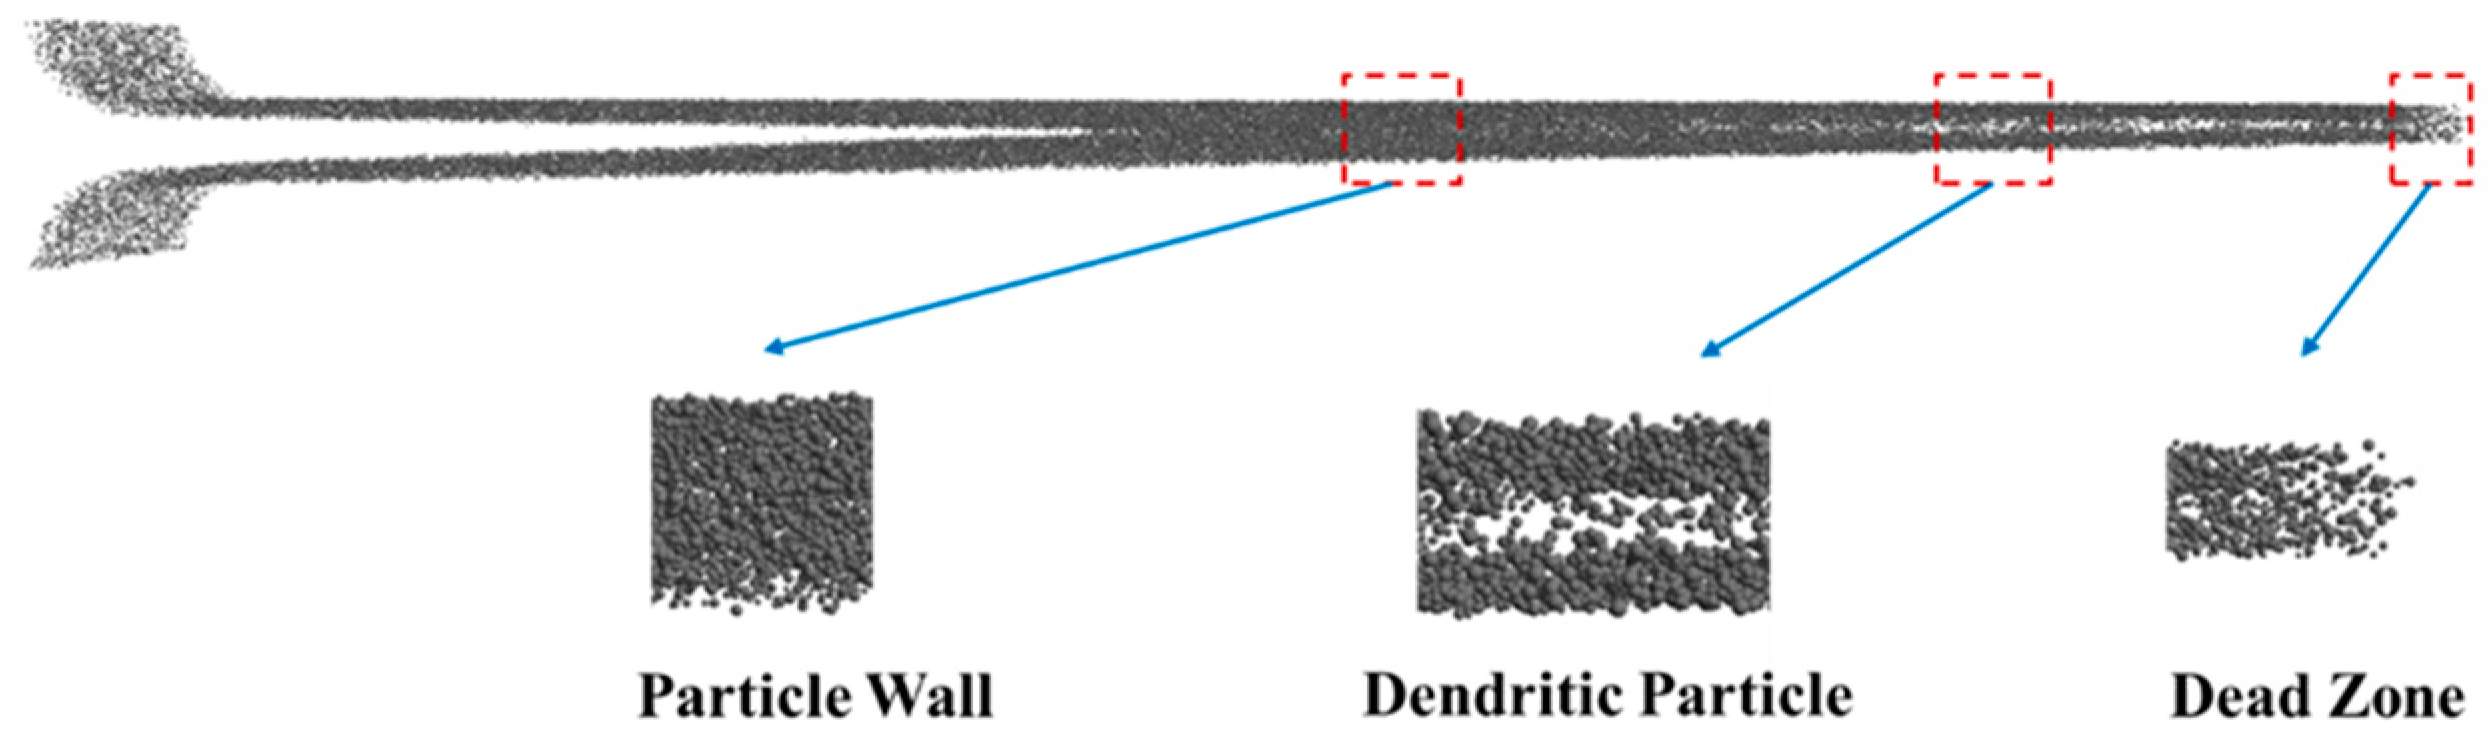
3.1. Particle Deposition Characteristics of Pleated Filter Media

To investigate the particle deposition characteristics and pressure drop growth in pleated filter media, a simulation study was carried out based on the structure of pleated filter media as shown in Table 1. The parameters of the simulation are set as follows: the particle properties are set with reference to the standard ISO 12103-1, A2 fine test dust, with a density and average diameter of 2650 kg/m3 and 2.3 μm, respectively, assuming that the particles are spherical. The number of particles loaded in each batch is 12 million. The dust particles are loaded continuously, and the changes in the particle deposition position and the resistance of pleated filter media are recorded at the end of each batch.
Figure 8 shows the variation in the pleated filter media pressure drop with particle deposition per unit area with a pleat ratio α = 10. When the particle deposition is less than 103 g/m2, the pressure drop of pleated filter media with the growth of deposited particles basically exhibits a linear growth relationship. When the particle deposition is 103 g/m2, the pressure drop of pleated filter media is 61.22 Pa. With the continued loading of particles, the pressure drop growth rate of pleated filtration media begins to rise. When the particle deposition increases to 157 g/m2, the pressure drop of pleated filter media increases to 124.81 Pa. When the particle deposition is greater than 157 g/m2, the pressure drop starts to grow exponentially with the growth of particle deposition, and the pressure drop of pleated filter media grows to 279.28 Pa when the particle deposition is 208 g/m2.
The pressure drop growth pattern of pleated filter media is analyzed by observing the particle deposition. As shown in Figure 9a, at the beginning of particle loading, the surface of the pleated filter media is in a clean state. The particles follow the airflow and are basically uniformly deposited on the surface of all the filter media. Because the airflow direction is along the depth of the pleat, the number of particles deposited along the depth direction of the pleat gradually increases, and more particles are deposited at the pleat tip corner. At this stage, the pressure drop of the pleated filter media increases with the increase in the amount of dust. At this stage, the pressure drop of pleated filter media with the increase in particle deposition basically shows a linear growth relationship. As shown in Figure 9b, with the increase in loading particles, the number of particles deposited at the pleat tip corners increases continuously, and agglomeration occurs. The agglomerated particles block the passage of airflow, which makes the pleat tip corner lose the filtration effect. As shown in Figure 10, with the loading of particles, the particles accumulate at the pleat tip corner, blocking the airflow, and the EFA of pleated filter media is greatly reduced. At this stage, the EFA of the pleated filter media decreases due to the increasing size of the area where agglomeration occurs at the pleated tip angle, and the pressure drop growth rate increases. As shown in Figure 11, during the particle deposition process, the particles are deposited in the pleated filter media on both sides and form dendrites. With the increase in the amount of deposition, when the pleat in the middle of the region of the particles on both sides of the dendrites connect with each other, a “particle wall” forms. The “particle wall” blocks the passage of airflow. This causes the back end of the filter media to lose the filtration effect, and the EFA of the pleated filter media is greatly reduced. As shown in Figure 9c, when the particles are loaded to a certain amount, the middle region of the pleat forms a “particle wall”, and the number of particles deposited at the back end no longer increase. Therefore, during the later stage of particle loading, the pressure drop of the pleated filter media increases exponentially with the increase in particle deposition. As shown in Figure 12, the “particle wall” structure appears in the middle region of the pleated filter media during the particle loading experiment, and the dendritic structure of the deposited particles could be observed using SEM.

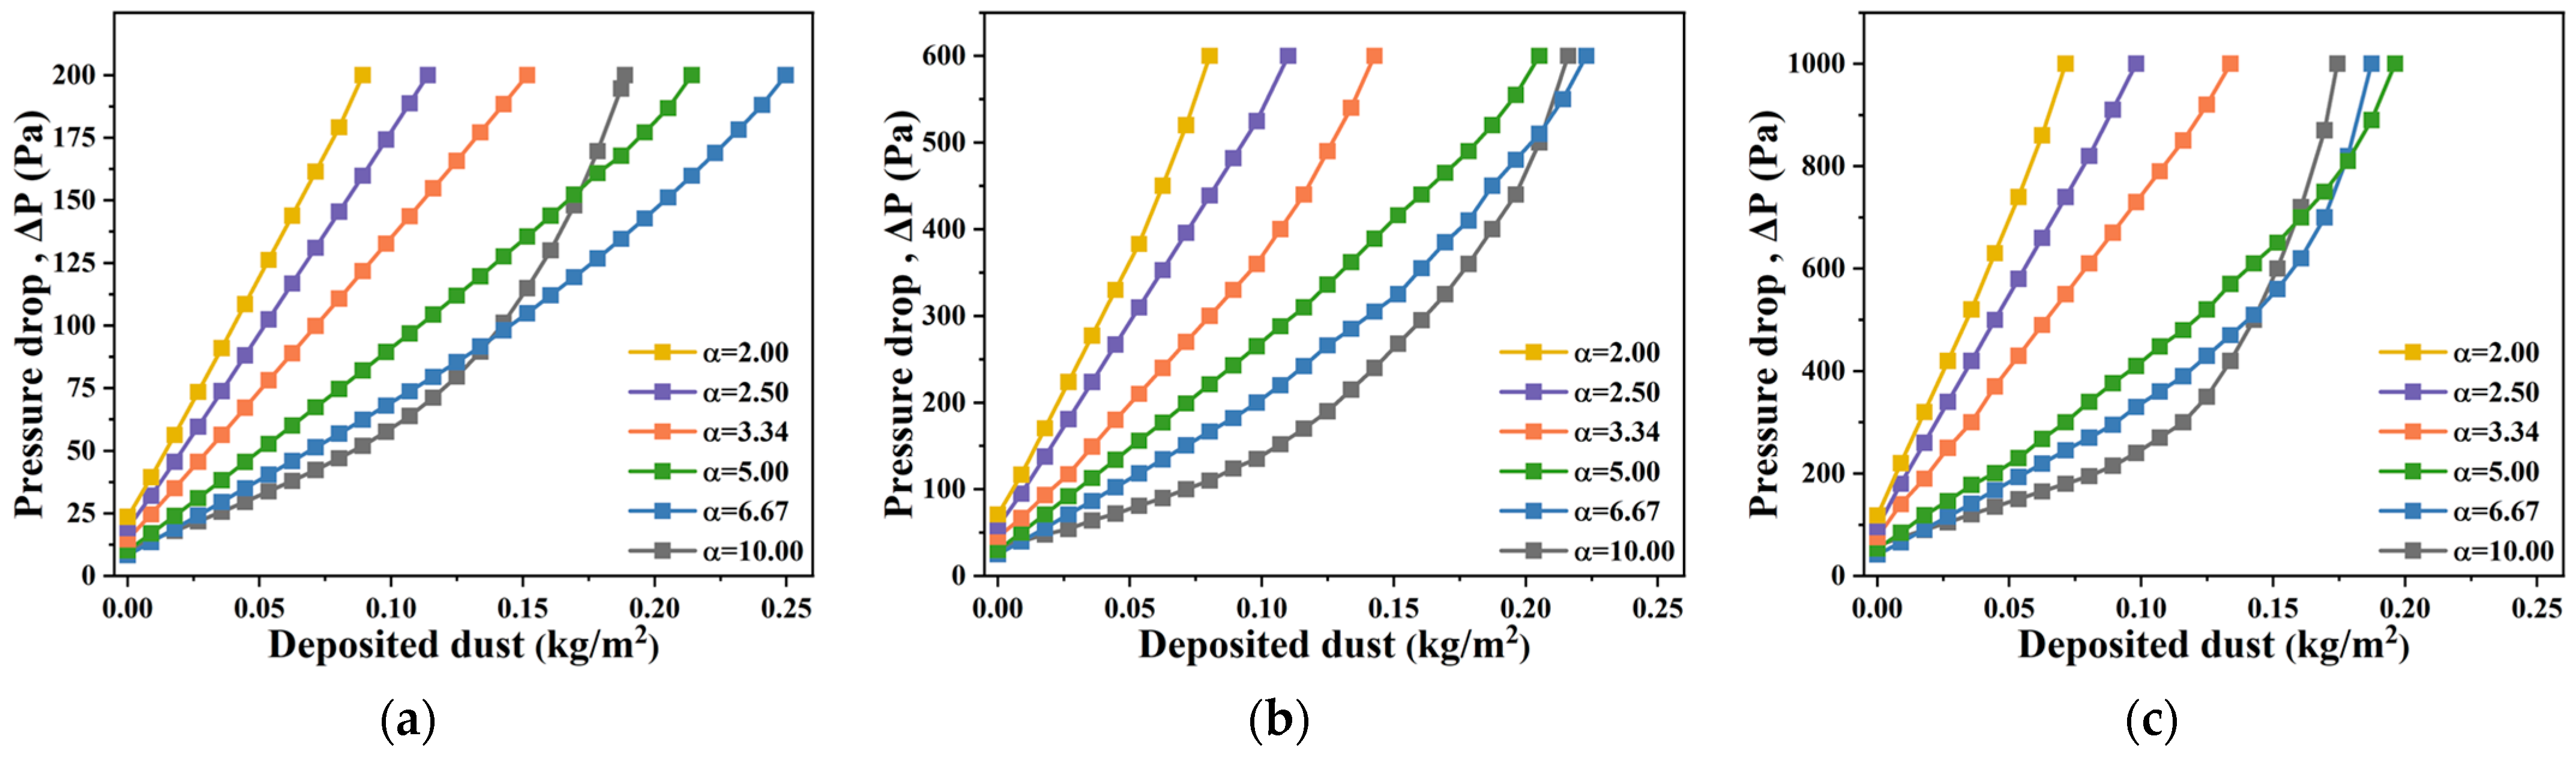
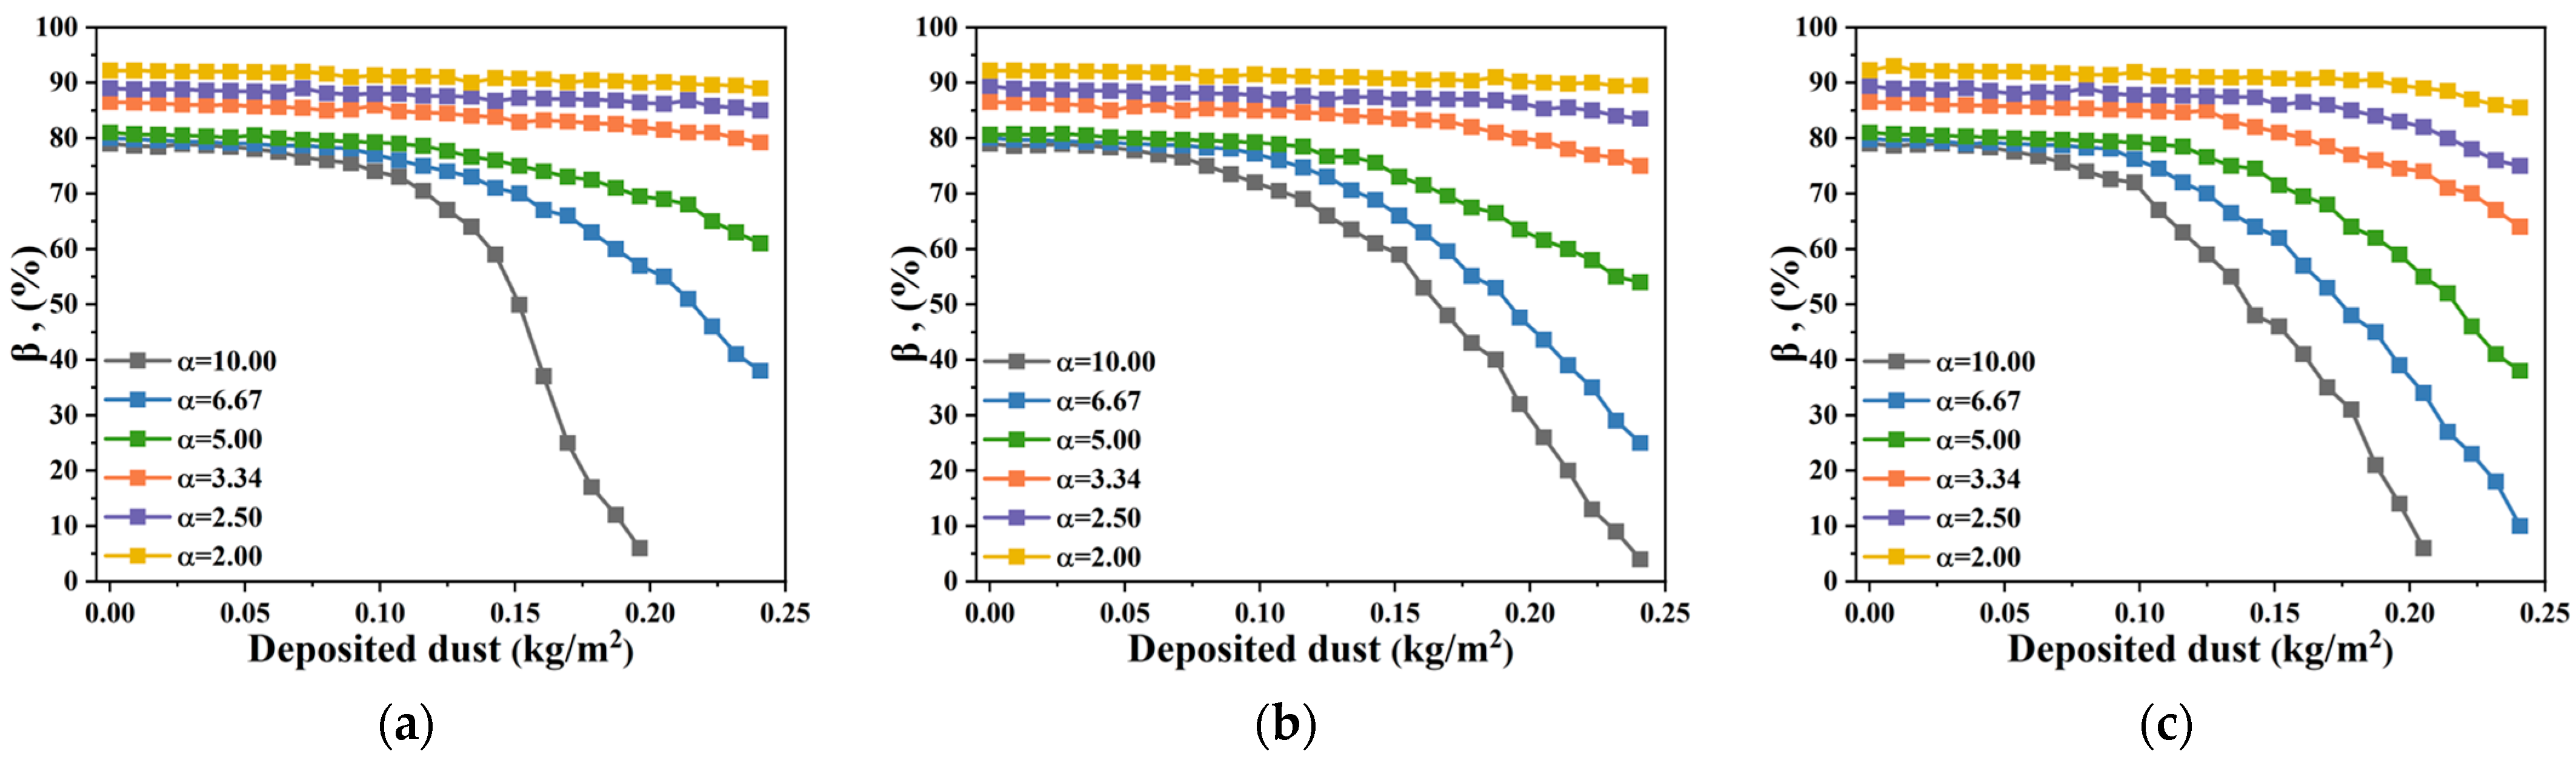
3.2. Effect of the Pleating Ratio on the Dust-Holding Performance of Pleated Filter Media

From the investigation described in Section 3.1, the pleat width will have a large impact on the particle deposition characteristics of pleated filter media, and the pleat ratio directly determines the pleat width. Therefore, the influence of the pleat ratio on the particle deposition and pressure drop characteristics of pleated filter media is investigated in this part. Based on the structural parameters of pleated filter media in Table 1, the particle loading simulation is carried out for six models with pleat ratios of α = 10.00, 6.67, 5.00, 3.40, 2.50, and 2.00. In addition, the effects of three kinds of inlet air velocities of 0.2, 0.6, and 1.0 m/s are explored, and the parameters of the loaded particles are kept in the same way as described in Section 3.1.
Figure 13 shows the variation in the pleated filter media pressure drop with increasing deposited particles for different pleat ratios during particle loading based on A2 dust. For pleated filter media, as the pleat ratio decreases, the area of the filter media that can be accommodated per unit volume decreases accordingly, which leads to an increase in the flow rate through the filter media. Therefore, during particle loading, if particle clogging is ignored, pleated filter media with lower pleat ratios will have a higher pressure drop as the particle deposition continues to accumulate. In the early stage of particle loading, the number of particles deposited on the pleated filter media is small. The particles are basically uniformly deposited on the surface of the filter media, and there is no particle clogging. Thus, increasing the pleat ratio at this time can reduce the pressure drop growth rate. As shown in Figure 13a, when the particle deposition is 71.3 g/m2, the pleat ratio increased from 2.00 to 2.50, 3.34, 5.00, 6.67, and 10.00, and the corresponding pressure drop is 161.48, 131.04, 99.85, 67.34, 51.39, and 42.34 Pa, respectively. As the particles are loaded, the number of particles deposited in the channels of pleated filter media increased. At this time, for the structure with a high pleat ratio, the width between the pleats is narrower. The particles at the pleat tip corner will be more quickly exhibiting agglomeration. Thus, the EFA of the pleated filter media is reduced, and the pressure drop growth rate begins to rise. The higher the pleat ratio is, the faster the pressure drop growth rate rises. When the pressure drop of pleated filter media grows to 200 Pa, the particle deposition values corresponding to the pleat ratios of 2.00, 2.50, 3.34, 5.00, 6.67, and 10.00 are 89.17, 113.92, 151.59, 214.15, 249.67, and 188.71 g/m2, respectively. The highest dust-holding capacity is found at a pleat ratio of 6.67.
After increasing the inlet flow rate, the particles will be deposited deeper in the pleated channel due to the influence of the airflow direction, resulting in an increase in the number of deposited particles at the pleat tip corners. As the pleat ratio increases, the inter-pleat channel becomes narrower, so the structure with a higher pleat ratio is more significantly affected by the inlet flow rate. As shown in Figure 13a–c, when the pressure drop of the pleated filter media reaches the same value, a pleat ratio of 10.00 corresponds to a dust-holding capacity of 188.71, 216.08, and 174.33 g/m2 at 0.2, 0.6, and 1.0 air velocities, respectively, and a pleat ratio of 6.67 corresponds to a dust-holding capacity of 249.67, 222.92, and 187.25 g/m2 at 0.2, 0.6, and 1.0 m/s, respectively. With the increase in inlet air velocity, the dust-holding capacity of different pleat ratio structures decreases. For a pleat ratio of 10.00, at an inlet air velocity of 0.2 m/s, a “particle wall” appears in the middle of the pleat, resulting in a significant decrease in the EFA. However, after increasing the inlet air velocity, more particles are deposited in the pleat tip corners, and a “particle wall” no longer occurs in the middle of the pleat. Therefore, it has the lowest dust-holding capacity at an inlet air velocity of 0.2 m/s. When the inlet air velocity is increased to 1.0 m/s, the highest dust-holding capacity is achieved when the pleat ratio is 5.00.
The effective filtration area percentage (β) is defined as the ratio of the pressure drop of the flat filter media to the total pressure drop of the pleated filter media, under the same dust loading per unit area [49]. The variation in β of pleated filter media with different pleat ratios during particle loading based on A2 dust is shown in Figure 14. For pleated filter media in a clean state, that is, when the dust-holding capacity is zero, increasing the pleat ratio will lead to the narrowing of the channel between the pleats and an increase in structural resistance, which leads to a decrease in β. When the inlet air velocity is 0.2 m/s, the β values corresponding to pleat ratios of 2.00, 2.50, 3.34, 5.00, 6.67, and 10.00 are 92.21%, 89.14%, 86.57%, 81.61%, 80.49%, and 76.44%, respectively. In the pre-particle loading stage, the particles are basically uniformly deposited on the surface of the filter media, and the β of the pleated filter media slowly decreases. With the increase in dust-holding capacity, particles begin to accumulate at the pleat tip corners, and “dead zones” appear, making the rate of β reduction accelerate. An increase in the pleat ratio will lead to the narrowing of the channel between the pleats. With the same amount of dust, the pleat tip corner of the “dead zone” becomes larger. Therefore, the higher the pleat ratio is, the lower the β of the corresponding pleated filter media. In addition, because increasing the air velocity will cause particles to accumulate more easily in the pleat tip corners, the pleat tip corners of the region of the “dead zone” becomes larger. Thus, for the same structure, the higher the inlet air velocity is, the lower the β pleated filter media. In addition, as the dust-holding capacity increases, the β decreases faster.
In addition, the particle size of the loaded particles was also explored in this study, and three types of particles, A1, A2, and A3, were explored separately. Figure 15 shows the variation in the pleated filter media pressure drop with increasing deposited particles for different pleat ratios during particle loading based on an inlet velocity of 0.2 m/s. Under the condition of loading A1 dust particles, as the dust-holding capacity increases, particles continue to be deposited on the surface of the filter media. For the four low pleat ratio structures of 2.00, 2.50, 3.34, and 5.00, the resistance generally follows a linear growth trend. However, for the two structures with pleat ratios of 6.67 and 10.00, the resistance growth rate exhibits an increasing trend. For A1 dust particle loading, the pleated filter media with a pleat ratio of 6.67 shows the highest dust-holding capacity, reaching 248.36 g/m2. When loading A2 dust particles, as particles continue to be deposited, the resistance growth rate begins to increase in structures with pleat ratios of 6.67 and 10.00. Subsequently, the structure with a pleat ratio of 5.00 also starts to show an increasing growth rate. For the structures with pleat ratios of 6.67 and 10.00, the rate of resistance increase becomes more distinct. Under the loading of A2 dust particles, the pleated filter media with a pleat ratio of 6.67 has the highest dust-holding capacity, reaching 249.67 g/m2. Under the condition of loading A3 dust particles, pleated filter media with pleat ratios of 3.34, 5.00, 6.67, and 10.00 all exhibit a continuous rise in the resistance growth rate. Especially with a pleat ratio of 10.00, the resistance rapidly increases to 200 Pa during the early stages of particle loading. Under the condition of loading A3 gray particles, the pleated filter media with a pleat ratio of 5.00 demonstrates the highest dust-holding capacity, reaching 699.18 g/m2.
Figure 16 shows the variation in the β of the pleated filter media with different pleat ratios during particle loading based on an inlet velocity of 0.2 m/s. Based on the analysis of the particle size for the three types of particles, it can be observed that A1 dust particles, which have a relatively small size and volume, are more easily influenced by airflow and can be deposited more uniformly on the surface of the filter media, without significantly accumulating at the pleat tip corners. As a result, the loss in β is minimal for all six pleat ratios. For A2 particles, with a higher content of larger particles, these larger particles tend to accumulate at the pleat tip corners because of inertial forces, creating a “dead zone”. Moreover, larger particles are more likely to form dendritic structures on the sides of the pleats. When these particle dendrites come into contact, they form a “particle wall,” significantly reducing the β. The impact becomes more pronounced with higher pleat ratios, as the channels between the pleats become narrower. For A3 particles, which have a narrower size distribution concentrated in the larger particle range, the β decreases rapidly, and the resistance growth rate increases sharply.
For A1, A2, and A3 particles, pleated structures with the highest dust-holding capacity exhibit pleat ratios of 6.67, 6.67, and 5.00, respectively. For A1 dust particles, since the particles are less likely to form dead zones and particle walls, the enhancement of the filtration area with an increasing pleat ratio significantly outweighs the effects of flow channel blockage due to particle deposition. The maximum dust-holding capacity occurs when the pleat ratio is set to 6.67. For A2 particles, due to the increased number of larger particles, fine particles are deposited uniformly to form a compact filter cake, while coarse particles, influenced by inertial forces, are deposited at the pleat bottoms and form dendritic structures on both sides of the pleated filter media, accelerating the decrease in filtration area. A pleat ratio of 6.67 delays the formation of the “particle wall” due to appropriate flow channel widths, while providing more space for coarse particles to be deposited at the pleat tips, thus achieving the highest dust-holding capacity. For A3 dust particles, due to their particle size being concentrated ranging from 10 to 80 μm, their inertial deposition effect is significant, leading to rapid accumulation on the filter media surface and at the pleat tip corners. Low pleat ratio structures, by increasing the pleat spacing, effectively delay the dense accumulation of particles at the pleat tips and sides, promoting the formation of a loosely packed layer with high porosity. Therefore, the highest dust-holding capacity is achieved when the pleat ratio is reduced to 5.00.
This conclusion is in line with Saleh’s [35] research findings. Sala discovered that particles of different sizes exhibit distinct deposition patterns within pleated filter media. These patterns are closely related to the determination of the optimal pleat ratio. Just as in our study, the unique behaviors of A1, A2, and A3 particles lead to specific optimal pleat ratios for maximum dust-holding capacity, demonstrating the similarity in the understanding of how particle characteristics influence filter performance through deposition patterns and pleat ratio selection.

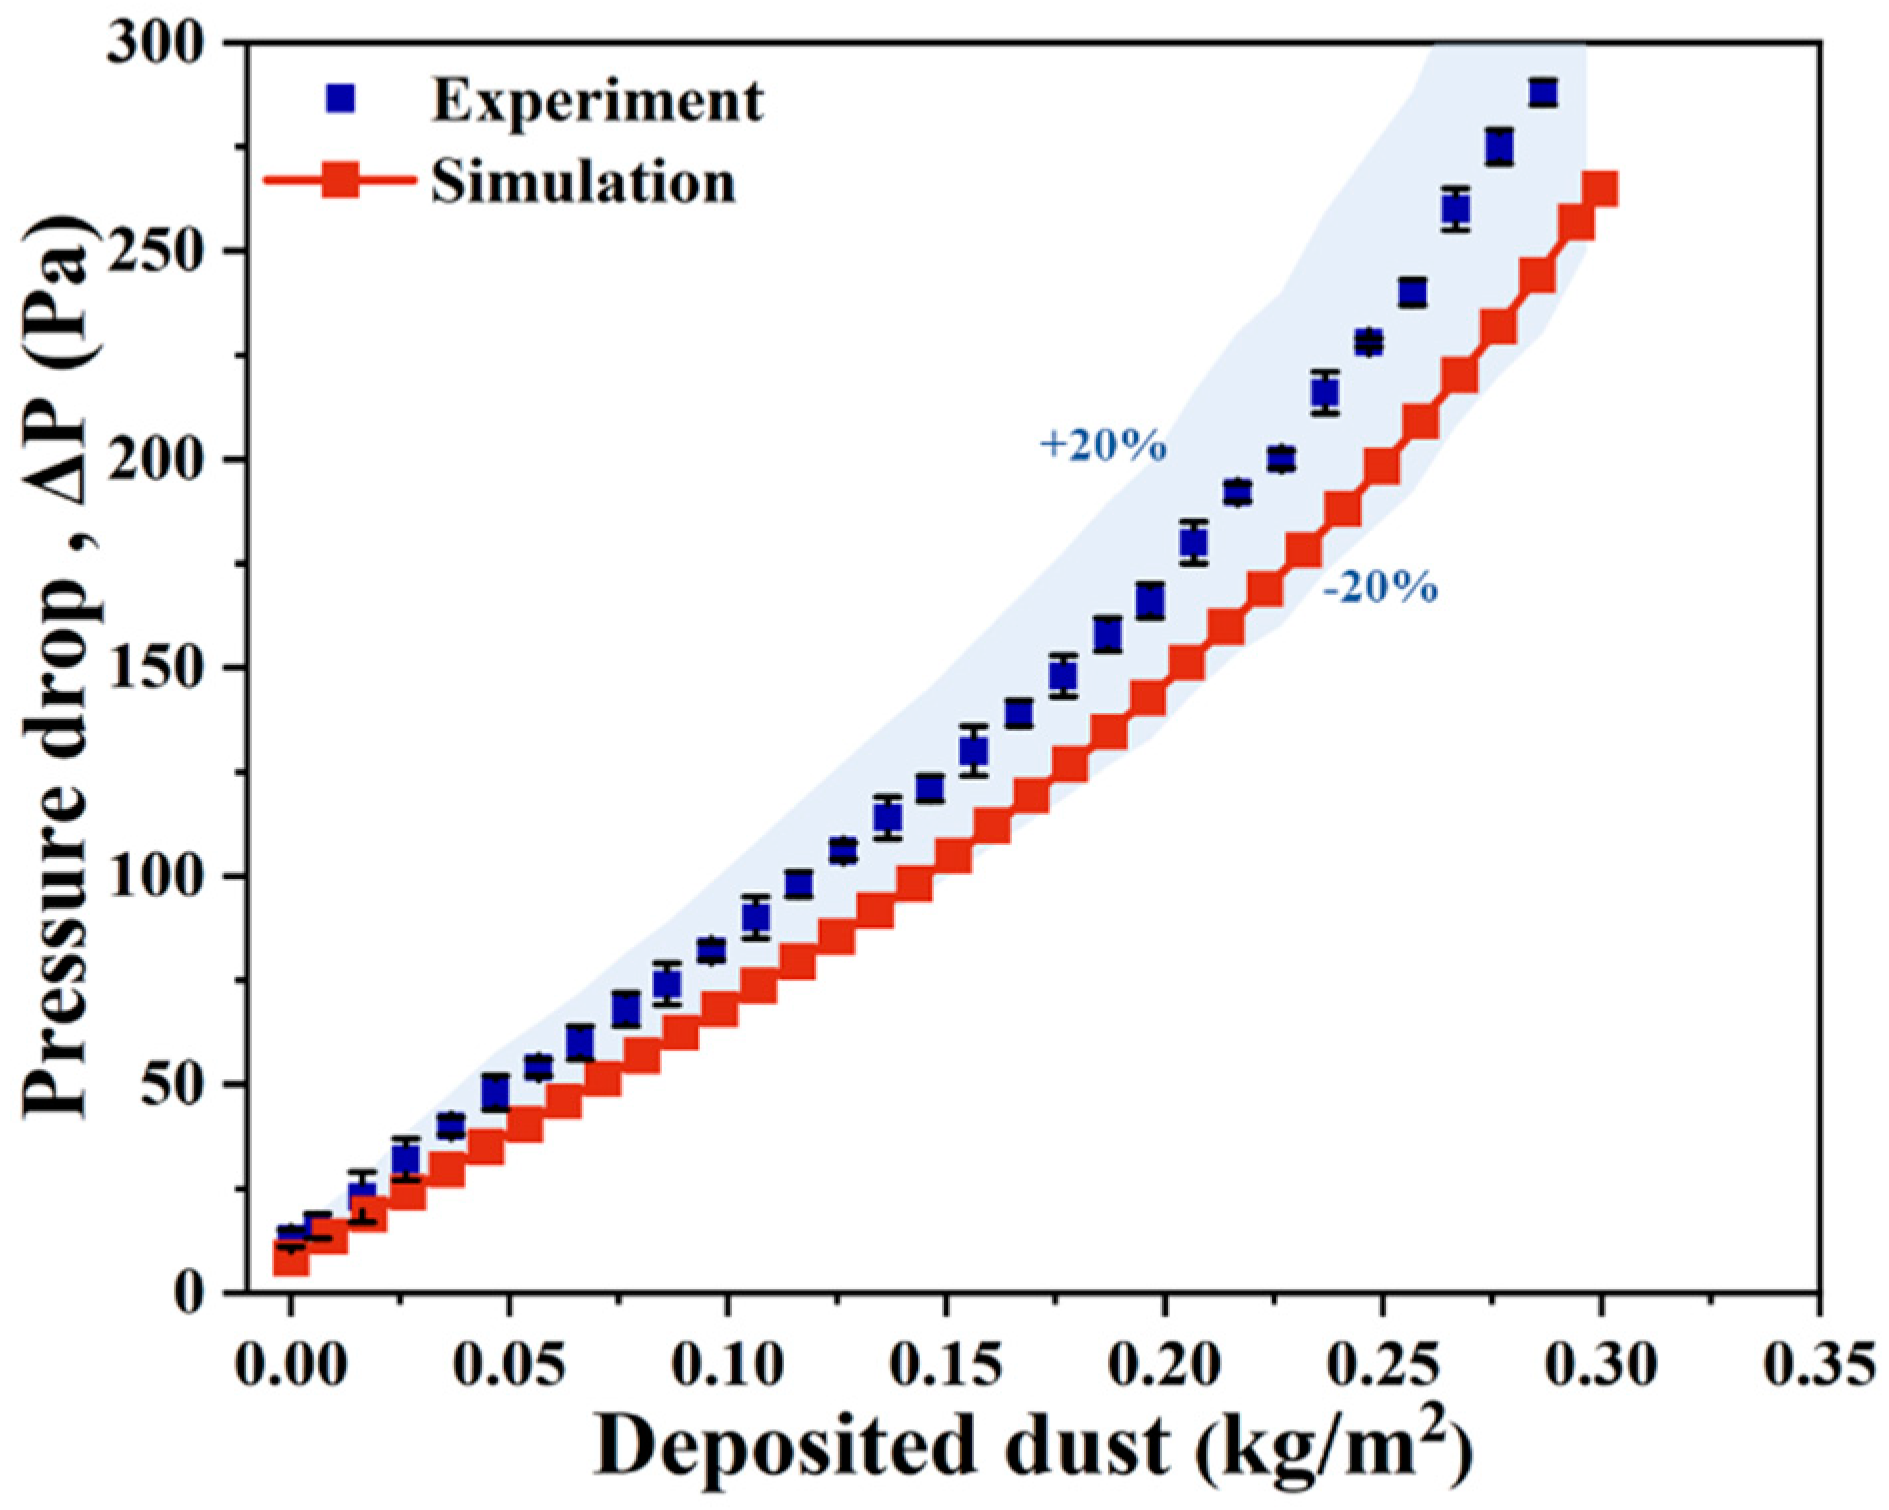
3.3. Experimental Verification of Simulation Results

Pleated filter media with the same structural parameters were loaded with particles using experimental and simulation methods, and the changes in their pressure drop were recorded in detail. As shown in Figure 17, with the gradual increase in the deposited particles, the pressure drop growth trend of pleated filter media under experimental conditions and simulation is basically the same, and the error between simulation and experimental results is within 20%. Furthermore, the pressure drop obtained from the experiments are generally higher than the simulation results, with this phenomenon being particularly significant in the later stages of particle loading. This is because the experimental filter media’s surface is not as smooth as assumed in the simulation but contains tiny warps in the fibers. In the process of particle deposition, these warped fibers contribute to the formation of a more complex particle dendritic structure within the pleated filter media, which leads to a reduction in the effective filter area, and this change directly increases the pressure drop of the filter media. Figure 18 shows the schematic diagram of the pleated filter media in the dust-holding process.

4. Conclusions

This study revealed the particle deposition characteristics of pleated filter media and its pressure drop growth during particle loading. A simulation was conducted to explore the impact of the pleat ratio on both its particle deposition and the EFA. In addition, the simulation results were verified using experiments. The conclusions are as follows:
Particle loading of pleated filter media was carried out based on the simulation method. The results revealed the pattern of pressure drop variation in pleated filter media with dust particle deposition and the mechanism by which particle deposition morphology contributes to the pressure drop growth. At the beginning of particle loading, the particles were uniformly deposited on the surface of the filter media, and the pressure drop increased linearly with the deposited particles. As particle deposition increased, the particles agglomerated at the pleat tip corners to form a “dead zone”, resulting in the reduction of the EFA, and the pressure drop growth rate accelerated. When the deposited particles further increased, a “particle wall” appeared in the middle area of the pleat, which greatly reduced the EFA and exponentially increased the pressure drop of the pleated filter media.
Furthermore, the effects of the pleat ratio and inlet air velocity on the particle deposition characteristics of pleated filter media were explored. The results showed that as the pleat ratio decreased, the area of filter media per unit volume decreased, and the flow rate on the filter surface increased, leading to a higher pressure drop growth rate. However, increasing the pleat ratio resulted in a narrower channel between the pleats, and particles were more likely to agglomerate to form a “dead zone”, which decreased the EFA of the filter media. Therefore, there was an optimal pleat ratio that allowed the pleated filter media to exhibit the best dust-holding capacity. Based on the research conditions in this paper, the best dust-holding capacity was observed at a pleat ratio of 6.67. Additionally, increasing the inlet air velocity caused particles to be deposited deeper inside the pleated channel, reducing the EFA of the pleated filter media. The higher the pleat ratio was, the more significantly the structure was affected by the inlet flow rate. When the inlet air velocity increased to 1.0 m/s, the best dust-holding capacity was achieved with a pleat ratio of 5.00.
The study also explored the influence of particle size by separately examining three types of particles, A1, A2, and A3. For A1 dust particles with a small size and volume, they were deposited uniformly on the filter media surface because they were easily influenced by airflow, causing minimal loss in the EFA across all pleat ratios. The pleated filter media with a pleat ratio of 6.67 showed the highest dust-holding capacity of 248.36 g/m2 during A1 particle loading. When loading A2 dust particles, larger particles accumulated at pleat tip corners in higher proportions due to inertial forces, creating “dead zones” and reducing β significantly. The pleated filter media with a pleat ratio of 6.67 had the highest dust-holding capacity of 249.67 g/m2. A3 particles, with a narrow size distribution in the larger particle range, led to a rapid decrease in β and a sharp increase in the resistance growth rate. The pleated filter media with a pleat ratio of 5.00 demonstrated the highest dust-holding capacity of 699.18 g/m2 under A3 particle loading.
The reliability of the simulation results was experimentally verified. The pressure drop growth trend exhibited by the pleated filter media under experimental conditions and in the simulation was basically the same, and the error between the simulation results and the experimental results was within 20%.
In summary, this study analyzed the particle deposition characteristics and pressure drop growth in pleated filter media through simulation and experimentation, providing a theoretical basis and experimental support for optimizing the design and use of pleated filter media. The findings of this study are highly valuable for industrial applications. For large-scale air handling systems used in power plants, as well as in automotive and precision electronics manufacturing, understanding the relationship between pleat ratio and dust-holding capacity is crucial for designing energy-efficient filtration systems that meet stringent standards. This knowledge not only enhances filtration performance but also reduces operational costs and minimizes production downtime. Future research will further advance our understanding of pleated filter media. Beyond exploring the impact of different filter materials on pleat performance, we aim to investigate a broader range of pleat configurations. This includes innovative designs such as variable density pleats and three-dimensional pleats, which have the potential to enhance filtration efficiency and dust-holding capacity. Additionally, a key focus will be the development of more precise simulation methods to predict filter performance, enabling more efficient and targeted filter designs in the future.

Author Contributions

Data curation, C.G.; Investigation, J.K., H.W. and M.T.; Methodology, C.G. and J.K.; Project administration, D.W. and L.W.; Supervision, Y.L. and G.X.; Validation, C.G.; Writing—original draft, C.G.; Writing—review & editing, C.G., H.W. and M.T. All authors have read and agreed to the published version of the manuscript.

Funding

This research received no external funding.

Data Availability Statement

Data will be made available upon request.

Conflicts of Interest

The authors declare no conflicts of interest.

References

  1. Ivaneev, A.; Brzhezinskiy, A.; Karandashev, V.; Fedyunina, N.; Ermolin, M.; Fedotov, P. Nanoparticles of Dust as an Emerging Contaminant in Urban Environments. Environ. Geochem. Health 2024, 46, 367. [Google Scholar] [CrossRef]
  2. Fu, C.; Kuang, D.; Zhang, H.; Ren, J.; Chen, J. Different Components of Air Pollutants and Neurological Disorders. Front. Public Health 2022, 10, 959921. [Google Scholar] [CrossRef]
  3. Hahad, O.; Lelieveld, J.; Al-Kindi, S.; Schmitt, V.H.; Hobohm, L.; Keller, K.; Röösli, M.; Kuntic, M.; Daiber, A. Burden of Disease in Germany Attributed to Ambient Particulate Matter Pollution. Herz 2025, 50, 42–50. [Google Scholar] [CrossRef]
  4. Ammons, S.; Aja, H.; Ghazarian, A.A.; Lai, G.Y.; Ellison, G.L. Perception of Worry of Harm from Air Pollution: Results from the Health Information National Trends Survey (HINTS). BMC Public Health 2022, 22, 1254. [Google Scholar] [CrossRef] [PubMed]
  5. Morantes, G.; Jones, B.; Molina, C.; Sherman, M.H. Harm from Residential Indoor Air Contaminants. Environ. Sci. Technol. 2024, 58, 242–257. [Google Scholar] [CrossRef] [PubMed]
  6. Xu, C.; Zhang, Q.; Huang, G.; Huang, J.; Zhang, H. The Impact of PM2.5 on Kidney. J. Appl. Toxicol. 2023, 43, 107–121. [Google Scholar] [CrossRef]
  7. Pham, L.; Roach, T. Particulate Pollution and Learning. Econ. Educ. Rev. 2023, 92, 102344. [Google Scholar] [CrossRef]
  8. Lippi, G.; Mattiuzzi, C. Particulate Matter Pollution and Lung Cancer: A Worldwide Perspective. Clin. Respir. J. 2020, 14, 179–180. [Google Scholar] [CrossRef]
  9. Akduman, C.; Demirel, V.; Tezcan, F. Filter Life Comparison of Different Levels of Nanofiber Coated Cleanable-Surface Filter for Gas Turbine. J. Appl. Polym. Sci. 2021, 138, 50820. [Google Scholar] [CrossRef]
  10. Ma, S.; Zhou, Y.; Sun, Z.; Gu, H.; Wang, Y.; Yu, X. Numerical Simulation Study on the Filtration Performance of Metal Fiber Filters. Progress Nucl. Energy 2024, 171, 105169. [Google Scholar] [CrossRef]
  11. Liu, H.; Zhu, Y.; Zhang, C.; Zhou, Y.; Yu, D.-G. Electrospun Nanofiber as Building Blocks for High-Performance Air Filter: A Review. Nano Today 2024, 55, 102161. [Google Scholar] [CrossRef]
  12. Luo, T.; Zhang, J.; Wang, J.; Shi, H.; Hong, Y.; Zhao, R. Sustainable Pollution Treatment System through Fiber Filter Materials. Sustain. Mater. Technol. 2024, 42, e01168. [Google Scholar] [CrossRef]
  13. Li, X.; Ba, X.; Dai, Y.; Feng, Y.; Yan, S.; Zhang, Q.; You, R. Silk Nanofibrillar Aerogel as Sustainable Filters for Environmental Purification. Small 2025, 2500226. [Google Scholar] [CrossRef]
  14. Kalani, S.; Jubinville, D.; Mekonnen, T.H. Nano-Porous Melt-Blown Poly(Lactic Acid) Fiber Mat Air Filters for High Efficiency Particulate Capture. Adv. Sustain. Syst. 2025, 202400898. [Google Scholar] [CrossRef]
  15. Jin, H.; Li, S.; He, S.; Hu, S.; Yuan, L.; Zhou, F. The Pressure Drop of Fibrous Surface Filters for Gas Filtration: Modeling and Experimental Studies. Sep. Purif. Technol. 2024, 350, 127981. [Google Scholar] [CrossRef]
  16. Zhao, X.; Bai, Y.; Fan, G.; Guo, H.; Shi, P.; Cui, W.; Jin, X.; Liu, Y.; Wang, R.; He, J. Large-Scale Fabrication of 3D Gradient Hierarchical Fibrous Filter Materials with Micro-Submicro-Nanofibers for Efficient and Long-Duration Air Filtration. Sep. Purif. Technol. 2025, 362, 131867. [Google Scholar] [CrossRef]
  17. Lin, X.; Sun, W.; Lin, M.; Chen, T.; Duan, K.; Lin, H.; Zhang, C.; Qi, H. Bicomponent Core/Sheath Melt-Blown Fibers for Air Filtration with Ultra-Low Resistance. RSC Adv. 2024, 14, 14100–14113. [Google Scholar] [CrossRef]
  18. Liao, J.; Nie, J.; Sun, B.; Jiao, T.; Zhang, M.; Song, S. A Cellulose Composite Filter with Multi-Stage Pores Had High Filtration Efficiency, Low Pressure Drop, and Degradable Properties. Chem. Eng. J. 2024, 482, 148908. [Google Scholar] [CrossRef]
  19. Sawatdee, S.; Botalo, A.; Noinonmueng, T.; Posoknistakul, P.; Intra, P.; Pongchaikul, P.; Charnnok, B.; Chanlek, N.; Laosiripojana, N.; Wu, K.C.W.; et al. Fabrication of Multilayer Cellulose Filters Isolated from Natural Biomass for Highly Efficient Air Filtration for Replacement of Synthetic HEPA Filters. Process Saf. Environ. Prot. 2025, 194, 216–230. [Google Scholar] [CrossRef]
  20. Chagas, P.A.M.; Lima, F.A.; Yamanaka, V.; Medeiros, G.B.; Guerra, V.G.; Oliveira, W.P.; Aguiar, M.L. Short Cellulose Acetate Nanofibers: A Novel and Scalable Coating for Enhancing Nanoparticles Filtration Efficiency of Filter Media. Sep. Purif. Technol. 2025, 358, 130315. [Google Scholar] [CrossRef]
  21. Ma, S.; Zhou, Y.; Sun, Z.; Gu, H.; Yuan, H.; Cao, S. Numerical Simulation Study on Depth Filtration Performance of Metal Fiber Pre-Filters with Different Pleat Structures. Nucl. Eng. Des. 2024, 425, 113337. [Google Scholar] [CrossRef]
  22. Cuiping, Y.; Wanlan, H.; Feng, X.; Junzhe, F.; Yang, L.; Yuyan, P.; Yunduan, W.; Ruizhi, M. The Effect of Pleat Ratio on the Effective Filtration Area of the Large-Diameter Pleated Filter Cartridge. Part. Sci. Technol. 2024, 42, 1031–1042. [Google Scholar] [CrossRef]
  23. Wu, J.; Lin, B.; Zhou, H.; Rao, Y.; Xu, C.; Zhou, Q.; Feng, S.; Zhong, Z.; Xing, W. Effect of Pleat Structure on the Air Purification Performance of a Polytetrafluoroethylene/Poly(Ethylene Terephthalate) Composite Membrane Filter. Ind. Eng. Chem. Res. 2023, 62, 16048–16057. [Google Scholar] [CrossRef]
  24. Park, B.H.; Lee, M.-H.; Jo, Y.M.; Kim, S.B. Influence of Pleat Geometry on Filter Cleaning in PTFE/Glass Composite Filter. J. Air Waste Manag. Assoc. 2012, 62, 1257–1263. [Google Scholar] [CrossRef] [PubMed]
  25. Li, L.; Zhou, Y.; Wang, Z.; Gu, H.; Sun, Z.; Li, Y.; Ma, S. Research on the Filtration Performance of Pleated Filters with Rectangular and Triangular Structures through Developed CFD Code. Progress Nucl. Energy 2022, 153, 104413. [Google Scholar] [CrossRef]
  26. Feng, Z.; Long, Z. Modeling Unsteady Filtration Performance of Pleated Filter. Aerosol Sci. Technol. 2016, 50, 626–637. [Google Scholar] [CrossRef]
  27. Cheng, K.; Zhu, J.; Qian, F.; Cao, B.; Lu, J.; Han, Y. CFD–DEM Simulation of Particle Deposition Characteristics of Pleated Air Filter Media Based on Porous Media Model. Particuology 2023, 72, 37–48. [Google Scholar] [CrossRef]
  28. Teng, G.; Shi, G.; Zhu, J. Influence of Pleated Geometry on the Pressure Drop of Filters during Dust Loading Process: Experimental and Modelling Study. Sci. Rep. 2022, 12, 20331. [Google Scholar] [CrossRef]
  29. Choi, P.; Santos, C.A.; Kim, M.K.; Jung, H.; Hong, D.Y.; Koo, J. Pressure Drop and Optimization Meta-Models for Arbitrary Low-Height Pleated Filter Shapes and Flowrates. J. Mech. Sci. Technol. 2021, 35, 5007–5022. [Google Scholar] [CrossRef]
  30. Dziubak, T. Experimental Studies of PowerCore Filters and Pleated Filter Baffles. Materials 2022, 15, 7292. [Google Scholar] [CrossRef]
  31. Théron, F.; Joubert, A.; Le Coq, L. Numerical and Experimental Investigations of the Influence of the Pleat Geometry on the Pressure Drop and Velocity Field of a Pleated Fibrous Filter. Sep. Purif. Technol. 2017, 182, 69–77. [Google Scholar] [CrossRef]
  32. Fotovati, S.; Hosseini, S.A.; Vahedi Tafreshi, H.; Pourdeyhimi, B. Modeling Instantaneous Pressure Drop of Pleated Thin Filter Media during Dust Loading. Chem. Eng. Sci. 2011, 66, 4036–4046. [Google Scholar] [CrossRef]
  33. Shu, Z.; Qian, F.; Fang, C.; Zhu, J. Numerical Simulation of Particle Spatial Distribution and Filtration Characteristic in the Pleated Filter Media Using OpenFOAM. Indoor Built Environ. 2021, 30, 1159–1172. [Google Scholar] [CrossRef]
  34. Kim, Y.; Kwon, M.; Lee, M. Optimized Pleat Geometry at Specific Pleat Height in Pleated Filters for Air Purification. Indoor Air 2022, 32, e13135. [Google Scholar] [CrossRef]
  35. Saleh, A.M.; Fotovati, S.; Vahedi Tafreshi, H.; Pourdeyhimi, B. Modeling Service Life of Pleated Filters Exposed to Poly-Dispersed Aerosols. Powder Technol. 2014, 266, 79–89. [Google Scholar] [CrossRef]
  36. Li, S.; Hu, S.; Xie, B.; Jin, H.; Xin, J.; Wang, F.; Zhou, F. Influence of Pleat Geometry on the Filtration and Cleaning Characteristics of Filter Media. Sep. Purif. Technol. 2019, 210, 38–47. [Google Scholar] [CrossRef]
  37. ISO 12103-1:2024; Road Vehicles—Test Contaminants for Filter Evaluation. Part 1: Arizona Test Dust. ISO: Geneva, Switzerland, 2024.
  38. Fotovati, S.; Tafreshi, H.V.; Pourdeyhimi, B. A Macroscale Model for Simulating Pressure Drop and Collection Efficiency of Pleated Filters over Time. Sep. Purif. Technol. 2012, 98, 344–355. [Google Scholar] [CrossRef]
  39. Iliev, O.; Laptev, V. On Numerical Simulation of Flow Through Oil Filters. Comput. Vis. Sci. 2004, 6, 139–146. [Google Scholar] [CrossRef]
  40. Song, Y.; Shim, E. High-Fidelity 3D Simulation of Dust-Loading Behavior and Clogging Process of Coarse Nonwoven Filter Media Considering Collision Effect. Sep. Purif. Technol. 2024, 344, 127046. [Google Scholar] [CrossRef]
  41. Becker, J.; Cheng, L.; Kronsbein, C.; Wiegmann, A. Simulation of Cake Filtration for Polydisperse Particles. Chem. Eng. Technol. 2016, 39, 559–566. [Google Scholar] [CrossRef]
  42. Linden, S.; Wiegmann, A.; Hagen, H. The LIR Space Partitioning System Applied to the Stokes Equations. Graph. Models 2015, 82, 58–66. [Google Scholar] [CrossRef]
  43. Chen, L.; Hu, W.; Xu, Y.; Qian, F.; Li, H.; Zheng, Z. The Study of Dust-Holding Characteristics of Pleated Non-Uniform Porous Media: Macroscale Simulations. Sep. Purif. Technol. 2025, 362, 131719. [Google Scholar] [CrossRef]
  44. Glowinski, R.; Pironneau, O. Finite Element Methods for Navier-Stokes Equations. Annu. Rev. Fluid. Mech. 1992, 24, 167–204. [Google Scholar] [CrossRef]
  45. Kang, S.; Lee, H.; Kim, S.C.; Chen, D.-R.; Pui, D.Y.H. Modeling of Fibrous Filter Media for Ultrafine Particle Filtration. Sep. Purif. Technol. 2019, 209, 461–469. [Google Scholar] [CrossRef]
  46. Cheng, L.; Rief, S.; Wiegmann, A.; Techno, F.-I. Nano Filtration Media—Challenges of Modelling and Computer Simulation. Available online: https://www.math2market.com/fileadmin/Showroom/Presentations/2001-2010/2009FiltechWiesbadenNanoChengPaper.pdf (accessed on 19 March 2025).
  47. Crowe, C.T.; Crowe, C.T. (Eds.) Multiphase Flow Handbook; CRC Press: Boca Raton, FL, USA, 2005; ISBN 978-0-429-12657-4. [Google Scholar]
  48. Pan, Z.; Ou, Q.; Romay, F.J.; Chen, W.; You, T.; Liang, Y.; Wang, J.; Pui, D.Y.H. Study of Structural Factors of Structure-Resolved Filter Media on the Particle Loading Performance with Microscale Simulation. Sep. Purif. Technol. 2023, 304, 122317. [Google Scholar] [CrossRef]
  49. Teng, G.; Shi, G.; Zhu, J.; Qi, J.; Zhao, C. Research on the Influence of Pleat Structure on Effective Filtration Area during Dust Loading. Powder Technol. 2022, 395, 207–217. [Google Scholar] [CrossRef]
Figure 1. Geometric structure of pleats.
Processes 13 00975 g001
Figure 2. Schematic diagram of the dust-loading performance testing system.
Processes 13 00975 g002
Figure 3. SEM image of the filter media surface. (a) ×300, (b) ×1000.
Processes 13 00975 g003
Figure 4. The structure of the pleated filter element.
Processes 13 00975 g004
Figure 5. Numerical simulation. (a) Porous media models, (b) Comparison between the numerical calculation results of the porous media model and the experimental test values.
Processes 13 00975 g005
Figure 6. According to the comparison between the voxel and the particle size, it is divided into two particle models: “Resolved” and “Unresolved”.
Processes 13 00975 g006
Figure 7. Computational domain and boundary conditions.
Processes 13 00975 g007
Figure 8. Variations in the pleated filter media pressure drop during particle loading at a pleat ratio of 10.
Processes 13 00975 g008
Figure 9. The volume distribution of deposited particles during particle loading at a pleat ratio of 10. (a) Batch 20; (b) Batch 70; (c) Batch 150.
Processes 13 00975 g009
Figure 10. Variations in the flow field section within pleated filter media during the particle loading process.
Processes 13 00975 g010
Figure 11. Visualization of particles deposited inside pleated filter media.
Processes 13 00975 g011
Figure 12. The “particle wall” structure in the middle region of the pleated filter media.
Processes 13 00975 g012
Figure 13. Variation in the pleated filter media pressure drop with increasing deposited particles for different pleat ratios during particle loading based on A2 dust. (a) 0.2 m/s, (b) 0.6 m/s, (c) 1.0 m/s.
Processes 13 00975 g013
Figure 14. Variation in the effective filtration area percentage (β) of the pleated filter media with increasing deposited particles for different pleat ratios during particle loading based on A2 dust. (a) 0.2 m/s, (b) 0.6 m/s, (c) 1.0 m/s.
Processes 13 00975 g014
Figure 15. Variation in the pleated filter media pressure drop with increasing deposited particles for different pleat ratios during particle loading based on an inlet velocity of 0.2 m/s. (a) A1, (b) A2, (c) A3.
Processes 13 00975 g015
Figure 16. Variation in the β of the pleated filter media with increasing deposited particles for different pleat ratios during particle loading based on an inlet velocity of 0.2 m/s. (a) A1, (b) A2, (c) A3.
Processes 13 00975 g016
Figure 17. Comparison between the simulated pressure drop growth curve and experimental values at a pleat ratio of 6.67.
Processes 13 00975 g017
Figure 18. Characterization of particle deposition in pleated filter media during dust-holding processes. (a) Clean, (b) 107 g/m2, (c) 281 g/m2.
Processes 13 00975 g018
Table 1. Geometric specific parameters of the pleated filter media model.
ParametersType 1Type 2Type 3Type 4Type 5Type 6
Pleat height (PH, mm)202020202020
Pleat width (PW, mm)2346810
Pleat length (PL, mm)20.0420.0720.1020.2320.4020.62
Pleat ratio (α, PH/PW)10.006.675.003.342.502.00
Angle (θ, °)5.858.7711.7117.5023.1428.75
Disclaimer/Publisher’s Note: The statements, opinions and data contained in all publications are solely those of the individual author(s) and contributor(s) and not of MDPI and/or the editor(s). MDPI and/or the editor(s) disclaim responsibility for any injury to people or property resulting from any ideas, methods, instructions or products referred to in the content.

