Article

Experimental Study on Microscopic Distribution Characteristics of Water-Sealed Gas in Pore–Fracture Carbonate Gas Reservoirs

1
College of Petroleum Engineering, China University of Petroleum (Beijing), Beijing 102249, China
2
National Key Laboratory of Petroleum Resources and Engineering, China University of Petroleum (Beijing), Beijing 102249, China
3
Exploration and Development Research Institute, PetroChina Southwest Oil & Gasfield Company, Chengdu 610041, China
*
Authors to whom correspondence should be addressed.
Processes 2025, 13(4), 979; https://doi.org/10.3390/pr13040979
Submission received: 23 February 2025 / Revised: 18 March 2025 / Accepted: 24 March 2025 / Published: 25 March 2025

Abstract

:
Pore–fracture carbonate gas reservoirs exhibit complex pore–throat structures and significant heterogeneity. Formation water can easily migrate along fractures, leading to extensive water-sealed gas accumulation, which severely limits the recovery rate of such reservoirs. To further investigate the water invasion process and the distribution characteristics of water-sealed gas in these reservoirs, a microscopic visualization model was developed using core CT scanning and laser etching technologies, incorporating the actual fracture sizes. The effects of fracture size, fracture density, and permeability heterogeneity on the microscopic distribution of water-sealed gas were analyzed in detail. The results indicate the following findings: (1) Homogeneous fracture size leads to a smaller extent of water-sealed gas accumulation. The ultimate gas saturation in the homogeneous fracture model is 5.79% lower than that in the heterogeneous model. (2) An increase in fracture density helps reduce the volume of water-sealed gas. The ultimate gas saturation in the high-density fracture model is 2.58% lower than in the low-density model. (3) The presence of seepage channels at the reservoir boundary with significant permeability heterogeneity exacerbates the accumulation of water-sealed gas and accelerates water invasion.

1. Introduction

Carbonate gas reservoirs play a crucial role in the global energy supply, with proven reserves accounting for more than 60% of the world’s total natural gas reserves [1]. Approximately one-third of China’s land area is covered by carbonate rocks [2], which are rich in oil and gas resources. Due to multi-stage diagenetic processes, carbonate reservoirs typically feature cross-scale pore types, including pores, fractures, and cavities, resulting in highly complex pore–throat structures. The natural fracture network exhibits uneven development, leading to significant variations in permeability and connectivity between matrix pores and fractures. This disparity results in pronounced internal heterogeneity within the reservoir. Their complex pore–throat structures and strong heterogeneity result in characteristics such as low single-well production [3], complex gas–water interactions [4], and a high risk of flooding [5]. Fracturing gas wells is an effective way to increase the productivity of a single well, but the retention of fracturing fluid in the fractures will also cause part of the natural gas to be blocked [6,7]. Pore–fracture reservoirs are an important subtype of carbonate gas reservoirs, widely distributed across the Sichuan, Tarim, and Ordos Basins. The relatively well-developed fractures in these reservoirs create crossflow channels, facilitating the rapid intrusion of edge and bottom water. This can lead to the premature flooding of gas wells and a subsequent decrease in gas recovery [8,9].
Given the complexity of the pore–throat structures, many scholars have conducted extensive research on the direction of water invasion in gas reservoirs. Li et al. [10] identified the main controlling factors and patterns of water invasion in different well areas of the carbonate gas reservoirs in the Anyue Gas Field. Their findings indicate that water invasion in wells with varying water production types is directly influenced by the degree of fracture development. Wang et al. [11] combined core CT scanning with laser etching technology to create a visual microscopic model with distinct reservoir structural features, and used it to study the gas–water two-phase microscopic seepage mechanism and the formation of closed gas and residual water. Hu et al. [12] employed online nuclear magnetic resonance technology to monitor the dynamic water invasion process in carbonate rocks. Their results indicated that fractures significantly enhanced reservoir connectivity, thereby increasing fluid mobility, while the presence of caves slowed the rate of water invasion. Zhang et al. [13] combined NMR and centrifugation techniques to investigate the water-locking damage mechanism in tight sandstone cores with fractures. Their results showed that fracturing the reservoir creates a complex fracture network, leading to more severe water invasion along the fracture paths. Gao et al. [14] conducted a long core water invasion experiment using tight sandstone to study the dynamic water invasion behavior in homogeneous and heterogeneous bottom water gas reservoirs. The results indicated that the water invasion pattern in heterogeneous bottom water gas reservoirs is governed by the permeability superposition pattern. Additionally, the proximity of tight reservoirs to bottom water can effectively slow the rate of water invasion. Huang et al. [15] classified the types of water invasion by analyzing changes in the water–gas ratio of gas well production across different types of carbonate reservoirs. Their results showed that water breakthrough occurs earlier in reservoirs with well-developed fractures, and the water–gas ratio increases more rapidly following breakthrough. Previous studies mainly focused on water invasion simulation experiments based on core images obtained from CT scanning [16,17,18].
However, most previous studies have overlooked the impact of fracture size and density on the water invasion behavior in pore–fracture reservoirs and have not accounted for the significant influence of matrix pore permeability heterogeneity. Currently, the mechanisms by which fractures affect the distribution characteristics of water-locked gas remain unclear, highlighting the need for further research in this area. Compared to two-dimensional pore–throat structure analysis methods such as casting thin sections and scanning electron microscopy [19], CT scanning effectively extracts the three-dimensional characteristics of the reservoir’s pore–throat structure [20]. Microscopic visualization of thin sections provides an intuitive representation of the dynamic process of water invasion within the pores. The integration of these two technologies enables a comprehensive study of the water invasion mechanism in fracture–pore reservoirs while accurately characterizing the planar distribution of residual gas and formation water.
To address this, the present study integrates core CT scanning with laser etching technology. Using CT scanning images of the pore–fracture type core from the Deng 4 gas reservoir in the Anyue Gas Field, a laser-etched transparent simulation model of the core was carefully designed and produced. These models accurately represent the pore characteristics of fractures and interlayer heterogeneity in actual reservoirs. A gas–water two-phase microscopic seepage experiment was conducted using these models to explore the distribution characteristics of water-sealed gas in various configurations, while also quantitatively characterizing the gas–water two-phase microscopic distribution. The findings of this research are expected to provide valuable theoretical support for enhancing the development efficiency of such gas reservoirs.

2. Methodology

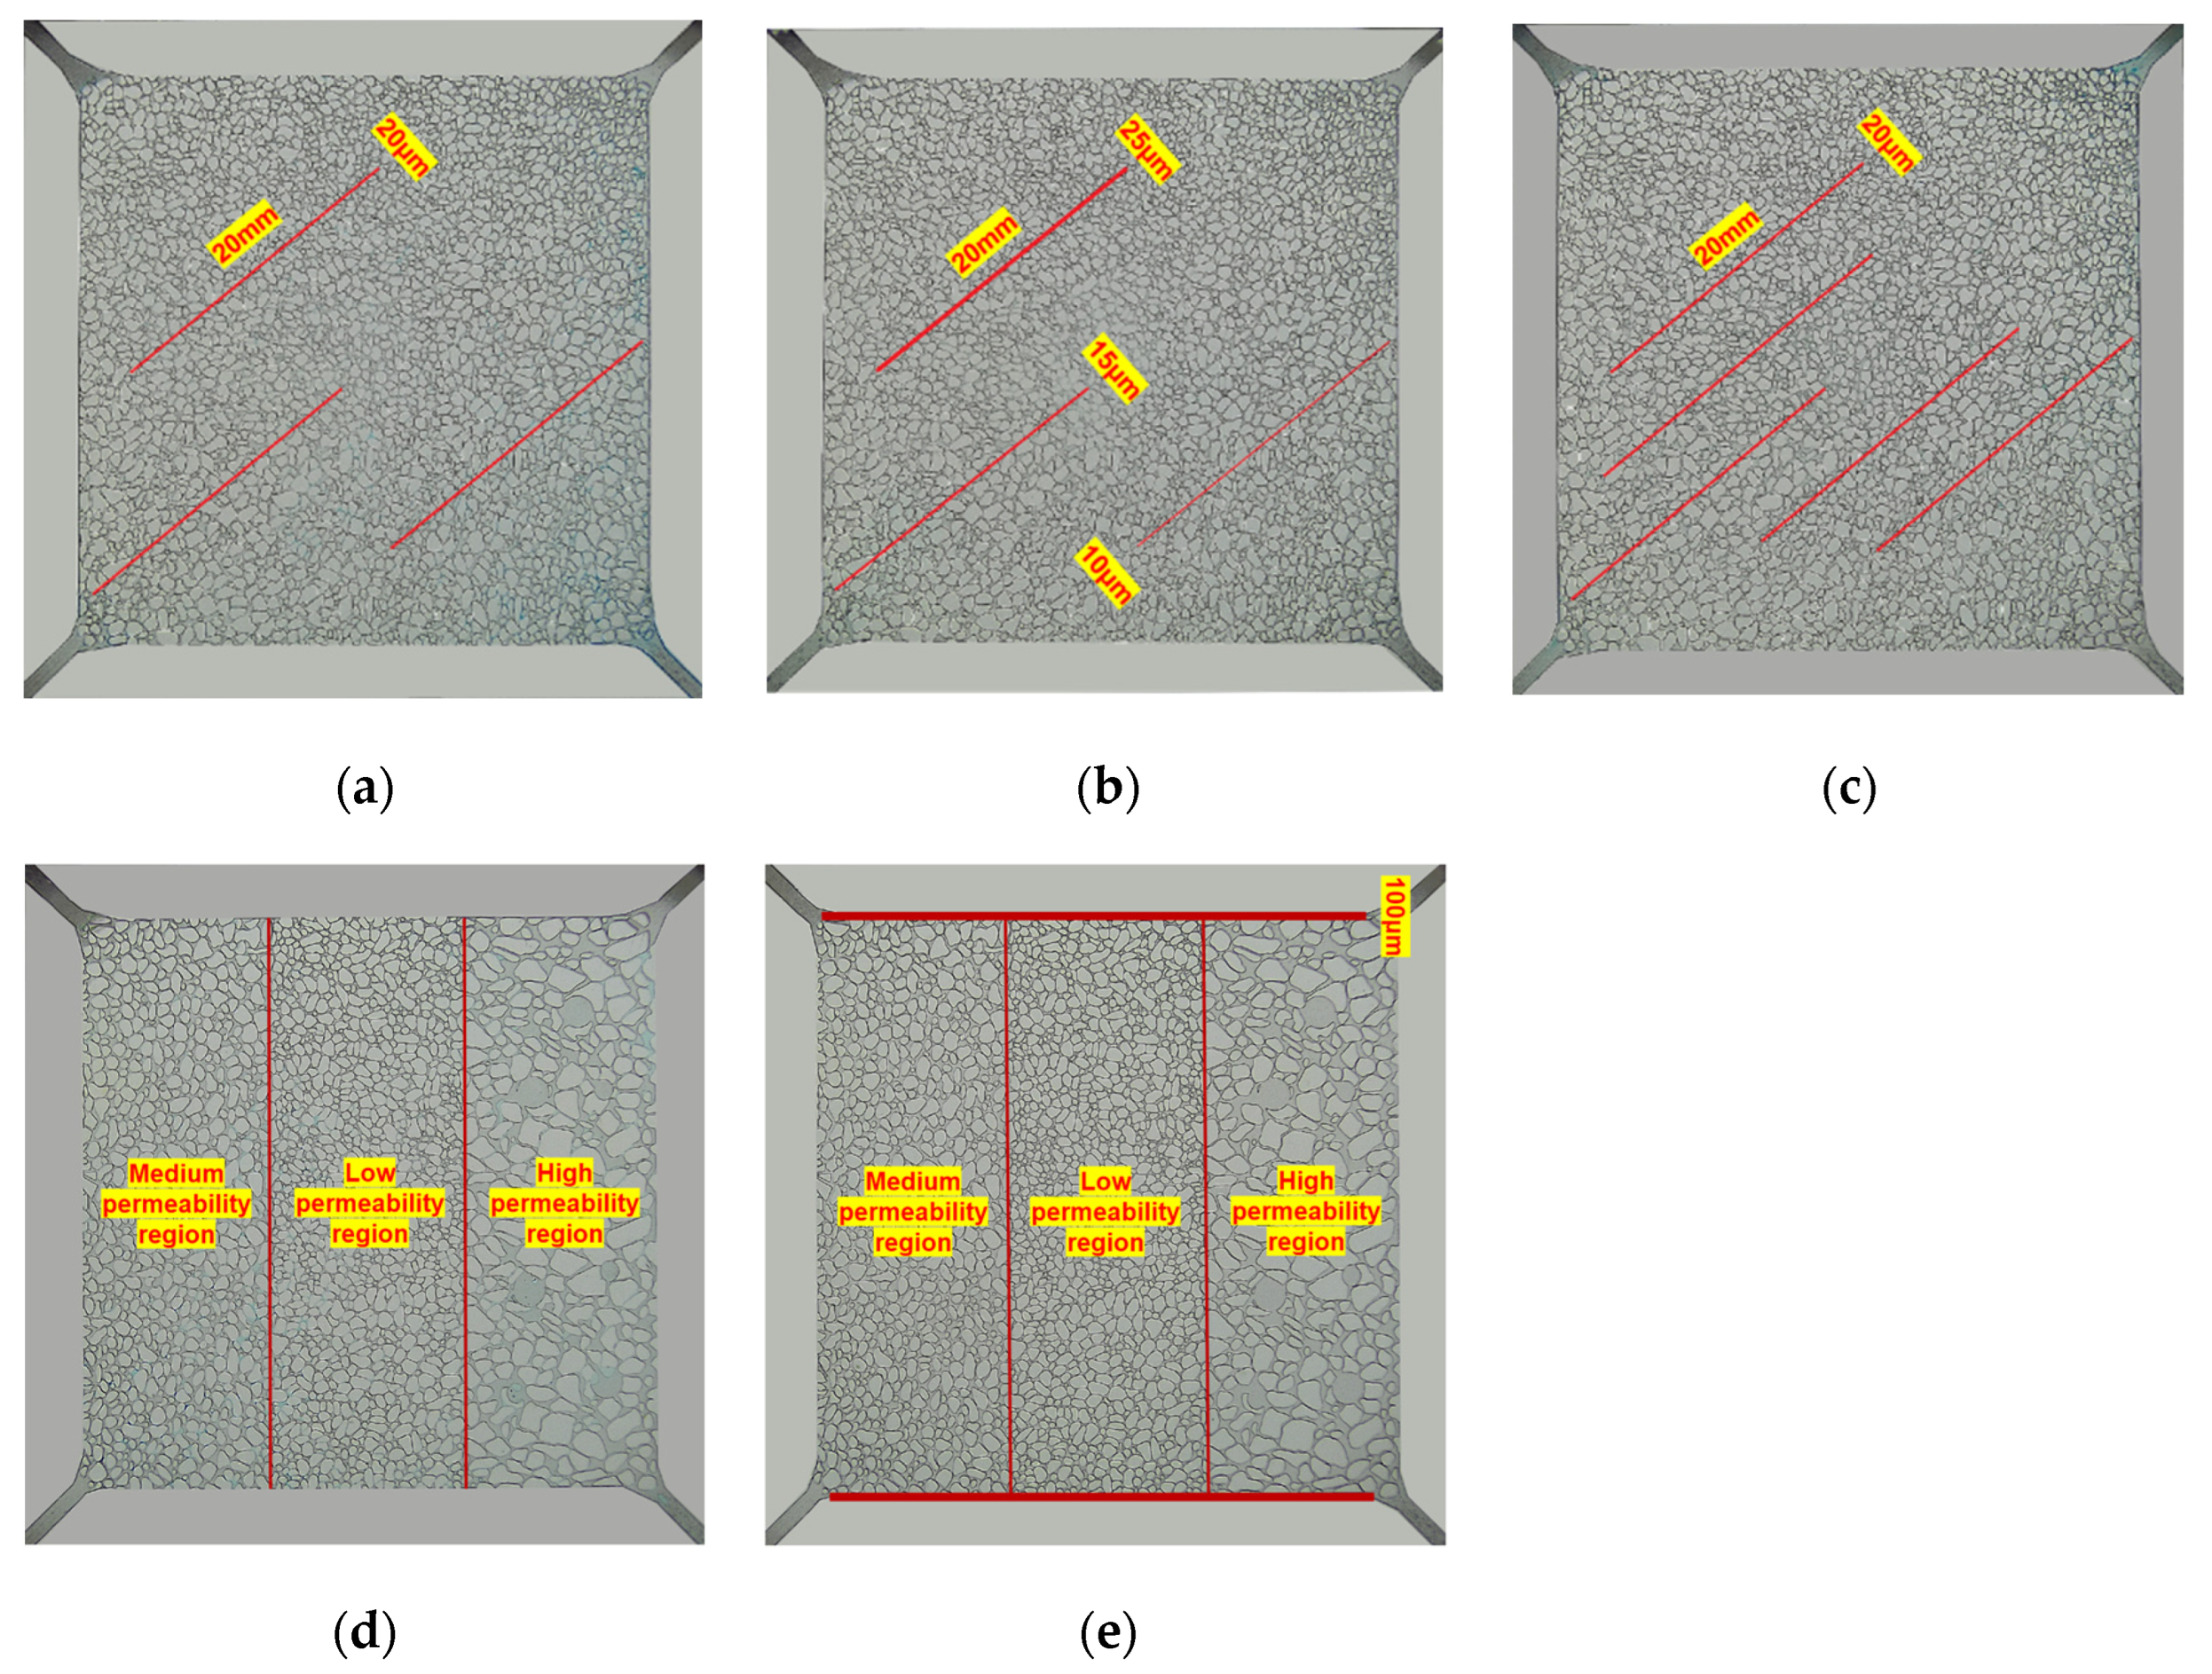
2.1. Fracture Model Extraction

To simulate the pore structure and distribution characteristics of fractures in gas reservoirs, representative core samples from the fourth member of the Dengying reservoir in the Gaoshiti–Moxi area of the Anyue gas field were scanned using micro-CT imaging (Phoenix V|tome|x M, Waygate Technologies, GE). The CT scan images were processed to extract relevant features. Notable structural stress fractures, along with several additional fractures, were observed in the samples (Figure 1a). The probability of fracture occurrence is higher in areas with lower core density, typically where algae are more developed, with fracture widths generally ranging from 10 to 30 μm. Using laser etching technology, a visual microscopic model exhibiting distinct fracture development was created (Figure 1b).

2.2. Microscopic Visualization Model Design

The microscopic visualization model used in this study has an effective size of 35 mm × 35 mm × 3.6 mm, and the model material is water-wet. Due to the limitation of model size, the model in this paper can only be used to describe the water invasion behavior in local reservoir micro-fractures but cannot reflect the influence of medium and large-sized fractures on the macroscopic water invasion behavior of the reservoir. In order to study the effects of nonuniform-width fractures, fracture density, and matrix permeability heterogeneity on the water invasion behavior of fracture–pore reservoirs, a total of five different microscopic visualization models were designed for the experiment (Figure 2): (1) Model 1 features low matrix permeability, with three fractures, each measuring 20 mm in length and 20 μm in width. These are evenly distributed within the model. Model 2 also has low matrix permeability, but the fractures, with lengths of 20 mm, have widths of 25 μm, 15 μm, and 10 μm, respectively, and are distributed within the model. (2) Model 3 also exhibits low matrix permeability, but contains five fractures, each 20 mm in length and 20 μm in width. These are evenly distributed. (3) Model 4 consists of three regions with differing permeability—“low”, “medium”, and “high”—and has no seepage channels at the boundary. Model 5 is similarly divided into three permeability regions of “low”, “medium”, and “high”, but includes two seepage channels, each 100 μm wide, at the boundary. The matrix area is divided according to the average throat radius, and the average throat radii of the low, medium, and high permeability zones are 20 μm, 100 μm, and 300 μm, respectively.
The experimental data of natural gas composition in the study area show that more than 95% of the natural gas in the area is CH4. In the experiment, 99.99% high-purity nitrogen was used to simulate reservoir natural gas, while CaCl2 brine was used as experimental water. Additionally, turquoise water-soluble pigment was added to the brine to distinguish it from the colorless nitrogen.

2.3. Visualized Water Intrusion Experiment Process

The specific procedure for the visualization water invasion experiment is as follows: (1) fix the visualization model onto the clamp, connect the experimental apparatus as shown in Figure 3, and verify the integrity of the pipeline; (2) evacuate the model with synthetic brine, set the back pressure to 6 MPa, the confining pressure to 8 MPa, and heat the model to 50 °C; (3) inject nitrogen into the model at a flow rate of 2 μL/min until no water is produced at the outlet of the model, and record the gas and water production at the outlet in real time; (4) set the injection pressure to 6.1 MPa (simulating a rigid water body), continue injecting brine into the model until gas production ceases at the outlet, and record the gas and water production in real time; (5) finally, use the software Image J (1.54p, National Institutes of Health, Bethesda, MD, USA) to identify the pixels of the image and quantitatively calculate the areas of nitrogen and brine.

3. Experimental Results and Discussion

3.1. Effect of Fracture Size on Water-Sealed Gas

3.1.1. Distribution Characteristics of Fluid Saturation

Figure 4 illustrates the change in fluid saturation over time for the two fracture size configuration models. During the initial stage of water invasion (0–10 s), water saturation increased rapidly in both models, which can be attributed to the swift invasion of formation water along the fractures. In the mid-stage (10–30 s), the rate of water saturation increases, as seen in Model 2 (fracture size heterogeneity), and is slowed down. This is primarily due to the higher flow resistance in the narrow fracture areas, causing formation water to first bypass the narrow fractures and break through the wider fractures, effectively displacing part of the gas in the vicinity of the narrow fractures. From 30 s until the end of the water invasion process, the rate of saturation changes, and in both models, it slows down. However, the final gas saturation in Model 1 (fracture size homogeneity) was 23.97%, which is 5.79% lower than that in Model 2. This indicates that the heterogeneity of fracture size exacerbates the heterogeneous invasion of formation water in the reservoir, causing more natural gas to be trapped by formation water and meaning that it cannot be produced.

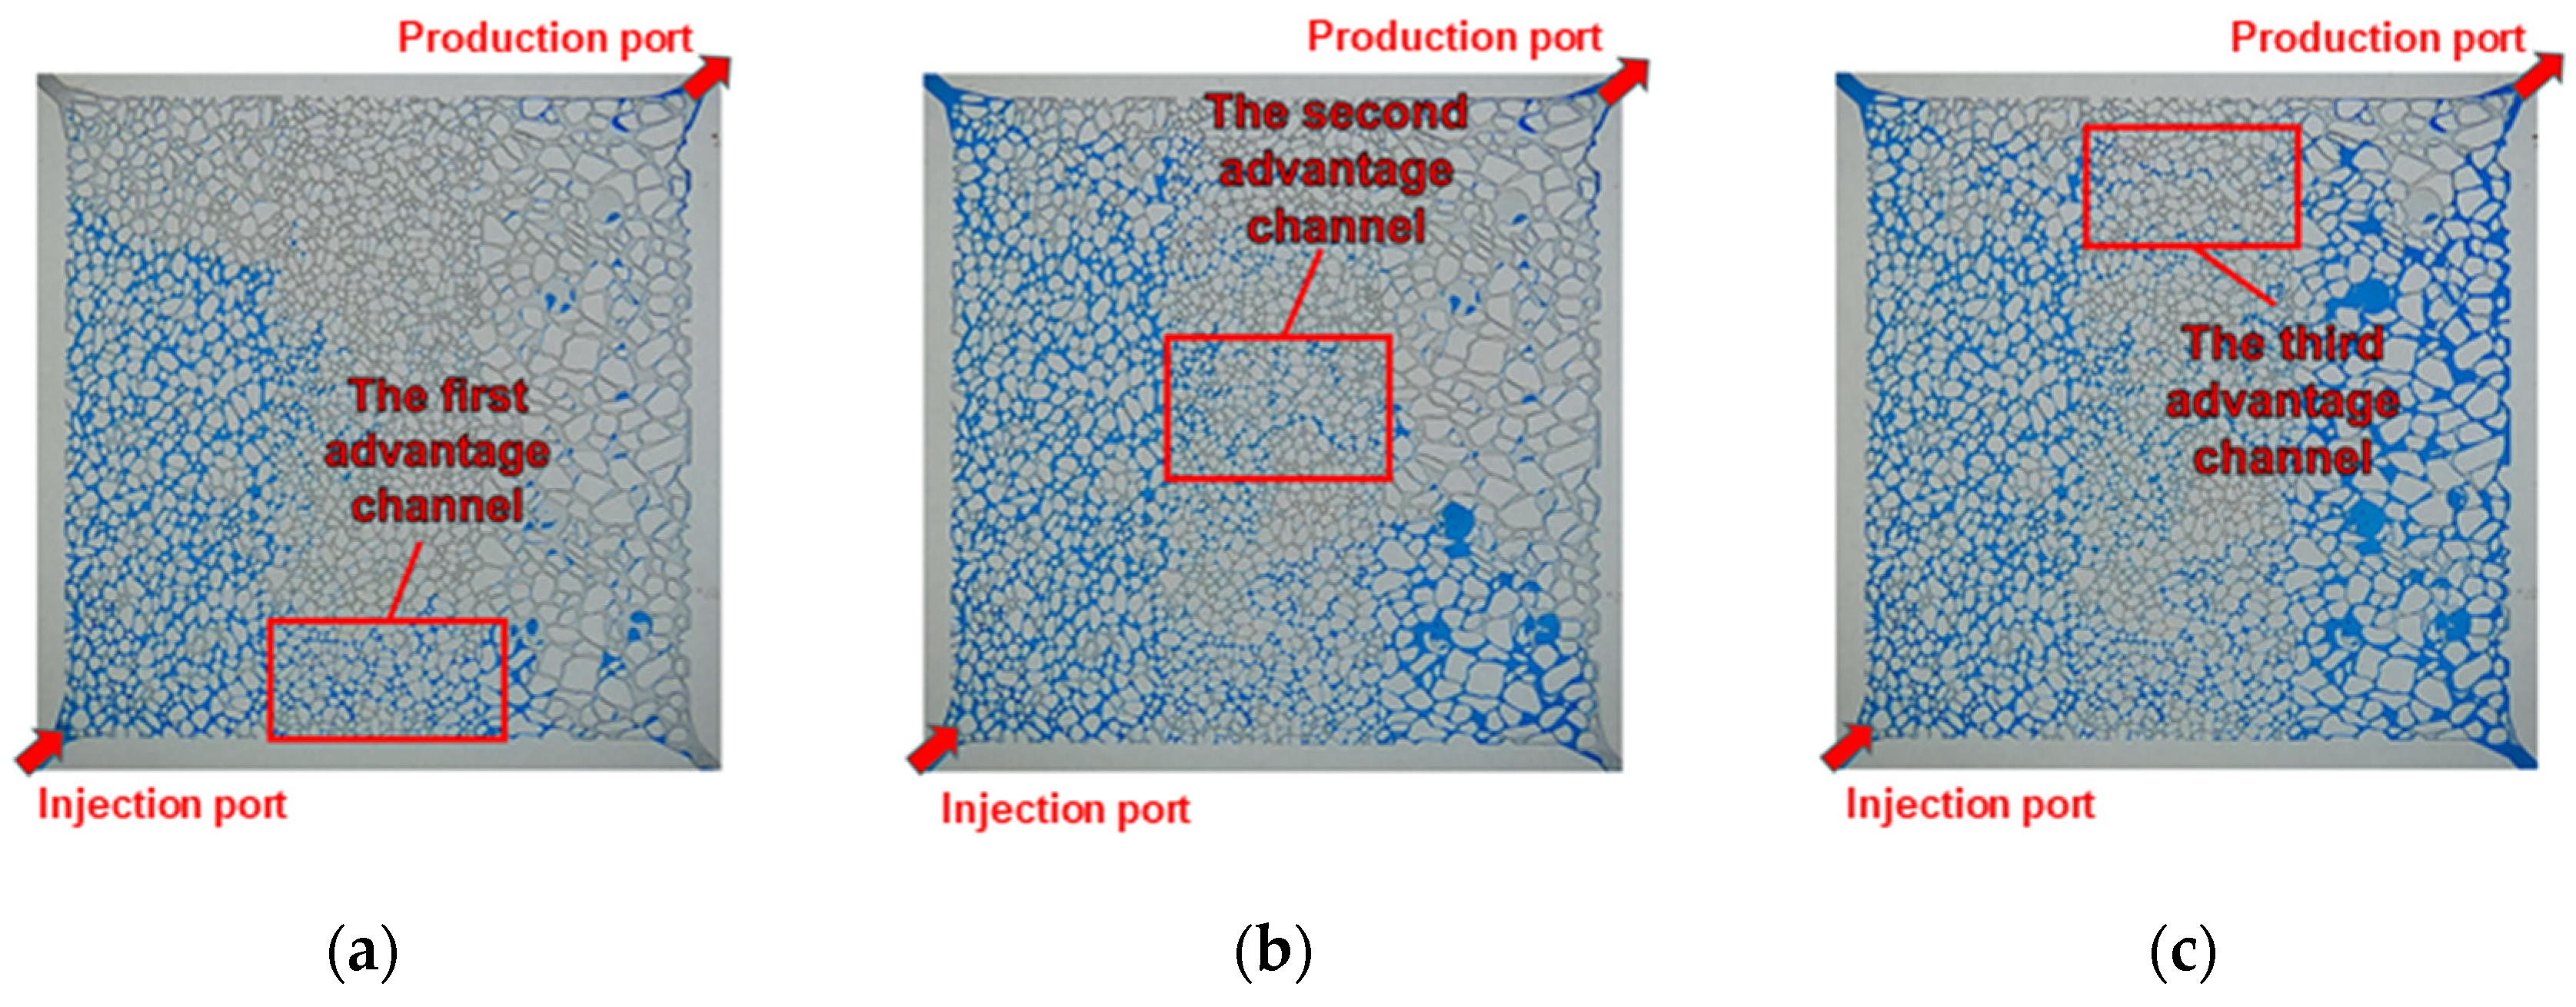
3.1.2. Distribution Characteristics of Water-Sealed Gas

The gas–water interface in the three fractures of Model 1 exhibits similar advancement rates during water invasion, suggesting that the flow resistance of formation water is uniform across these fractures. As formation water continues to invade, the fractures gradually fill with water, and the formation water begins to penetrate into the surrounding matrix. Since the conditions for water invasion are similar in each fracture, the homogenization displacement mechanism leads to highly synchronized gas–water interface evolution, both within and adjacent to each fracture. As a result, the distribution of the water-sealed gas formed is relatively uniform in each fracture (Figure 5), indicating that the trend in water-sealed gas saturation is similar across different areas near the fractures.
The fractures in Model 2 have different sizes, leading to varying water invasion rates across each fracture. Specifically, wide fractures have larger flow areas and lower flow resistance, allowing formation water to more easily displace gas. In contrast, narrow fractures have smaller flow areas and higher flow resistance, resulting in slower formation water invasion and a greater volume of water-sealed gas in these areas. As shown in Figure 6, the distribution of water-sealed gas increases from less to more, and the volume expands from small to large as the fracture size decreases from wide to narrow.

3.2. Effect of Fracture Density on Water-Sealed Gas

3.2.1. Distribution Characteristics of Fluid Saturation

At the onset of water invasion, the fluid saturation trends in both models were similar. However, as time progressed, the saturation trends diverged. Specifically, Model 1 (low fracture density) exhibited a clear slowdown in the increase in water saturation after 10 s of water invasion. This is likely due to the formation water predominantly occupying the higher-permeability areas, while the advancement in the lower-permeability regions was constrained, preventing complete gas displacement. In contrast, Model 3 (high fracture density) demonstrated a more rapid increase in water saturation and a continuous decrease in gas saturation throughout the experiment, indicating that higher fracture density significantly enhances water displacement efficiency. This increased efficiency allows water to penetrate various parts of the reservoir, including regions with lower permeability. The curve for Model 3 flattened in the later stages, with the final gas saturation reaching 21.39%, which is 2.58% lower than that of Model 1 (Figure 7).

3.2.2. Distribution Characteristics of Water-Sealed Gas

Figure 8 shows the distribution of water-sealed gas in Model 1 and Model 3, respectively. Compared with Model 1, Model 3 has more fractures and a smaller overall seepage resistance of formation water, which leads to more complete gas displacement in the pores. In addition, the distribution of water-sealed gas in Model 3 is more dispersed. Although there are more bubbles, their sizes are smaller (Figure 8b). The average diameter of water-sealed gas bubbles in Model 3 is 48.02 μm smaller than that in Model 1, while Model 1 is prone to forming water-sealed gas with a larger range and concentrated distribution (Figure 8a).

3.3. Effect of Permeability Heterogeneity on Water-Sealed Gas

3.3.1. Distribution Characteristics of Fluid Saturation

The gas–water saturation distribution curves for each region in Model 4 (Figure 9a) show that the ultimate gas saturation in the low-permeability region is 30.23%, which is significantly higher than the 22.32% and 23.53% obtained in the medium- and high-permeability regions. In Model 5 (Figure 9b), due to the presence of seepage channels, the gas saturation in the low-permeability region is 38.56%, which is significantly higher than the 26.51% and 28.62% in the medium- and high-permeability regions. The overall gas saturation in Model 5 is 5.87% higher than that in Model 4.
During the early stages of water invasion, water in Model 4 predominantly occupies the higher-permeability regions, causing a rapid increase in water saturation. As water invasion progresses, water gradually advances into the low-permeability regions, slowing the rate of water saturation growth. The increase in water saturation in the high-permeability region lags, primarily because water must first pass through the low-permeability region to form a dominant flow channel before reaching the high-permeability areas. In contrast, in Model 5, the presence of seepage channels allows formation water to penetrate high-permeability areas more quickly and easily, resulting in an earlier rise in water saturation in these regions compared to Model 4. However, the number of dominant channels in the low-permeability areas is reduced, leading to a slower increase in water saturation in these regions during the early stages. As a large amount of gas in the low-permeability area of Model 5 was not effectively displaced in the early stages, it becomes more difficult to displace the remaining gas later, due to pressure differences and imbibition. This ultimately results in significantly lower gas saturation in the low-permeability areas of Model 5 compared to those in Model 4.

3.3.2. Distribution Characteristics of Water-Sealed Gas

The regional gas–water saturation distribution curves of Models 4 and 5 reveal that the difference in gas saturation between the two models after the water invasion experiment is primarily due to the variation in gas saturation in the low-permeability areas. In Model 4 (Figure 10a), the closed gas in the low-permeability area is mainly distributed in the pores, appearing relatively dispersed and covering a small area. This suggests high water drive efficiency and a small remaining gas volume. In contrast, in Model 5 (Figure 10b), the closed gas in the low-permeability area is more concentrated, with gas bubbles in the pores connected by large, dominant channels to form a substantial closed gas network. This indicates lower water drive efficiency and a larger remaining gas volume.
During the water invasion experiment of Model 4, it was observed that, when formation water occupied about one-quarter of the volume of the medium-permeability area, the gas flow rate in the high-permeability region increased due to a higher-pressure gradient. This increase in pressure gradient created local high-pressure zones in the low-permeability areas, which facilitated the flow of water into these regions. Specifically, the first dominant channel formed in the low-permeability area near the injection end (Figure 11a), marking the initiation of water seepage into the high-permeability area. As the experiment progressed, when the medium-permeability area was nearly saturated with water, the overall pressure gradient continued to rise, resulting in the formation of a second dominant channel in the middle of the low-permeability area (Figure 11b). This significantly accelerated the water seepage into the high-permeability region. Shortly thereafter, a third dominant channel formed at a location far from the injection end, near the outlet end (Figure 11c). At this point, the high-permeability area was almost completely occupied by formation water, leading to water breakthrough at the outlet end. Simultaneously, the three dominant channels had displaced most of the gas in the low-permeability region, with the remaining gas being displaced towards the outlet due to the pressure difference. As a result, the closed gas was primarily distributed in the pores, appearing more dispersed and covering a smaller area.
Model 5 features seepage channels on both sides near the inlet and outlet ends, which play critical roles in the water invasion process. Compared to Model 4, the first dominant channel formed in Model 5 is relatively narrow (Figure 12a). This narrow dominant channel forms primarily because the seepage resistance of the channel is lower than that of the low-permeability area, allowing most of the formation water to directly enter the high-permeability region via the seepage channel. Only a small amount of formation water enters the low-permeability area through pressure differences and imbibition, resulting in a narrower seepage channel. As the experiment progresses, when the medium-permeability area is near complete saturation, a second dominant channel begins to form (Figure 12b), exhibiting similar characteristics to the first channel and appearing narrower. These two dominant channels work together to facilitate the flow of formation water from the medium-permeability area into the high-permeability region.
It is worth noting that, compared to Model 4, Model 5 only formed two dominant channels during the entire water drive process. Moreover, both channels are narrow, and only a small portion of the gas in the low-permeability area is effectively displaced. Due to the presence of seepage channels, water preferentially flows along paths with higher permeability, reducing the pressure difference between the medium- and low-permeability areas. This makes it difficult for formation water to infiltrate the low-permeability area. As a result, most of the gas remains as closed gas and cannot be effectively displaced. This leads to a concentrated distribution of closed gas, where bubbles in the pores are connected by dominant channels, forming a large-area closed gas network.

4. Gas Reservoir Development Proposal

In this study, the water-sealed gas saturation of the microscopic visualized thin section after water flooding is approximately 25%, which closely aligns with the residual gas saturation observed in natural core permeability experiments on carbonate rocks reported in the literature [1]. This indirectly validates the effectiveness of the research methodology employed in this study.
Compared to the visualized thin sections, fracture–pore reservoirs exhibit a more complex three-dimensional fracture network and stronger heterogeneity. During water invasion, a larger scale of water-sealed gas is likely to form. Therefore, for fracture–pore reservoirs with edge or bottom water, identifying the gas–water interface and understanding the spatial distribution of fractures are critical for efficient development. Optimally placing wells in fracture-rich zones far from the gas–water interface can significantly enhance single-well productivity while minimizing the risk of water production. Conversely, if a well is located near the gas–water interface, the production pressure differential must be carefully controlled to prevent rapid water encroachment along the fracture network, which could lead to premature flooding and well shutdown.

5. Conclusions

This study employed CT scanning technology to extract the pore characteristics of natural fractures and, based on these data, used laser etching technology to construct the microscopic visualization model. The study focused on investigating the effects of fracture size, fracture density, and permeability heterogeneity on the distribution of water-sealed gas in pore–fracture carbonate gas reservoirs subjected to water invasion. The key conclusions of this study are as follows:
(1) The homogeneity of fracture size in carbonate gas reservoirs enhances water drive efficiency, resulting in a 5.79% reduction in the water-sealed gas volume compared to models with heterogeneous fracture sizes, while simultaneously increasing water saturation. In contrast, fracture size heterogeneity reduces water drive efficiency and increases the volume of water-sealed gas.
(2) Increasing fracture density in carbonate gas reservoirs significantly improves water drive efficiency, accelerates the rate of water saturation increase, and more effectively displaces gas, thereby reducing the volume of water-sealed gas. The water-sealed gas volume in the high-density model is 2.58% lower than that in the low-density model.
(3) In carbonate gas reservoirs with “medium–low–high” permeability heterogeneity, formation water preferentially enters the medium- and high-permeability areas, establishing dominant channels in the low-permeability regions. When seepage channels are present in the “medium–low–high” permeability zones, the number and width of these dominant channels decrease. The water-sealed gas volume in the model without seepage channels is reduced by 5.87% compared to the model with seepage channels.

Author Contributions

Conceptualization, S.Y.; methodology, S.Y.; validation, J.H.; formal analysis, H.B.; investigation, Y.C.; resources, Q.M.; data curation, B.W.; writing—original draft preparation, Y.J.; writing—review and editing, J.H.; visualization, Q.L.; supervision, S.Y.; project administration, H.B.; funding acquisition, Y.J. All authors have read and agreed to the published version of the manuscript.

Funding

This research is supported by the Sichuan Provincial Natural Science Foundation Project (2023NSFSC0261).

Data Availability Statement

The data that has been used are confidential.

Conflicts of Interest

Authors Yi Jiang, Yingli Chen and Qingyan Mei were employed by the company PetroChina Southwest Oil & Gasfield Company. The remaining authors declare that the research was conducted in the absence of any commercial or financial relationships that could be construed as a potential conflict of interest.

References

  1. Hu, J.; Yang, S.; Wang, B.; Deng, H.; Wang, M.; Li, J.; Zhao, S.; Shen, B.; Gao, X.; Yang, K. Effect of Pore Structure Characteristics on Gas-Water Seepage Behaviour in Deep Carbonate Gas Reservoirs. Geoenergy Sci. Eng. 2024, 238, 212–881. [Google Scholar] [CrossRef]
  2. Jia, A.; Yan, H.; Guo, J.; He, D.; Cheng, L.; Jia, C. Development Characteristics for Different Types of Carbonate Gas Reservoirs. Acta Pet. Sin. 2013, 34, 914–923. [Google Scholar] [CrossRef]
  3. Zhang, R.; Lu, G.; Peng, X.; Li, L.; Hu, Y.; Zhao, Y.; Zhang, L. Study on the Mechanism of Gas-Water Two-Phase Flow in Carbonate Reservoirs at Pore Scale. Petroleum 2023, 10, 631–645. [Google Scholar] [CrossRef]
  4. Liu, G.; Xie, S.; Tian, W.; Wang, J.; Li, S.; Wang, Y.; Yang, D. Effect of Pore-Throat Structure on Gas-Water Seepage Behaviour in a Tight Sandstone Gas Reservoir. Fuel 2022, 310, 121901. [Google Scholar] [CrossRef]
  5. Zhou, Y.; You, L.; Kang, Y.; Xie, B.; Cheng, Q. Experimental Study of the Fracture Initiation through the Synergy of Spontaneous Imbibition and Hydration of Residual Fracturing Fluids in Shale Gas Reservoirs. J. Nat. Gas Sci. Eng. 2022, 102, 104577. [Google Scholar] [CrossRef]
  6. Li, Q.; Li, Q.; Wu, J.; Li, X.; Li, H.; Cheng, Y. Wellhead Stability During Development Process of Hydrate Reservoir in the Northern South China Sea: Evolution and Mechanism. Processes 2025, 13, 40. [Google Scholar] [CrossRef]
  7. Li, Q.; Li, Q.; Cao, H.; Wu, J.; Wang, F.; Wang, Y. The Crack Propagation Behaviour of CO2 Fracturing Fluid in Unconventional Low Permeability Reservoirs: Factor Analysis and Mechanism Revelation. Processes 2025, 13, 159. [Google Scholar] [CrossRef]
  8. Yong, H.; Yingli, C.; Tao, L. The Formation Development and Theoretical Connotations of “Overall Water Control of Gas Reservoir” Technology in Gas Field Development. Nat. Gas Ind. 2022, 42, 10–20. [Google Scholar] [CrossRef]
  9. Feng, X.; Peng, X.; Li, L.; Yang, X.; Wang, J.; Li, Q.; Zhang, C.; Deng, H. Influence of Reservoir Heterogeneity on Water Invasion Differentiation in Carbonate Gas Reservoirs. Nat. Gas Ind. B 2019, 6, 7–15. [Google Scholar] [CrossRef]
  10. Li, M.; Ma, Z.; Tang, S.; Yue, D.; Li, Q.; Zhang, J.; Tan, L.; An, K.; Li, W.; Wang, W. Water invasion law of carbonate gas reservoir of Longwangmiao Formation in Moxi area, Sichuan Basin. Nat. Gas Geosci. 2023, 35, 366–378. [Google Scholar]
  11. Wang, L.; Yang, S.; Peng, X.; Deng, H.; Wang, Q. Visual Experiments on the Occurrence Characteristics of Multi-Type Reservoir Water in Fracture-Cavity Carbonate Gas Reservoir. Acta Pet. Sin. 2018, 39, 686–696. [Google Scholar] [CrossRef]
  12. Hu, J.; Yang, S.; Jiang, Y.; Deng, H.; Wang, M.; You, L.; Li, Q.; Bai, H.; Shen, B. Experimental Study on Edge Water Invasion of Strongly Heterogeneous Carbonate Gas Reservoirs Based on NMR Technology. Processes 2024, 12, 1361. [Google Scholar] [CrossRef]
  13. Zhang, J.; Tang, Y.; Wang, H.; Huang, L.; Liao, F.; Liu, Y.; Chen, Y. Study on the Mechanism of Water Blocking in Tight Sandstone Gas Reservoirs Based on Centrifugal and Nuclear Magnetic Resonance Methods. Energies 2022, 15, 6680. [Google Scholar] [CrossRef]
  14. Gao, S.; Yang, M.; Ye, L.; Liu, H.; Zhu, W. Simulation Experiment of Water Invasion Performance in Low-Permeability Bottom Water Gas Reservoir and Its Influence on Recovery Factor. Nat. Gas Ind. 2022, 42, 61–70. [Google Scholar]
  15. Huang, S.; Liu, J.; Sun, J.; Geng, M. Water Invasion Mode of Carbonate Gas Reservoirs Controlled by Edge Water: Three Invasion Modes. Front. Energy Res. 2022, 10, 860527. [Google Scholar] [CrossRef]
  16. Xu, R.; Yang, S.; Li, M.; Wang, J.; Dong, Z.; Xie, P.; Jin, Y.; Wang, X. Experimental Study on Unstable Imbibition Characteristics of Fracturing Fluids at High Pressures and Temperatures in the Tight Continental Reservoir. Geoenergy Sci. Eng. 2023, 221, 211362. [Google Scholar] [CrossRef]
  17. Wang, R.; Zhang, C.; Chen, D.; Yang, F.; Li, H.; Li, M. Microscopic Seepage Mechanism of Gas and Water in Ultra-Deep Fractured Sandstone Gas Reservoirs of Low Porosity: A Case Study of Keshen Gas Field in Kuqa Depression of Tarim Basin, China. Front. Earth Sci. 2022, 10, 893701. [Google Scholar] [CrossRef]
  18. He, F.; Wang, J. Study on the Causes of Water Blocking Damage and Its Solutions in Gas Reservoirs with Microfluidic Technology. Energies 2022, 15, 2684. [Google Scholar] [CrossRef]
  19. Yin, X.; Shu, J.; Li, Y.; Gao, W.; Lu, J. Impact of Pore Structure and Clay Content on the Water-Gas Relative Permeability Curve within Tight Sandstones: A Case Study from the LS Block, Eastern Ordos Basin, China. J. Nat. Gas Sci. Eng. 2020, 81, 103418. [Google Scholar] [CrossRef]
  20. Zhao, Y.; Han, C.; Sun, Y.; Danesh, N.N.; Liu, T.; Gao, Y. Nano- to Micro-Pore Characterization by Synchrotron Radiation SAXS and Nano-CT for Bituminous Coals. Front. Earth Sci. 2021, 15, 189–201. [Google Scholar] [CrossRef]
Figure 1. Extracting the pore structure of natural fractures from natural cores: (a) CT scanning image of natural core and (b) microscopic visualization model.
Processes 13 00979 g001
Figure 2. Microscopic visualization model: (a) Model 1; (b) Model 2; (c) Model 3; (d) Model 4; (e) Model 5.
Processes 13 00979 g002
Figure 3. Water intrusion experiment flowchart, using microscopic visualization equipment.
Processes 13 00979 g003
Figure 4. Comparison of fluid saturation changes between Model 1 and Model 2 during the water invasion experiment.
Processes 13 00979 g004
Figure 5. Local water-sealed gas distribution after the water invasion experiment in Model 1.
Processes 13 00979 g005
Figure 6. Local water-sealed gas distribution after the water invasion experiment in Model 2.
Processes 13 00979 g006
Figure 7. Comparison of fluid saturation changes between Model 1 and Model 3 during the water invasion experiment.
Processes 13 00979 g007
Figure 8. Local water-sealed gas after water invasion experiment: (a) Model 1 and (b) Model 3.
Processes 13 00979 g008
Figure 9. Fluid saturation distribution curve of water invasion experiment in different areas with different levels of permeability in Model 4 and Model 5. (a) Model 4. (b) Model 5.
Processes 13 00979 g009
Figure 10. Local water-sealed gas after water invasion experiment: (a) Model 4 and (b) Model 5.
Processes 13 00979 g010
Figure 11. Water invasion process of Model 4: (a) 15 s after water intrusion; (b) 31 s after water intrusion; (c) 53 s after water intrusion.
Processes 13 00979 g011
Figure 12. Water invasion process of Model 5: (a) 20 s after water intrusion; (b) 45 s after water intrusion.
Processes 13 00979 g012
Disclaimer/Publisher’s Note: The statements, opinions and data contained in all publications are solely those of the individual author(s) and contributor(s) and not of MDPI and/or the editor(s). MDPI and/or the editor(s) disclaim responsibility for any injury to people or property resulting from any ideas, methods, instructions or products referred to in the content.

