Abstract
Low-permeability sandstone reservoirs have low permeability, but due to their high porosity and difficulty in development, the development difficulty is relatively high. They can fully tap into the high potential of oil and gas resources in low-permeability sandstone reservoirs and occupy an important position in the global energy supply The study area belongs to low-permeability dense sandstone reservoir, and the destination layer has complex lithology, strong physical inhomogeneity, and complicated pore–permeability relationship, so the conventional core pore–permeability regression method and NMR SDR method do not satisfy the requirements of fine evaluation in terms of the accuracy of permeability calculation. According to the principle of resistivity measurement by electromagnetic waves with Logging While Drilling (LWD), this paper analyzes the reasons for the magnitude of resistivity divergence with Logging While Drilling at different exploration depths. There is a “low invasion phenomenon” during the drilling process of the drill bit. The higher the permeability of the formation, the more severe the “low invasion phenomenon”, and the greater the magnitude of resistivity divergence. In this paper, through the conventional log curve response characteristics and correlation analysis, the P40H/P16H parameter were selected to characterize the magnitude of resistivity divergence, and a fine evaluation model of the reservoir based on the P40H/P16H parameter was established in the study area by relying on the theory of the flow unit, and was applied to the prediction of permeability of new wells. The application results show that the calculated permeability is in good agreement with the results of core analysis, which provides a theoretical basis for the fine evaluation of low-permeability tight reservoirs.
1. Introduction
Logging While Drilling (LWD) occupies an important position in the exploration and development of offshore oil and gas fields, it can be implemented in horizontal wells, and the use of geosteering can be adjusted in real time according to the situation of the drilling trajectory, which greatly improves the rate of oil formation drilling encounter [1]. As offshore oilfields are limited in the number of wells drilled due to the constraints of platform location, drilling cost, and efficiency, it is difficult to form a dense network of wells to carry out the fine evaluation of regional reservoirs, and it is crucial to utilize Logging While Drilling to realize the fine evaluation of reservoir physical properties.
The permeability of low-permeability sandstone reservoirs is relatively low, but the porosity is high, which makes the pore structure of low-permeability reservoirs complex, the rock properties heterogeneous, and the interpretation accuracy of reservoir permeability limited. And the accuracy of interpreting reservoir permeability is a key indicator for oilfield development [2,3]. In the past, permeability modeling is usually based on the relationship between permeability and porosity in core wells, but in the same reservoir, there are often equal porosity and different permeability layers, indicating that for a certain type of rock, a single porosity, permeability relationship is not enough to characterize the different flow units, according to the flow unit, to establish a permeability modeling method [4]. Wang [5] and Zheng [6] found that the permeability model based on the flow unit theory is more accurate and better meets the requirements for precise interpretation of well logging through the study of sand and gravel reservoirs in the Nanhai X Sag. Lu [7] and others achieved good results in tight sandstone reservoirs by using a layered flow unit approach. Ling Dai [8], Jing [9], combined the hierarchical flow unit method with machine learning methods, and Wang Mang [10], combined with neural networks, all accurately delineated the reservoir flow units. Traditional delineation of flow units is often performed using the Flow Zone Index (FZI). Theoretically, FZI is a parameter to determine the pore geometric phase by combining the structural and mineralogical geological features and pore throat features, but the calculation method of FZI is too idealized, which weakens the influence of the non-homogeneity of the pore structure, and the determining factors are actually only two parameters, porosity and permeability, and the precision of dividing the flow unit according to FZI is not enough, which leads to the fact that there is still uneven water drive inside the same unit in the actual development of the method. This leads to the uneven water drive within the same unit in the actual development, and thus cannot meet the requirement for fine division of seepage units in the later stage of development [11,12,13,14]. Because the reservoir heterogeneity in the research area is strong and there is difficulty in dividing the flow units, relying solely on porosity and permeability parameters cannot reflect all the characteristics of the flow unit. Therefore, in this paper, on the basis of fully considering the geological characteristics of the reservoir and fluid characteristics in the study area, comprehensively considering the physical parameters of the core (porosity, permeability), as well as the magnitude of resistivity divergence of Logging While Drilling, and on the basis of the theory of the flow unit, through the analysis of the characteristics of the resistivity response of the oil and gas reservoir in the study area, the permeability calculation model under the control of the magnitude of resistivity divergence was finally established.
2. Regional Geological Features
The study area is located in the X Sag and involves two major formations, the P Formation and the Y Formation, which are the main exploration formations in the X Sag and belong to the middle-upper Eocene [15]. The X sag is a complex half graben formed by tensional stress background, and has experienced several stages of tectonic evolution in the Cenozoic era, such as the period of fault subsidence, argillaceous subsidence, tectonic inversion, and regional subsidence [16]. Group P is generally a set of barrier coast sedimentary system, several deltas originating from the western reef uplift are continuously distributed on the western slope, and the front of the delta is modified by tidal action to form a large area of tidal flats and sand dams [17]. Due to the intersection of two geologic forces, riverine and tidal, on the west slope, a sandstone reservoir with complex depositional characteristics was formed, on top of which, superimposed late diagenetic modifications exacerbated the non-homogeneous nature of the P reservoir physical properties.
Vertically, Group P can be divided into give segments, from top to bottom, P1, P2, P3, P4, and P5, respectively. The lithology of Sections 1–3 of Group P mainly consists of gray mudstone, silty mudstone and light gray silty siltstone, siltstone, fine sandstone, with mud–sand interbedding in the upper part and sand interbedded with mud in the lower part, and with brownish-red, purplish-red, brownish-yellow, and other mottled mudstones developed at the top. The lithology of Sections 4 and 5 of Group P is widely distributed in the whole sag, and the lithology is mainly gray, dark gray silty mudstone, mudstone with gray, and light gray muddy siltstone, siltstone, fine sandstone, conglomerate-bearing sandstone, conglomerate, etc., and sandwiched [18].
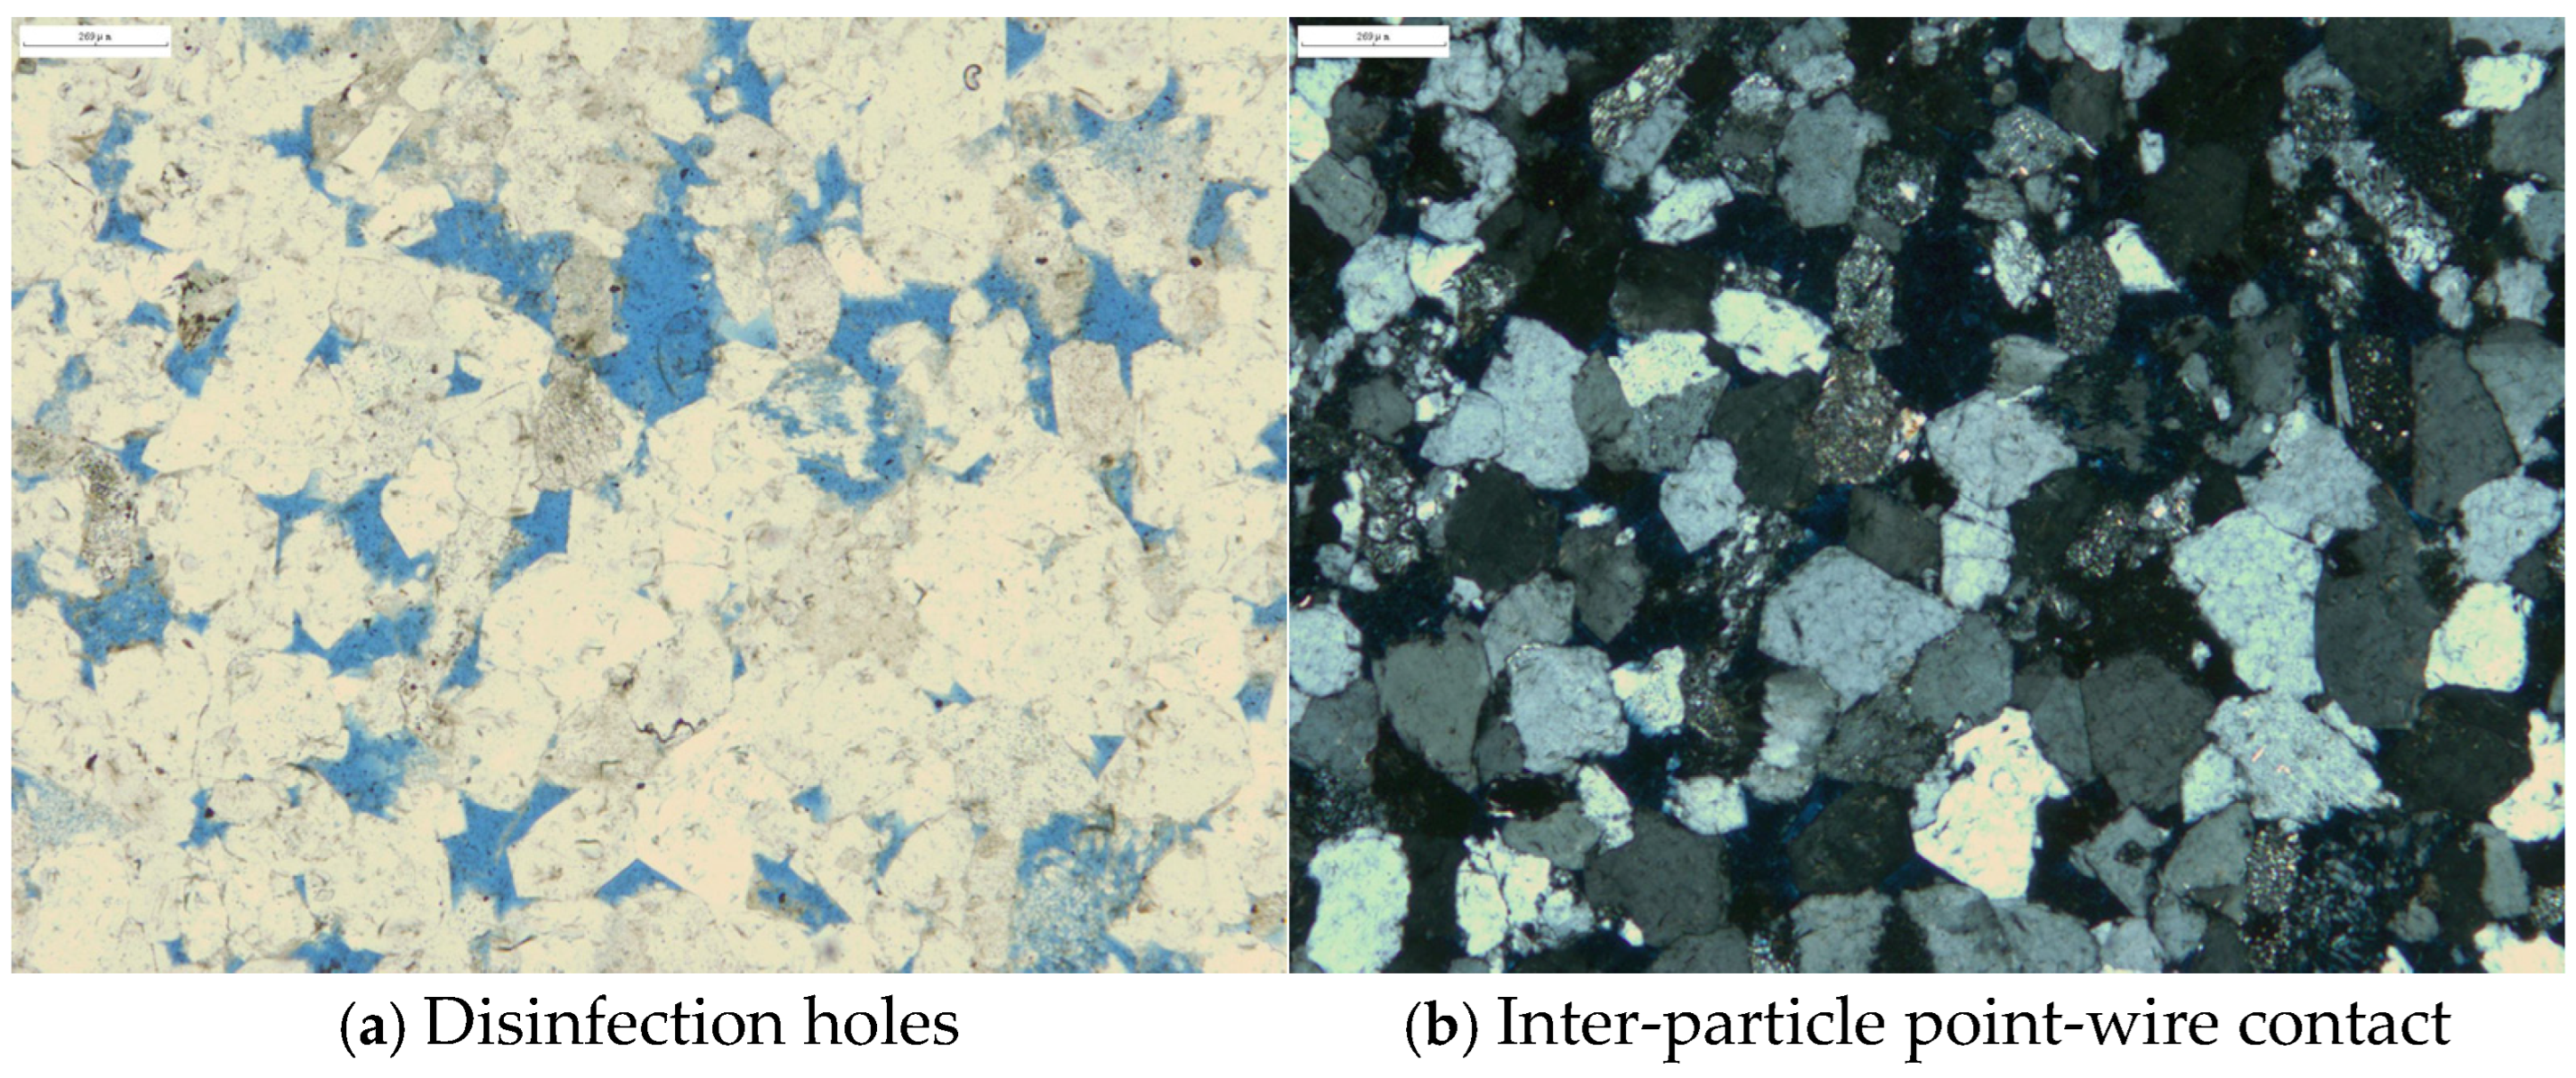
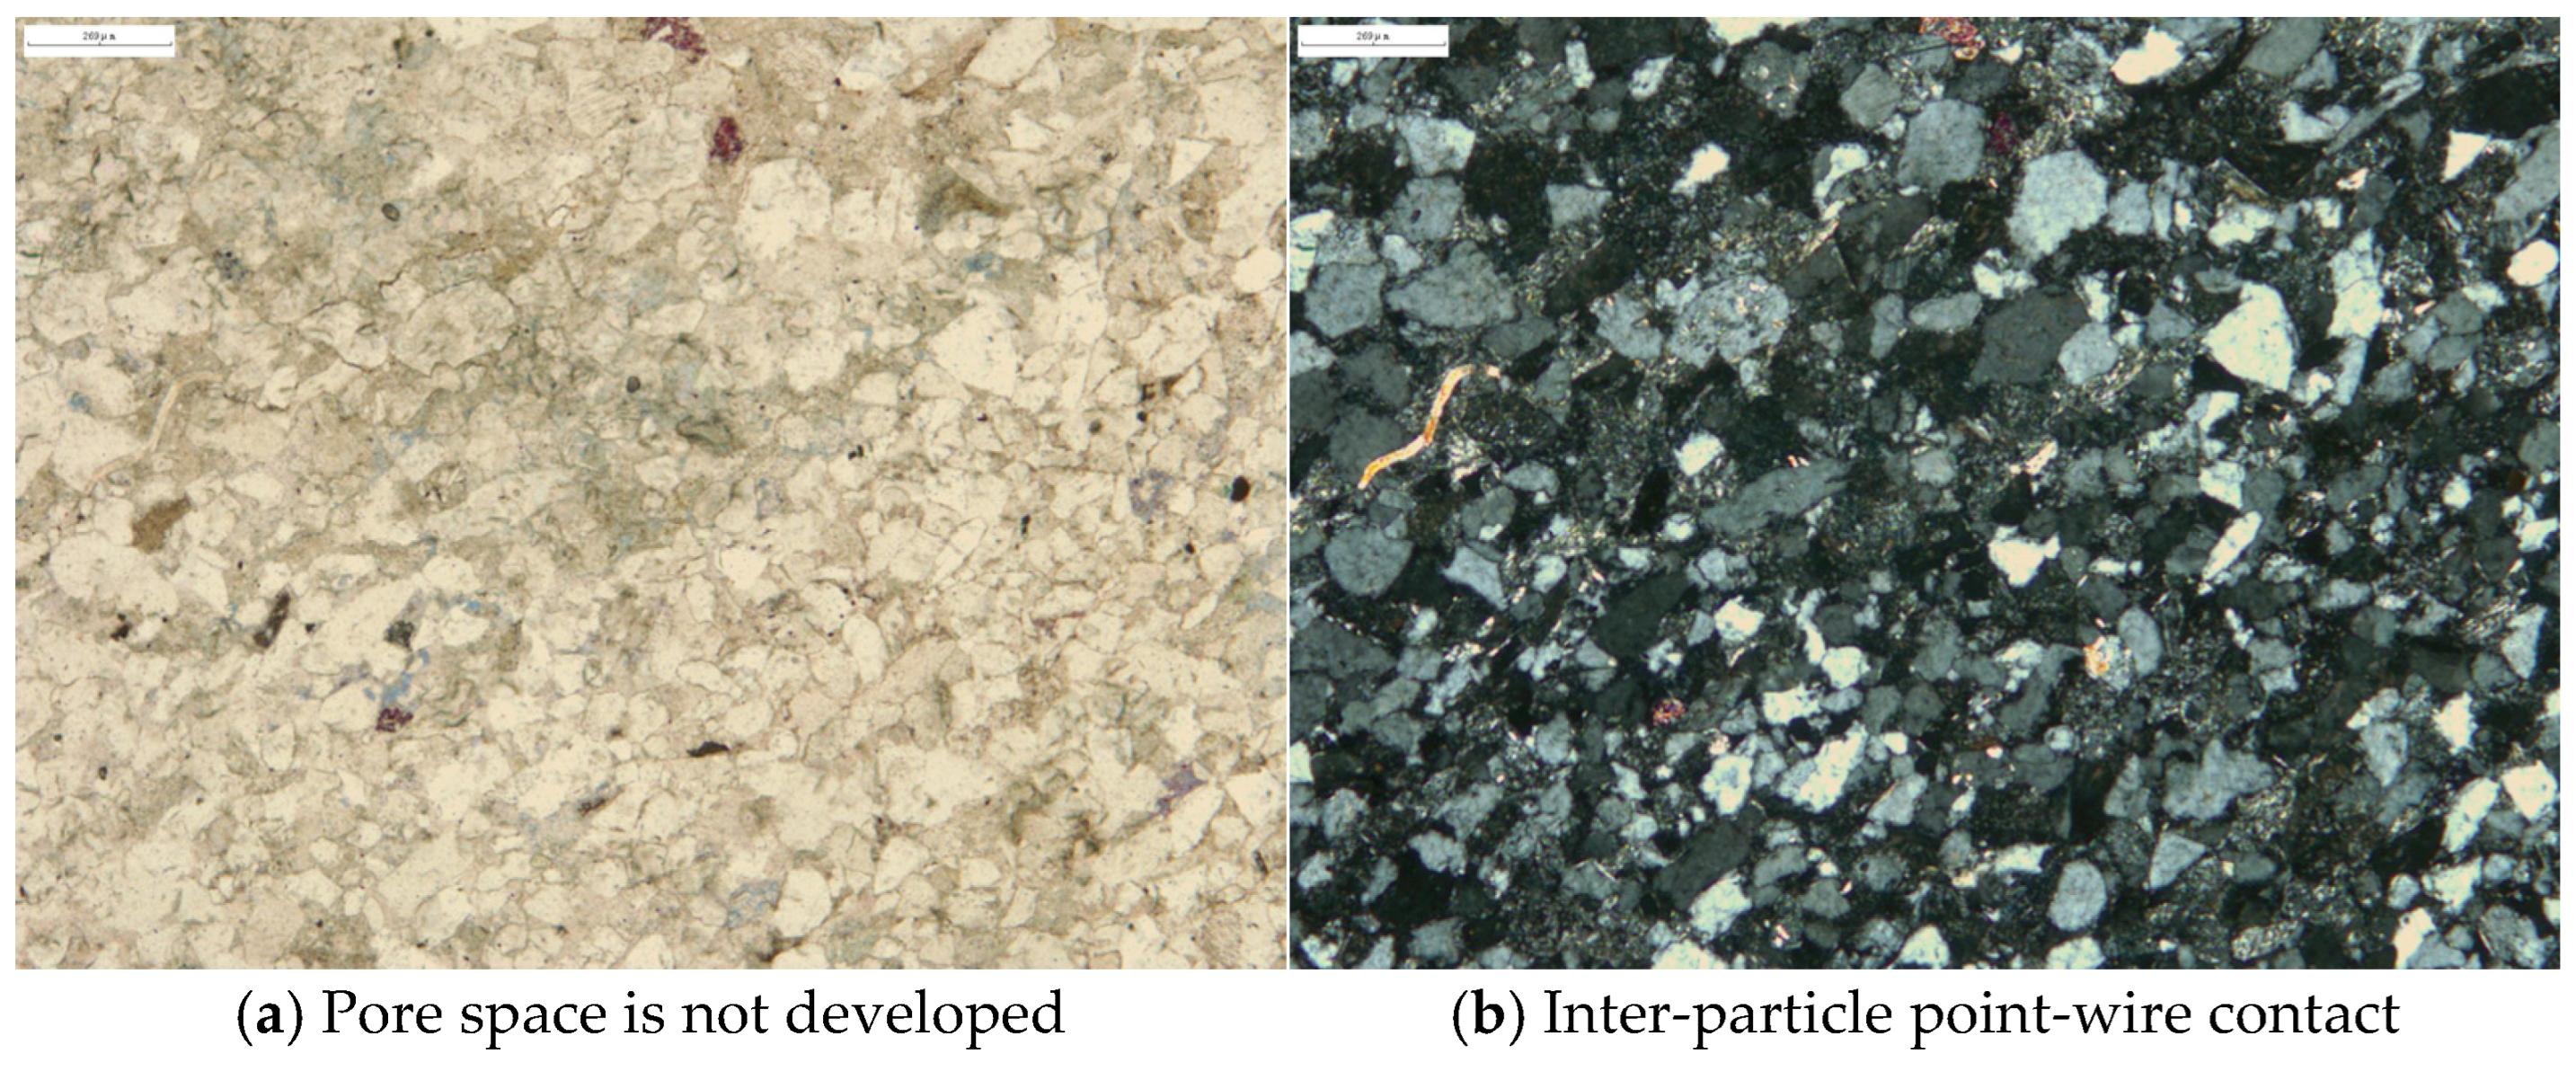
Vertically, Group Y can be divided into upper and lower segments. The upper sand group in the study area is dominated by braided river deltaic plain phase deposition and also developed deltaic frontal phase deposition; the lithology of the upper section of Group Y is mainly brownish-gray, gray mudstone, siltstone mudstone, and light-gray muddy siltstone, siltstone, fine sandstone, and the upper part is characterized by mud mixed with sand or sand and mud interbedded. The lower section of Group Y is widely distributed in the whole sag, and the lithology is mainly gray, dark-gray silty mudstone, mudstone and gray, light-gray silty siltstone, siltstone, fine sandstone, conglomerate-bearing sandstone, conglomerate, etc., interspersed with thin coal seams and coal lines; these sandstone reservoirs are mainly the braided river delta sand body, which is provided with the material source from the north-north-east direction, and the sand body of diversion channel is very well developed, and the main river channel runs through the whole X Sag almost [19,20]. Different depositional environments, development of diagenesis, and different degrees of cementation and cementation have led to the development of various pore types and complex pore structures in the reservoirs, exacerbating the non-homogeneity of the physical properties of the reservoirs of Group Y (Figure 1, Figure 2, Figure 3 and Figure 4).

Figure 1.
H1 Well 3290.8 m fine sandstone.
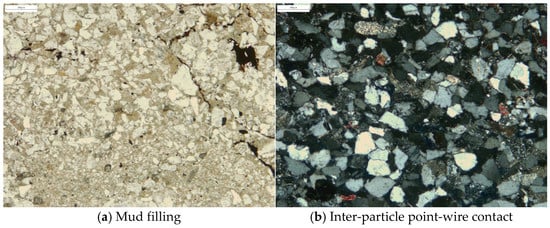
Figure 2.
H1 Well 3295 m muddy siltstone.
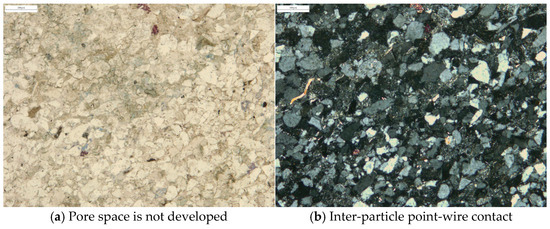
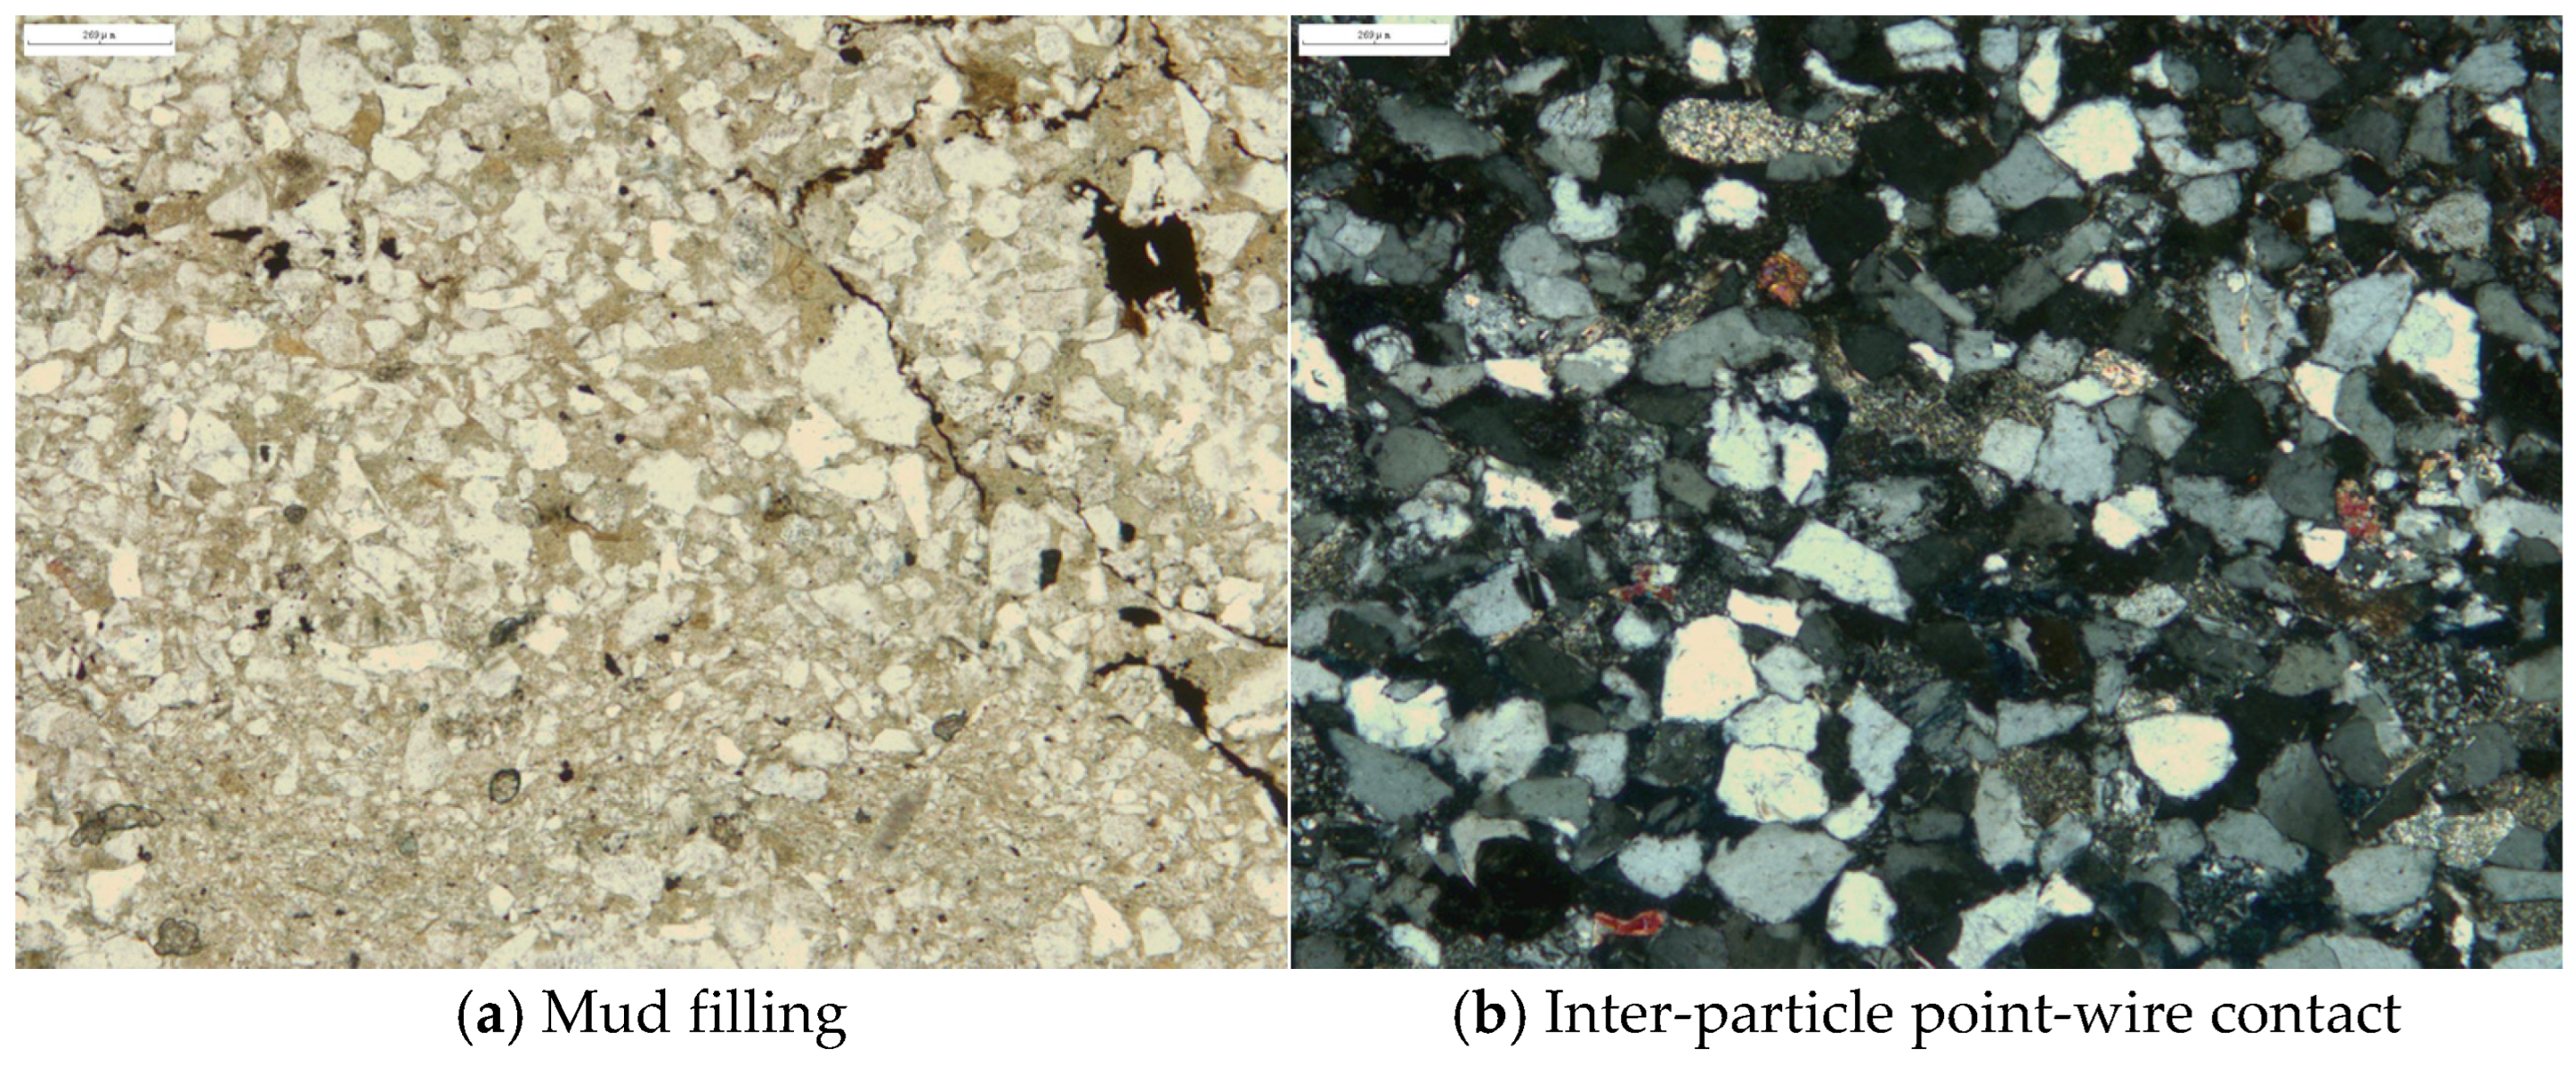
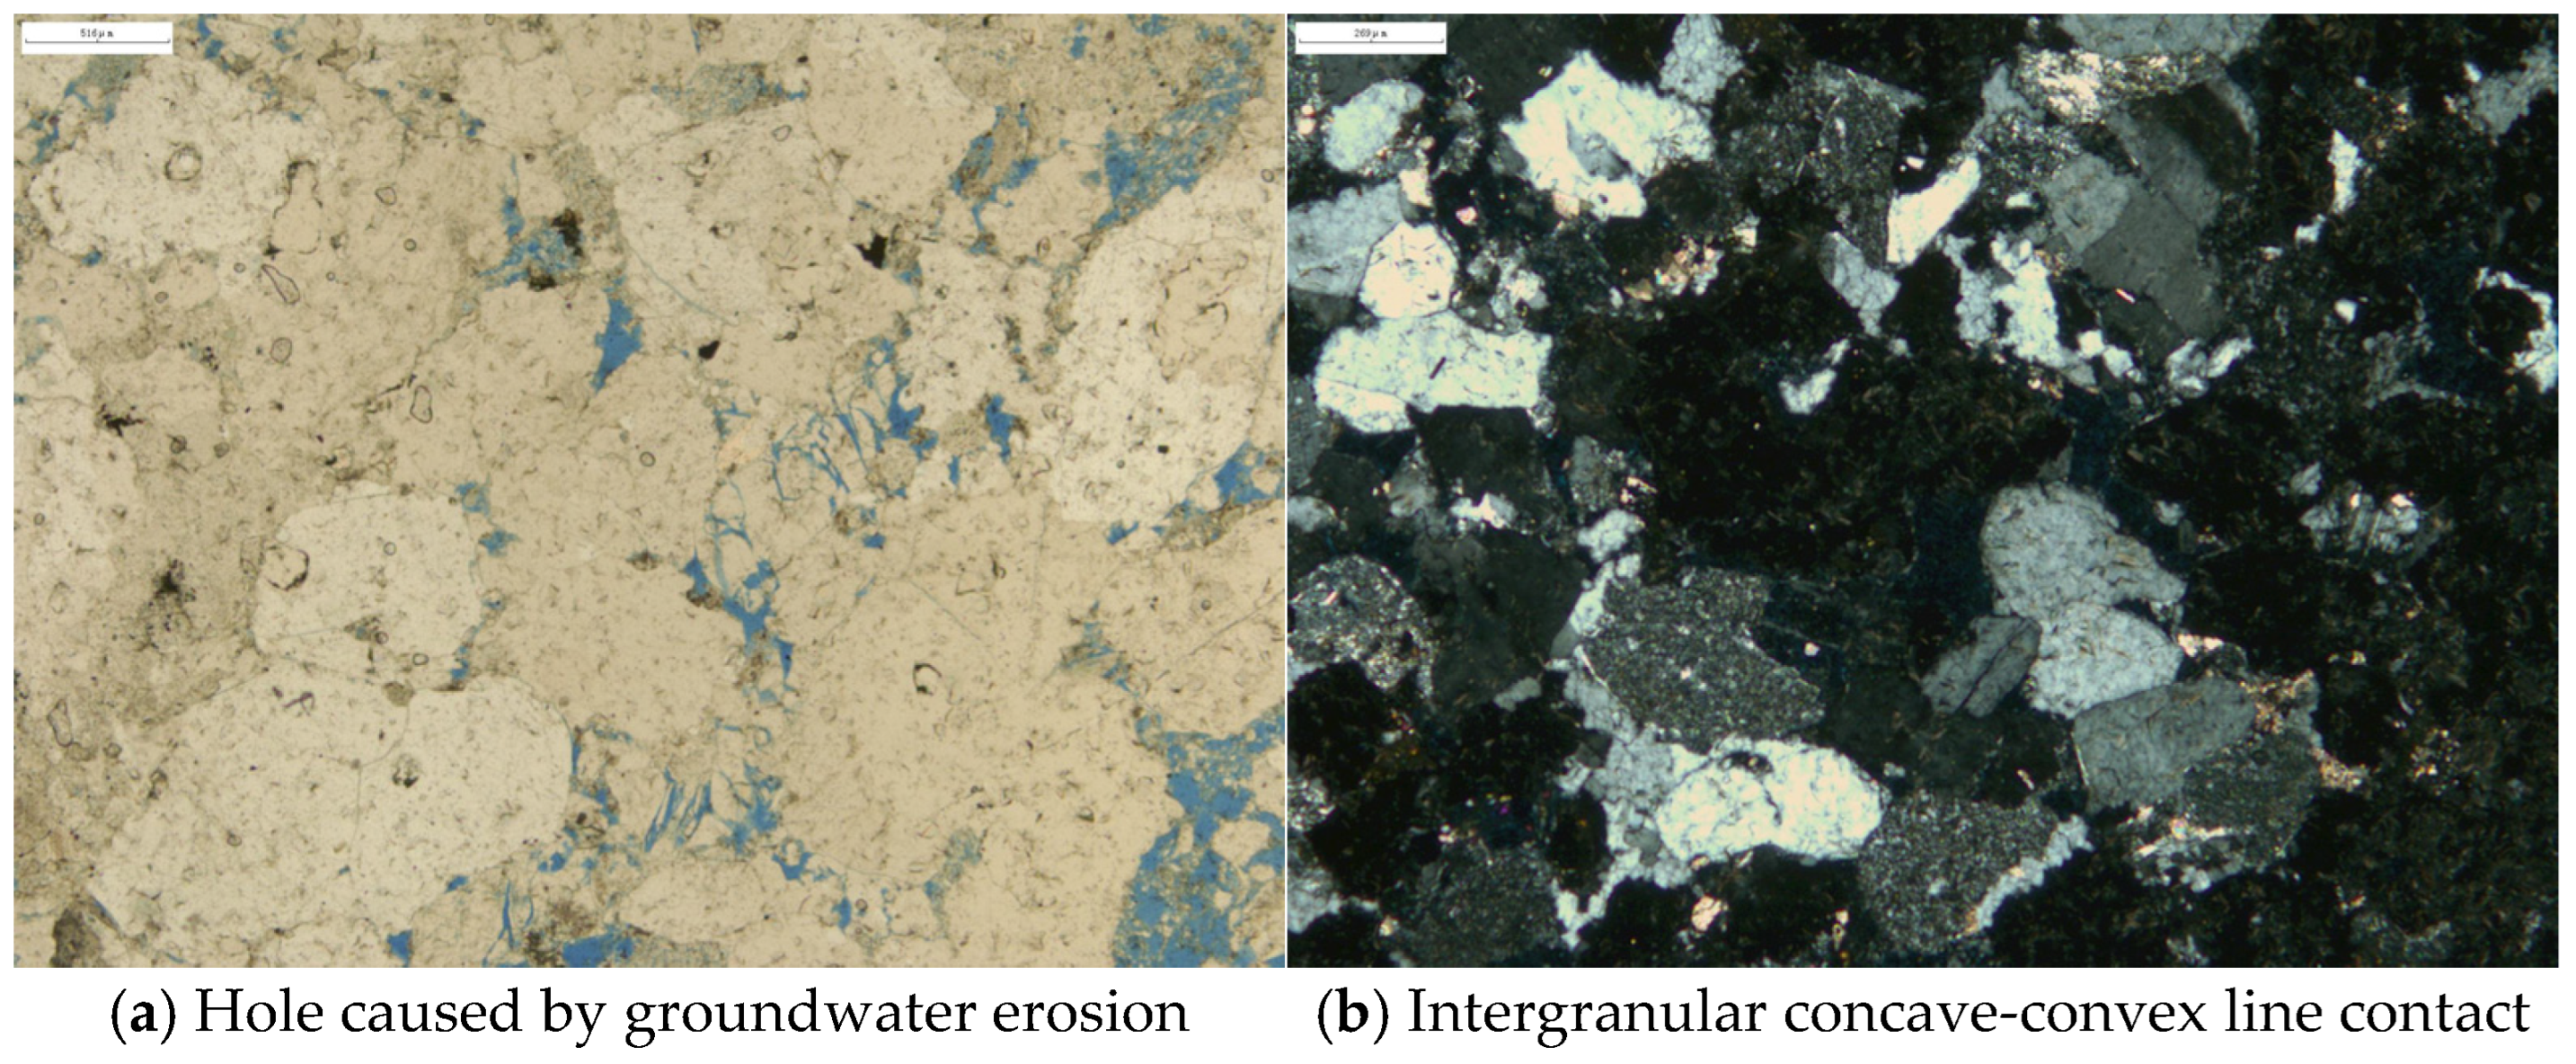
Figure 3.
H1 Well 3297.2 m siltstone.

Figure 4.
H2 Well 4125 m sandy conglomerate.
From the above analysis, it can be known that the lithology of the target layer is complex and the pore structure is poor. Faced with this complex reservoir, a single regression relationship cannot accurately calculate the permeability. This paper proposes a new method based on the theory of flow unit, using the magnitude of resistivity divergence to predict the permeability.
3. Principle of Magnitude of Resistivity Divergence of Logging While Drilling
3.1. Factors Affecting Resistivity of Logging While Drilling
Resistivity can be affected by a number of factors during the measurement process. For the resistivity of LWD, ideally, without considering the effects of borehole conditions, mud intrusion, etc., the formation anisotropy model is introduced and simplified to a horizontally layered 2-layer medium model to simulate the formation in a horizontal borehole, which can be classified into three modes according to the relationship between the borehole and the formation, namely, the mode in which the bit drills out of the formation, the mode in which the bit drills into the formation, and the mode in which the bit drills along the interface of the formation. Due to the influence of well inclination and formation dip, the apparent resistivity measured in this case is actually a combination of the horizontal resistivity and vertical resistivity.
Horizontal resistivity Rh usually refers to the resistivity in the direction parallel to the layer interface, and can be regarded as the result of the parallel conductivity of sandstone–mudstone interlayers. Vertical resistivity usually refers to the resistivity in the direction perpendicular to the layer interface, which can be regarded as the result of the series conductivity of the sandstone–mudstone interlayer. The weights for mudstone and sandstone are the relative volumes of the two within the detection range of the logging instrument, respectively [21]. Let the resistivity of the high-resistance sandstone be R1 and the resistivity of the low-resistance mudstone be R2, then the horizontal resistivity of the formation is
The vertical resistivity is
The anisotropy coefficient λ is used to characterize the anisotropy of the formation in a horizontal well, which is the square root of the ratio of the vertical component to the horizontal component (λ = (Rv/Rh)0.5 > 1). The average resistivity Rm of anisotropic strata is determined by the geometric mean of and [ = (⋅)0.5]. According to the research results of Zhao Jiangqing [22], the formation apparent resistivity can be obtained as
In Equation (3), θ is the angle between the well axis and the interface normal to the formation. The magnitude of is closely related to θ as well as to the anisotropy coefficient .
3.2. Polarization Effects on the Resistivity of Logging While Drilling
In wells with large gradient and horizontal wells, near the formation interface, the resistivity suddenly increases to a great extent (far exceeding the true resistivity of the formation), resulting in the phenomenon of severe aberration, which.is the phenomenon of the polarization angle of resistivity. The polarization angle is due to discontinuities in the electric field across the stratigraphic interface. In the case of horizontal wells, the induced current must pass through the formation interface where the conductivity of the medium is different on both sides, resulting in a large difference in the resistivity response of the instrument when it passes through the formation interface at different angles, which causes distortion of the received signal and the formation of the polarization angle. When the borehole is perpendicular to the formation interface, both the induced electromagnetic field and the induced current are parallel to the formation interface for EM wave logging with drilling, and therefore no polarization occurs [23].
In Equation (3), when θ = 0°, the borehole trajectory is perpendicular to the formation interface, and the apparent resistivity is the horizontal resistivity Rh. As the value of θ increases gradually from 0°to 90°, the value of cos θ decreases gradually from 1 to zero, and Ra increases gradually. When θ < 45°, cos θ decreases slowly as θ increases. When θ > 45°, as θ increases, cos θ decreases rapidly, the effect of stratigraphic anisotropy increases dramatically, and the apparent resistivity becomes significantly larger. When θ = 90°, cos θ = 0, the drill bit drills horizontally along the interface of the stratum, the apparent resistivity is the largest at this time, = > , and the magnitude of resistivity at this time depends on the anisotropy coefficient of the stratum λ. From Equations (1) and (2), it can be seen that the greater the difference in resistivity of the strata, the greater the /, the higher the λ, and the more intense the polarization effect.
When the angle θ is a constant value, let cos2 θ = C, from the transformation of (1), we can obtain
where the expressions for RhRv and Rh2 are, respectively,
In Equations (5) and (6), since R1/R2 > 1, A and B are constant values for the instrument points at different locations, the larger the difference between the resistivity of sandstone and mudstone, the larger the R1/R2 ratio, the larger the values of and , and the larger .
Therefore, the resistivity with drilling is not directly related to the well inclination angle, but is directly related to the clamping angle θ and the difference of formation resistivity.
3.3. Principle of Divergence of Resistivity in Logging with Drilling
Divergence of resistivity in logging with drilling is the magnitude to which resistivity values at different depths of sounding differ from those at the shallowest depth of sounding, usually expressed as a ratio. Divergence of resistivity in logging with drilling is based on two main conditions. Firstly, different logging profiles have different depths of detection. The detection radius of natural gamma is about 1ft (0.3048 m); the detection radius of resistivity with drilling is about 0.2~1.5 m from shallow to deep according to the nature of the stratum, and the order of its detection depth is as follows: A40H > P40H > P34H > P28H > P16H. The other is a more pronounced difference in resistivity above and below the stratigraphic interface.
Most of the wells involved in this study have a small inclination angle and are approximated as vertical wells, which allows the effect of resistivity polarization to be neglected. From Equation (1), we can see that horizontal component is the dominant factor in drilling resistivity measurements in vertical wells, and when the drill bit penetrates through thick sandstone, R1 > R2, B value increases as the test point comes closer to the wall, A value decreases, and the magnitude of the resistivity increases with the depth of sounding.
However, in deep, low-permeability reservoirs, the measurement of resistivity is low due to the “low invasion phenomenon” that fluids from the low-permeability layer move to the high-permeability reservoir during the drilling process. In Logging While Drilling (LWD), the higher the reservoir permeability, the more pronounced the “low invasion phenomenon” and the more the resistivity measurement with drilling decreases. The shallower the detection depth of the resistivity with drilling, the greater the influence of “low intrusion phenomenon”, and the detection depth of P16H is relatively shallow, which is more affected by “low intrusion phenomenon”, and the detection depth of A40H is the deepest, which is least affected by “low intrusion phenomenon”. The A40H is the deepest and the least affected by the “low intrusion phenomenon”. From the above analysis, it can be known that the higher the reservoir permeability, the greater the magnitude of resistivity divergence.
The display of low-invasion phenomenon in well X1 at 4275–4325 m is shown in Figure 5. The well has low gamma, high resistivity, and high gas measurement values at the time of coring, with an average porosity of 11%, making it a reservoir with good physical properties. The resistivity curves of the four different probing depths have different magnitudes of divergence, with the largest permeability and porosity at 4304 m, corresponding to the largest gas measurement value, and the most obvious amplitude of resistivity divergence.
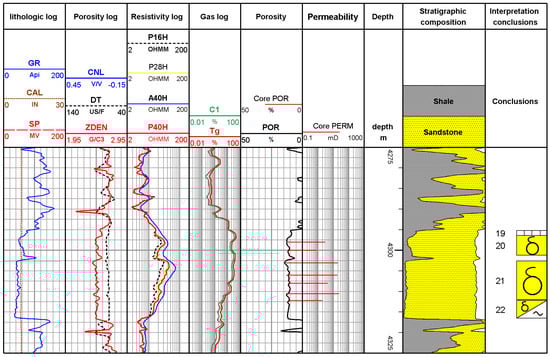
Figure 5.
X1 well 4275–4325 m low intrusion phenomenon.
4. Relationship Between Resistivity and Permeability in Logging While Drilling
4.1. Relationship Between the Magnitude of Resistivity Divergence and Permeability in Logging While Drilling
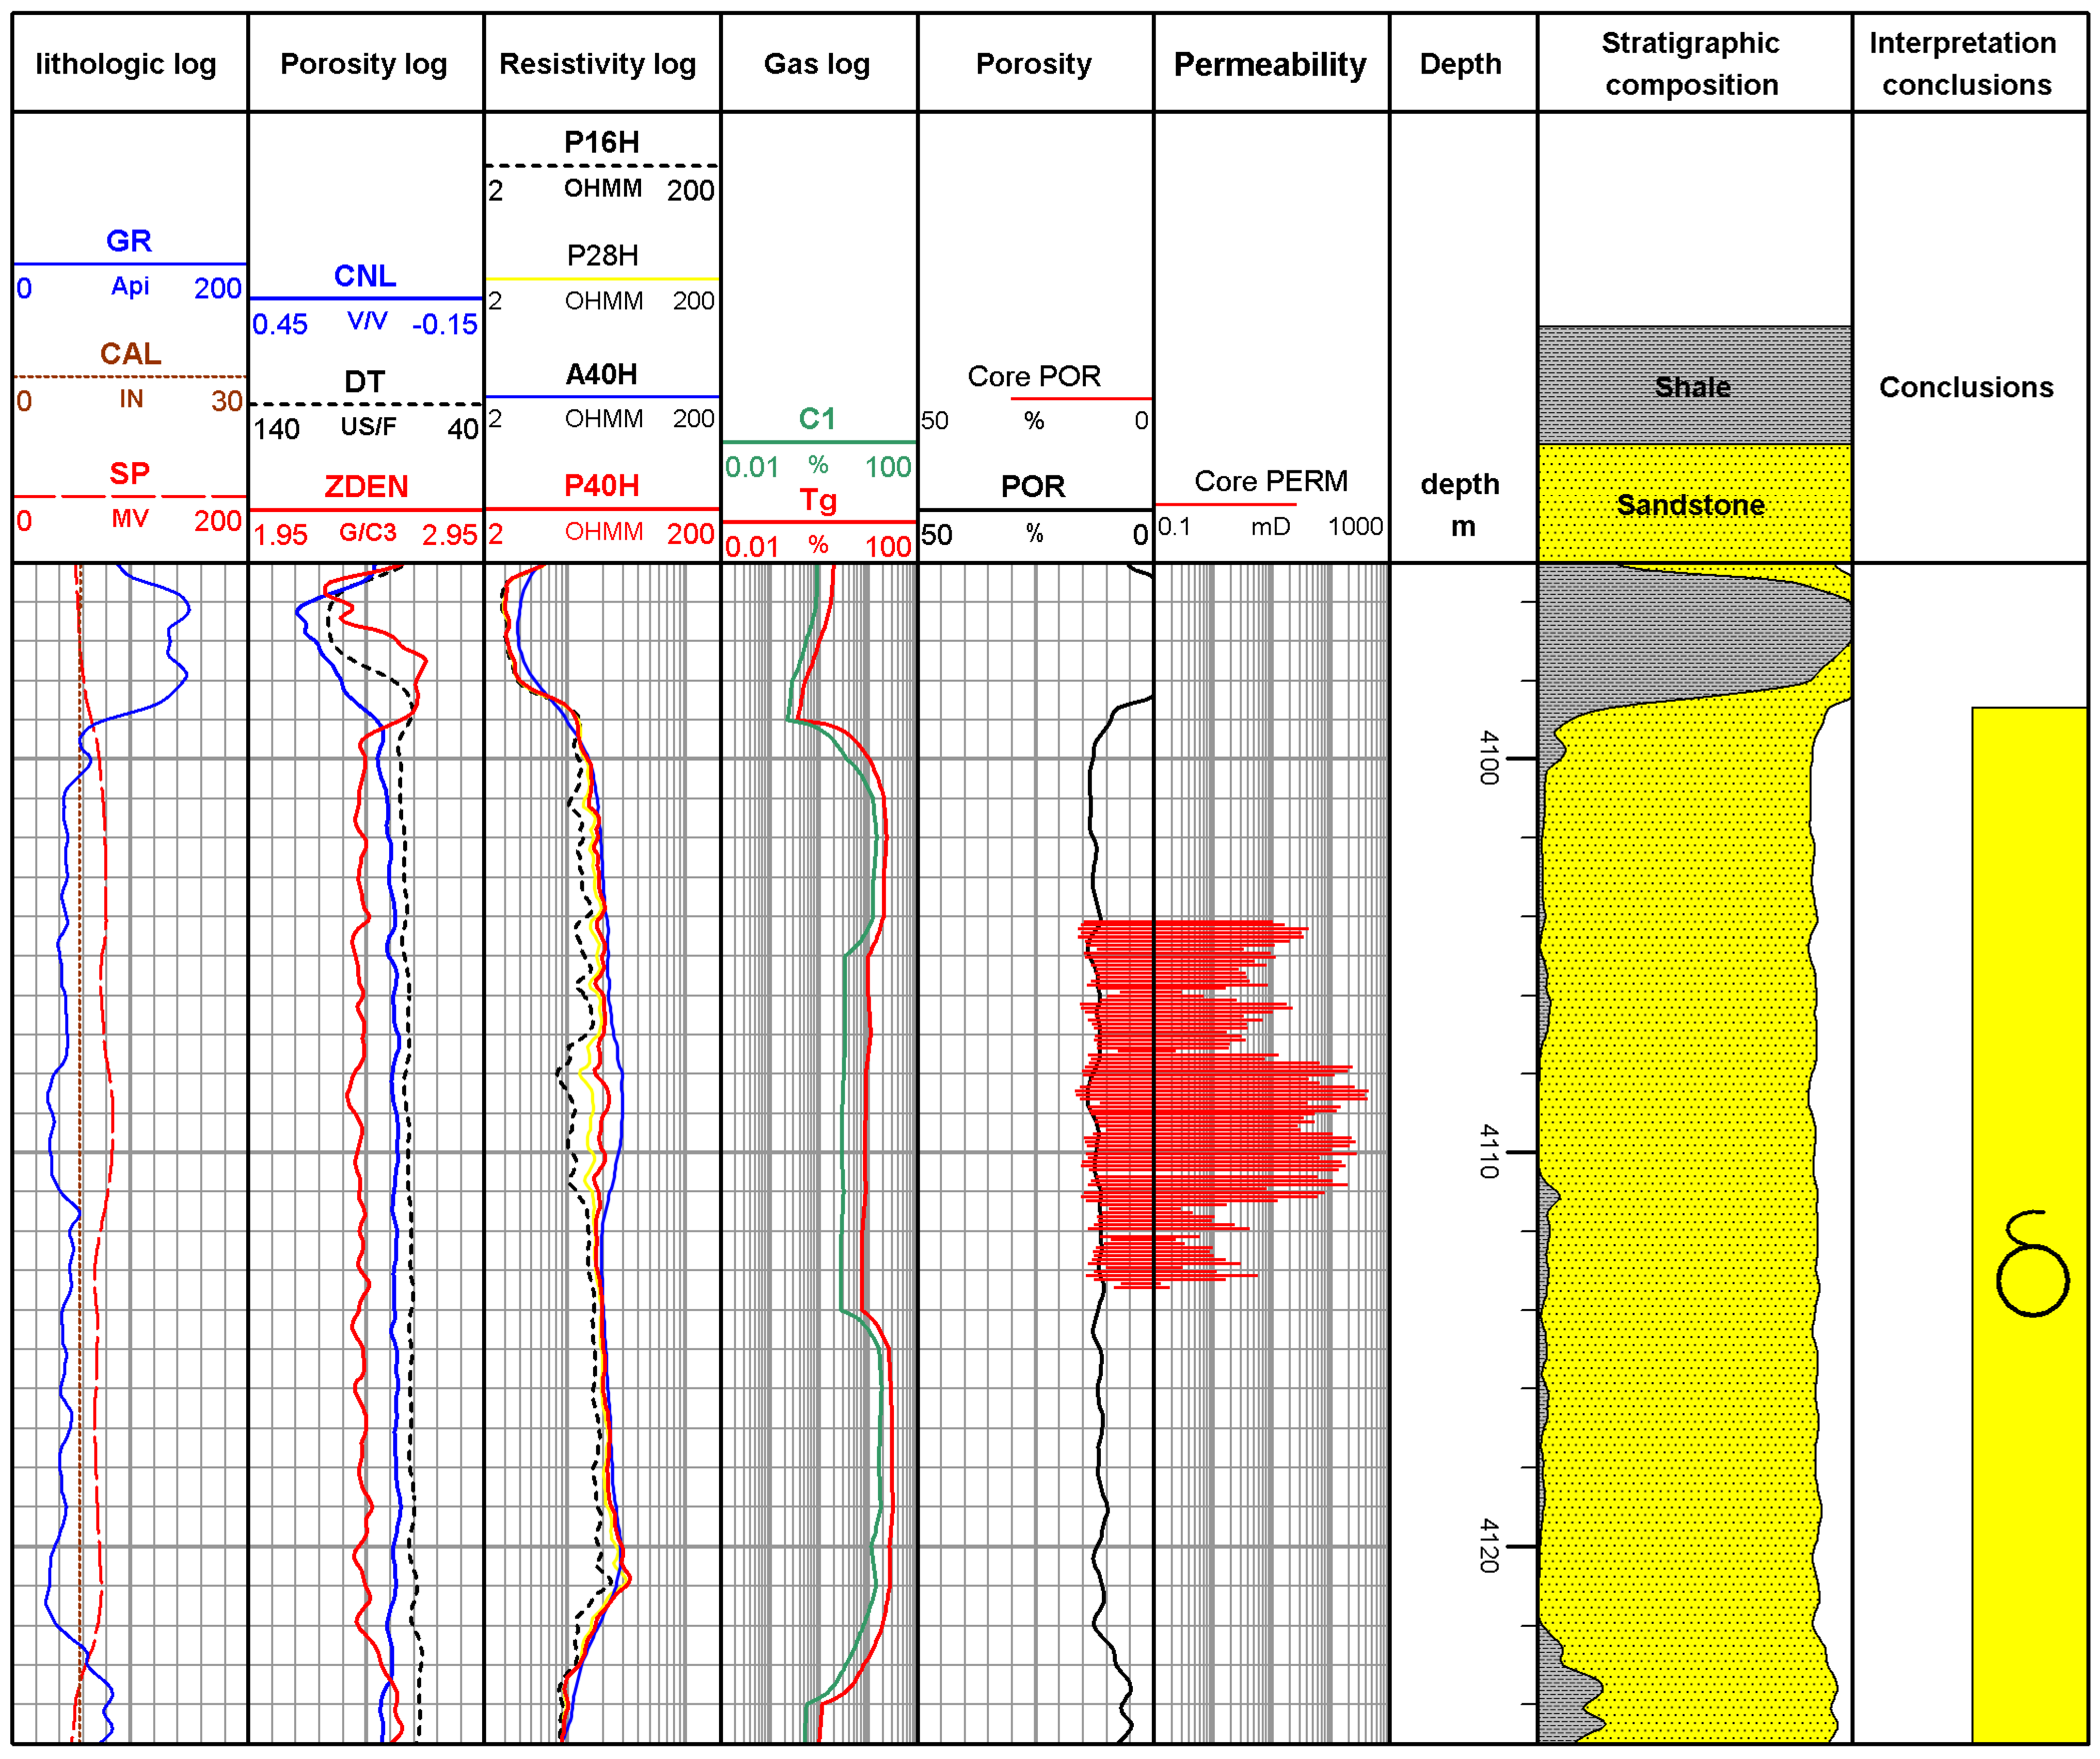
Figure 6 shows the response characteristics of resistivity Logging While Drilling in the 4095–4125 m section of X2 well. In the coring well section, the overall variation of natural gamma value is not large, mainly distributed between 30 and 55 API, and the gas logging shows high gas measured values, and the porosity of the reservoir is above 10%, which is a better gas layer. The third channel is the resistivity channel. The fifth channel is the porosity channel, the black line is the porosity curve calculated by density, neutron, and acoustic wave, and the red bar is the core porosity. We can see that the porosity matches well with the core porosity, and the calculated porosity is highly credible. The sixth channel is the permeability channel. From the third and sixth channels, it can be seen that at depths of 4100–4105 m, the values of all four resistivity curves that are measured by Logging While Drilling are increasing and the magnitude of the resistivity divergence is also increasing, corresponding to the median value of core permeability values. And at 4105–4111 m, the values of the four resistivity curves that are measured by Logging While Drilling gradually increase to the maximum value, and the magnitude of resistivity differentiation is also at the maximum magnitude, corresponding to the high permeability of core. And at 4111–4114 m, the values of all four resistivity curves that are measured by Logging While Drilling are decreasing, and the magnitude of resistivity divergence is also decreasing gradually, corresponding to the core permeability at relatively low value. From the above divergence, it can be seen that there is a good correlation between the magnitude of resistivity divergence and the permeability.

Figure 6.
Response characteristics of resistivity logging while drilling for X2 well 4095–4125 m.
4.2. Optimization of Resistivity Divergence Amplitude for Logging While Drilling
A total of 2662 cores from 10 coring wells in the study area were collected and organized for permeability modeling. Figure 7 shows the specific numerical relationship between the magnitude of the resistivity divergence with drilling and the permeability for each of the wells, with the magnitude of the resistivity divergence with drilling represented by A40H/P16H, P40H/P16H, and P28H/P16H. As can be seen from Figure 7, in the study area, the magnitude of the three types of resistivity divergence with drilling, A40H/P16H, P40H/P16H, and P28H/P16H, are all correlated with permeability. At the same permeability, the magnitude values of A40H/P16H and P40H/P16H are larger than P28H/P16H, which can better represent the characteristics of the permeability change, and the correlation between P40H/P16H and the permeability is better than that of A40H/P16H, so P40H/P16H is preferred to represent the magnitude of the resistivity divergence with drilling, and the permeability model is further established.
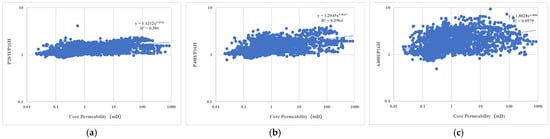
Figure 7.
The relationship between various parameters and permeability. (a) P28H/P16H versus core permeability rendezvous plot. (b) P40H/P16H versus core permeability rendezvous plot. (c) A40H/P16H versus core permeability rendezvous plot.
5. Permeability Modeling Based on the Magnitude of Resistivity Divergence in LWD
5.1. Fluid Unit Theory
Hearn proposed the concept of reservoir flow units in 1984, and more and more scholars have since applied this concept to reservoir characterization research [24]. Bonnie Qiu and Mu Longxin proposed that the flow unit is part of the internal architecture of the sand body, and its concept is a reservoir with the same permeability characteristics and consistent water flooding characteristics in an oil sands body and its internal seepage characteristics due to boundary constraints, discontinuous sheltering layers, various depositional micro-interfaces, small faults, and differences in permeability [25,26]. The main objective of clastic flow unit studies is to explain the complex inhomogeneity of reservoirs, which is specifically applied to subdivide strongly inhomogeneous reservoirs, improve the accuracy of permeability interpretation, improve the accuracy of numerical simulation of reservoirs, and analyze the residual oil distribution pattern.
The flow unit is a reservoir genesis unit formed by a variety of geologic effects, which is a comprehensive product of the interaction of sedimentation, diagenesis, and late modification. At present, the subdivided layer of the reservoir basically remains in the subdivided single sand body. Narrowly defined, the flow unit refers to the further subdivision of a reservoir based on the rock properties that affect fluid flow, after subdividing individual sand bodies, and it adopts a completely different criterion from that of subdividing the single sand body, in which the flow unit index FZI method is very widely used [27].
The flow zone index FZI method is a permeability calculation method formally proposed by Amaefule et al. in 1983 [11]. This method utilizes the theory of average hydrodynamic unit radius to treat the pore channels of the reservoir as capillary tubes, and uses Darcy’s law to solve Poisson’s equation with a correction to the Kozeny–Carman equation to obtain permeability models for different types of flow units [28,29].
The formula transforms to
where is the shape factor; is the tortuosity of the pore medium, is the surface area per unit volume of particles, is the effective porosity, and the permeability unit is adopted as (×10−3 μm2), defining the following parameters.
The reservoir quality index is
Standardized porosity index, which is the ratio of pore volume to particle volume, is
Then, the mobility stratification indicator is
Taking both sides of the above equation logarithmically gives
From Equation (6), it can be seen that on the double logarithmic coordinate plot of RQI and , the two show a double logarithmic straight-line relationship with a slope of 1 and an intercept of FZI. For non-homogeneous reservoirs, the relationship between RQI and is a cluster of straight lines parallel to each other, and Amaefule believes that samples with similar flow conditions approximately fall on the same straight line, and belong to the same class of flow unit type.
5.2. Resistivity Differentiation Divides the Flow Unit
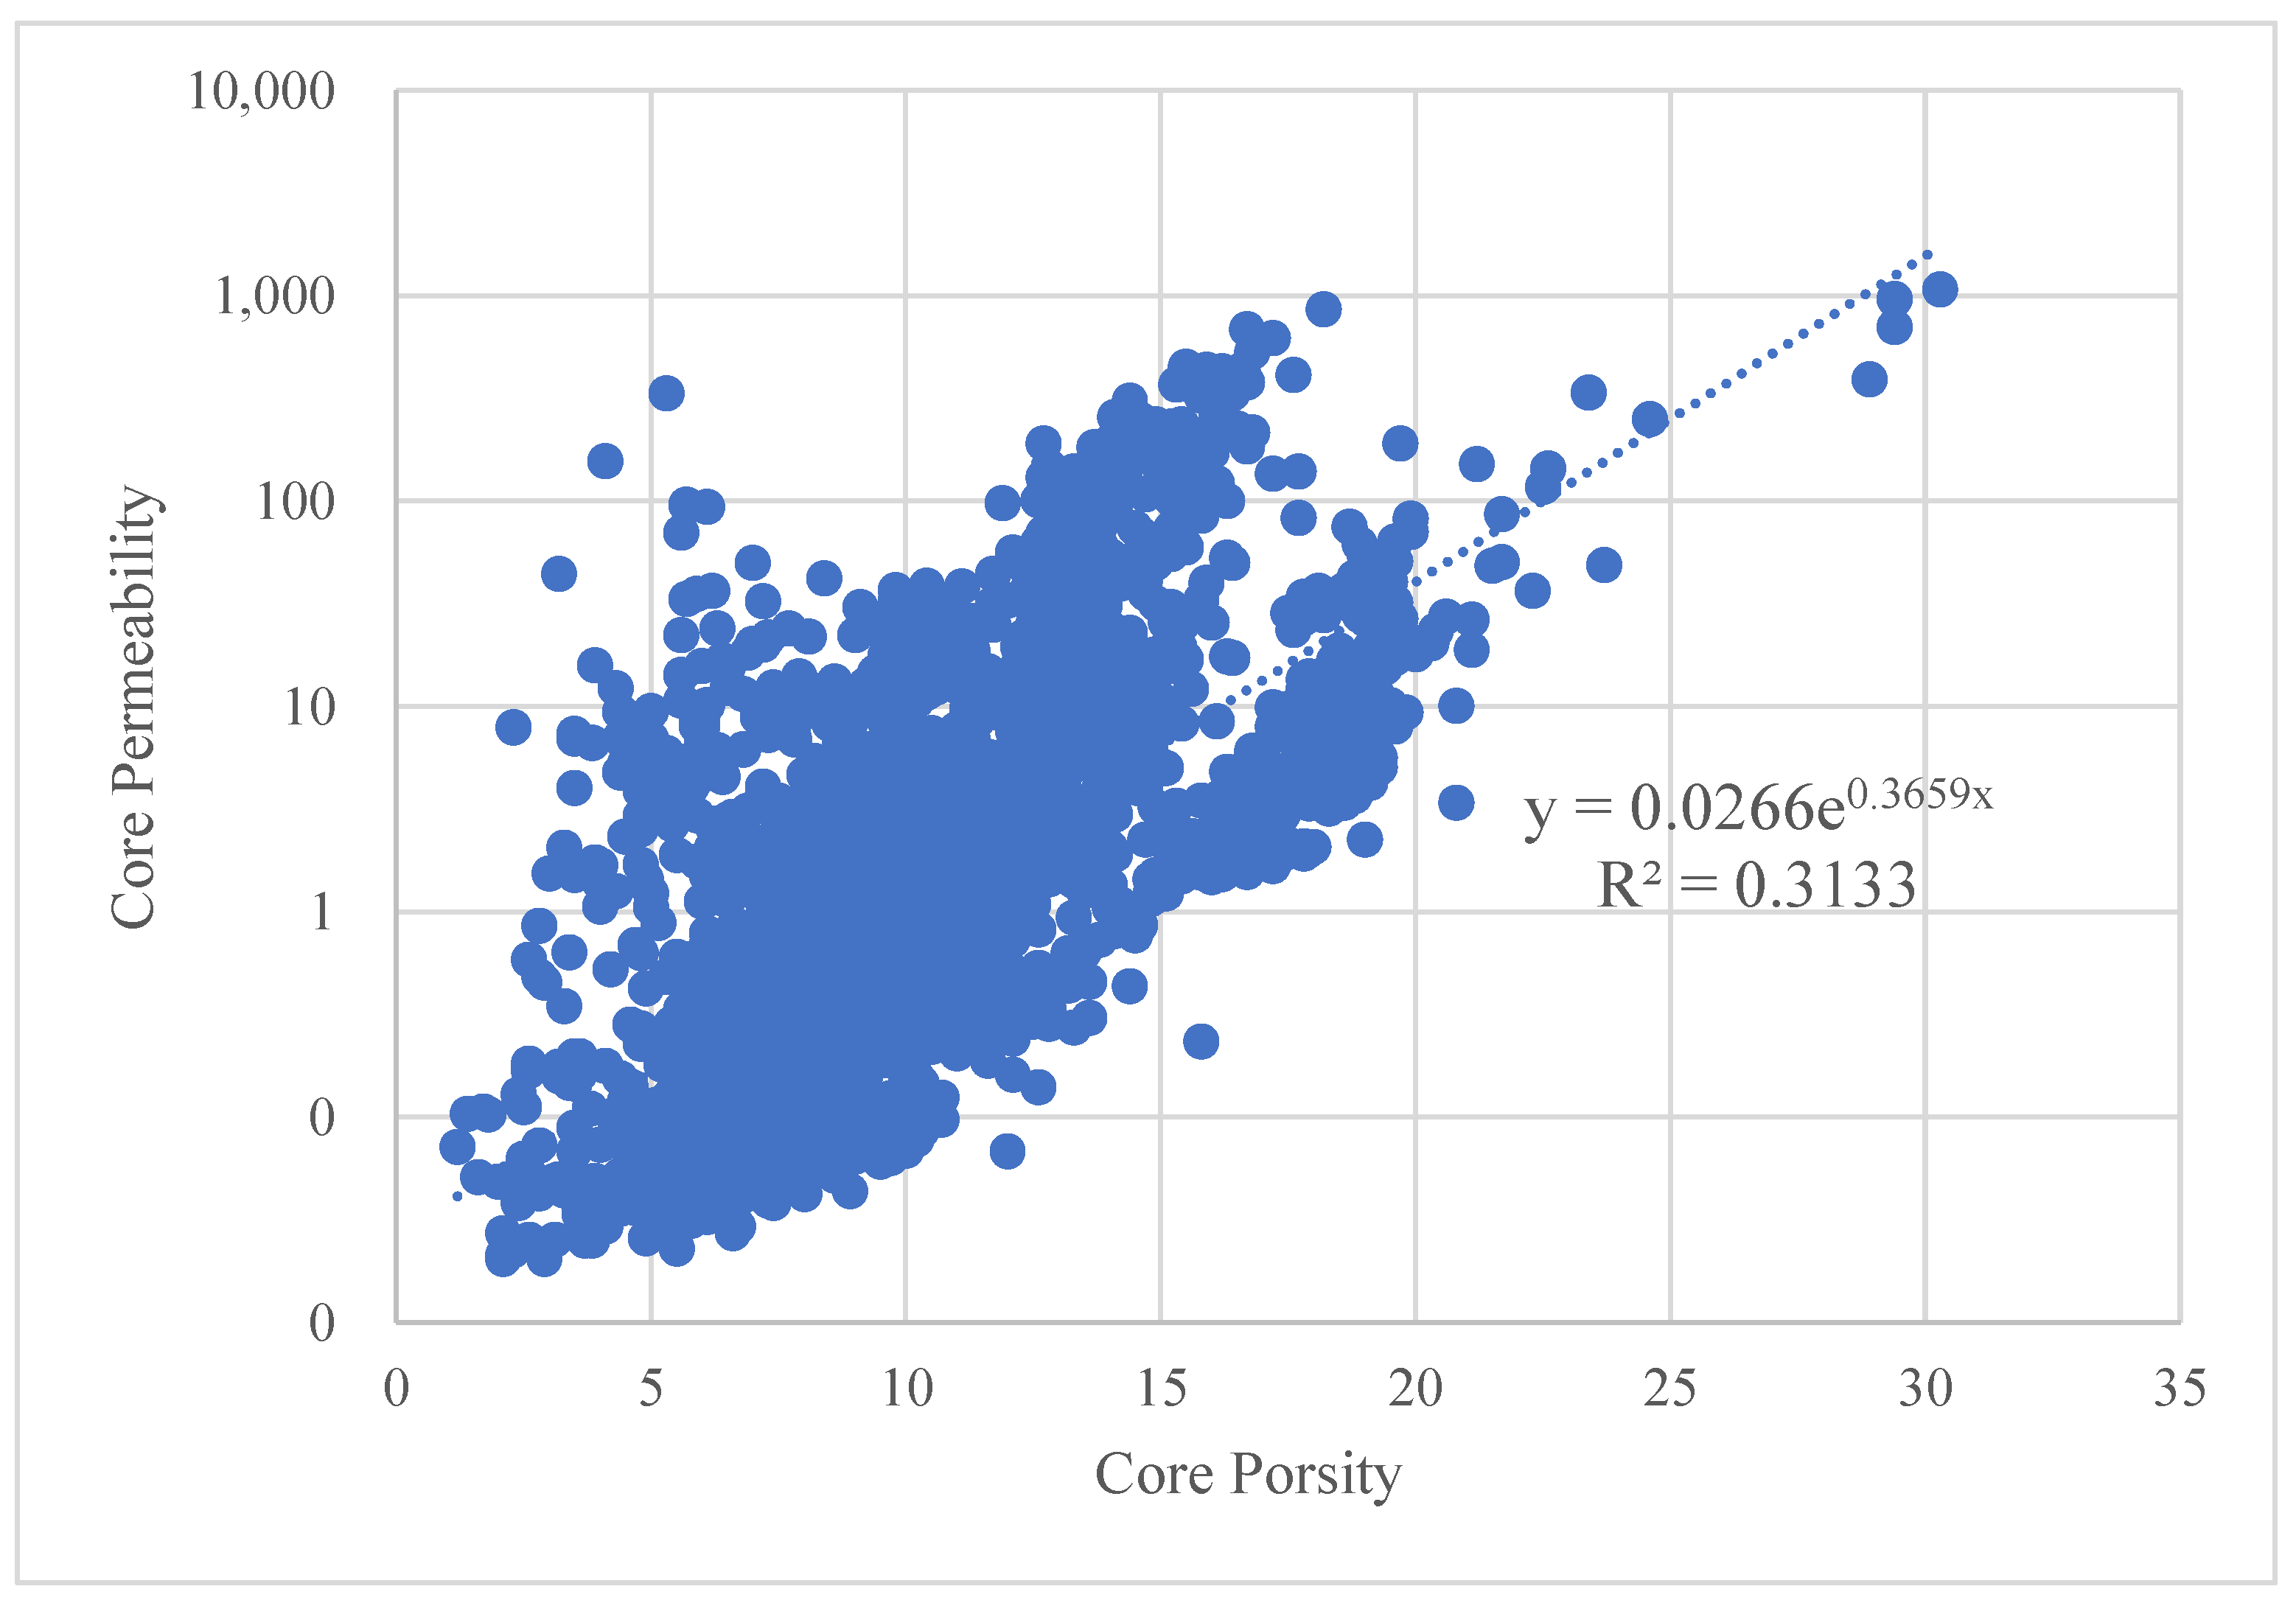
Figure 8 shows the rendezvous plot of core permeability and core porosity in the study area, the overall permeability shows an increasing trend with increasing porosity, but the pore–permeability relationship is complex. The porosity distribution is 1.2–30%, the permeability distribution is 0.01–1070 mD, and the average value of permeability is 10.65 mD, so it can be known that the permeability span is very large. For example, at 15% porosity, the minimum and maximum permeability values are 0.86 mD and 445 mD, respectively, a difference of four orders of magnitude, and the difference in permeability of cores with different porosities is also 1–3 orders of magnitude, which is very non-homogeneous, and the relationship between porosity and permeability is extremely poor. Due to the permeability of this reservoir factor by the pore structure having too much influence, the pore structure, including particle size, porosity size, particle diameter, etc., in different areas of these factors will not be the same, resulting in the existing model formula being unable to be directly applied, and it being difficult to establish permeability prediction models by the conventional method. From Equation (6), it can be seen that the process of dividing the flow unit by using the flow zone index FZI method is more complicated, and the flow unit index FZI has no direct relationship with the permeability and is not directly involved in the calculation of permeability, and there is an accumulation of error in the model established according to this method, which affects the accuracy of the final model. Based on the previously mentioned reflection of permeability by the magnitude of resistivity divergence with drilling, we propose a permeability model based on the magnitude of resistivity divergence.
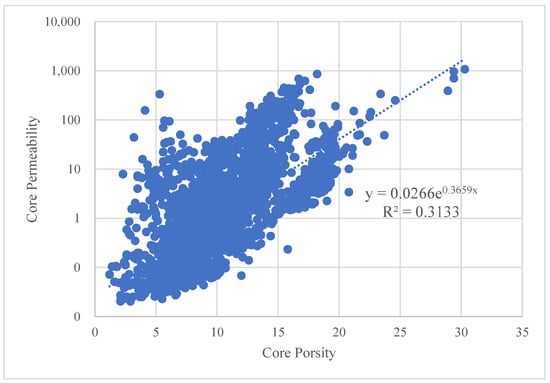
Figure 8.
Core hole penetration rendezvous.
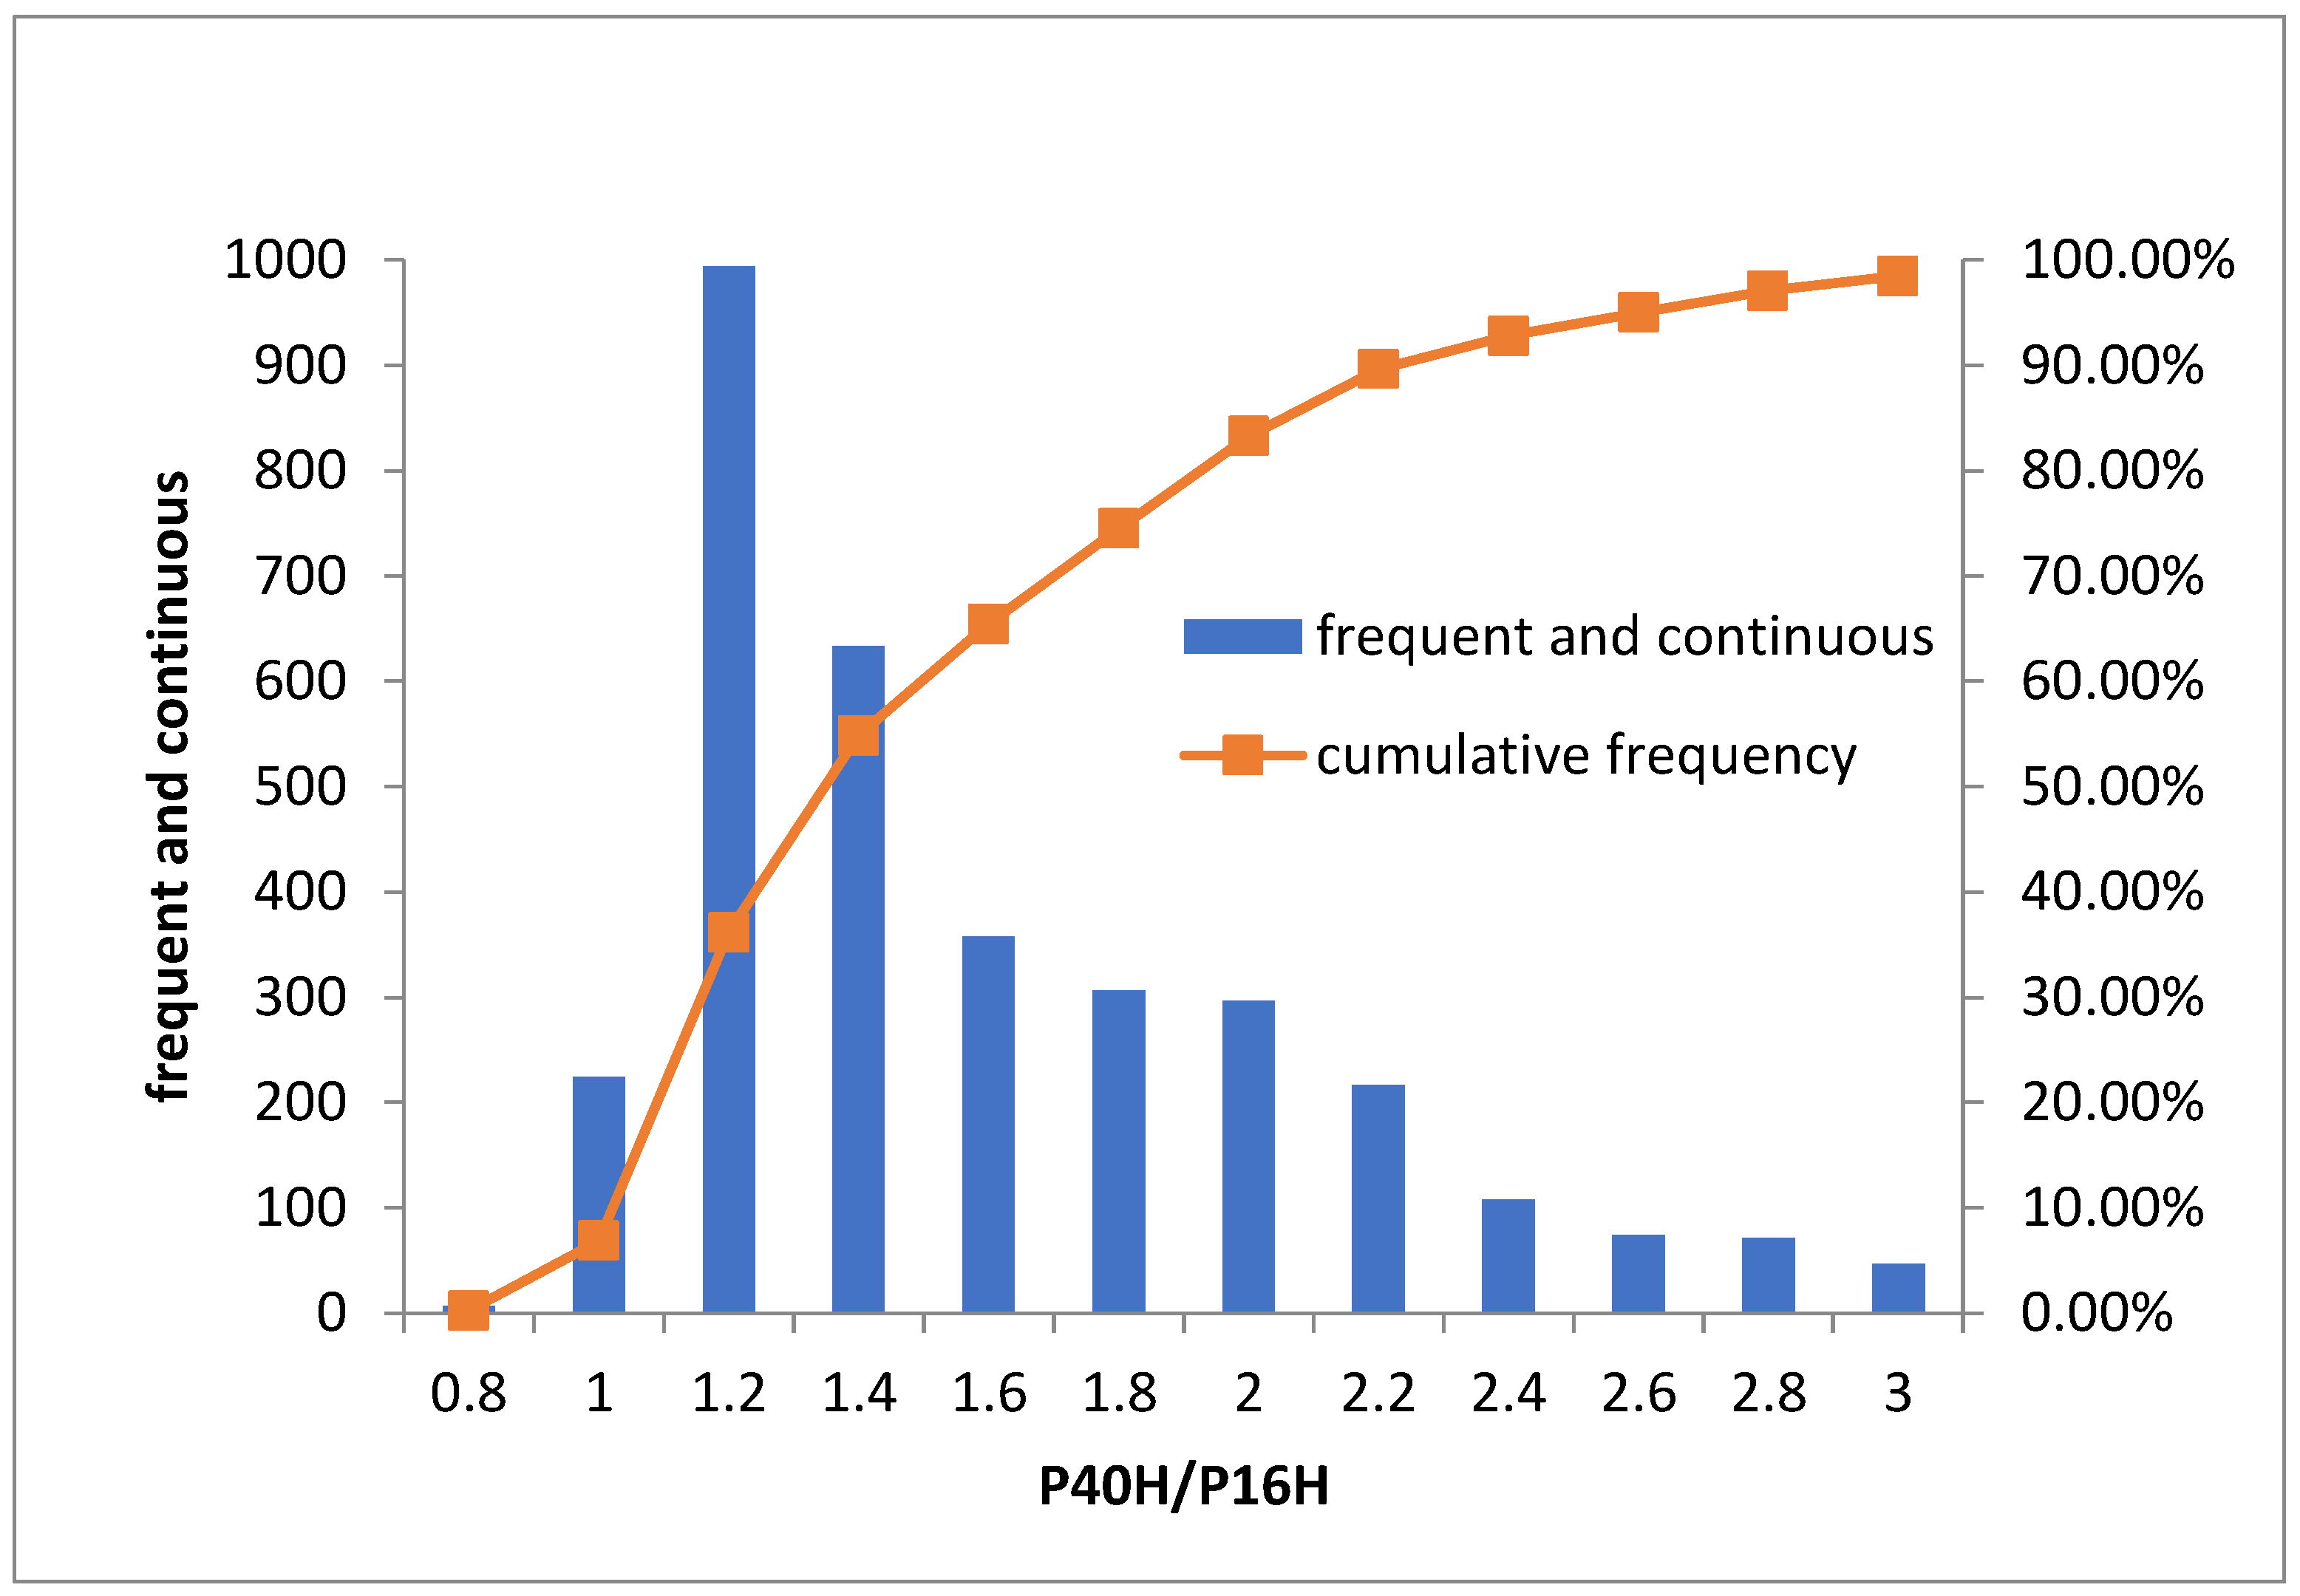
Distribution histograms were plotted for the magnitude of resistivity divergence with drilling for all cores in the study area, as shown in Figure 9.
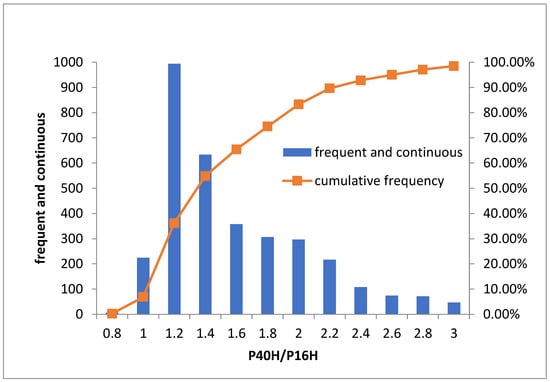
Figure 9.
Histogram of P40H/P16H distribution.
From the figure, it can be seen that the magnitude of the resistivity divergence with drilling in the study area is mainly distributed between 0.8 and 3, which accounts for 99.79% of the overall. Based on the flow unit theory, all cores are divided into N equal parts according to the value domain [0.8, 3] of P40H/P16H, and the expression for each part is
From Equation (12), every flow unit will be parallel and the expression for every flow cell can be obtained by a certain model translation. From the pore–permeability rendezvous diagram in Figure 8, the overall pore–permeability relationship in the study area is expressed in the form
Translating this by the magnitude of the resistivity divergence or the P40H/P16H parameters gives a model based on the resistivity divergence with drilling:
The data were analyzed to solve the equations for P40H/P16H equal to 0.8 and 3, respectively, to obtain m = 2.2 and n = −6.
The permeability model based on the magnitude of the resistivity divergence with drilling is
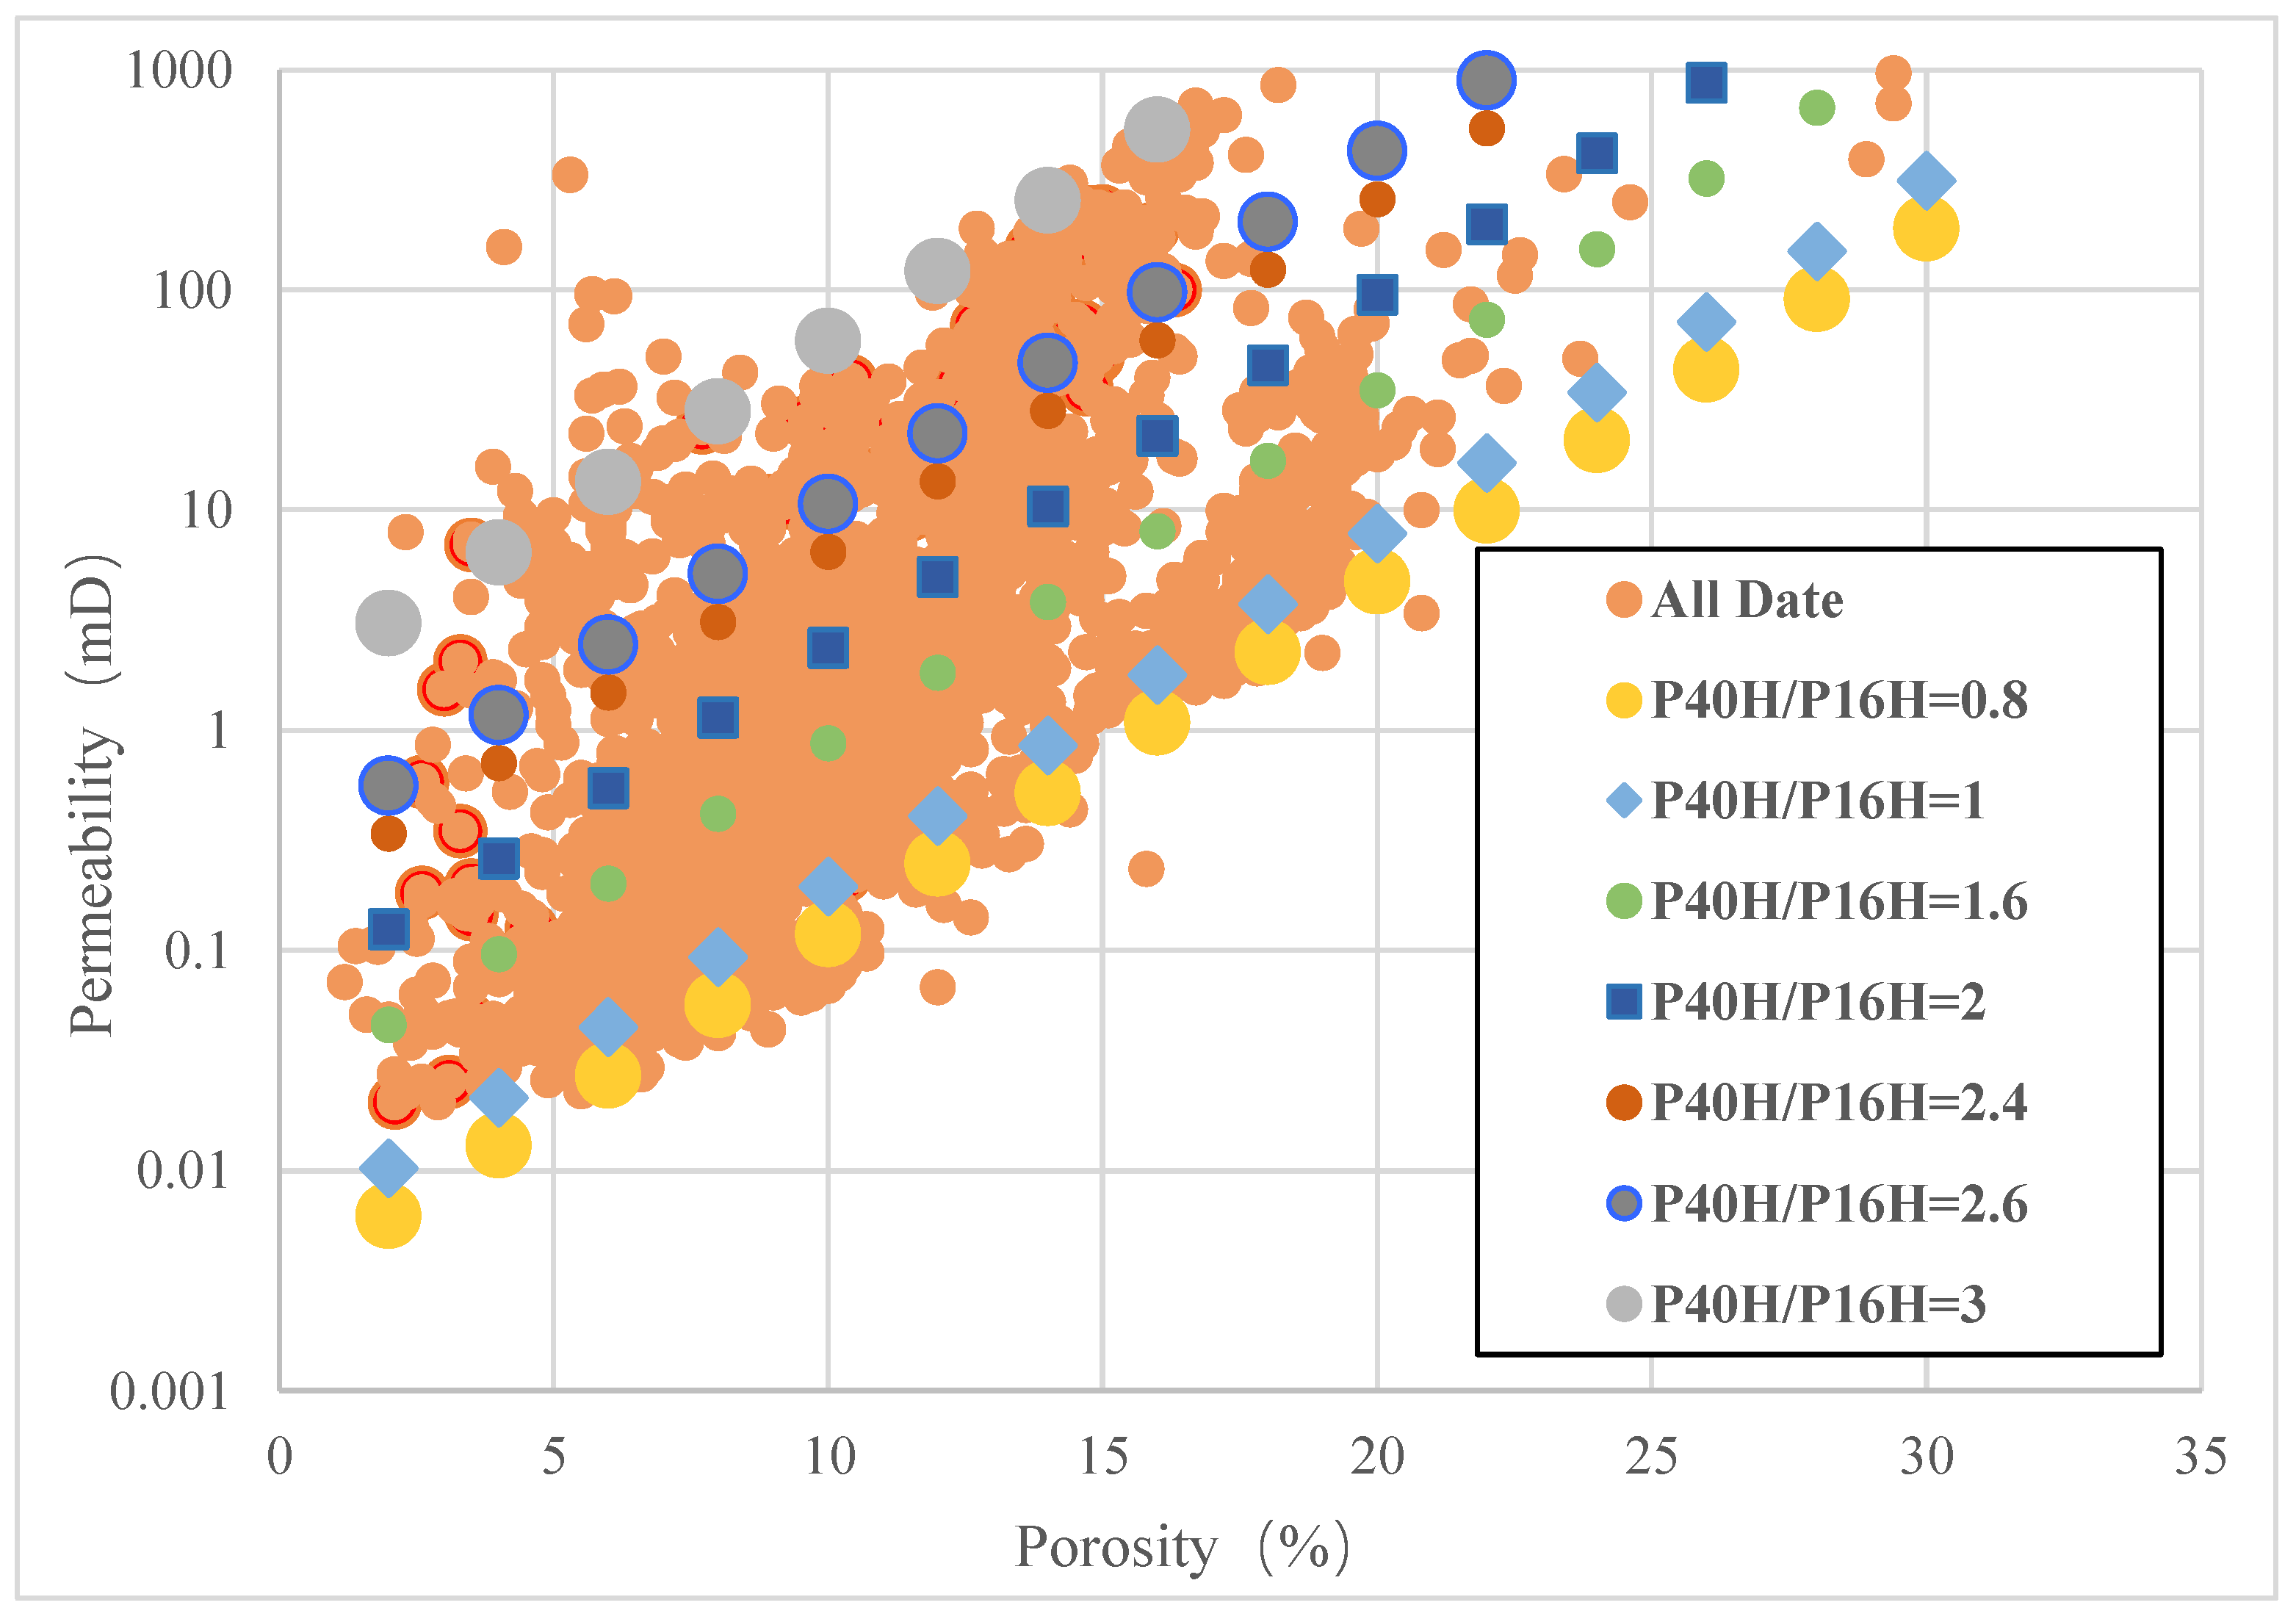
Figure 10 shows a schematic diagram of part of the flow unit. This figure shows the positions of the corresponding curves for P40H/P16H = 0.8, 1, 1.6, 2, 2.4, 2.6, and 3, further indicating that the permeability model will change with the variation of P40H/P16H values, which can realize the real-time evaluation of permeability drilling.

Figure 10.
Schematic diagram of the flow cell at different P40H/P16H.
6. Application Analysis of Permeability Model in New Well
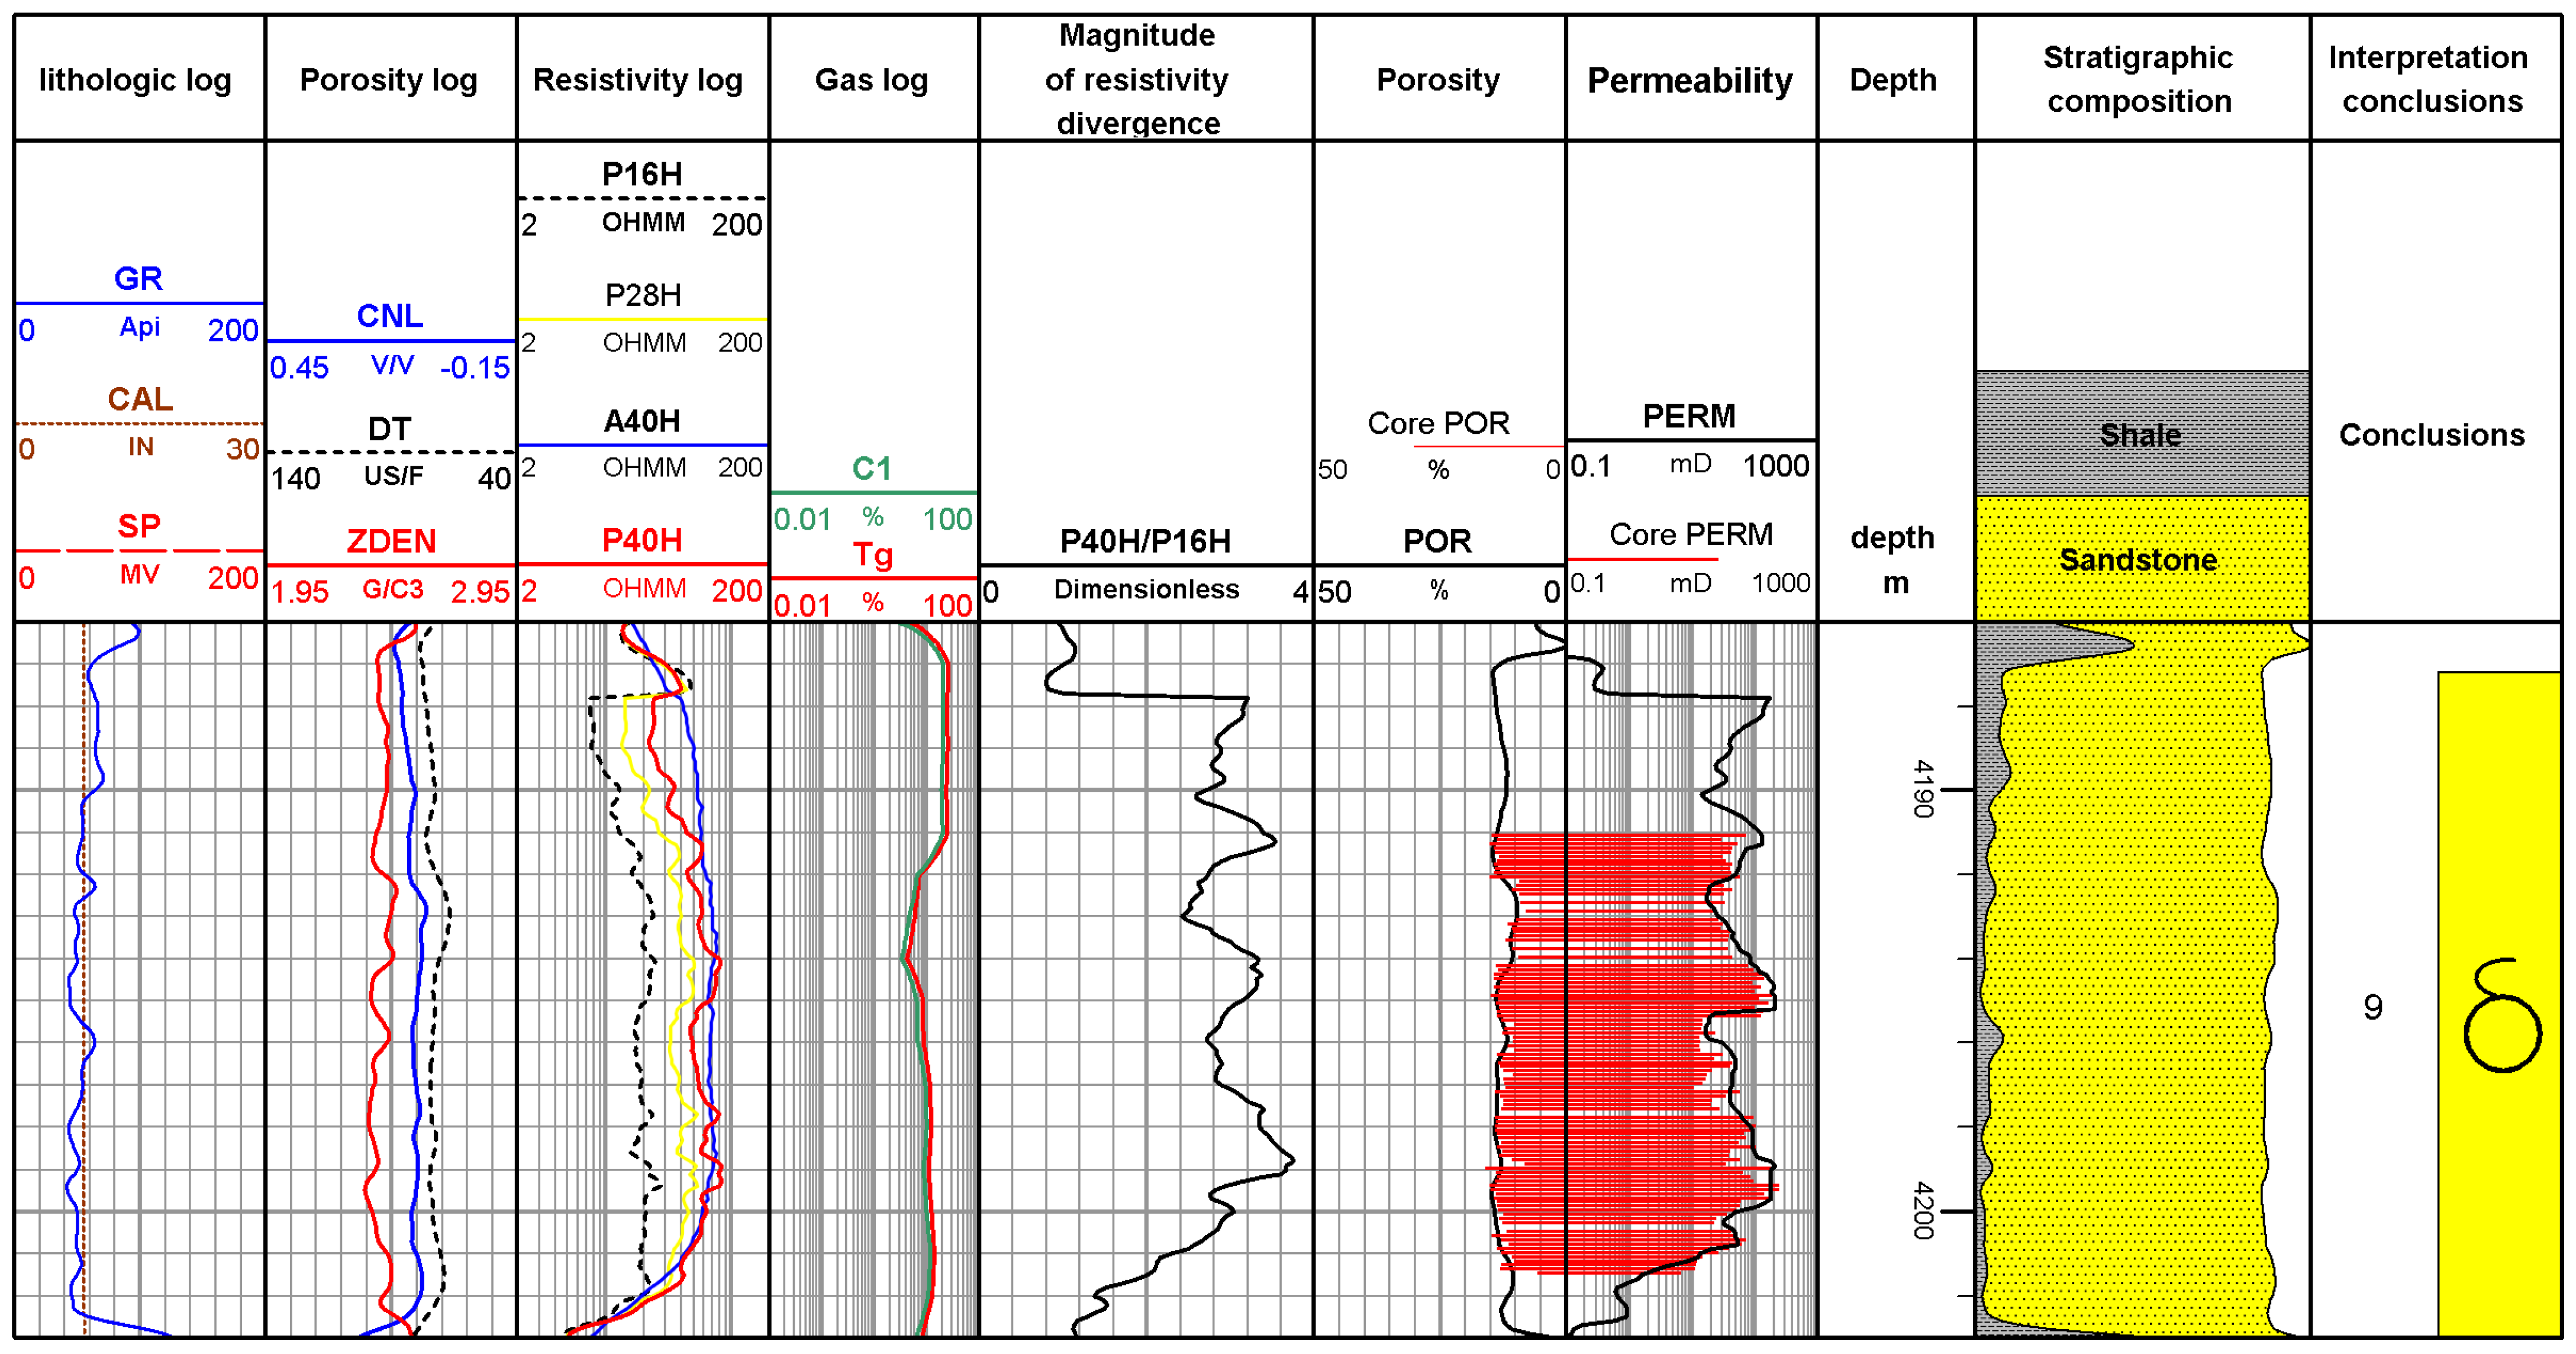
X3 well 4186~4203 m is the gas layer section, a total of 106 cores. The porosity distribution of the petrographic experimental analysis of this gas layer section ranges from 7.9% to 14.75%, with an average porosity of 12.81%. Core experiments analyzed permeability distribution in 2.79~172 × 10−3 μm2; the average permeability is 48.06 × 10⁻³ μm2. Based on the established permeability model, the corresponding permeability was calculated and the results of the logging interpretation were plotted (Figure 11). The fifth channel of the figure shows the calculated magnitude of the resistivity divergence with drilling. The sixth channel shows the porosity curve calculated by the optimization algorithm, which has an absolute error of 0.33% and a relative error of 2.9% compared to the core porosity. The seventh channel shows the permeability curves calculated by the permeability model based on the magnitude of the resistivity divergence with drilling, and the absolute error of the calculated permeability is 6.6 × 10⁻³ μm2 and the relative error is 13.37%, respectively, compared with the core permeability. The ninth channel shows the volume fraction of each lithology. The permeability model established by dividing the flow unit according to the amplitude of resistivity differentiation with drilling meets the requirements of fine evaluation of reservoirs, with high calculation accuracy, and the calculated permeability still matches well with the core permeability in the layers with relatively complex physical properties, which is effective in practical application.

Figure 11.
X3 Well Logging Interpretation Results Map.
7. Discussion
From the above article content, we can see that the key to using this method lies in the emergence of the “low invasion phenomenon”. However, when the mineralization degree of the drilling fluid is similar to that of the formation, such as when the drilling fluid is oil-based mud, the magnitude of resistivity divergence with Logging While Drilling caused by the “low invasion phenomenon” will be significantly lower than that of water-based mud, resulting in a decrease in the prediction accuracy of existing permeability models. All the mud systems used in this article are water-based mud, so a separate permeability model needs to be established for oil-based mud wells in the future.
8. Conclusions
In this paper, we propose a permeability calculation method based on the magnitude of resistivity divergence with drilling:
- (1)
- By elucidating the principle of divergence of resistivity with drilling, clarifying the correlation between reservoir properties and divergence of resistivity with drilling in the study area, and analyzing the preferred passes, the divergence of resistivity with drilling is expressed in terms of P40H/P16H parameters;
- (2)
- Analyzing the data from 3387 cores in the study area, the distribution of the amplitude of the resistivity divergence with drilling was determined to be in the range of 0.8 to 3, and this was used to divide all the cores into N equal parts;
- (3)
- Based on the theory of flow unit, the permeability calculation model based on the parameters of P40H/P16H, which is the amplitude of resistivity divergence with drilling, has been established by the mathematical analysis method, and the real-time continuous evaluation of permeability can be realized;
- (4)
- The model was well applied in one well, and the absolute error of calculated permeability was 6.6 × 10⁻³ μm2 and the relative error was 13.37%, respectively. The accuracy of the model is high, which lays the foundation for the subsequent development of the study area.
Author Contributions
Conceptualization, F.L.; methodology, F.L.; validation, X.C.; formal analysis, X.C.; investigation, B.Z.; data curation, B.Z.; writing—original draft preparation, F.L.; writing review and editing, Z.Z.; visualization, B.Z.; supervision, G.Z.; project administration, L.T.; funding acquisition, L.T. All authors have read and agreed to the published version of the manuscript.
Funding
This research was funded by National Science and Technology major projects of China “Logging identification and comprehensive evaluation technology of low-permeability tight reservoir” (2016ZX05027-002-002).
Data Availability Statement
The original contributions presented in this study are included in the article. Further inquiries can be directed to the corresponding author.
Conflicts of Interest
Authors Fawei Lu and Guodong Zhang were employed by CNOOC (China) Co., Ltd., Shanghai Branch. Authors Zhihu Zhang and Liangqing Tao were employed by Engineering Technology Branch of CNOOC Energy Development Co., Ltd. The remaining authors declare that the research was conducted in the absence of any commercial or financial relationships that could be construed as a potential conflict of interest.
References
- Wu, J.; Li, L.; He, S. Application of logging while Logging While Drilling technology in highly deviated and horizontal wells. West-China Explor. Eng. 2013, 25, 69–72. [Google Scholar]
- Zisser, N.; Kemna, A.; Nover, G. Relationship between low-frequency electrical properties and hydraulic permeability of low-permeability sandstones. Geophysics 2010, 75, E131–E141. [Google Scholar] [CrossRef]
- Zhang, S.; Li, H.; Wang, X. Damage mechanism and protective measures of low-permeability sandstone reservoirs in Gubei Oilfield. Pet. Explor. Dev. 2000, 27, 103–106+19. [Google Scholar]
- Alizadeh, N.; Rahmati, N.; Najafi, A.; Leung, E.; Adabnezhad, P. A novel approach by integrating the core derived FZI and well logging data into artificial neural network model for improved permeability prediction in a heterogeneous gas reservoir. J. Pet. Sci. Eng. 2022, 214, 110573. [Google Scholar] [CrossRef]
- Wang, Y.; Song, X. New method for well log interpretation by single fluid flow unit. Pet. Explor. Dev. 2002, 29, 53–55+84. [Google Scholar]
- Zheng, X.; Wu, J.; He, S.; Liang, Y. Fine Evaluation of Permeability of Conglomerate Reservoir Based on Flow Unit. J. Jilin Univ. Earth Sci. Ed. 2016, 46, 286–294. [Google Scholar]
- Lu, J.; Hao, B.; Li, C.; Wang, W.; Wang, Q.; Yang, W. Permeability prediction of tight sandstone reservoirs based on flow unit classification. Pet. Sci. Bull. 2021, 6, 369–379. [Google Scholar]
- Dai, L.; Zhao, C. Classification and discrimination method of reservoir flow unit index based on Fisher and probability method. Complex Hydrocarb. Reserv. 2021, 14, 73–79. [Google Scholar]
- Jing, T.; Han, Y.; Shi, Y.; Ma, Y.; Wei, L.; Wang, M.; Guo, Y. Study on Flow Unit of Yan91 Reservoir in Y66 Area of Jing’an Oilfield. J. Hebei GEO Univ. 2021, 44, 32–36. [Google Scholar]
- Wang, M.; Dong, Y.; Zhang, Z.; Liu, Z.; Liu, H.; Zhou, Y. High-precision classification method and application of flow unit. Fault-Block Oil Gas Field 2022, 29, 89–94. [Google Scholar]
- Amaefule, J.O.; Altunbay, M.; Kersey, D.G.; Tiab, D.; Keelan, D.K. Enhanced Reservoir Description: Using Core and Log Data to Identify Hydraulic (Flow) Units and Predict Permeability in Uncored Intervals/Wells. In Proceedings of the Annual Technical Confeerence and Exhibition of the Society of Petroleum Engineers, Houston, TX, USA, 3–6 October 1993. [Google Scholar]
- Wan, Q.; Luo, W.; Liang, J.; Chen, C.; Yang, Q. Reservoir architecture-based classification of seepage barriers of flow unit. J. Southwest Pet. Univ. Sci. Technol. Ed. 2019, 41, 77–84. [Google Scholar]
- Wu, S.; Wang, Z. A new method of non-marine reservoir flow unit study. Acta Sedimentol. Sin. 1999, 17, 252–256. [Google Scholar]
- Su, A.; Chen, H.; Wang, C. Densification mechanism and diagenesis fluid evolution of low-porosity and low-permeability tight sandstone reservoir: An example from Huagang formation in the northern of the central anticlinal zone in Xihu sag, East China Sea. J. China Univ. Min. Technol. 2016, 45, 972–981+1029. [Google Scholar] [CrossRef]
- Yan, S.; Wu, J.; Zhao, Z. Physical simulation study on structural inversion in Xihu Depression. Sci. Technol. Eng. 2016, 16, 166–171+176. [Google Scholar]
- Jiang, Y.; Shao, L.; Li, S. Deposition System and Stratigraphy of Pinghu Formation in Pinghu Tectonic Belt, Xihu Sag. Geoscience 2020, 34, 141–153. [Google Scholar] [CrossRef]
- Cheng, X.; Zhao, B.; Gao, C.; Gao, Y. A Method for Evaluating Reservoir Permeability Based on Machine Learning Flow Unit Index. Lithsphere 2023, 2022, 5505516. [Google Scholar] [CrossRef]
- Chen, L. Sedimentary Facies of Huagang Formation of Sudi Division in Xihu Trough, the East China Sea. Shanghai Land Resour. 1998, 1, 21–28. [Google Scholar]
- Liu, J.; Cao, B.; Xu, Z. Sedimentary facies and the charcteristics of tight sandstone reservoirs of Huagang Formation in Xihu sag, East Chuna Sea Basin. J. Chengdu Univ. Technol. Sci. Technol. Ed. 2012, 2, 130–136. [Google Scholar]
- Wang, H.; Shen, L.C. Dual laterolog responses in anisotropic crossbed ding formation. Petrophysics 2001, 42, 624–632. [Google Scholar]
- Zhao, J.; Wang, C.; Ye, Q. Application of Rock Anisotropy in Horizontal Well Logging Interpretation. Well Logging Technol. 1998, 1, 38–43. [Google Scholar] [CrossRef]
- Zhuang, D.; Si, Z.; Yang, H. Logging while Logging While Drilling technology and its application in Jidong Oilfield. Complex Hydrocarb. Reserv. 2010, 3, 44–46. [Google Scholar] [CrossRef]
- Yang, Z.; Liu, Q.; Yue, B. Simulation analysis of the formation mechanism and influencing factors of polarization angle in electromagnetic wave logging while Logging While Drilling. Well Logging Technol. 2010, 34, 210–214. [Google Scholar] [CrossRef]
- Hearn, C.L.; Ebanks, W.J.; Tye, R.S.; Ranganathan, V. Geological factors influencing reservoir performance of the Hartzog Draw field, Wyoming. J. Pet. Technol. 1984, 36, 1335–1344. [Google Scholar] [CrossRef]
- Qiu, Y. New technology of reservoir description. In Conference Collected Works of Oil and Gas Field Development of CNPC; Petroleum Industry Press: Beijing, China, 1996; pp. 62–72. [Google Scholar]
- Mu, L. Some development trends in reservoir description technology. Pet. Explor. Dev. 1999, 266, 42–46. [Google Scholar]
- Ma, D.; Chen, Y.; Zhao, J.; Wu, W.T.; Song, P.; Chen, M. Architectural elements of fluvial sand bodies of the eighth member of Permian Xiashihezi Formation in eastern Ordos Basin. Lithol. Reserv. 2022, 1–11. [Google Scholar] [CrossRef]
- Kozeny, J.S. Uber Kapillare Leitung des Wassers im Boden (Aufstieg, Versickerung und Anwendung auf die Bewasserung). Sitzungsberichte der Kaiserlichen Akademie der Wissenschaften 1927, 136, 271–306. [Google Scholar]
- Carman, P.C. Fluid flow through granular beds. Chem. Eng. Res. Des. 1937, 75, 150–156. [Google Scholar] [CrossRef]


Disclaimer/Publisher’s Note: The statements, opinions and data contained in all publications are solely those of the individual author(s) and contributor(s) and not of MDPI and/or the editor(s). MDPI and/or the editor(s) disclaim responsibility for any injury to people or property resulting from any ideas, methods, instructions or products referred to in the content. |
© 2025 by the authors. Licensee MDPI, Basel, Switzerland. This article is an open access article distributed under the terms and conditions of the Creative Commons Attribution (CC BY) license (https://creativecommons.org/licenses/by/4.0/).