1. Introduction
Biogenic amines formed by protein degradation are basically formed by the amination of free metabolism products from nitrogen, the secondary transformation of amino acids, and the hydrolysis of nitrogenous compounds and nitrogenous breakdown products [
1]. According to the number of nitrogen atoms they contain, biogenic amines are grouped as monoamines, diamines, or polyamines [
2]. On the other hand, biogenic amines are divided into three groups according to their chemical properties: aromatic and heterocyclic amines; aliphatic di-, tri-, and polyamines; and aliphatic volatile amines [
3,
4]. Biogenic amines are crucial for various physiological functions in both humans and animals. Polyamines, including putrescine (PUT), play a vital role in the growth and development of living organisms. Biogenic amines such as PUT, spermine (SP), and spermidine (SPD) are known to contribute significantly to the regulation of nucleic acids, protein synthesis, and membrane stability. Their involvement in nearly all stages of DNA, RNA, and protein synthesis makes them essential for cell growth and proliferation [
5]. Polyamines are obtained in three ways. They can be taken from food and produced by organisms themselves and their intestinal bacteria [
6,
7].
Some amines have important roles in humans as hormones and as transmitter substances in the regulation of blood circulation in the nervous system and smooth muscles [
8]. Biogenic amines are molecules with important metabolic activity in living cells [
9]. Biogenic amines such as PUT, SP, and spermidine, which are aliphatic polyamines, are molecules with important metabolic activities in living cells [
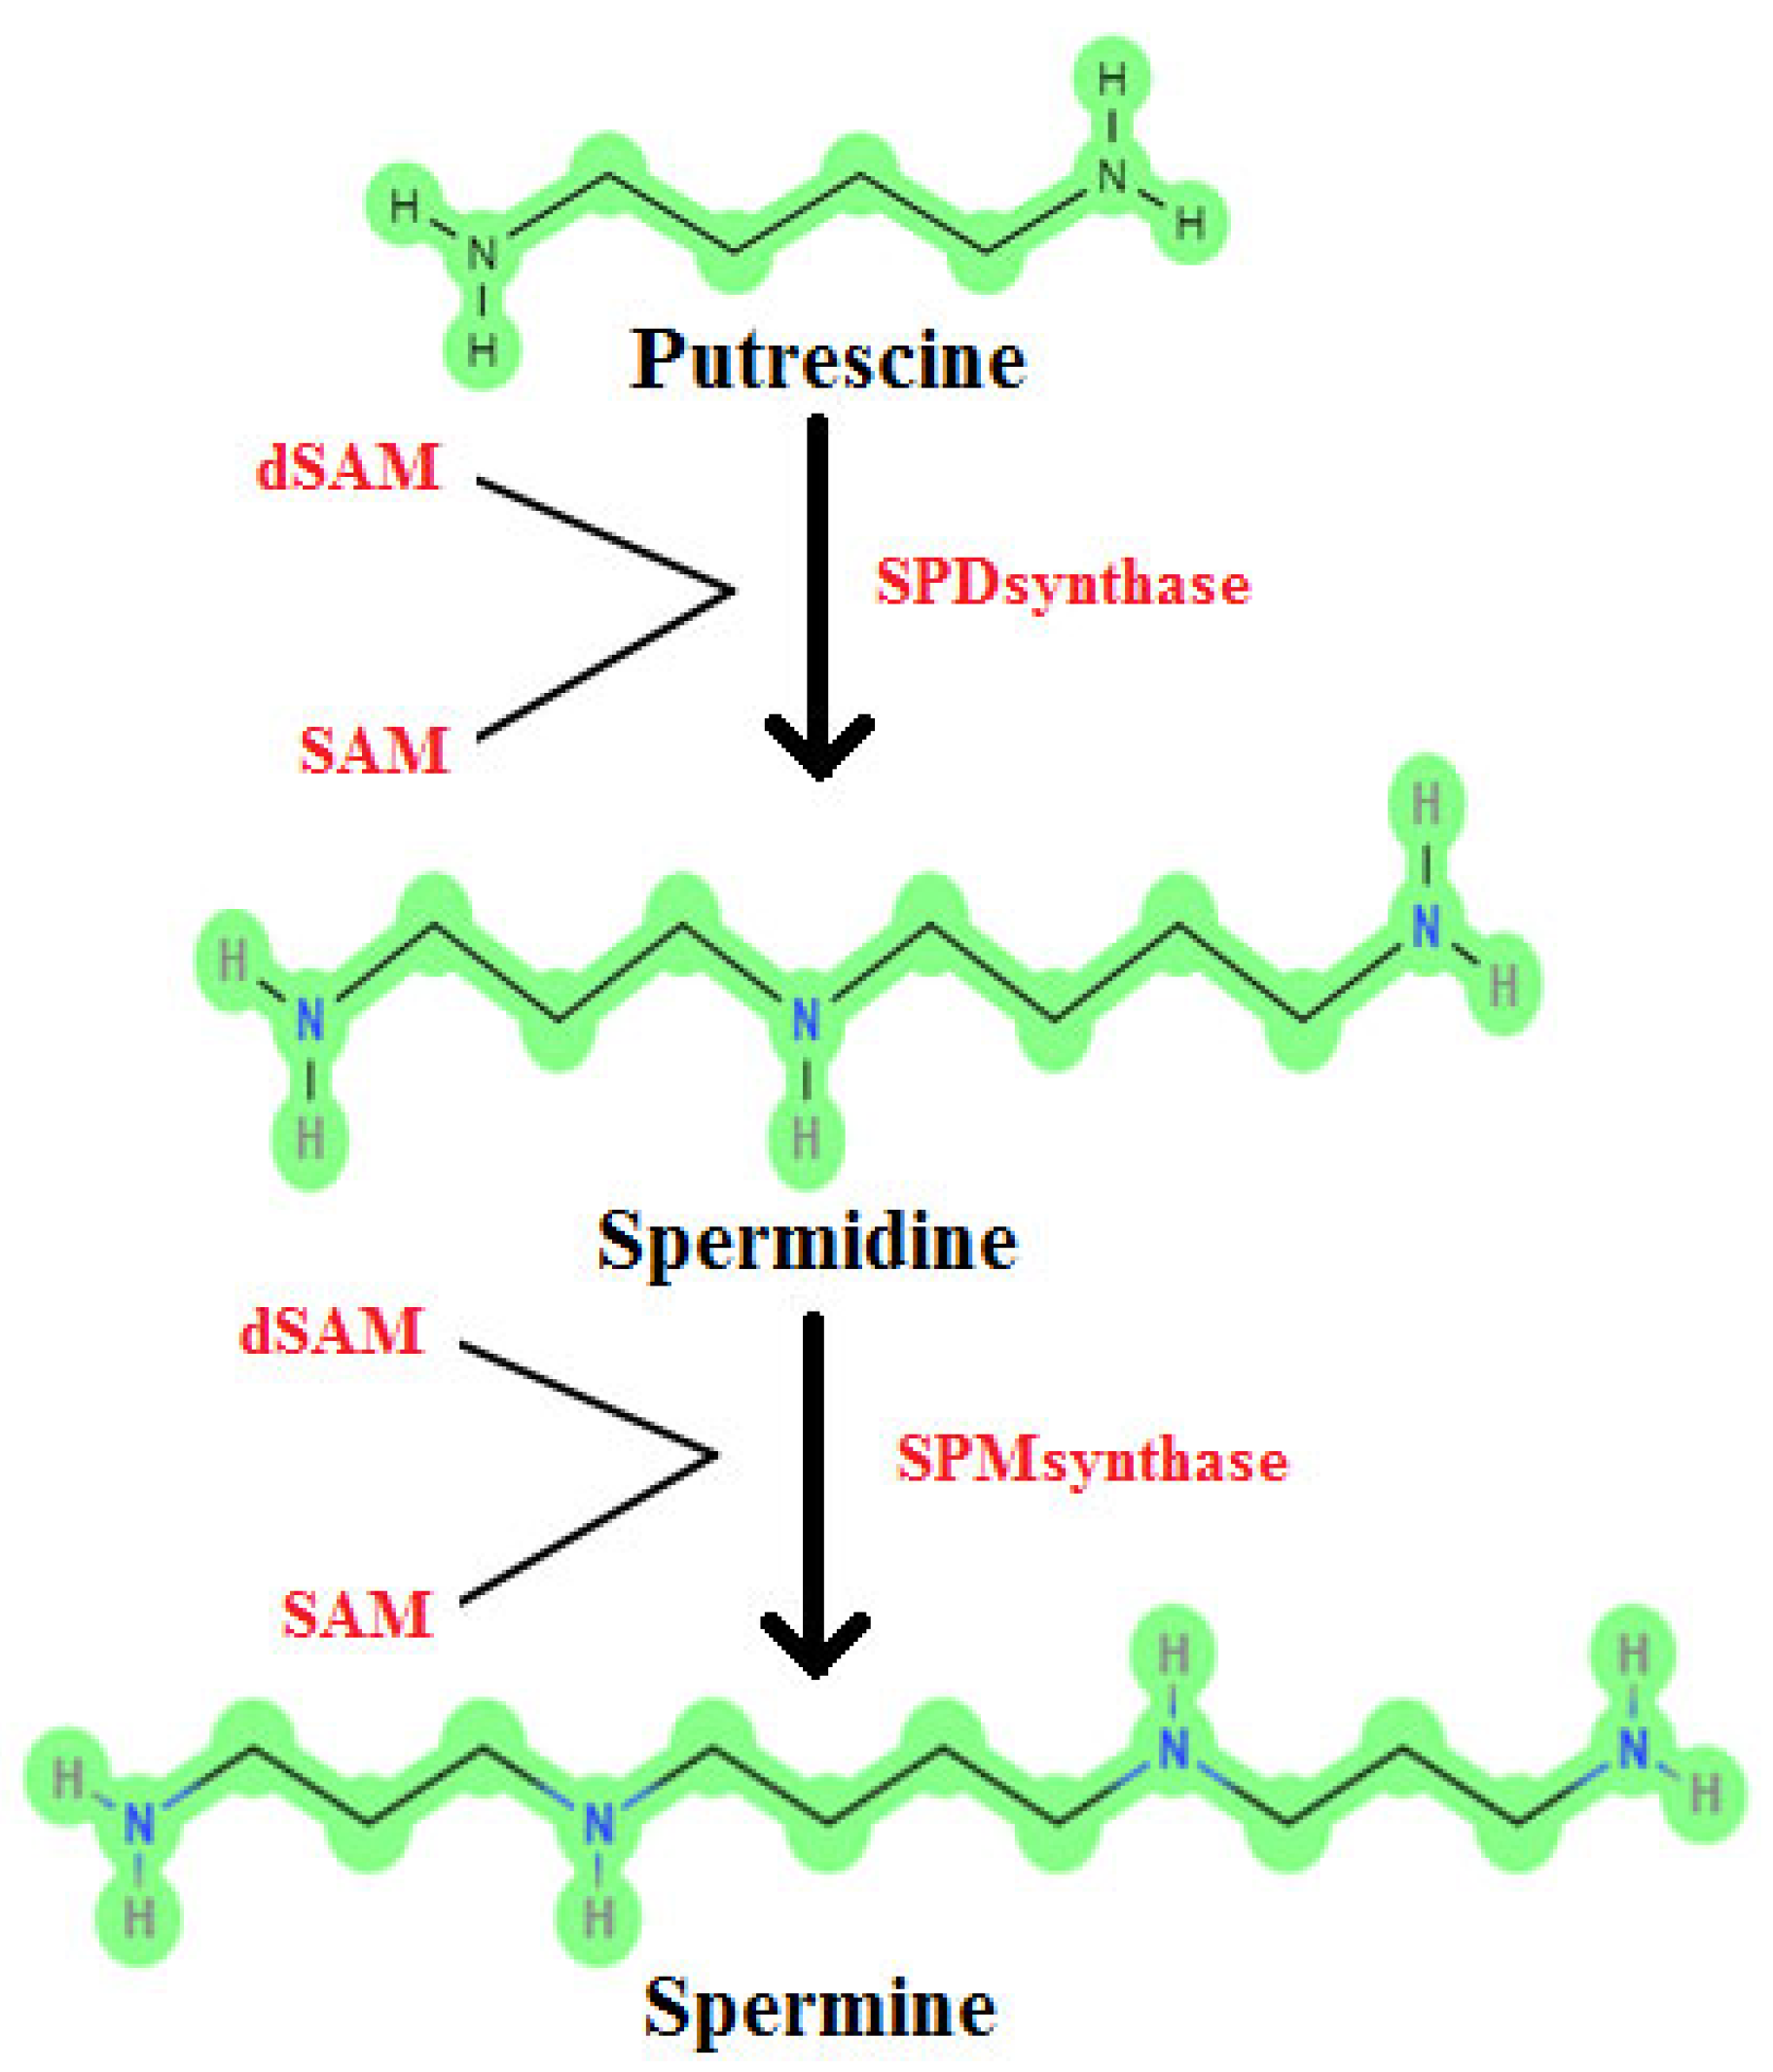
9]. The molecular structures of the aliphatic polyamines putrescine (C
4H
12N
2), spermidine (C
7H
19N
3), and spermine (C
10H
26N
4) are shown in
Figure 1. These polyamines are frequently encountered in the medical field in the diagnosis of specific diseases. However, no study has been found in which PUT, SP, and SPD metabolites were measured in serum using the HPLC method, which provides sensitive, repeatable, and reliable results as an analysis method, and also included data such as working curves and chromatograms. This study aimed to develop a high-performance liquid chromatography method for the determination of serum PUT, SP, and spermidine.
3. Results
3.1. Serum Putrescine, Spermine, and Spermidine Findings
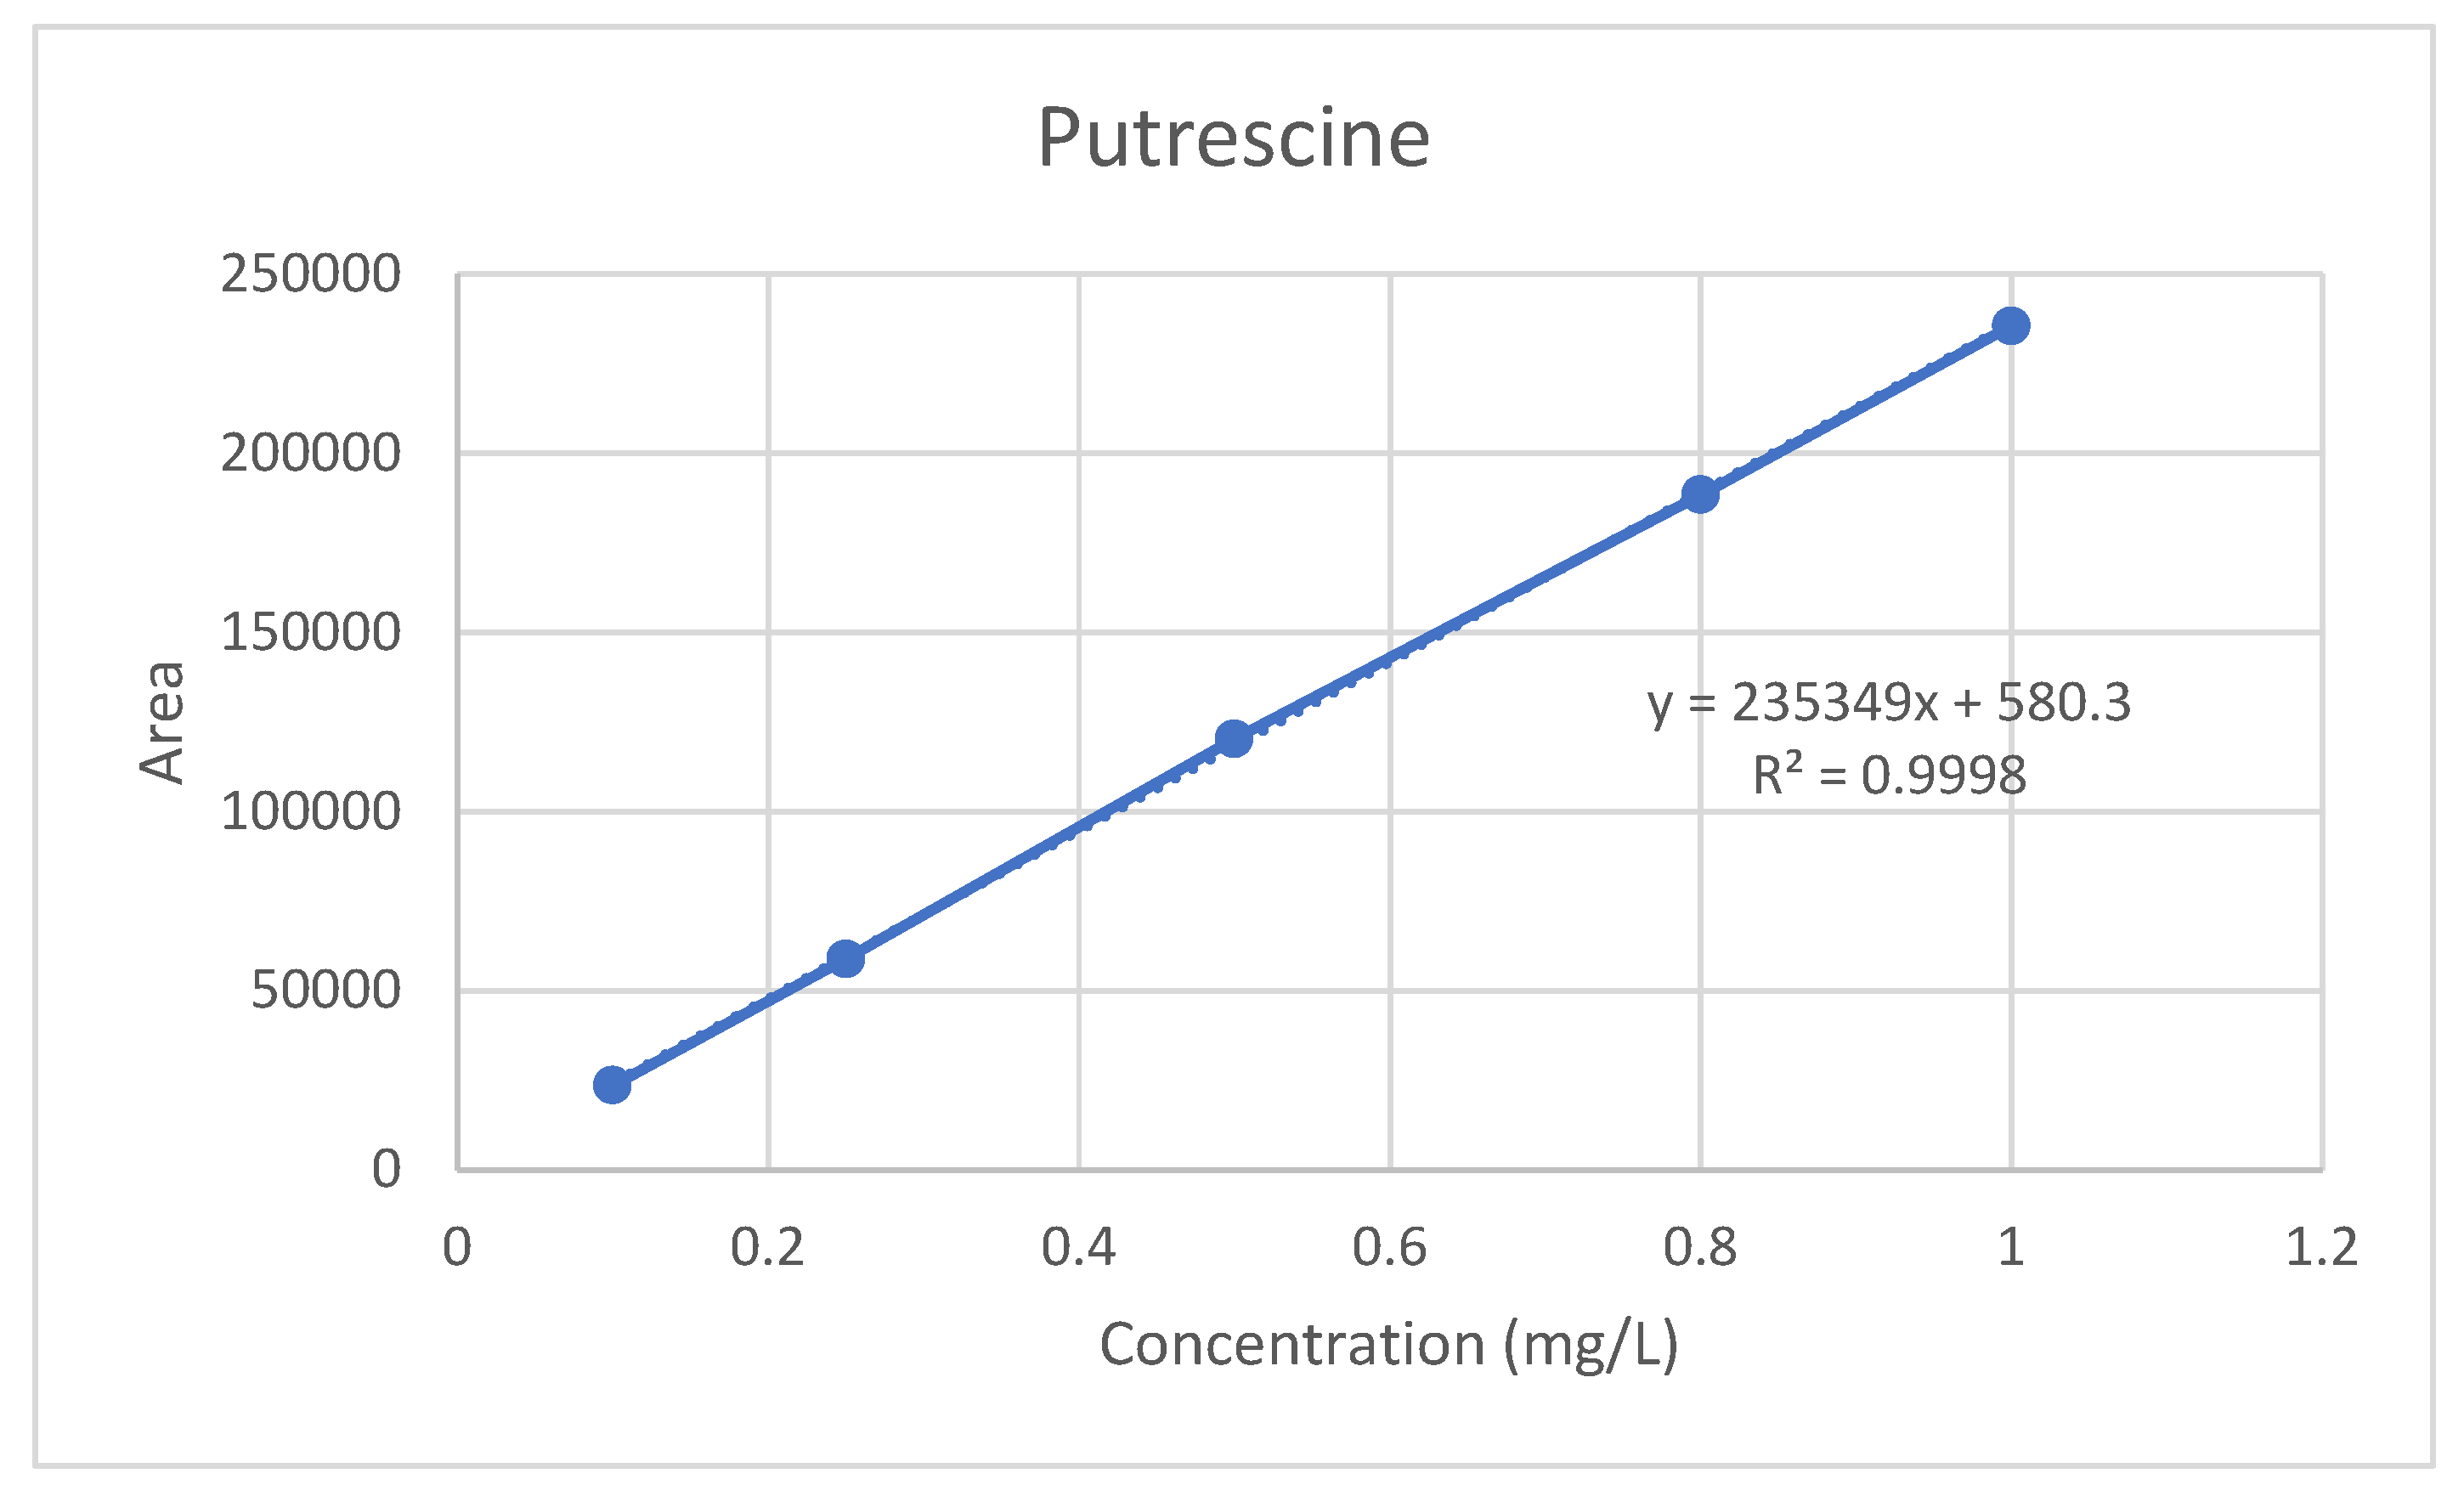
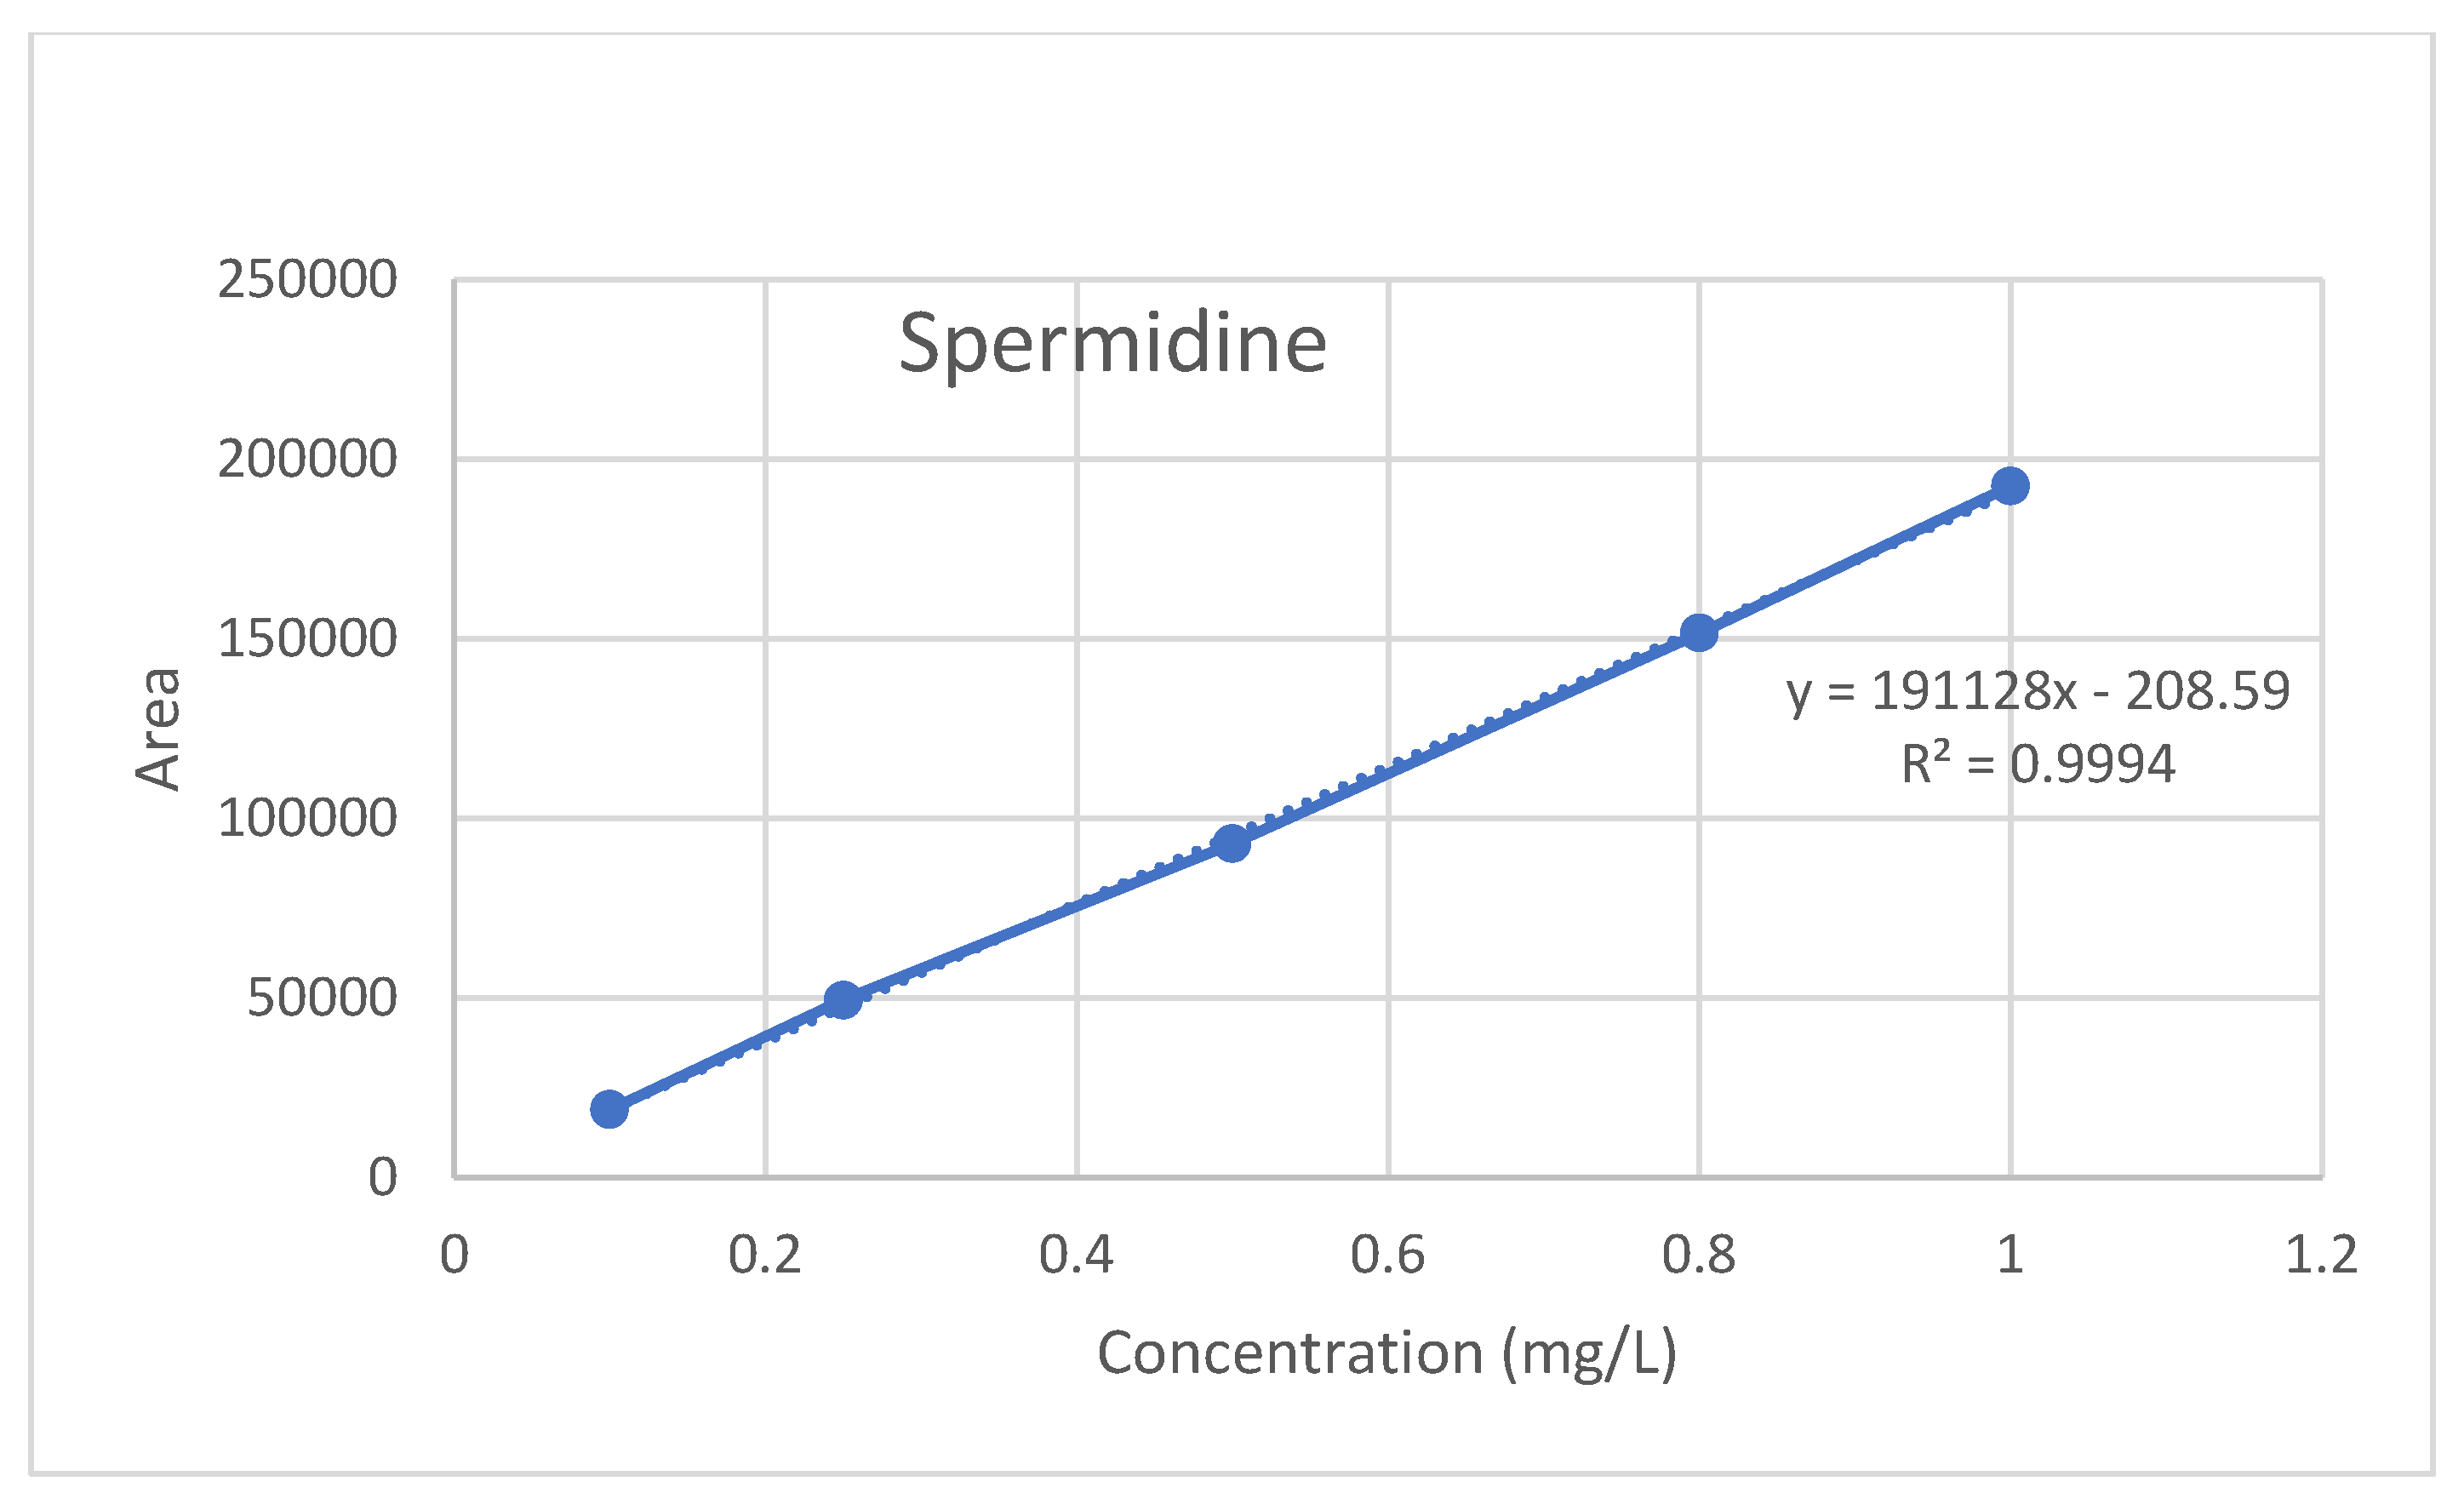
For the serum PUT, SP, and SPD standard calibration curves, standard solutions were prepared at five different concentrations from the standard stock using ultrapure water with ranges of 0.1, 0.3, 0.5, 0.8, and 1 mg/L. The serum standard curve was constructed by plotting a dataset of the peak area ratio of the analyte against the internal standard (in blank serum) versus the added concentration. The serum samples were expressed as the peak areas above the internal standards and the analyte concentrations were calculated from the standard curves (
Figure 3,
Figure 4 and
Figure 5).
The linearity of the method is defined by the least squares method as the correlation coefficient (R
2) ≥ 0.9950. The R
2 value obtained from the calibration study for the serum PUT was 0.9998 (
Figure 3). Therefore, the PUT method has linearity.
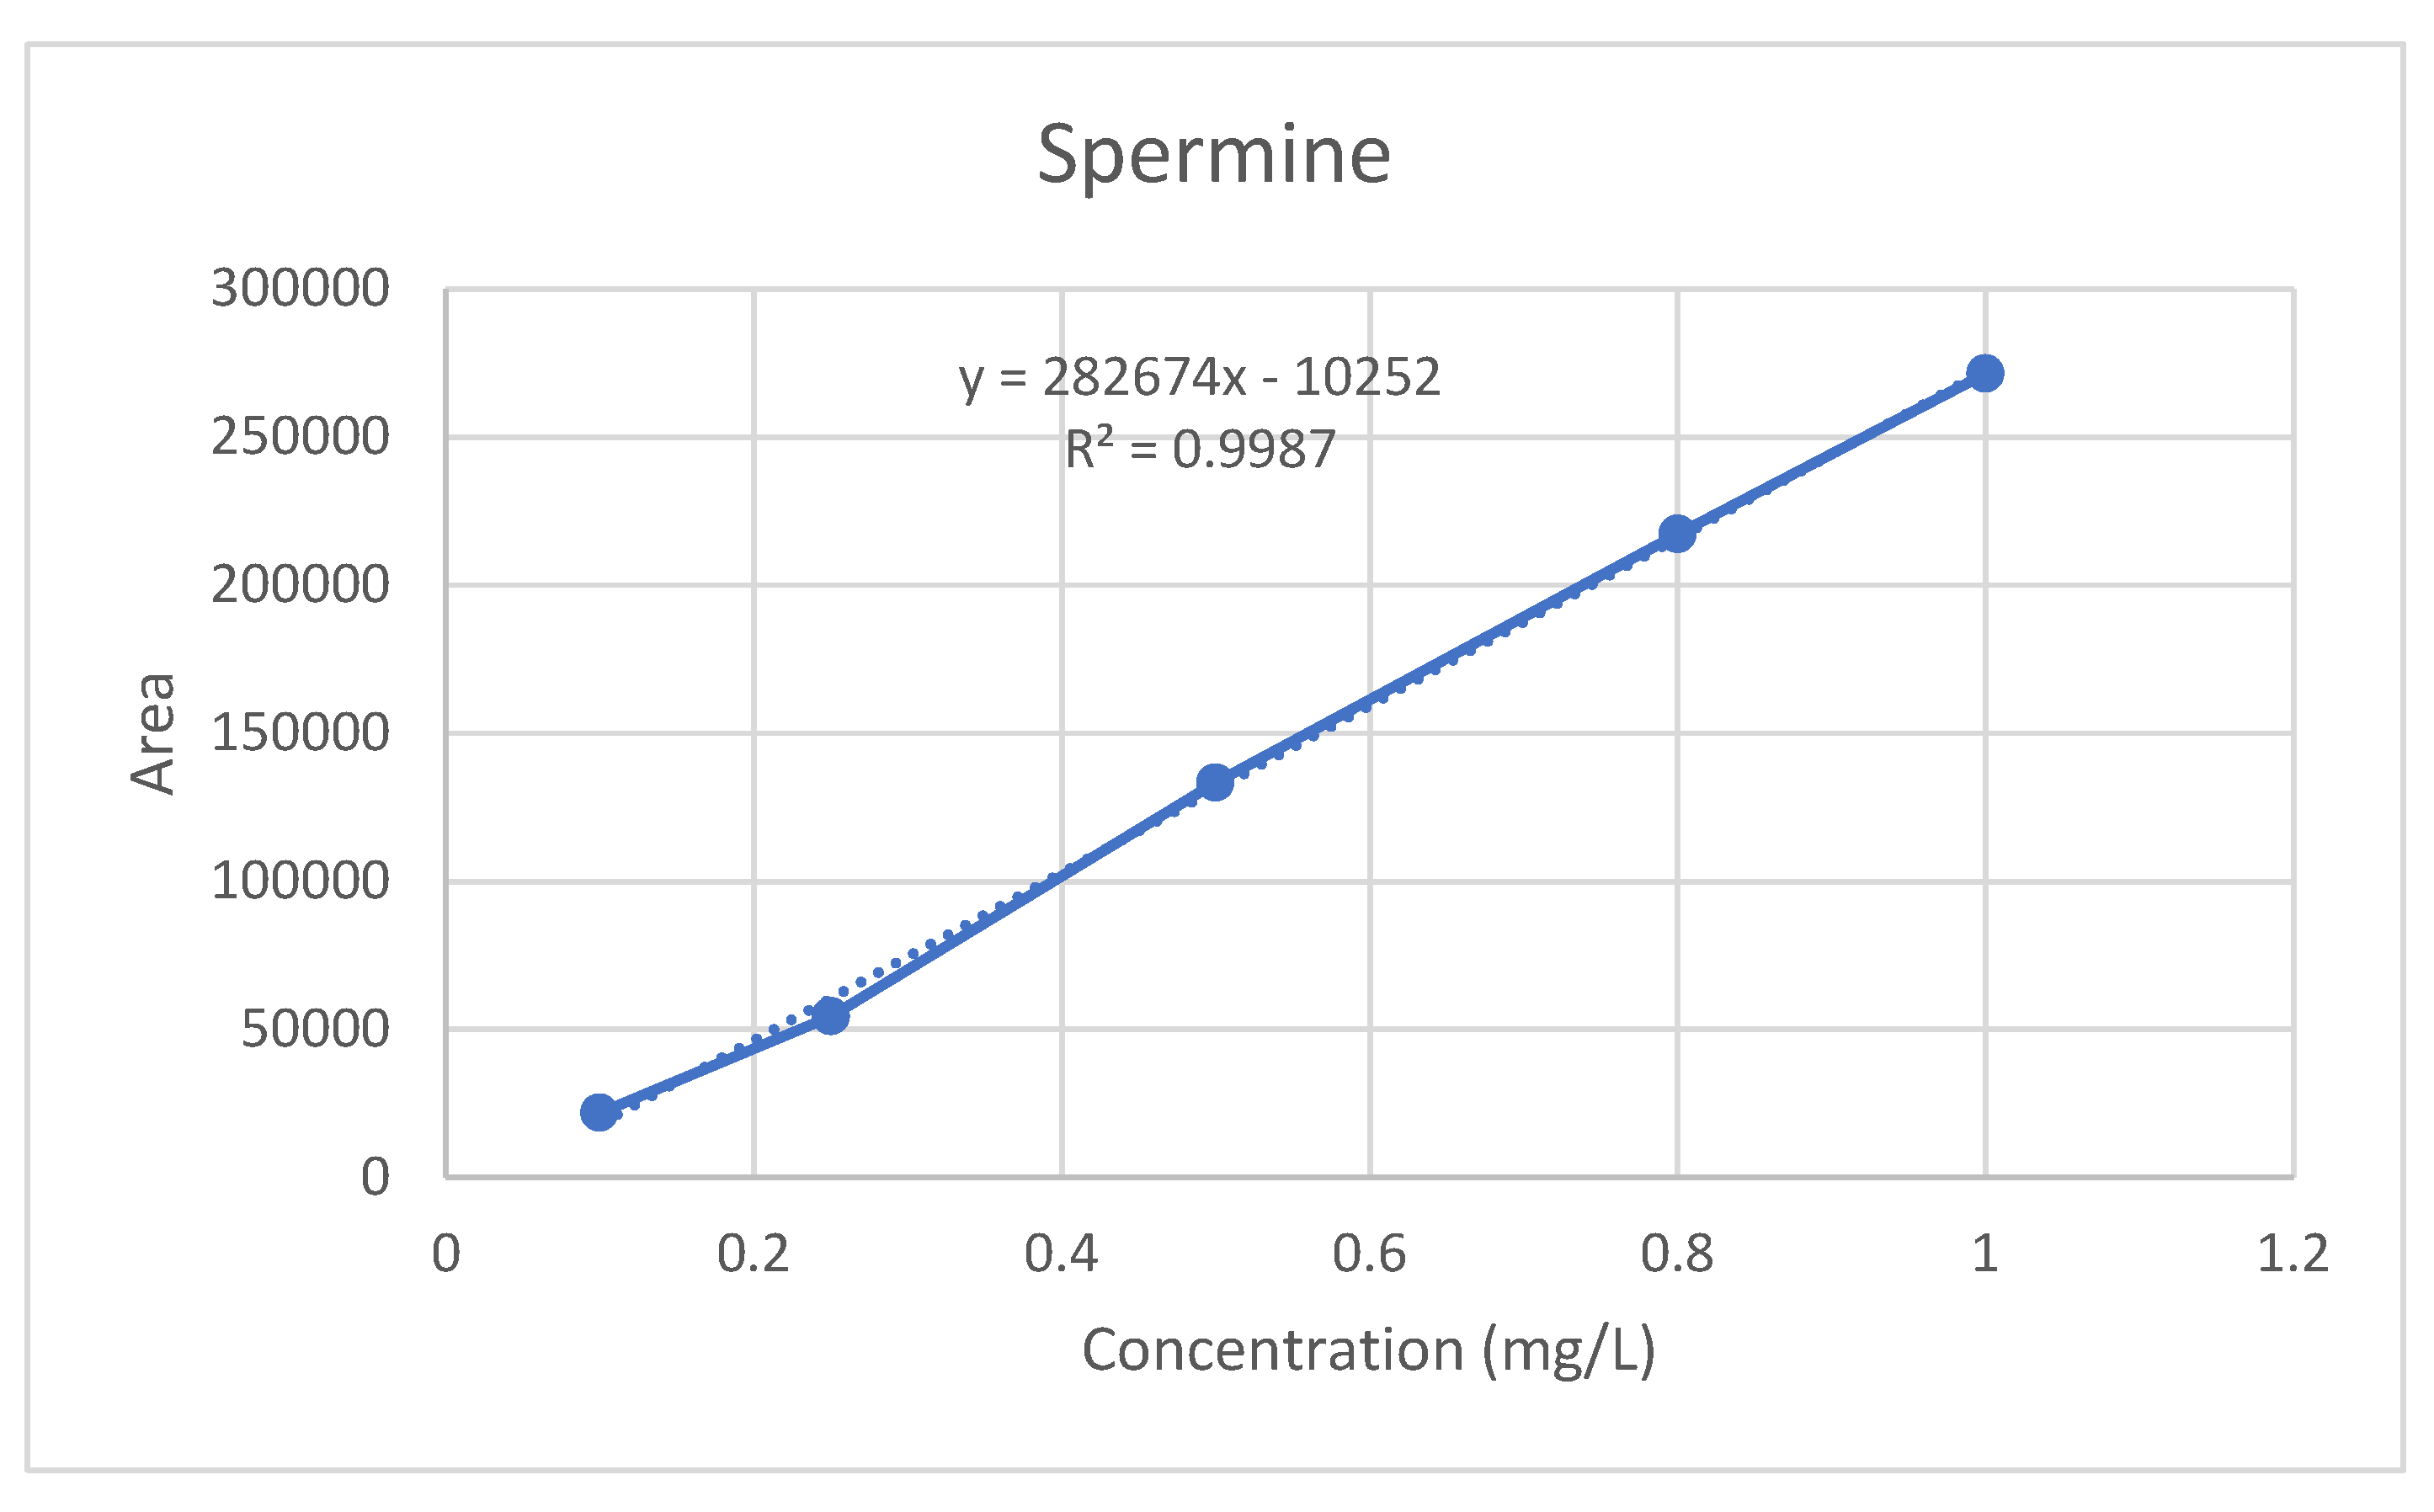
The linearity of the method is defined as the least squares method and the correlation coefficient (R
2) ≥ 0.9950. The R
2 value obtained from the calibration study for serum SP was determined as 0.9987 (
Figure 4). Therefore, the SP method has linearity.
The linearity of the method is defined as the least squares method and the correlation coefficient (R
2) ≥ 0.9950. The R
2 value obtained from the calibration study for serum SPD was determined as 0.9994 (
Figure 5). Therefore, the SPD method has linearity.
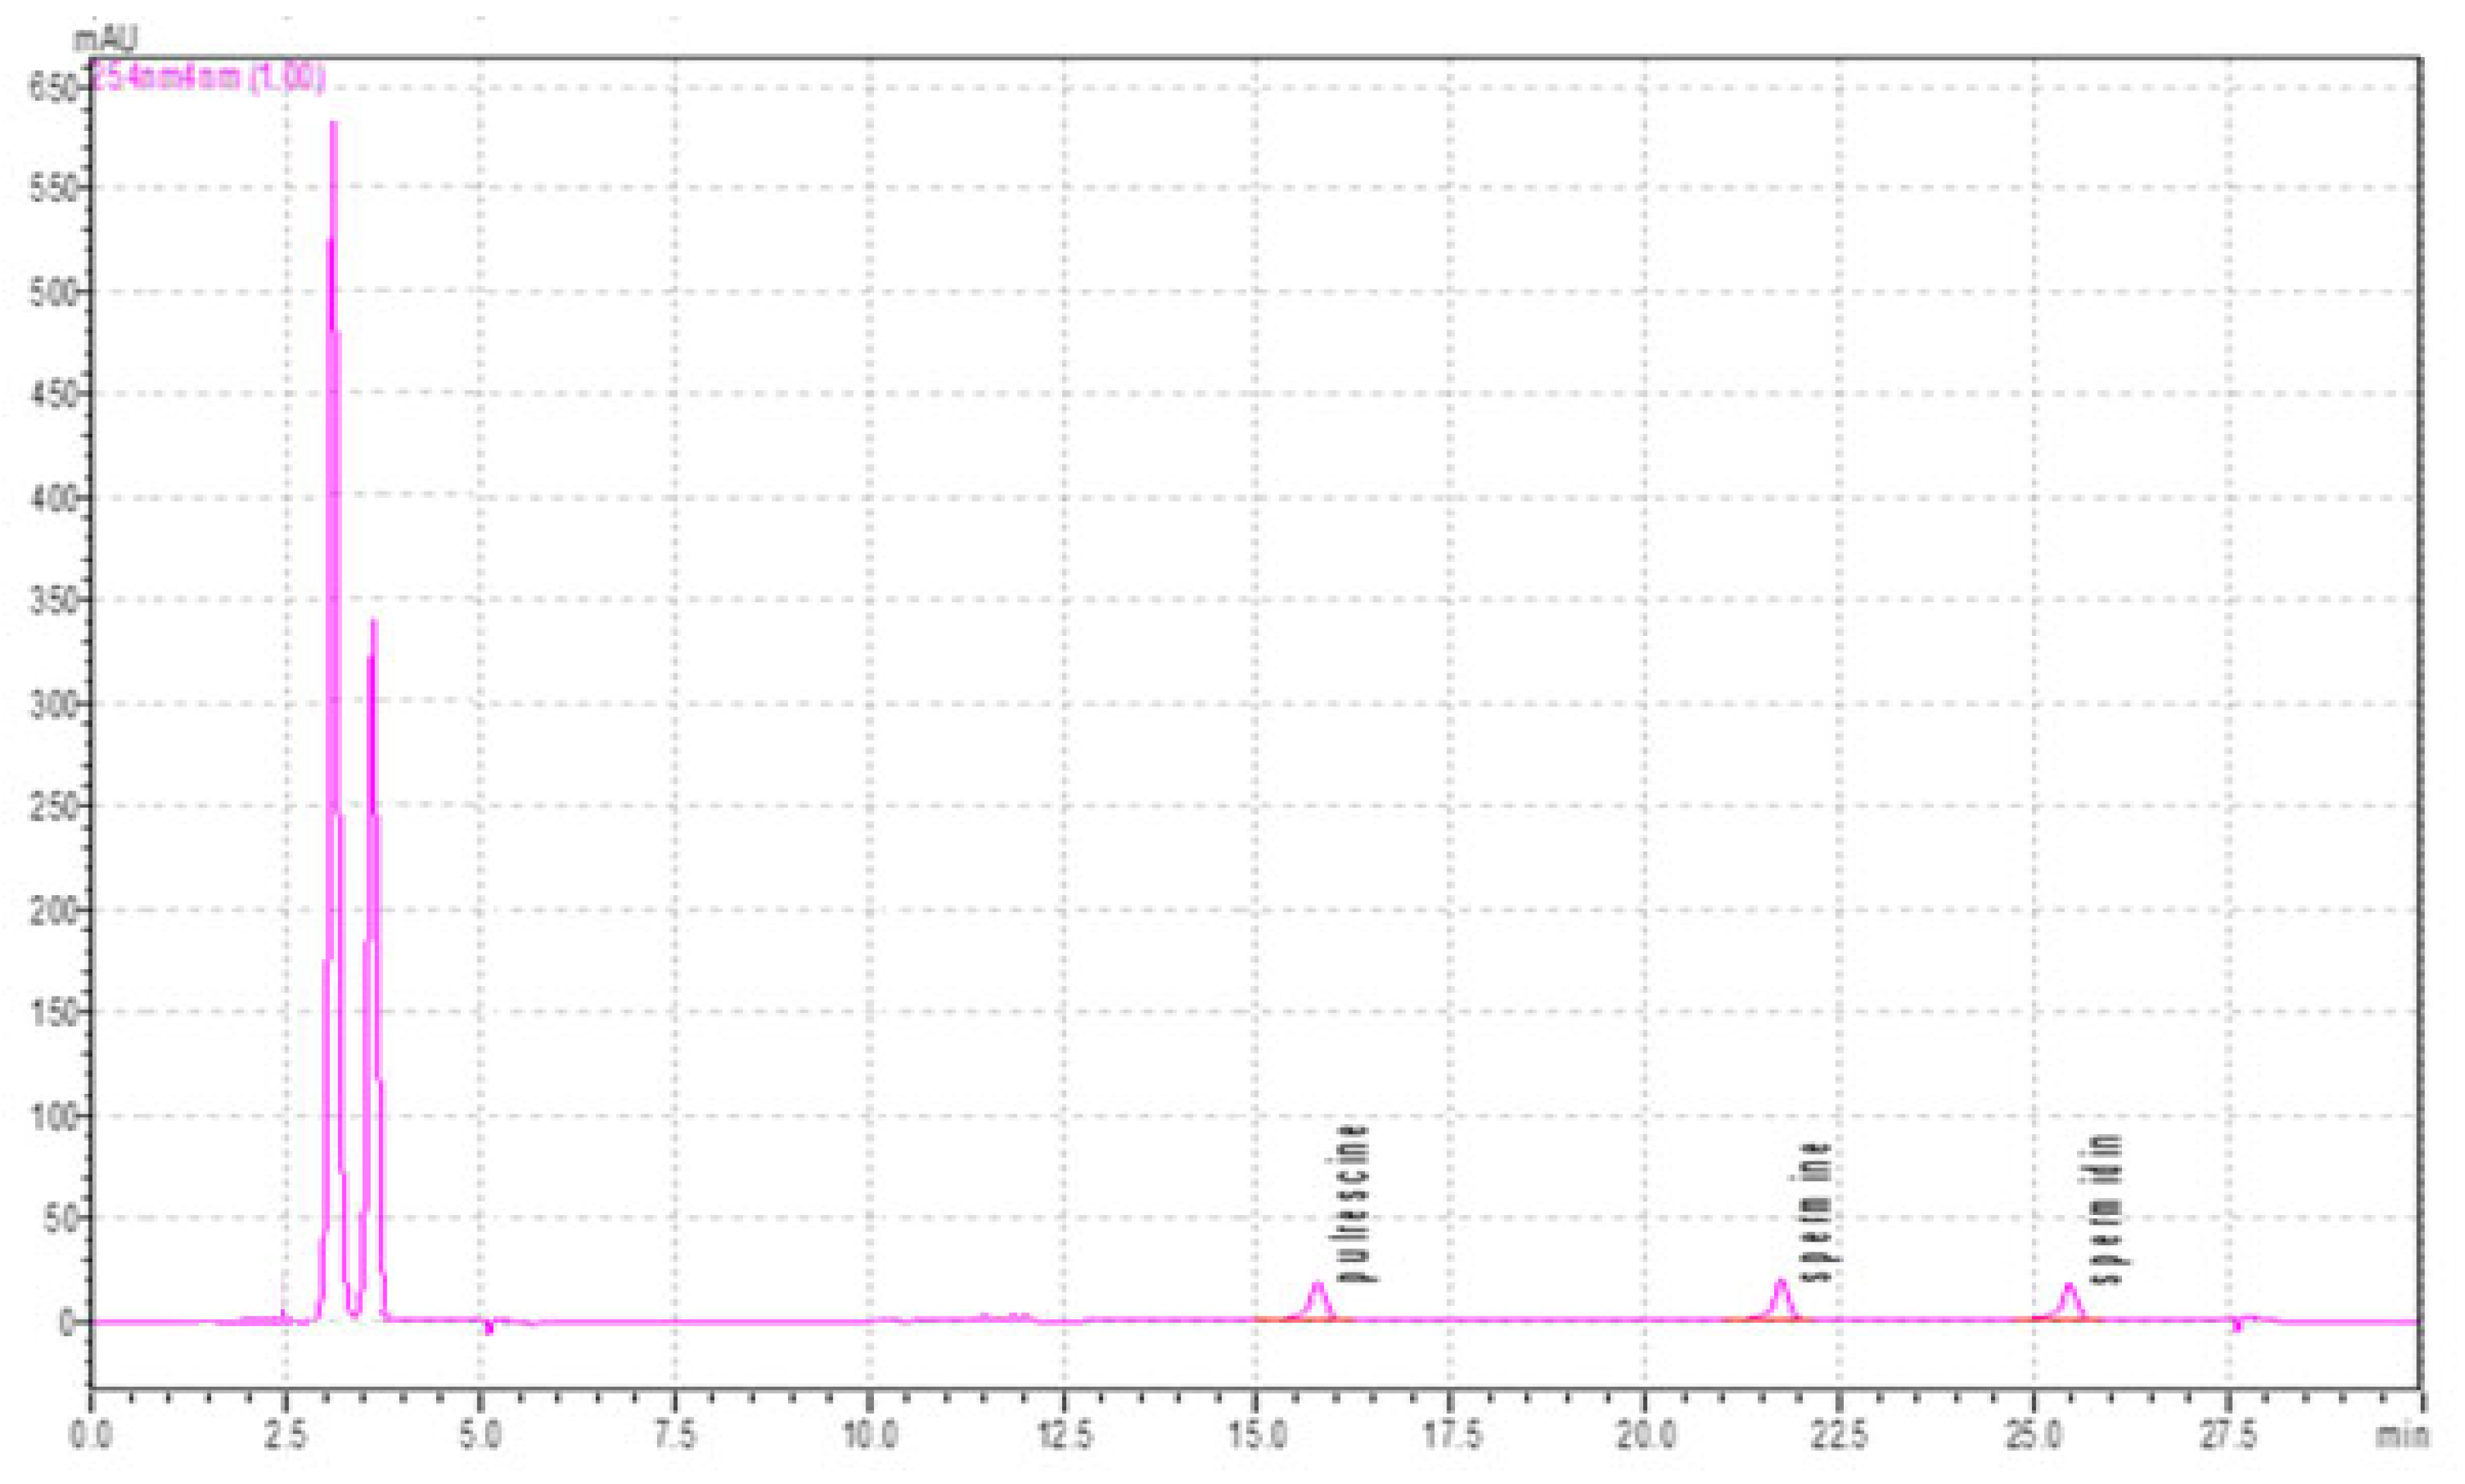
The HPLC run time of the PUT, SP, and SPD standard solutions whose linearity and calibration curve were drawn was set to 30 min. The retention times obtained as a result of the injection of the chromatogram peak value with a 30 min gradient program were found to be approximately 15.7 min (PUT), 21.7 min (SP), and 25.5 min (SPD) (
Figure 6).
Quality control samples were prepared with five different solutions of 0.1, 0.3, 0.5, 0.8, and 1 mg/L of serum PUT, SP, and SPD for the lower and upper values of linearity in the study. The quality control solutions were designed to obtain accurate results on the same day and between different days. For the quality control samples taken from stock solutions and specified with human serum, each 2 mL serum sample obtained from the serum of healthy individuals was divided into two separate tubes, each containing 1 mL, to which 0.1, 0.3, 0.5, 0.8, and 1 mg/L of the PUT, SP, and SPD standards were added and their concentrations were determined according to an external standard curve. The precision of the method, the intraday coefficients of variation, and the accuracy of the method were determined by looking at the difference between the added concentrations of PUT, SP, and spermidine.
3.2. Method Validation
In the research, additional to the linearity data, which include the linearity range, linearity equation, and correlation coefficients of calibration curves, the limit of detection (LOD), limit of quantification (LOQ), recovery, and repeatability assessments were conducted [
14]. Validation, meaning the process of confirming the method’s effectiveness, refers to proving that the developed technique is acceptable across a broad range of performance metrics for its intended application, especially concerning the reproducibility of the analytical process [
15]. A validated and proven analytical method is crucial for generating reliable, consistent, and accurate data in analytical measurements and forming conclusions. The analyses conducted with validated methods meet the standards of good analytical practices, ensuring quality, dependability, and consistency [
16]. In biochemical analysis, method validation assures the reliability of the method used for determining analyte concentrations in bodily fluids like blood, serum, plasma, urine, or saliva [
17]. The purpose of validating an analytical method is to verify its suitability for the intended use. Furthermore, method validation serves as evidence of the method’s reliability and accuracy, confirmed through data from calibrated instruments. Therefore, a validated analytical method consistently provides accurate results since it operates with instruments that are regularly recalibrated. The developed method should remain unaffected by changes in calibrated devices and instruments, ensuring reproducibility [
18].
3.3. Analytical Method Validation Parameters
In this research, the guidelines set forth by the ICH, FDA, and EMA for the analytical method validation of biological materials were strictly followed [
17,
19]. The validation of the PUT, SP, and SPD method was carried out based on parameters such as selectivity, linearity, accuracy, precision, intra- and interday repeatability, recovery, lower limit of quantification (LLOQ), and stability. The precision criterion assesses random errors and indicates how close the results of repeated analyses are to one another. The method selection is based on factors like the operating conditions of the analytical method, accuracy demonstrating repeatability, the individual performing the analysis, the equipment used, and the laboratory facilities available. When the repeatability and reproducibility fall within specific ranges of the precision criterion, the results become significant in the serum analyses.
3.4. Repeatability
Repeatability refers to the consistency of the results when an analysis is conducted by a single analyst using the same equipment at short intervals in the same laboratory under as consistent conditions as possible. It represents the relationship between analyses performed on the same sample using the same method, in the same laboratory, by the same person, with the same equipment, but on different days. It also indicates the absolute difference (which typically remains within a confidence interval of 95%) between the results of two analyses performed under these conditions. In our study, these conditions were met by analyzing the PUT, SP, and SPD standard solutions on different days instead of the serum samples, taking into account the short half-life of PUT, SP, and spermidine, thus confirming the reproducibility of the method.
3.5. Reproducibility
Reproducibility refers to the ability of the method to produce consistent results across different laboratories or analysts. It reflects the degree of similarity between results obtained from collaborative studies between laboratories. It symbolizes the absolute difference (again expected to fall within a 95% confidence interval) between the results of two analyses conducted on the same sample, using the same method and equipment, but by different individuals in separate laboratories on different days. Reproducibility is expressed through the calculation of the relative standard deviation (RSD) of the results. In our study, the reproducibility phase was omitted because our unit only had one HPLC system available, and setting up the analysis across different laboratories or personnel was not feasible.
3.6. Selectivity Factor
Biological fluids contain a wide variety of substances, making it highly probable that interfering compounds are present in the analyte pool. These substances may include exogenous xenobiotics, drugs, metabolites, endogenous matrix components, and other degradation products. If the analytical method is designed to quantify multiple substances, it is necessary to conduct tests to confirm that each analyte being analyzed and separated does not interfere with others. The validation of the analytical method must be performed for all analytes to ensure the selectivity criterion is met. To satisfy selectivity requirements in the HPLC method, each analyte must have distinct retention times and appropriate capacity factors [
19]. In analyses involving two or more substances, clear separation is only possible if the capacity factor of one substance differs significantly from the others. In a mixture of two components, the capacity factors of the separated components are compared, and the selectivity factor (α) is calculated. The selectivity factor is influenced by factors such as the mobile phase and temperature, and is always greater than 1 (α > 1) [
12,
20].
3.7. Accuracy/Precision and Sensitivity Findings
The accuracy of the analytical method is determined by how closely the average data align with the actual amount (concentration) of the analyte in the sample being measured. Accuracy is assessed by repeatedly analyzing samples where the analyte concentration is known. These measurements are made for each concentration, and at least five concentrations should be tested. Accuracy is accepted if the deviation from the true value is within ±15%, except at the lower limit of quantification (LLOQ), where the deviation can be up to 20% [
18]. The precision and sensitivity of the selected method refer to how closely individual measurements of the analyte in replicate aliquots of a homogeneous biological matrix are grouped. To ensure precision, at least five repetitions of measurements should be performed for each concentration.
3.8. Recovery Findings
The relationship between the internal standard (which is expected to be reproducible, precise, and consistent) and the extraction efficiency of the analytical method defines the recovery. Ideally, the recovery value for the analysis should be 100%. Recovery experiments were conducted by comparing the analytical results for samples at three concentrations (low, medium, and high) with undecomposed standards, which represent 100% recovery [
19].
In analytical studies, recovery refers to comparing the detector response for a standard substance with the detector response for a given amount of the analyte extracted from the biological matrix. The lowest analyte concentration that can be quantified is known as the limit of quantification (LOQ). In calculating the LOQ, the signal from the lowest concentration sample is expected to be approximately 10 times the signal from a blank sample. To calculate this, five different concentrations of analyte solutions were analyzed using HPLC after dilution from the stock solution, and calibration curves were plotted. The LOQ was then calculated using the formula (LOQ = 10 × SD/slope). The recovery values for these concentrations represent the known concentration derived from the calibration curve.
4. Discussion
Aliphatic polyamines, including PUT, SP, and SPD, play a critical role as key factors in important biochemical processes related to cellular activities and cell proliferation. They function as regulatory molecules in various stages of DNA, RNA, and protein synthesis, processes directly associated with cell growth [
21,
22]. The presence of polyamines in body fluids has been effectively detected previously [
22], suggesting that their levels may increase during certain pathological proliferative processes. The analytical measurement of these molecules in human serum or in tissues with high metabolic activity may be particularly valuable in identifying pathological conditions, such as cancer cells and tumors. Given these observations, polyamines are recognized as crucial biomarkers for the early detection and treatment of cancer [
21,
23,
24,
25,
26,
27]. In particular, the in vivo concentration of polyamines can be viewed as a reflection of the dynamic balance between their biosynthetic and catabolic pathways. This balance may be disrupted during the process of cancer development. As a result, alterations in the polyamine metabolome levels within body fluids are likely to occur. Therefore, the precise detection and concurrent identification of the polyamine metabolome could provide a strong basis for exploring the potential connections between cancer and polyamine metabolism. Consequently, developing a rapid and practical method for the regular analysis of these compounds in human serum would greatly benefit the early diagnosis and accurate prognosis of such pathological processes.
The levels of PUT, SP, and SPD in serum samples were determined using the HPLC method. So far, previous studies on the analysis of polyamines measuring the PUT, SP, and SPD and levels in human serum have generally been limited to other biological fluids such as plasma [
28], urine [
29,
30], seminal fluid [
31], cerebrospinal fluid [
32,
33], bile [
34], and colostrum [
35]. However, we have not come across any recent studies that present validation procedures based on the precision, accuracy, reproducibility, selectivity, recovery, calibration/standard curve (linearity range), lower limit of quantification (LLOQ), and stability parameters of the HPLC method results.
The present study presents findings related to a newly developed method for the determination of polyamines in serum samples. In this study, the PUT, SP, and SPD levels in serum were determined after modifications were made to the methods previously performed using HPLC and confirmed by method validation and accuracy tests. Here, we performed the derivatization process using dansyl chloride and made some minor modifications to the methods reported in the literature. This method utilizes a fluorogenic derivatization reagent, such as dansyl chloride, to achieve high speed, simplicity, versatility, sufficient sensitivity, and specificity, making it highly advantageous. Dansyl chloride is considered a fluorogenic derivatization reagent. This compound is commonly used in various analytical methods, particularly for derivatizing amine groups. Dansyl chloride reacts with amine groups to form derivatives that exhibit fluorescent properties. This characteristic is especially useful in HPLC (high-performance liquid chromatography) and other spectroscopic analyses, as the derivatized compounds can be easily detected under UV or visible light. In human serum or body fluids, OPA (o-phthalaldehyde) is commonly used as a derivatizing reagent [
3]. Therefore, our study is both current and innovative in this aspect.
Dansyl chloride is frequently preferred as a sensitive and selective derivatization reagent, especially for the analysis of amine-containing compounds. The accuracy of this method has been tested through an analysis conducted on 20 human serum samples. For optimal separation, a C18 column was chosen, considering the appropriate properties of the stationary phase, particle size, diameter, and length, which are suitable for polyamines and their metabolites. Gradient tests were applied to eliminate interference in retention times during the measurement of PUT, SP, and SPD in serum. The levels of PUT, SP, and SPD in serum samples were determined using the HPLC method, in accordance with EMA and FDA validation guidelines. The accuracy, sensitivity, reproducibility, selectivity, recovery, calibration/standard curve (linear range), and quantities of the results were established. Validation procedures were carried out considering the lower limit of quantification (LLOQ) and stability parameters. In this analysis conducted with the HPLC method, the chemical substances forming the mobile phase were carefully selected to prevent interference from false peaks caused by the serum matrix or other contaminants, thereby avoiding interference with standard peaks.
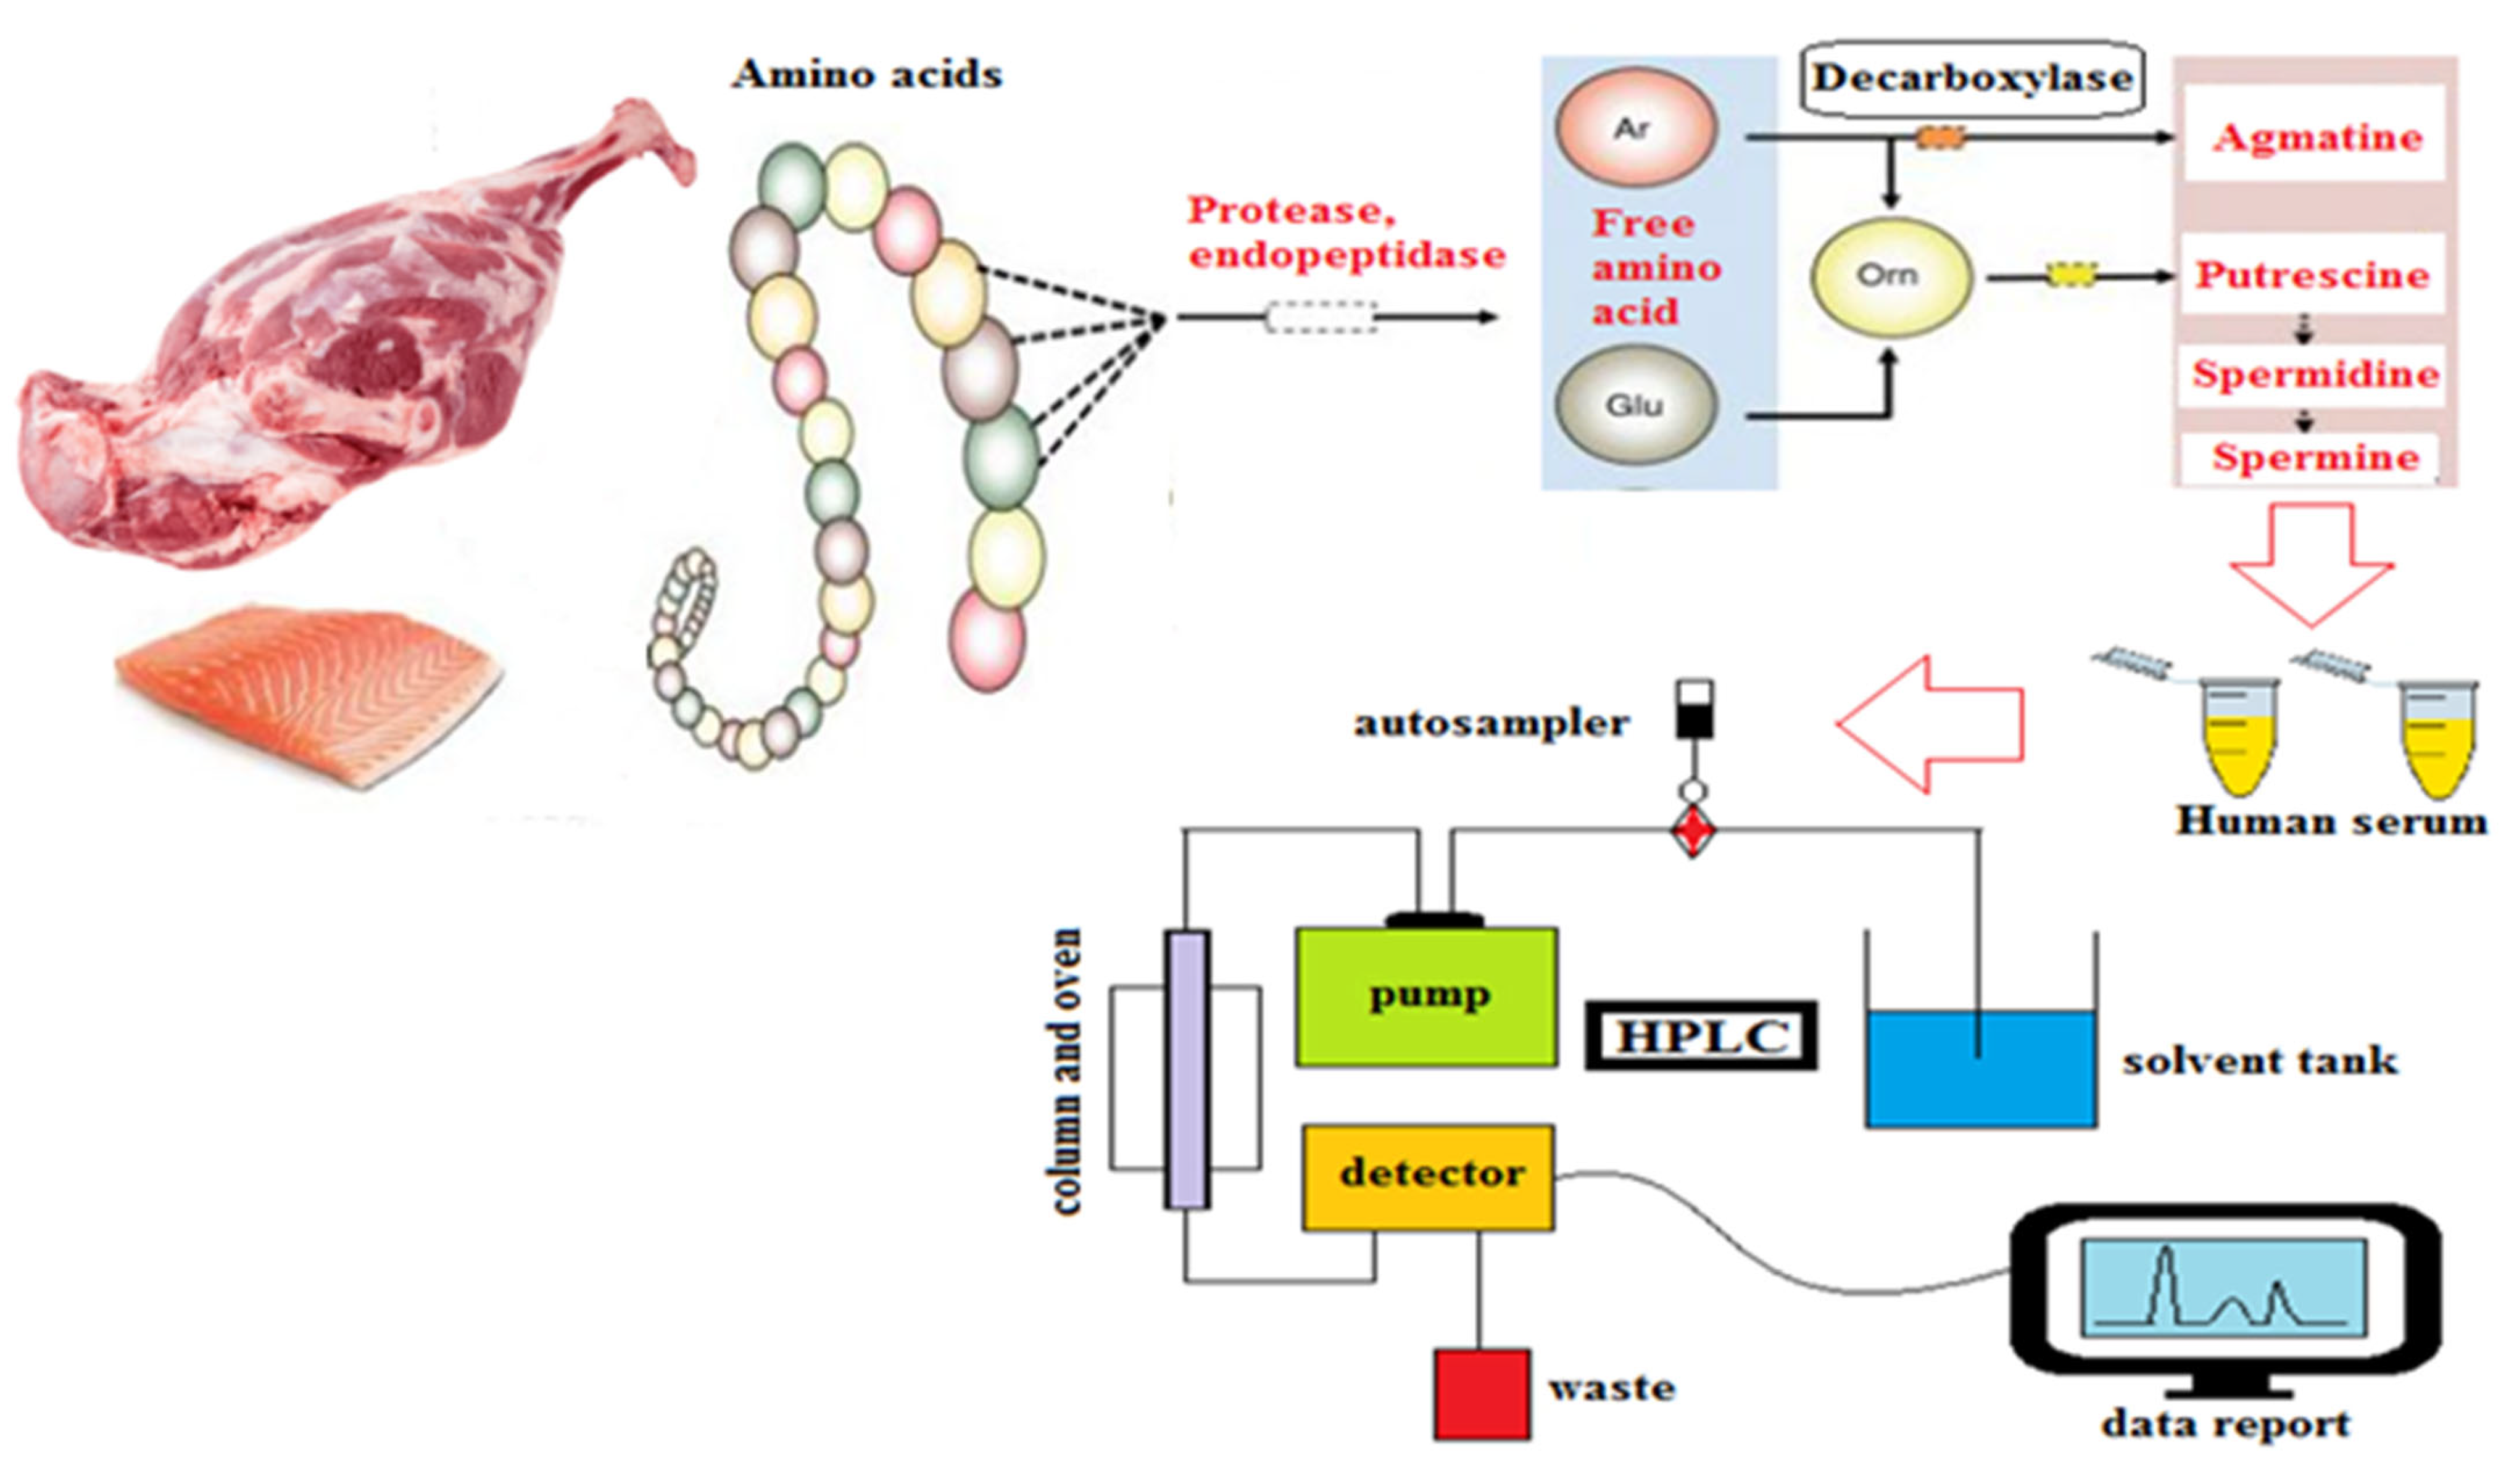
Polyamine biosynthesis is an ancient metabolic pathway found in all living organisms and the homeostasis of polyamines is essential for the survival of cells. Polyamine deregulation is related to diseases such as cancer or neurodegenerative disorders. In healthy cells, the polyamine level is complexly controlled by biosynthetic and catabolic enzymes. Biosynthesis utilizes the amino acids arginine, ornithine, and methionine [
36]. The analysis of polyamines such as PUT, SP, and SPD is very important for the diagnosis and treatment of various diseases, especially in medicine and health. A C18 (150 mm × 4.6 mm, 5 µm) column was used for optimal separation by taking into account the column filler material, particle size, diameter, and length, which have suitable properties for polyamines. Gradient tests were performed to eliminate retention time interferences in the measurements of the serum PUT, SP, and SPD standard solutions. Validation procedures were carried out considering the precision, accuracy, reproducibility, selectivity, recovery, calibration/standard curve (linearity range), lower limit of quantification (LLOQ), and stability parameters of the PUT, SP, and SPD levels in serum samples (
Table 1). To ensure accuracy, interference from standard peaks was minimized by eliminating false peaks caused by the serum matrix or impurities in the mobile phase.
The analytical validation of the PUT, SP, and SPD measurement technique presented in this study demonstrates significant improvements over conventional methods, particularly HPLC. While HPLC remains a widely accepted and reliable technique known for its sensitivity, the proposed method demonstrates improved detection sensitivity, linearity, and recovery rates, especially when used with biological matrices. By optimizing the conditions and using a specific validation approach, this method not only competes with conventional methods in terms of time efficiency and cost-effectiveness, but, in some cases, surpasses them, offering a promising alternative for routine analysis. These results provide valuable insights into PUT, SP, and SPD research and highlight the potential application of this innovative method in both clinical and research fields.
5. Conclusions
In this investigation, the validation of the analytical method for PUT, SP, and SPD was carried out following the criteria set forth in ICH, FDA, and EMA guidelines. The validation parameters encompassed selectivity, linearity, accuracy, precision, repeatability, recovery, the lower limit of quantification (LLOQ), and stability. Precision was evaluated by examining the consistency of repeated measurements under identical conditions. Repeatability was confirmed through multiple analyses of PUT, SP, and SPD standard solutions conducted on different days. However, reproducibility was not assessed due to constraints in the laboratory’s equipment and setup.
The selectivity of the method was also thoroughly tested to ensure there was no interference from other substances found in the biological matrices. Selectivity is particularly important for HPLC, as each analyte needs to exhibit distinct retention times and appropriate capacity factors to ensure effective separation. The findings from this study confirmed that PUT, SP, and SPD could be accurately quantified without interference from other components, thus affirming the selectivity of the method.
Furthermore, both accuracy and precision were evaluated. Accuracy was assessed by comparing the concentrations of PUT, SP, and SPD measured in the samples with known concentrations, while precision was gauged by analyzing the variability of repeated measurements. The results indicated that the method demonstrated excellent precision, with minimal variation between repeated analyses, thereby establishing its reliability for the accurate quantification of PUT, SP, and spermidine.
When contrasted with other analytical methods, particularly HPLC, this technique showed comparable or even superior performance, especially with respect to precision and accuracy [
3,
10]. The LLOQ was also determined, ensuring that the method could reliably detect PUT, SP, and SPD at very low concentrations, which is essential for biological analyses. In conclusion, the validation of the method confirms its robustness and suitability for PUT, SP, and SPD analysis in various biological matrices.
It is important that this study represents the gold standard and is superior to indirect measurement methods. In this study, a reproducible method was developed using HPLC based on standardized PUT, SP, and SPD working curves and other validation criteria. Polyamine biosynthesis is an ancient metabolic pathway found in all living organisms and the homeostasis of polyamines is essential for cell survival. However, HPLC methods for the analysis of serum PUT, SP, and SPD are not sufficiently descriptive and are quite limited in the literature. In addition, HPLC is the gold standard method in terms of standard operating curves and the linearity and reproducibility of polyamines such as serum PUT, SP, and spermidine. Therefore, we have developed a new and modified method to be used in serum analysis. Serum PUT, SP, and SPD analysis using the HPLC method, which is superior to indirect methods such as ELISA, will make a great contribution to the literature in terms of rapid and reproducible results in the diagnosis of some specific diseases in chronic patients admitted to hospitals.
Several techniques are also used for polyamine selection, including LC-MS and ELISA. However, while these variants offer high accuracy, they often come with limitations such as highly complex sample preparation and insufficient accuracy for certain analyses. In contrast, the presented HPLC method offers a convenient supplementary, reproducible, and accessible alternative with optimized derivatization for serum polyamine analysis. This study fills an important gap in the knowledge by developing and optimizing an HPLC-based derivatization method for the determination of serum polyamines and presents a novel approach to polyamine quantification with improved degradation and reproducibility.


