Abstract
Five different extraction methods were assessed to select an optimal procedure for extracting the phenolic antioxidants from potato tubers. Total phenolic content and antioxidant capacity were determined for each type of extraction. In total, 144 samples of four potato varieties from three production systems, over a period of three years, were analyzed. The results show that TPC and RSA tests can be used as parameters for differentiating potato parts and variety and to distinguish the samples depending on ripening time and the production system. Higher values of TPC and RSA were observed in samples from the organic cultivation system compared to integral and conventional cultivation in the same cultivar. Finally, by the employment of UHPLC-LTQ Orbitrap XL, fifty-nine phenolic compounds were identified. It was concluded that the phenolic profile is a powerful tool for confirming botanical origin, distinguishing between genotypes, and distinguishing various production systems of potato.
1. Introduction
Potato accumulates a large number of secondary metabolites, including phenolic compounds and many other phytochemicals, as protection against the harmful effects of mechanical bruising, light, and damage from predators such as bacteria, fungi, viruses, and insects [1,2]. In addition to contributing to the pigmentation and sensory characteristics of this plant crop [3], phenolic compounds from potato can reduce the risk of cancer, cardiovascular diseases, and type 2 diabetes. They participate in preventing damage to proteins, lipids, carbohydrates, and DNA caused by free radicals [4,5]. Therefore, potato is one of the most important sources of antioxidants in human nutrition [6]. Based on metabolic relationships and structural composition, there are three main groups of antioxidants present in potato [7]. The first group consists of aromatic phenolic compounds, including flavonoids such as anthocyanins and flavonols, and the amino acids tyrosine, phenylalanine, and tryptophan produced via the shikimate metabolic pathway. The second group includes isoprenoid antioxidants such as carotenoids and tocopherols, while the third group encompasses antioxidants related to the functions of ascorbate and glutathione in the redox system, including ascorbic acid [8].
Phenolic compounds such as chlorogenic acid, catechin, p-coumaric acid, ferulic acid, caffeic acid, and protocatechuic acid and flavonols (kaempferol, quercetin, myricetin) were observed in relevant concentrations in potato tubers in multiple studies [9,10,11]. Phenol concentrations, including anthocyanins, in potatoes are related to the color, mass, and skin, with the bulk or peel of the potato potentially being fully or partially pigmented [12,13,14]. Potato peel has also drawn attention as a natural antioxidant in nutrition due to its high phenol content, believed to be ten times higher than the concentration in the core, constituting about 50% of all phenols in potato tubers [15].
In order to find potential indicators of differences between the potato varieties of different origins and lengths of vegetation period from three production systems, this study aimed to evaluate a simple procedure for phenol fingerprinting of potato tubers from three types of production—conventional, integral, and organic.
Five different extraction solvents were employed, and all five extraction types were assisted with ultrasound in the same thermal regime. Total phenolic content (TPC) and antioxidant capacity (RSA) for each extraction type and for a total of 144 samples were determined (48 per year, in a period of three years of production, namely 24 bulk and 24 peel samples from four potato varieties: Red Fantasy, Laura, Marabel, and Jelly). The results were analyzed to select the best method for extracting phenolic compounds. Considering the obtained results and their statistical processing, the optimization process was reduced from five to two procedures. For further optimization and the selection of the potentially best extraction method, the quantification of phenolics in the peel and bulk of the potato samples in combination with processing the obtained data with advanced chemometric tools was performed.
Quantification of phenolic compounds in the samples was performed using UHPLC-DAD MS/MS. Eleven phenolic compounds were quantified in 48 potato extract samples, with 24 samples for each extraction method. In this work, UHPLC-LTQ Orbitrap XL was used to define criteria for describing and classifying various potato cultivars. This approach is used for the first time, to the best of our knowledge, although this methodology was already used for the determination of phenols and the characterization of potato samples [16,17,18]. Also, in recent years there have been studies focusing on a smaller number of phenolic compounds such as the reports of Vinod Kumar et al. (2024) [19], Cebulak et al. (2023) [20], and Makori et al. (2022) [9]. In a less recent study, Shepherd et al. (2010) performed a metabolomic analysis of potato tubers in regard to their life cycle segmented into six stages of development including developing and mature tubers, sprouting mature tubers, and mature tubers, by the utilization of three MS-coupled methods [21]. Similarly to our study, Oertel et al. (2017) have profiled 57 potato samples by the implementation of ultra-high-resolution time-of-flight mass spectrometry and detected 21 anthocyanins and 31 other phenolic compounds [22]. In our study, an untargeted approach was also implemented, which resulted in identification of fifty-nine phenolic compounds in potato tuber samples. Furthermore, in combination with advanced chemometric analysis, it was determined that biomarkers derived from the detailed phenolic profiles (with an emphasis on phenolic acids and flavonoids) of potato tubers could be a powerful tool for confirming their botanical origin, as well as to distinguishing potato genotypes, distinguishing samples with different lengths of vegetation period, and characterizing the response of potato tubers to various agronomic practices, i.e., production systems.
2. Materials and Methods
2.1. Reagents and Standards
2.1.1. Determining Total Phenolic Contents and Antioxidant Capacity
Reagents and standards for determining TPC (total phenolic content), TEAC (Trolox Equivalent Antioxidant Capacity), and radical scavenging activity (RSA): Methanol (HPLC-grade) and FC reagent were procured from Merck (KGaA, Darmstadt, Germany). 2,2-Diphenyl-1-picrylhydrazyl (DPPH) was purchased from Fluka Chemie AG (Buchs, Switzerland). Trolox, gallic acid standard, and anhydrous sodium carbonate were obtained from Sigma-Aldrich (Steinheim, Germany). For the preparation of all standard solutions and dilutions, ultrapure water was used (MicroPure water purification system, 0.055 mS/cm, TKA, Thermo Fisher Scientific, Niederelbert, Germany). Ethanol 96% (v/v) and HCl 37% (v/v) were obtained from Zorka Pharma (Šabac, Serbia), and acetone from Merck (Germany). All reagents were of analytical grade. Syringe filters (13 mm, 0.45 µm PTFE membrane) were purchased from Supelco (Bellefonte, PA, USA).
2.1.2. Identification and Quantification of Phenols—Determination of Phenolic Profile
Standards of phenolic compounds used for quantification analysis (protocatechuic acid, 5-O-caffeoylquinic acid, p-hydroxybenzoic acid, caffeic acid, p-coumaric acid, quercetin-3-O-glucoside, naringin, quercetin-3-O-rhamnoside, kaempferol and ferulic acid) were obtained from Sigma-Aldrich (Steinheim, Germany).
2.2. Sample Preparation—Cultivation Experiments
Four potato varieties were used in this study: two middle early red peel varieties, Red Fantasy (F) and Laura (L); one early yellow peel variety, Marabel (M); and one late yellow variety, Jelly (J). Over three years (I, II, and III), the varieties were grown in field trials using four repetitions of randomized block design in three different production systems: organic (O), integral (I), and conventional (C). In our previous studies, field and test conditions were both reported [23,24].
2.3. Optimization of Phenol Extraction Method
In order to develop an optimal procedure for isolating the antioxidant fraction from potato tubers, five different extraction methods (E1–E5) were applied to samples from the last year of production. The extraction methods are modifications of described methods that utilize methanol [10,11,14,22], ethanol [25], and acetone [12]. All extractions were performed at room temperature in an ultrasonic bath. The solutions were collected and evaporated under vacuum to dryness at 40 °C (IKA RV5, IKA Werke, Staufen, Germany), dissolved, filtered (0.45 µm PTFE membrane filter), and stored at 4 °C until analysis. The performance of extraction methods was evaluated by their TPC and RSA values of obtained extracts. The following extraction conditions were assessed:
Extraction 1 (E1): Approximately 0.5 g of dried sample was extracted with 10 mL of 80% methanol for 20 min. The extract was centrifuged for 15 min at 3000 rpm. The supernatant was collected, and the extraction was repeated two more times. The residue after evaporation was dissolved in 5 mL of a methanol/water mixture (3:2).
Extraction 2 (E2): About 0.5 g of dried sample was extracted with 10 mL of an ethanol–water mixture (80:20, v/v) for 10 min. Subsequently, centrifugation was carried out at 4000 rpm for 15 min. The extraction was repeated three times. The residues after evaporation were dissolved in 5 mL of a methanol–water mixture (50:50, v/v).
Extraction 3 (E3): Approximately 0.5 g of dried sample was extracted with 10 mL of an acetone–water mixture (70:30, v/v) for 30 min. The extracts were centrifuged for 15 min at 4000 rpm. The supernatant was collected, and the extraction was repeated two more times. The residues after evaporation were dissolved in 5 mL of methanol.
Extraction 4 (E4): About 0.5 g of dried sample was extracted three times for 30 min each with 10 mL of methanol containing 1% HCl in the dark. The extracts were centrifuged at 4000 rpm for 15 min. The obtained dry residue was dissolved in 5 mL of a methanol/1% HCl mixture.
Extraction 5 (E5): Approximately 0.5 g of dried sample was extracted three times with 10 mL of a methanol–water mixture (70:30, v/v) containing 0.1% HCl for 30 min in the dark. The extracts were centrifuged for 15 min at 4000 rpm. The obtained dry residue was dissolved in 5 mL of water. Solid–liquid extraction was used for the purification of the extracts. C-18 column preconditioning was performed with 3 mL of methanol and 9 mL of ultrapure water. Samples were applied under vacuum without prior filtration. Sugar components were eluted from the column with 6 mL of water, and phenolic compounds were eluted with 1.5 mL of methanol.
2.4. Determining Total Phenol Content of Potato Tubers
The TPC in the samples was determined spectrophotometrically (Cintra 6 UV-Visible spectrophotometer, GBC, Keysborough, Australia), based on a modified Folin–Ciocalteu (FC) method described in the literature, with gallic acid as the standard [14]. To 0.5 mL of the diluted sample, 0.5 mL of ultrapure water and 2.5 mL of 10% FC reagent were added. The mixture was incubated for 5 min at room temperature. Then, 2 mL of 7.5% sodium carbonate was added. After incubating for 2 h at room temperature in the dark, the absorbance was measured at 765 nm. A series of standard solutions with concentrations of 20, 40, 50, 70, and 100 mg/kg were prepared, and a mixture of 1 mL of water and reagents was used as a blank. The results are expressed as milligrams of gallic acid equivalents (GAE) per kilogram of potatoes. All measurements were performed in duplicate.
2.5. Determining Antioxidant Capacity of Potato Tubers
A modified method from the literature was used for the measurement of antioxidant activity [14]. To 0.1 mL of the diluted sample or 0.1 mL of the standard solution, 4 mL of a 0.02 mg/mL DPPH solution was added. The resulting solutions were incubated for 60 min at room temperature in the dark and the absorbance was measured at 517 nm. A series of standard Trolox solutions with concentrations of 100, 200, 300, 400, 500, and 600 µM was prepared. A mixture of 0.1 mL of methanol and 4 mL of DPPH solution was used as a blank. The RSA was calculated as a percentage of the DPPH discoloration in reference to the blank. The results are expressed as mM TE (Trolox equivalent) per kilogram of dry potato sample.
2.6. Identification of Phenolic Compounds—Determination of the Phenolic Profile
For the separation and identification of metabolites from potato tuber samples, a UHPLC system was employed. The system consists of an Accela autosampler (Thermo Fisher Scientific, Bremen, Germany) and a quaternary Accela 600 pump connected to a high-resolution hybrid mass spectrometer (UHPLC-LTQ Orbitrap XL) with a heated electrospray ionization (HESI) ion source (Thermo Fisher Scientific, Bremen, Germany). The analytical column used for separation, Syncronis C18 (100 × 2.1 mm, 1.7 µm particle size), was obtained from Thermo Fisher Scientific. The mobile phase consisted of eluent A: water + 0.1% formic acid and eluent B: acetonitrile + 0.1% formic acid. Mass spectra were recorded in the negative mode, covering a full scan mass spectrum range of 100–1000 m/z. The other LC-MS parameters were previously described by Devrnja et al. (2022) [16]. The ChemDraw molecule editing software (version 12.0) was used as a reference library for calculating the mass of compounds of interest. The molecular formula of the unknown compound was determined based on the recorded accurate mass of the molecular ion ([M–H]−), while the MS2 fragmentation allowed the elucidation of the structures of the unknown compounds.
2.7. Quantitative Analysis of Phenolic Compounds
Quantification of phenolic compounds in potato tuber samples was performed using a Dionex Ultimate 3000 UHPLC system equipped with a diode-array detector (DAD) and mass spectrometry detector (TSQ Quantum Access Max, Thermo Fisher Scientific, Basel, Switzerland) with a triple quadrupole mass detector (UHPLC-DAD MS/MS). The elution process was carried out on an analytical Syncronis C18 column thermostated at 40 °C. The mobile phase consisted of eluent A: water + 0.1% acetic acid and eluent B: acetonitrile with a concentration gradient: 5% B, 2.0 min; 5–95% B, 2.0–12.0 min; 95–5% B, 12.0–12.2 min; and 5% B until 15 min with a flow rate of 0.3 mL/min. For quantification of phenolics, both the molecular ion and the most intense fragment of the MS2 spectrum were recorded for each standard. The Xcalibur software (version 2.2) was used for instrument control, data collection, and data analysis. The total content of each compound was determined by integrating peak areas, and the content was expressed as mg/kg.
2.8. Statistical Data Analysis
In order to optimize the extraction procedure of phenolic compounds and select a potentially best-suited method, non-parametric tests, namely the Friedman test and the Wilcoxon rank-sum test, were performed using the SPSS software package (IBM SPSS Statistics 20) based on the total phenolic content and antioxidant capacity. For further optimization, the phenolic profile was determined and phenols quantified, and the results obtained following LC-MS analyses were processed using the PLS Toolbox, v.6.2.1 in MATLAB 7.12.0 (R2011a) (MathWorks Inc., Natick, MA, USA). To gain a more comprehensive understanding of the data structure and to identify similarities, differences, and groupings, a principal component analysis (PCA) was conducted. Prior to multivariate analysis, all data were auto-scaled.
3. Results and Discussion
3.1. Optimization of Phenolic Compound Extraction Method
To develop an optimal procedure for isolating the antioxidant fraction from potato tubers, five different extraction methods were employed. The optimization process involved the selection of 24 potato samples, comprising 6 samples from each of the four varieties (2 samples for each variety from 3 cultivation systems). In these samples, the TPC and the RSA were determined for each extraction type. The obtained results are presented in Supplementary Materials Table S1. Non-parametric tests, the Friedman test and the Wilcoxon rank-sum test, were conducted to determine if there were statistically significant differences between the extraction types based on total phenolic content and antioxidant capacity. The objective was to identify the appropriate method for the extraction of phenolics. The results of these tests are shown in Table 1.

Table 1.
Statistical tests for the total phenolic content extracted from potato samples using five extraction methods. Highlighted (bold) values indicate the presence of a statistically significant difference between extractions.
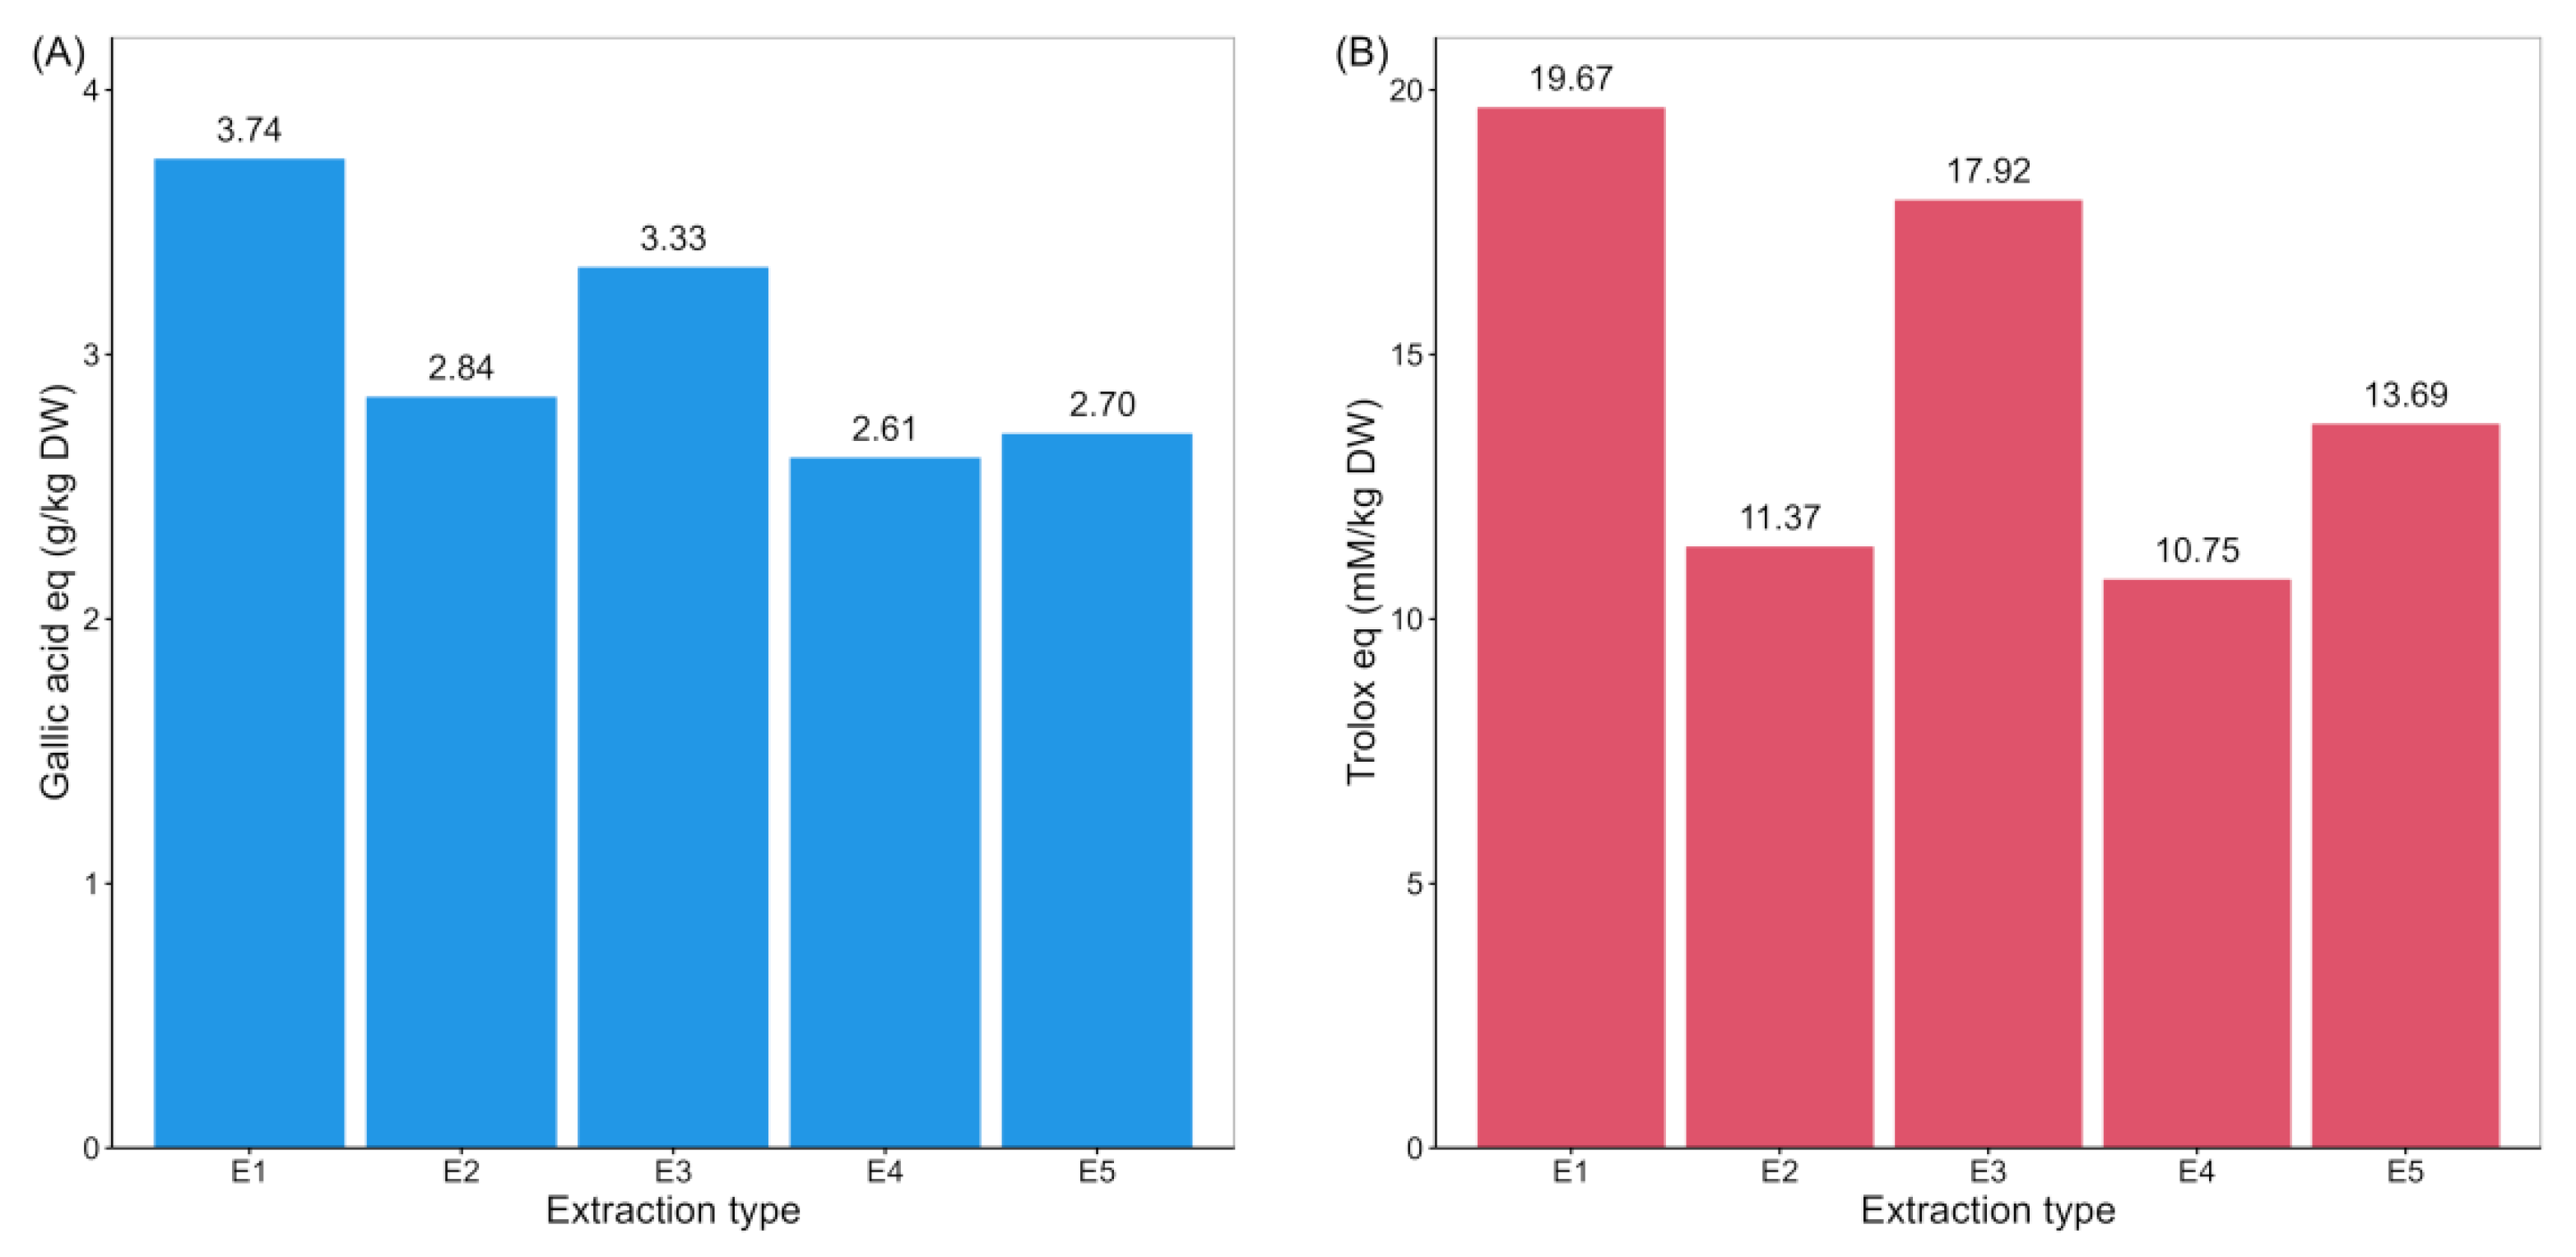
The highest content of total phenols and antioxidant capacity was determined in samples extracted with 80% methanol (extraction 1) and a mixture of acetone–water (70:30, v/v) (extraction 3) (Supplementary Materials Table S1, Figure 1). The results of the Friedman test and the Wilcoxon rank sum test indicate a statistically significant difference between these two extraction methods and the other three (Table 1); therefore, these two extraction methods were used for further analysis.

Figure 1.
The total phenolic content (TPC; (A)) and radical scavenging activity (RSA; (B)) in extracts of potato samples from five different extraction methods.
To further optimize and select the potentially best extraction method, the quantification of phenolics was performed in samples extracted with 80% methanol and the mixture of acetone–water (70:30, v/v).
3.2. Quantitative Analysis of Phenolic Compounds in Potato Samples
In a total of 48 potato extract samples, 24 for each extraction type (extractions 1 and 3), eleven phenolic compounds were quantified by UHPLC-DAD MS/MS analysis. These compounds included six phenolic acids (protocatechuic acid, 5-O-caffeoylquinic acid, p-hydroxybenzoic acid, caffeic acid, p-coumaric acid, and ferulic acid), four glycosides (rutin, quercetin-3-O-glucoside, naringin, and quercetin-3-O-rhamnoside), and the flavonol kaempferol. The content of quantified phenolic compounds in the tested potato extracts from different potato varieties and production systems is presented in Supplementary Materials Table S2.
Multiple studies about the quantification of phenolic acids, such as chlorogenic, caffeic, p-coumaric, and ferulic acids, have been reported [1,26]. The results are diverse—heavily affected by the potato cultivar, the growth environment, and also the experimental procedure. A common observation is that chlorogenic acid is detected in high amounts in comparison to other quantified phenolic acids or flavonoids, along with caffeic acid which is usually ranked second. Similarly to our results, Ru et al. (2019) have detected chlorogenic acid in the range between 20.6 and 79.4 mg/kg DW and caffeic acid in the range between 9.5 and 66.6 mg/kg DW in yellow or white flesh potatoes [11].
To elucidate differences between extractions 1 and 3 to choose the best extraction method, the obtained results were used as input for PCA.
Principal component analysis (PCA) based on the content of phenolic compounds in 48 different potato samples resulted in a four-component model that explains 79.42% of the total variance in the data. The statistical parameters, including the number of principal components and the percentage of variance they explain, are presented in Supplementary Materials Table S3.
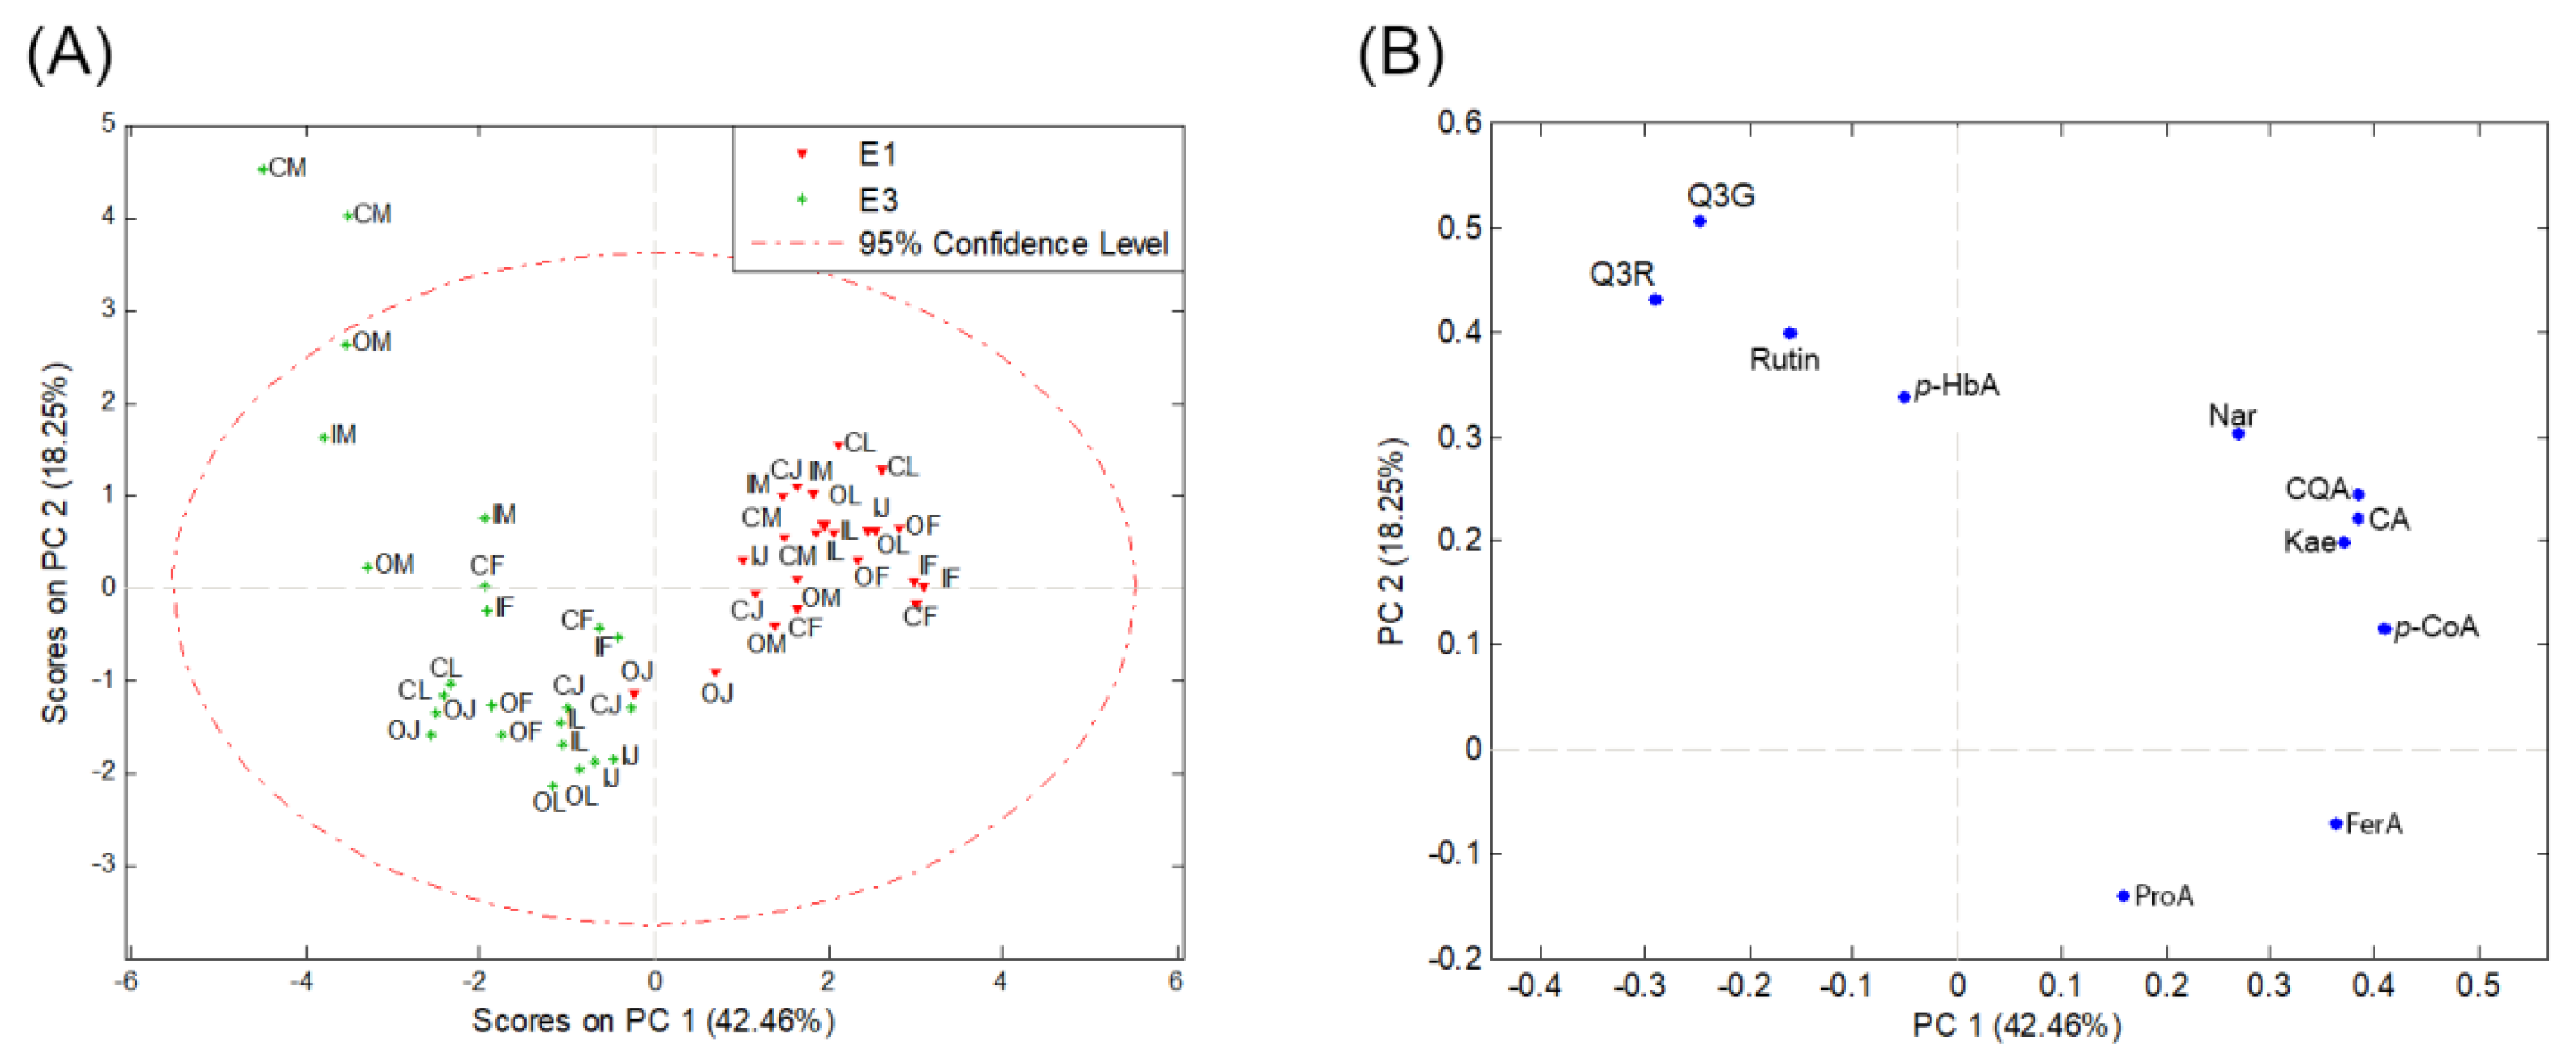
The results from the analysis of the first two principal components based on quantified phenolic compounds in potato samples extracted with extraction methods 1 and 3 (Supplementary Materials Table S2) are illustrated on score and loading plots (Figure 2) and explain 60.71% of the variability in the data.
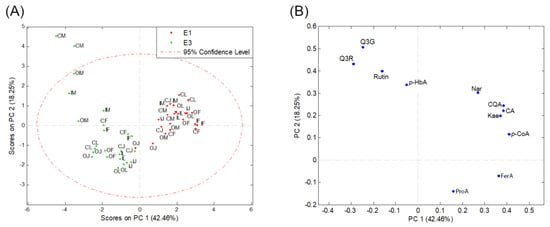
Figure 2.
PCA score plot (A) and loading plot (B) based on the content of phenolic compounds extracted with 80% methanol (E1) and a mixture of acetone–water (70:30, v/v) (E3) in samples of four potato varieties (M—Marabel; F—Red Fantasy; L—Laura; J—Jelly) from three types of production systems (C—conventional; I—integral; O—organic production system). Protocatechuic acid—ProA; 5-O-caffeoylquinic acid—CQA; p-hydroxybenzoic acid—p-HbA; caffeic acid—CA; p-coumaric acid—p-CoA; quercetin-3-O-glucoside—Q3G; naringin—Nar; quercetin-3-O-rhamnoside—Q3R; kaempferol—Kae; ferulic acid—FerA.
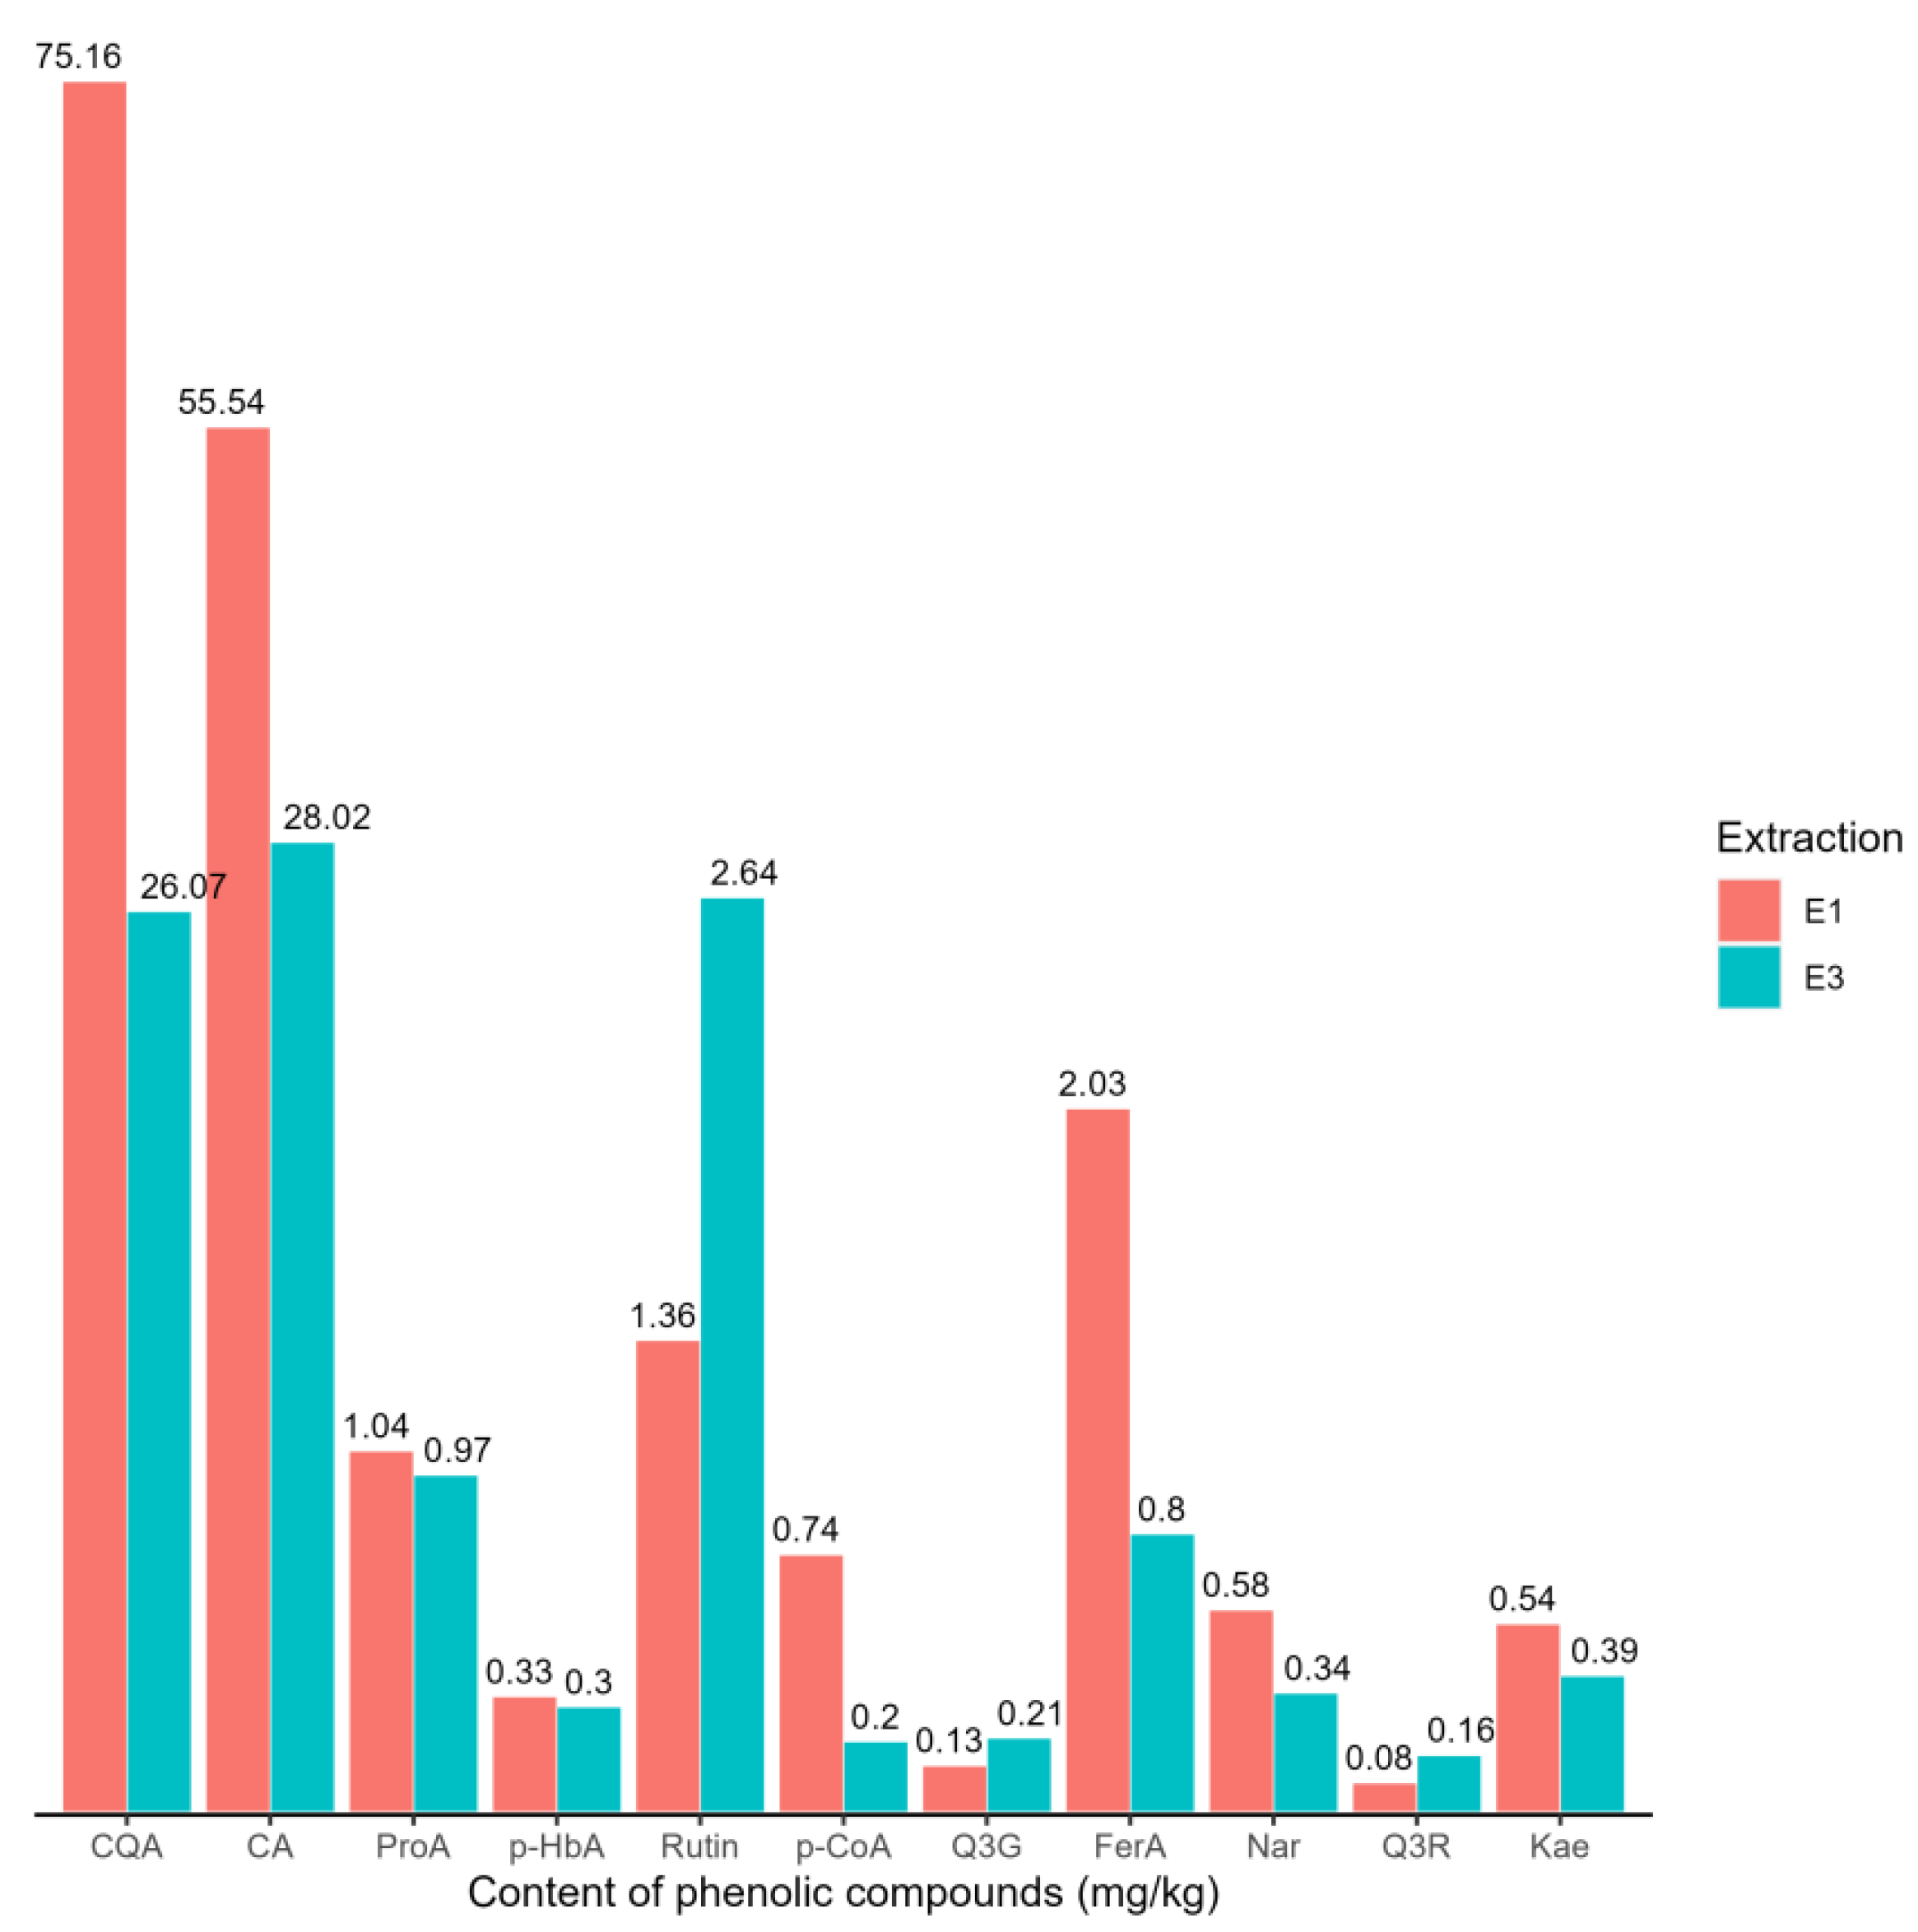
On the score plot (Figure 2A), two distinct groups of objects can be observed along the PC1 axis. The first group consists of potato samples where phenolics were extracted with 80% methanol (extraction 1), and it separates from the second group composed of samples where extraction was performed with a mixture of acetone and water (70:30, v/v) (extraction 3). This separation is mainly influenced by phenolic acids (ProA, FerA, p-CoA, CA, CQA, p-HbA), Nar, and Kae (Figure 2B), which have higher concentrations in samples extracted with 80% methanol (extraction 1) compared to samples extracted with the extraction method 3 (Table 2, Figure 3). The concentrations of rutin, Q3G, and Q3R show the opposite trend (Figure 2B, Table 2). Specifically, their concentrations are higher in potato samples subjected to extraction method 3. Along the PC1 axis, p-CoA has the most positive impact, while Q3R has the most negative impact (Table 2, Figure 3).
Table 2.
Descriptive statistics of phenolic compound content (mg/kg) in potato samples extracted with 80% methanol (E1) and a mixture of acetone–water (70:30, v/v) (E3). Protocatechuic acid—ProA; 5-O-caffeoylquinic acid—CQA; p-hydroxybenzoic acid—p-HbA; caffeic acid—CA; p-coumaric acid—p-CoA; quercetin-3-O-glucoside—Q3G; naringin—Nar; quercetin-3-O-rhamnoside—Q3R; kaempferol—Kae; ferulic acid—FerA.

Figure 3.
The content of phenolic compounds (mg/kg) in potato samples extracted with 80% methanol (E1) and a mixture of acetone–water (70:30, v/v) (E3). Protocatechuic acid—ProA; 5-O-caffeoylquinic acid—CQA; p-hydroxybenzoic acid—p-HbA; caffeic acid—CA; p-coumaric acid—p-CoA; quercetin-3-O-glucoside—Q3G; naringin—Nar; quercetin-3-O-rhamnoside—Q3R; kaempferol—Kae; ferulic acid—FerA.
Along the PC2 axis, Q3G has the most positive impact on sample separation, while ProA has the most negative impact (Figure 2B). Within object groups, based on quantified phenolics and PCA, no differences can be observed between potato varieties and production methods (Figure 2A).
Since the concentration ranges for each phenolic compound in the examined samples for both types of extractions are not greater than one order of magnitude (Supplementary Materials Table S2), a comparative t-test was performed to determine the presence of a statistically significant difference between these two extraction methods for each individual phenolic compound (Supplementary Materials Table S4).
Based on the results of the comparative t-test, it was demonstrated that there is a statistically significant difference between extractions 1 and 3 based on the content of CQA, CA, p-CoA, Q3G, FerA, Nar, Q3R, and Kae. As the concentration of these phenolic compounds is higher in samples extracted with 80% methanol (extraction 1) compared to samples extracted with the acetone–water mixture (70:30, v/v) (extraction 3), extraction 1 was selected as the potentially best method for extracting phenolic compounds from potato samples. In those samples from the third production year, the phenolic profile of both the peel and bulk of four potato varieties from three types of production systems was determined.
After the optimization process was completed, phenolic compounds were extracted using 80% methanol from potato samples from the first and the second production years. The obtained extracts were used to determine the total phenolic content and antioxidant capacity in the peel and bulk samples of four potato varieties from three types of production systems for all three production years. The results are presented in Supplementary Materials Table S5 and Figure S1.
Based on the results, it can be concluded that the total phenolic content and the antioxidant activity value for all three production years are higher in peel samples compared to bulk samples of potato tubers (TPC—3.79 g GAE/kg, 1.42 g GAE/kg; RSA—21.08 mmol TE/kg; 3.46 mmol TE/kg, respectively) (Supplementary Materials Table S5 and Figure S1). Overall, the obtained TPC values are comparable to the values described by Ru et al. [11], Leo et al. [10], Makori et al. [9], and Lachman et al. [25], which are between 0.8 and 3.0 g GAE/kg for whole potatoes and between 1.57 and 4.27 g GAE/kg for the peel. Higher values in bulk are described for red and purple potato cultivars, up to 23.5 g GAE/kg by Burgos et al. [14]. Regarding the antioxidant activity, Ru et al. obtained results between 0.21 and 3.09 mmol TE per kg of dried sample [11].
Regarding the potato varieties, observed for each production year individually and in the total average content for all three production years, higher total phenolic content and antioxidant activity values were found in samples of medium-early red varieties Red Fantasy (TPC—6.20 g GAE/kg; RSA—29.98 mmol TE/kg) and Laura (TPC—6.46 g GAE/kg; RSA—25.94 mmol TE/kg) compared to the medium-early white variety Marabel (TPC—4.78 g GAE/kg; RSA—22.05 mmol TE/kg) and the late white variety Jelly (TPC—3.42 g GAE/kg; RSA—18.18 mmol TE/kg) (Supplementary Materials Table S5 and Figure S1).
For all three production years, the TPC and RSA values are lowest in samples of the Jelly variety. This variety differs in the length of tuber vegetation, compared to the others, as it belongs to the late varieties. As for the types of production systems, observed by individual years, a universal trend of an increase or decrease in total phenolic content and antioxidant activity values based on whether the samples are from conventional, integral, or organic types of production cannot be discerned (Supplementary Materials Table S5 and Figure S1). However, when considering the average values of TPC and RSA over a three-year period, it can be noticed that the values for both parameters are highest in samples from the organic type of production (TPC—C: 5.29, I: 5.01, O: 5.34 g GAE/kg; RSA—C: 23.31, I: 23.45, O: 25.35 mmol TE/kg) (Supplementary Materials Table S5 and Figure S1).
3.3. Identification of Phenolic Compounds
In the qualitative analysis of the phenolic fraction of potato samples after extraction with 80% methanol, fifty-nine compounds were identified, including twenty-five phenolic acids and their derivatives, twenty-two phenolic glycosides (including flavonoid glycosides), and twelve flavonoid aglycones, including two isoflavones, three flavones, three flavonols, three flavanones, one flavanonol. A list of the identified compounds, retention times (tR), molecular formulas, average monoisotopic mass values, and exact masses; MS/MS fragmentation data; and references that confirm the presence of the corresponding compound in Solanum species are provided in Table 3, while the peak areas obtained from full-scan MS spectra for all samples are provided in Supplementary Materials Table S6. The compounds were identified by comparing mass spectra and retention times (tR) with available standards analyzed under the same conditions and by comparing the accurate mass, deprotonated molecules ([M–H]–), and MS/MS fragmentation with corresponding spectral characteristics given in the literature [1,22,27,28,29,30,31,32,33,34,35,36,37,38,39,40,41,42,43,44,45,46,47,48,49,50,51,52,53,54,55,56]. Five of the detected phenolic acids derivatives are not yet described in Solanum species: two isomers of tetramethoxycinnamic acid hexuronide (peaks 23 and 24, Table 3), hydroxy-methoxy-benzoic acid pentosyl-hexoside (peak 29), dihydroxybenzoic acid pentosyl-hexoside (peak 31), and feruloylquinic acid hexoside (peak 41).
Table 3.
Phenolic compounds identified in the bulk and peel of four potato varieties from three types of production using UHPLC-LTQ Orbitrap MS/MS.
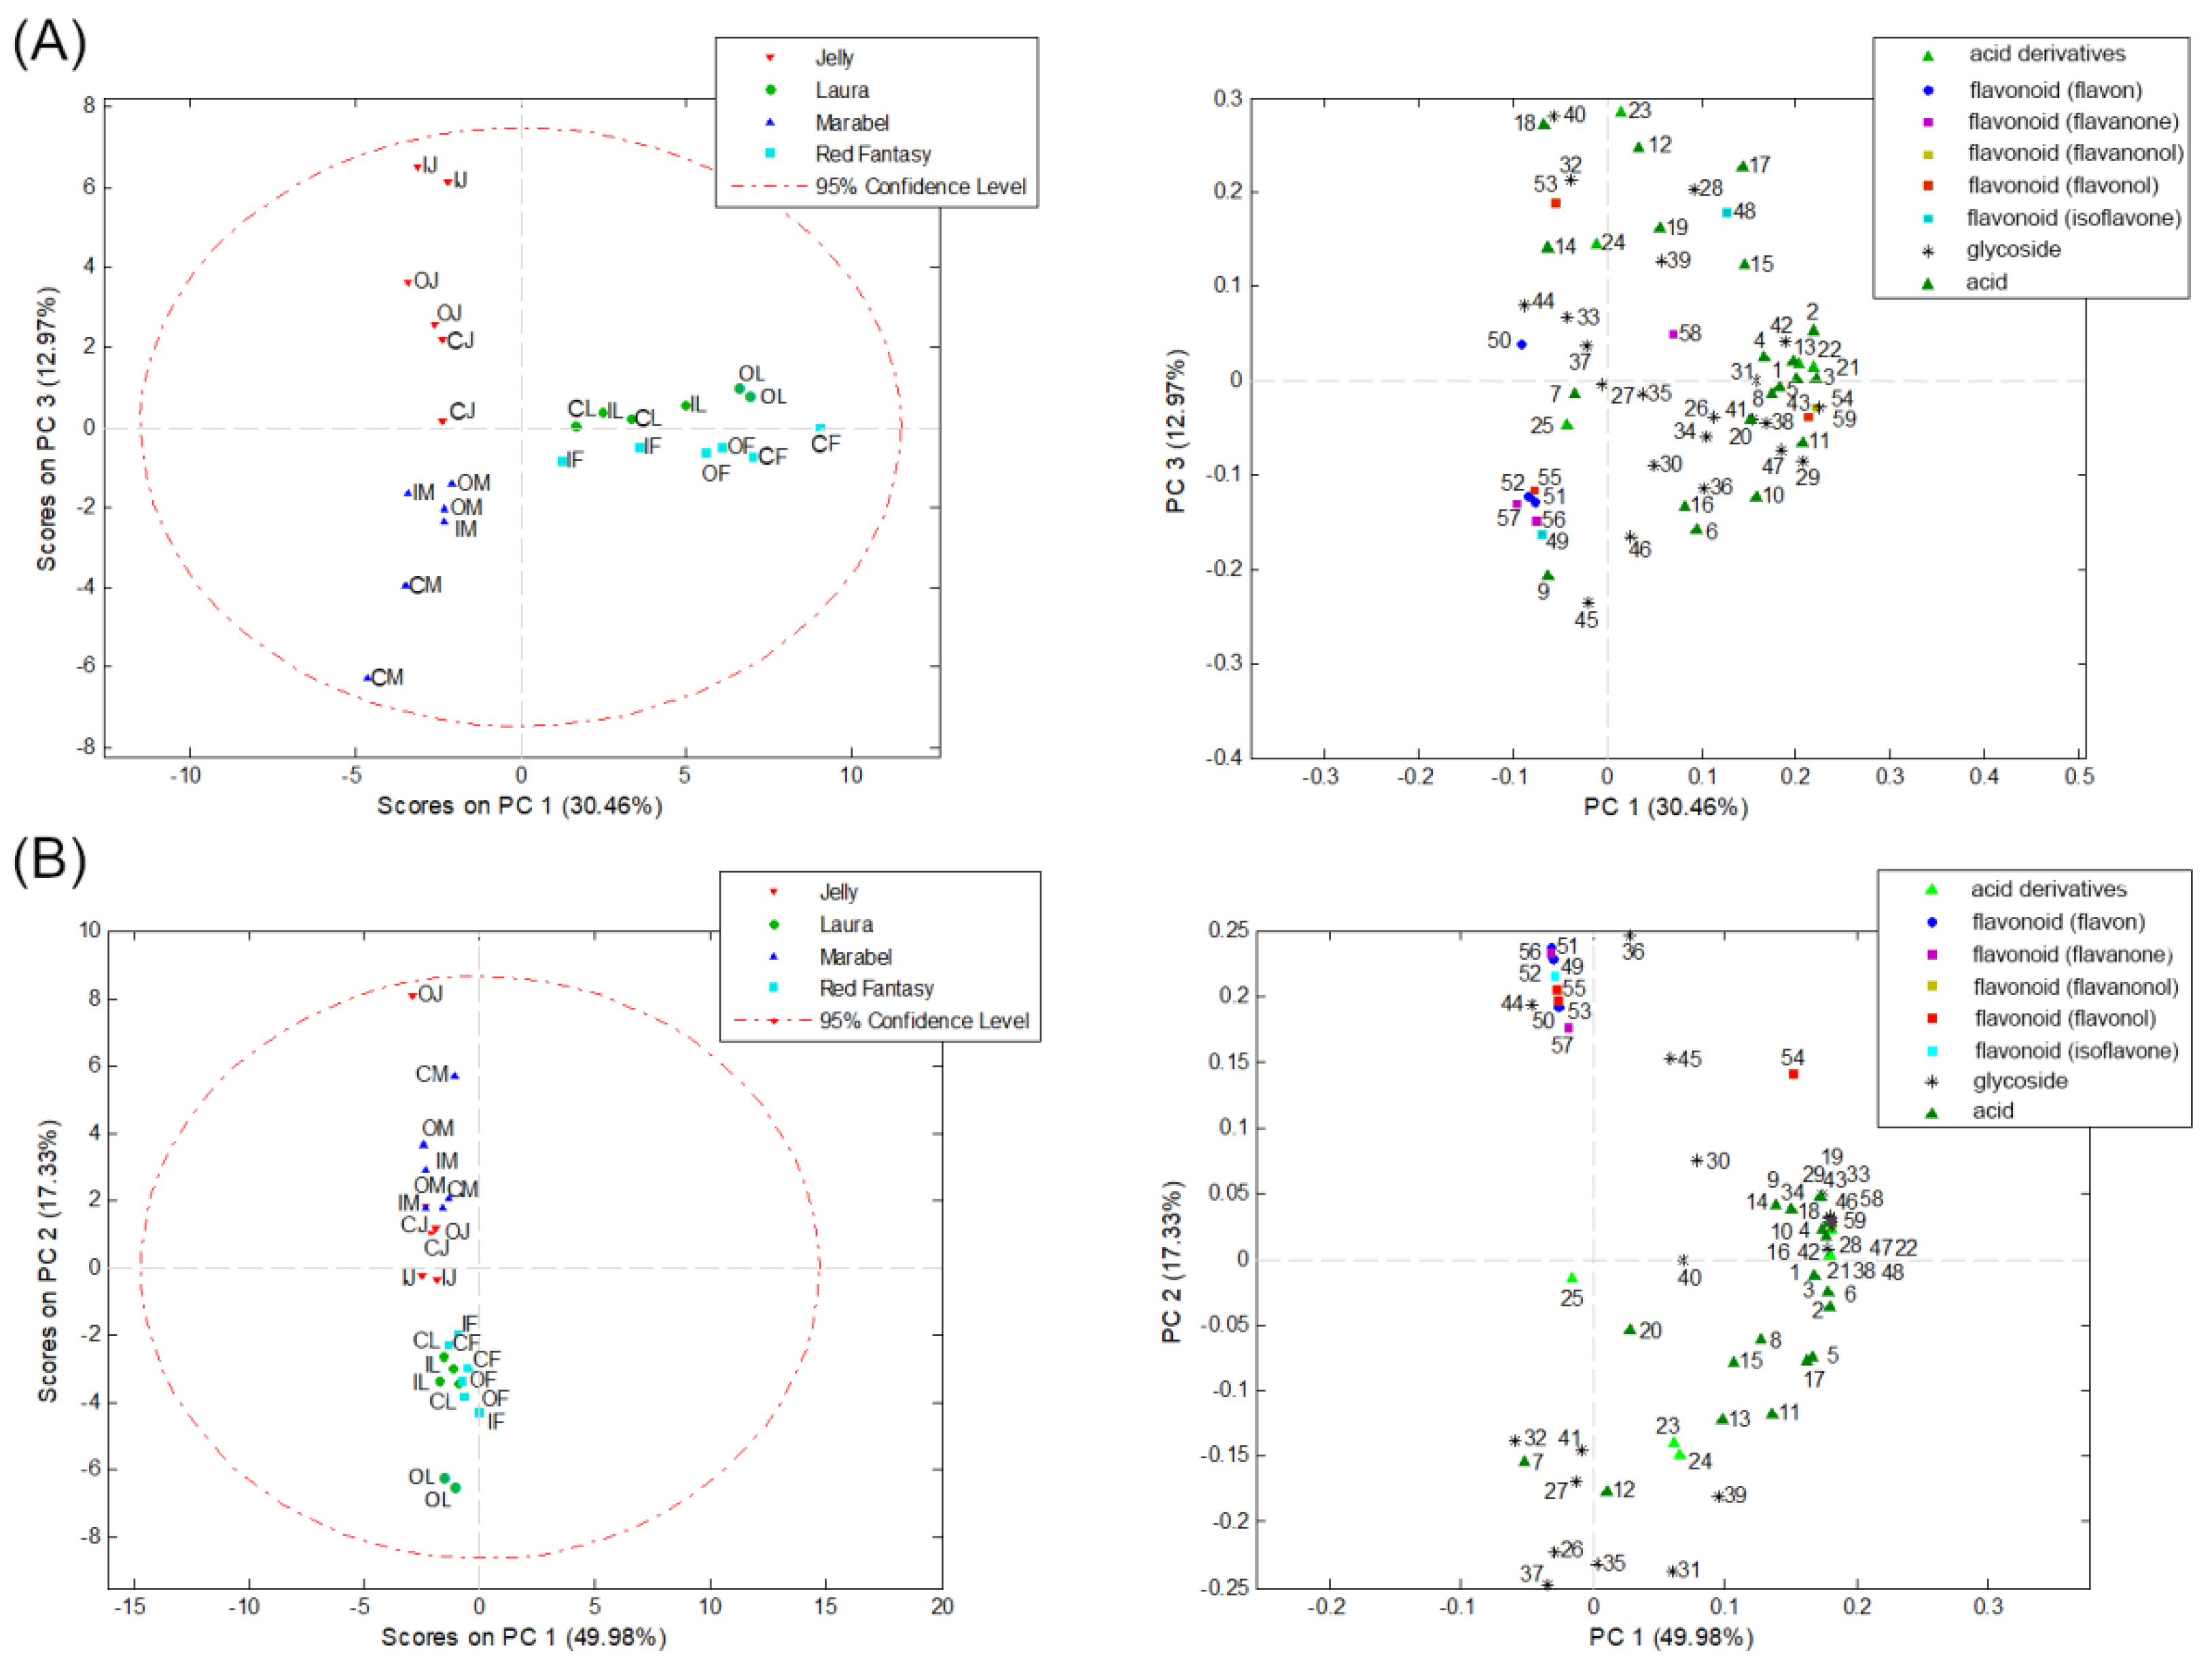
To find potential indicators of differences between the four potato varieties of different origins and different lengths of vegetation period from three cultivation systems based on their phenolic profile in the bulk and peel of tubers, a PCA was conducted. The area under the peak of identified phenolic compounds was treated as a numerical variable. The results of PCA analysis of the phenolic profile are shown in Figure 4. The numbers in the score plots correspond to the numbers (Peak No.) in Table 3. The PCA analysis based on identified phenolic compounds in the peel of potato samples resulted in a ten-component model that explains 92.73% of the total variability, while PCA for the bulk samples resulted in an eight-component model explaining 94.13% of the variability. In both cases, the results indicate a separation of samples based on the potato variety to which they belong and the lengths of vegetation period. In the peel samples of potato tubers, based on the identified phenolic compounds, two groups of objects were separated along PC1, which explains 30.46% of the variability. The first group consists of samples of medium-early red potato varieties, Laura and Red Fantasy, while the second group of objects consists of white potato varieties, Marabel, and Jelly (Figure 4A). Along PC3, explaining 12.97% of the variability, it can be observed that there is a further separation within the white varieties Marabel and Jelly samples based on the lengths of vegetation period (Figure 4A). This is because Marabel is an early white variety, while Jelly is a late white variety. Therefore, it can be said that the phenolic profile can serve as an indicator of the difference between potato varieties (genotypes) and the lengths of vegetation period of potatoes.
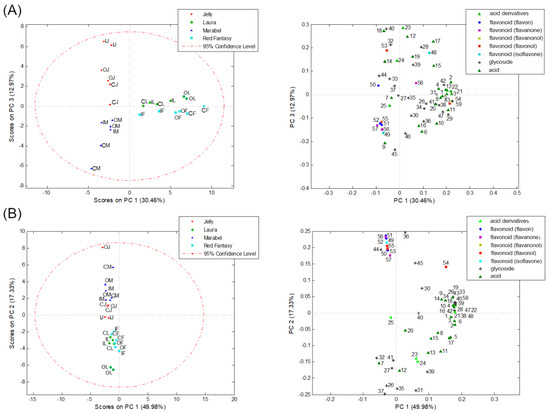
Figure 4.
PCA based on the identified phenolic compounds in the peel (A) and bulk (B) samples of four potato varieties (M—Marabel; F—Red Fantasy; L—Laura; J—Jelly) from three types of production (C—conventional; I—integral; O—organic production system).
A similar trend can be observed in the bulk samples of potato tubers (Figure 4B), where there is also a separation between red and white peel color varieties along PC2. Phenolic acids, their derivatives, and glycosides identified in the red potato variety samples have the greatest influence on the separation, while white varieties have a higher proportion of identified classes of flavonoids. This is in line with the literature data confirming that secondary metabolites in potatoes contribute to their color and sensory characteristics [3]. The phenolic content in potatoes influences the tuber’s color, and the bulk and/or peel of the potato can be completely or partially pigmented [14]. Additionally, there is a wide range of phenolic acids and anthocyanins quantified in varying concentrations depending on the potato variety, whereas red varieties mainly contain phenolic acids and glycosides [12,13], which is also confirmed in this paper.
4. Conclusions
This study aimed to optimize the extraction process to select an optimal procedure for isolating the antioxidant fraction from potato tubers and to evaluate potential biomarkers derived from the detailed phenolic profiles in order to differentiate the samples based on their botanical origin and system of production.
Five different extraction methods were evaluated. As the highest TPC and RSA values were found in samples extracted with 80% methanol and the acetone–water mixture (70:30, v/v), and the results indicated a statistically significant difference between these two extraction methods in comparison to the others, these two extraction methods were selected as the best for isolating phenolic compounds. The quantification and identification of phenolics in the peel and bulk of the potato samples were performed to select the better method among these two. The quantification of phenolic compounds in the samples was performed using UHPLC-DAD MS/MS. Eleven phenolic compounds were quantified in 48 potato extract samples, with 24 samples for each extraction method (extractions 1 and 3). The results indicated that 80% methanol (extraction 1) performed the best among the five examined methods.
This study concluded that the TPC and the RSA were higher in the peel samples compared to the bulk samples for all three production years. In terms of potato varieties, the content of total phenolics and antioxidant activity was higher in samples of medium-early red peel varieties, such as Red Fantasy and Laura, compared to medium-early white peel variety Marabel and late white peel variety Jelly. The average values of TPC and RSA over the three-year period were highest in samples from the organic production system.
Using UHPLC-LTQ Orbitrap XL, fifty-nine phenolic compounds were identified in potato tuber samples. In order to find potential indicators of differences between the four potato varieties of different origins and lengths of vegetation period from three production systems, a principal component analysis was conducted using the data on their phenolic profile in the bulk and peel of tubers. The results indicated a separation of samples based on the potato variety to which they belong and the lengths of vegetation period. The most significant influence on the separation was from phenolic acids, their derivatives, and glycosides identified in the red potato variety samples, while white varieties had a higher proportion of identified classes of flavonoids.
Supplementary Materials
The following supporting information can be downloaded at: https://www.mdpi.com/article/10.3390/pr13020396/s1, Supplementary Table S1. Total phenolic content (g GAE/kg) and radical scavenging activity (mmol TE/kg) in extracts of potato samples from five different extraction methods. C, I, O—type of production system (C—conventional; I—integral; O—organic); M, F, L, J—potato variety (M—Marabel; F—Red Fantasy; L—Laura; J—Jelly); III—third year of production; Table S2. Content of phenolic compounds (mg/kg) in potato samples extracted with 80% methanol (Extraction 1) and a mixture of acetone–water (70:30, v/v) (Extraction 3). C, I, O—type of production (C—conventional; I—integral; O—organic), M, F, L, J—potato variety (M—Marabel; F—Red Fantasy; L—Laura; J—Jelly); protocatechuic acid—ProA; 5-O-caffeoylquinic acid—CQA; p-hydroxybenzoic acid—p-HbA; caffeic acid—CA; p-coumaric acid—p-CoA; quercetin-3-O-glucoside—Q3G; naringin—Nar; quercetin-3-O-rhamnoside—Q3R; kaempferol—Kae; ferulic acid—FerA; Table S3. The number of principal components and the percentage of variance they explain; Table S4. Results of the comparative t-test; protocatechuic acid—ProA; 5-O-caffeoylquinic acid—CQA; p-hydroxybenzoic acid—p-HbA; caffeic acid—CA; p-coumaric acid—p-CoA; quercetin-3-O-glucoside—Q3G; naringin—Nar; quercetin-3-O-rhamnoside—Q3R; kaempferol—Kae; ferulic acid—FerA. Bold values indicate the presence of a statistically significant difference between extractions; Table S5. Total phenolic content (g GAE/kg) and antioxidant capacity (mmol TE/kg) in the peel and bulk of four potato varieties (M—Marabel; F—Red Fantasy; L—Laura; J—Jelly) from three types of production systems (C—conventional; I—integral; O—organic production) and three production years (I, II, and III); Table S6. Peak areas of phenolic compounds identified in the bulk and peel of four potato varieties from three types of production using UHPLC-LTQ Orbitrap MS/MS; Figure S1. Total phenolic content (g GAE/kg) and antioxidant capacity (mmol TE/kg) in samples of bulk and peel from four potato varieties (M—Marabel; F—Red Fantasy; L—Laura; J—Jelly) from three types of production (C—conventional; I—integral; O—organic production) presented for individual production years (I, II, and III) and as a three-year average content.
Author Contributions
Conceptualization, A.D. and D.M.-O.; methodology, A.D. and D.M.-O.; formal analysis, A.D., U.G. and N.H.; investigation, A.D. and U.G.; resources, D.M.-O.; data curation, A.D. and U.G.; writing—original draft preparation, A.D. and U.G.; writing—review and editing, D.M.-O.; visualization, A.D.; project administration, D.M.-O.; funding acquisition, D.M.-O. All authors have read and agreed to the published version of the manuscript.
Funding
This work was supported by the Ministry of Science, Technological Development and Innovation of the Republic of Serbia (Grant Numbers 451-03-66/2024-03/200007, 451-03-66/2024-03/200168, and 451-03-66/2024-03/200288).
Data Availability Statement
Data are contained within the article and Supplementary Materials.
Conflicts of Interest
The authors declare that the research was conducted in the absence of any commercial or financial relationships that could be construed as a potential conflict of interest.
References
- Shakya, R.; Navarre, D.A. Rapid Screening of Ascorbic Acid, Glycoalkaloids, and Phenolics in Potato Using High-Performance Liquid Chromatography. J. Agric. Food Chem. 2006, 54, 5253–5260. [Google Scholar] [CrossRef] [PubMed]
- Chamorro, S.; Cueva-Mestanza, R.; De Pascual-Teresa, S. Effect of Spray Drying on the Polyphenolic Compounds Present in Purple Sweet Potato Roots: Identification of New Cinnamoylquinic Acids. Food Chem. 2021, 345, 128679. [Google Scholar] [CrossRef] [PubMed]
- Ignat, I.; Volf, I.; Popa, V.I. A Critical Review of Methods for Characterisation of Polyphenolic Compounds in Fruits and Vegetables. Food Chem. 2011, 126, 1821–1835. [Google Scholar] [CrossRef]
- Liao, W.C.; Lai, Y.-C.; Yuan, M.-C.; Hsu, Y.-L.; Chan, C.-F. Antioxidative Activity of Water Extract of Sweet Potato Leaves in Taiwan. Food Chem. 2011, 127, 1224–1228. [Google Scholar] [CrossRef] [PubMed]
- Andre, C.; Larondelle, Y.; Evers, D. Dietary Antioxidants and Oxidative Stress from a Human and Plant Perspective: A Review. Curr. Nutr. Food Sci. 2010, 6, 2–12. [Google Scholar] [CrossRef]
- Rasheed, H.; Ahmad, D.; Bao, J. Genetic Diversity and Health Properties of Polyphenols in Potato. Antioxidants 2022, 11, 603. [Google Scholar] [CrossRef] [PubMed]
- Burgos, G.; Zum Felde, T.; Andre, C.; Kubow, S. The Potato and Its Contribution to the Human Diet and Health. In The Potato Crop; Campos, H., Ortiz, O., Eds.; Springer International Publishing: Cham, Switzerland, 2020; pp. 37–74. ISBN 978-3-030-28682-8. [Google Scholar]
- Lovat, C.; Nassar, A.M.K.; Kubow, S.; Li, X.-Q.; Donnelly, D.J. Metabolic Biosynthesis of Potato (Solanum tuberosum L.) Antioxidants and Implications for Human Health. Crit. Rev. Food Sci. Nutr. 2016, 56, 2278–2303. [Google Scholar] [CrossRef] [PubMed]
- Makori, S.I.; Mu, T.-H.; Sun, H.-N. Profiling of Polyphenols, Flavonoids and Anthocyanins in Potato Peel and Flesh from Four Potato Varieties. Potato Res. 2022, 65, 193–208. [Google Scholar] [CrossRef]
- Leo, L.; Leone, A.; Longo, C.; Lombardi, D.A.; Raimo, F.; Zacheo, G. Antioxidant Compounds and Antioxidant Activity in “Early Potatoes”. J. Agric. Food Chem. 2008, 56, 4154–4163. [Google Scholar] [CrossRef] [PubMed]
- Ru, W.; Pang, Y.; Gan, Y.; Liu, Q.; Bao, J. Phenolic Compounds and Antioxidant Activities of Potato Cultivars with White, Yellow, Red and Purple Flesh. Antioxidants 2019, 8, 419. [Google Scholar] [CrossRef] [PubMed]
- Shiroma-Kian, C.; Tay, D.; Manrique, I.; Giusti, M.M.; Rodriguez-Saona, L.E. Improving the Screening Process for the Selection of Potato Breeding Lines with Enhanced Polyphenolics Content. J. Agric. Food Chem. 2008, 56, 9835–9842. [Google Scholar] [CrossRef]
- Vinson, J.A.; Demkosky, C.A.; Navarre, D.A.; Smyda, M.A. High-Antioxidant Potatoes: Acute in Vivo Antioxidant Source and Hypotensive Agent in Humans after Supplementation to Hypertensive Subjects. J. Agric. Food Chem. 2012, 60, 6749–6754. [Google Scholar] [CrossRef]
- Burgos, G.; Amoros, W.; Muñoa, L.; Sosa, P.; Cayhualla, E.; Sanchez, C.; Díaz, C.; Bonierbale, M. Total Phenolic, Total Anthocyanin and Phenolic Acid Concentrations and Antioxidant Activity of Purple-Fleshed Potatoes as Affected by Boiling. J. Food Compos. Anal. 2013, 30, 6–12. [Google Scholar] [CrossRef]
- Al-Weshahy, A.; Rao, V.A. Potato Peel as a Source of Important Phytochemical Antioxidant Nutraceuticals and Their Role in Human Health—A Review. In Phytochemicals as Nutraceuticals—Global Approaches to Their Role in Nutrition and Health; Rao, V., Ed.; InTech: London, UK, 2012; ISBN 978-953-51-0203-8. [Google Scholar]
- Devrnja, N.; Gašić, U.; Šajkunić, S.; Cingel, A.; Stupar, S.; Tubić, L.; Savić, J. UHPLC-OrbiTrap MS Characterization of Phenolic Profiles in French Marigold Extracts and Analysis of Their Antifeedant Activity against Colorado Potato Beetle. Plants 2022, 11, 407. [Google Scholar] [CrossRef] [PubMed]
- Li, Y.; Wang, Q.; Xu, X.; Guo, H. UHPLC-MS/MS Analysis of the Accumulation and Excretion of Steroidal Glycoalkaloids Consumed by Potato Tuber Moth (Phthorimaea Operculella) Larvae under Different Feeding Treatments. Insects 2022, 14, 26. [Google Scholar] [CrossRef] [PubMed]
- Kumari, A.; Bhattacharya, B.; Agarwal, T.; Paul, V.; Maurya, V.K.; Chakkaravarthi, S.; Simal-Gandara, J. Method Development and Validation for Acrylamide in Potato Cutlet by UHPLC-MS/MS. Food Control 2023, 151, 109817. [Google Scholar] [CrossRef]
- Vinod Kumar, J.; Saha Chowdhury, R.; Kantamraju, P.; Dutta, S.; Pal, K.; Ghosh, S.; Das, S.; Mandal, R.; Datta, S.; Choudhury, A.; et al. Anthocyanin Profiling of Genetically Diverse Pigmented Potato (Solanum tuberosum L.) Clonal Accessions from North-Eastern Sub-Himalayan Plateau of India. Heliyon 2024, 10, e36730. [Google Scholar] [CrossRef] [PubMed]
- Cebulak, T.; Krochmal-Marczak, B.; Stryjecka, M.; Krzysztofik, B.; Sawicka, B.; Danilčenko, H.; Jarienè, E. Phenolic Acid Content and Antioxidant Properties of Edible Potato (Solanum tuberosum L.) with Various Tuber Flesh Colours. Foods 2022, 12, 100. [Google Scholar] [CrossRef] [PubMed]
- Shepherd, L.V.T.; Alexander, C.A.; Sungurtas, J.A.; McNicol, J.W.; Stewart, D.; Davies, H.V. Metabolomic Analysis of the Potato Tuber Life Cycle. Metabolomics 2010, 6, 274–291. [Google Scholar] [CrossRef]
- Oertel, A.; Matros, A.; Hartmann, A.; Arapitsas, P.; Dehmer, K.J.; Martens, S.; Mock, H.-P. Metabolite Profiling of Red and Blue Potatoes Revealed Cultivar and Tissue Specific Patterns for Anthocyanins and Other Polyphenols. Planta 2017, 246, 281–297. [Google Scholar] [CrossRef]
- Dramićanin, A.M.; Andrić, F.L.; Poštić, D.Ž.; Momirović, N.M.; Milojković-Opsenica, D.M. Sugar Profiles as a Promising Tool in Tracing Differences between Potato Cultivation Systems, Botanical Origin and Climate Conditions. J. Food Compos. Anal. 2018, 72, 57–65. [Google Scholar] [CrossRef]
- Dramićanin, A.; Andrić, F.; Mutić, J.; Stanković, V.; Momirović, N.; Milojković-Opsenica, D. Content and Distribution of Major and Trace Elements as a Tool to Assess the Genotypes, Harvesting Time, and Cultivation Systems of Potato. Food Chem. 2021, 354, 129507. [Google Scholar] [CrossRef] [PubMed]
- Lachman, J.; Hamouz, K.; Orsák, M.; Pivec, V.; Dvořák, P. The Influence of Flesh Colour and Growing Locality on Polyphenolic Content and Antioxidant Activity in Potatoes. Sci. Hortic. 2008, 117, 109–114. [Google Scholar] [CrossRef]
- Friedman, M. Chemistry, Biochemistry, and Dietary Role of Potato Polyphenols. A Review. J. Agric. Food Chem. 1997, 45, 1523–1540. [Google Scholar] [CrossRef]
- Frontuto, D.; Carullo, D.; Harrison, S.M.; Brunton, N.P.; Ferrari, G.; Lyng, J.G.; Pataro, G. Optimization of Pulsed Electric Fields-Assisted Extraction of Polyphenols from Potato Peels Using Response Surface Methodology. Food Bioprocess Technol. 2019, 12, 1708–1720. [Google Scholar] [CrossRef]
- Wu, S.-B.; Meyer, R.S.; Whitaker, B.D.; Litt, A.; Kennelly, E.J. A New Liquid Chromatography–Mass Spectrometry-Based Strategy to Integrate Chemistry, Morphology, and Evolution of Eggplant (Solanum) Species. J. Chromatogr. A 2013, 1314, 154–172. [Google Scholar] [CrossRef] [PubMed]
- Huang, W.; Serra, O.; Dastmalchi, K.; Jin, L.; Yang, L.; Stark, R.E. Comprehensive MS and Solid-State NMR Metabolomic Profiling Reveals Molecular Variations in Native Periderms from Four Solanum Tuberosum Potato Cultivars. J. Agric. Food Chem. 2017, 65, 2258–2274. [Google Scholar] [CrossRef]
- Daji, G.; Steenkamp, P.; Madala, N.; Dlamini, B. Phytochemical Composition of Solanum retroflexum Analysed with the Aid of Ultra-Performance Liquid Chromatography Hyphenated to Quadrupole-Time-of-Flight Mass Spectrometry (UPLC-qTOF-MS). J. Food Qual. 2018, 2018, 3678795. [Google Scholar] [CrossRef]
- Rocchetti, G.; Senizza, B.; Putnik, P.; Bursać Kovačević, D.; Barba, F.J.; Trevisan, M.; Lucini, L. Untargeted Screening of the Bound / Free Phenolic Composition in Tomato Cultivars for Industrial Transformation. J. Sci. Food Agric. 2019, 99, 6173–6181. [Google Scholar] [CrossRef] [PubMed]
- Singh, B.; Singh, J.; Singh, J.P.; Kaur, A.; Singh, N. Phenolic Compounds in Potato (Solanum tuberosum L.) Peel and Their Health-promoting Activities. Int. J. Food Sci. Technol. 2020, 55, 2273–2281. [Google Scholar] [CrossRef]
- Kim, M.Y.; Lee, B.W.; Lee, H.; Lee, Y.Y.; Kim, M.H.; Lee, J.Y.; Lee, B.K.; Woo, K.S.; Kim, H. Phenolic Compounds and Antioxidant Activity in Sweet Potato after Heat Treatment. J. Sci. Food Agric. 2019, 99, 6833–6840. [Google Scholar] [CrossRef] [PubMed]
- Herraiz, F.; Villaño, D.; Plazas, M.; Vilanova, S.; Ferreres, F.; Prohens, J.; Moreno, D. Phenolic Profile and Biological Activities of the Pepino (Solanum Muricatum) Fruit and Its Wild Relative S. Caripense. Int. J. Mol. Sci. 2016, 17, 394. [Google Scholar] [CrossRef] [PubMed]
- Massarolo, K.C.; Ferreira, C.F.J.; De Borba, V.S.; Kupski, L.; Furlong, E.B. Particle Size and Physical-Chemical Characteristics of Hydrothermally Treated Cornmeal on Resistant Starch Content. Food Chem. 2019, 283, 39–45. [Google Scholar] [CrossRef] [PubMed]
- Huang, H.; Xu, Q.; Belwal, T.; Li, L.; Aalim, H.; Wu, Q.; Duan, Z.; Zhang, X.; Luo, Z. Ultrasonic Impact on Viscosity and Extraction Efficiency of Polyethylene Glycol: A Greener Approach for Anthocyanins Recovery from Purple Sweet Potato. Food Chem. 2019, 283, 59–67. [Google Scholar] [CrossRef] [PubMed]
- Kawano, K.; Morimura, S.; Mori, E.; Matsushita, H.; Ohta, H.; Kida, K. Isolation and Identification by Cytoprotection Assay of Antioxidative Compound Contained in Vinegar Produced from Sweet Potato-Shochu Post-Distillation Slurry. Food Sci. Technol. Res. 2010, 16, 327–332. [Google Scholar] [CrossRef]
- Jokioja, J.; Percival, J.; Philo, M.; Yang, B.; Kroon, P.A.; Linderborg, K.M. Phenolic Metabolites in the Urine and Plasma of Healthy Men After Acute Intake of Purple Potato Extract Rich in Methoxysubstituted Monoacylated Anthocyanins. Mol. Nutr. Food Res. 2021, 65, 2000898. [Google Scholar] [CrossRef] [PubMed]
- Keller, H.; Hohlfeld, H.; Wray, V.; Hahlbrock, K.; Scheel, D.; Strack, D. Changes in the Accumulation of Soluble and Cell Wall-Bound Phenolics in Elicitor-Treated Cell Suspension Cultures and Fungus-Infected Leaves of Solanum Tuberosum. Phytochemistry 1996, 42, 389–396. [Google Scholar] [CrossRef]
- Wang, A.; Li, R.; Ren, L.; Gao, X.; Zhang, Y.; Ma, Z.; Ma, D.; Luo, Y. A Comparative Metabolomics Study of Flavonoids in Sweet Potato with Different Flesh Colors (Ipomoea batatas (L.) Lam). Food Chem. 2018, 260, 124–134. [Google Scholar] [CrossRef] [PubMed]
- Tárraga, S.; Lisón, P.; López-Gresa, M.P.; Torres, C.; Rodrigo, I.; Bellés, J.M.; Conejero, V. Molecular Cloning and Characterization of a Novel Tomato Xylosyltransferase Specific for Gentisic Acid. J. Exp. Bot. 2010, 61, 4325–4338. [Google Scholar] [CrossRef] [PubMed]
- Ikeda, M.; Isshiki, S.; Tanaka, T.; Kuono, I.; Ishimaru, K. Analysisof the metabolites in Solanum melongena L tissue cultures. Jpn. J. Food Chem. Saf. 2010, 17, 102–109. [Google Scholar] [CrossRef]
- García-Salas, P.; Gómez-Caravaca, A.M.; Morales-Soto, A.; Segura-Carretero, A.; Fernández-Gutiérrez, A. Identification and Quantification of Phenolic Compounds in Diverse Cultivars of Eggplant Grown in Different Seasons by High-Performance Liquid Chromatography Coupled to Diode Array Detector and Electrospray-Quadrupole-Time of Flight-Mass Spectrometry. Food Res. Int. 2014, 57, 114–122. [Google Scholar] [CrossRef]
- Yogendra, K.N.; Sarkar, K.; Kage, U.; Kushalappa, A.C. Potato NAC43 and MYB8 Mediated Transcriptional Regulation of Secondary Cell Wall Biosynthesis to Contain Phytophthora Infestans Infection. Plant Mol. Biol. Report. 2017, 35, 519–533. [Google Scholar] [CrossRef]
- Cichon, M.J.; Riedl, K.M.; Schwartz, S.J. A Metabolomic Evaluation of the Phytochemical Composition of Tomato Juices Being Used in Human Clinical Trials. Food Chem. 2017, 228, 270–278. [Google Scholar] [CrossRef] [PubMed]
- Khanna, K.; Jamwal, V.L.; Sharma, A.; Gandhi, S.G.; Ohri, P.; Bhardwaj, R.; Al-Huqail, A.A.; Siddiqui, M.H.; Ali, H.M.; Ahmad, P. Supplementation with Plant Growth Promoting Rhizobacteria (PGPR) Alleviates Cadmium Toxicity in Solanum Lycopersicum by Modulating the Expression of Secondary Metabolites. Chemosphere 2019, 230, 628–639. [Google Scholar] [CrossRef]
- Sun, L.-X.; Fu, W.; Ren, J.; Xu, L.; Bi, K.-S.; Wang, M.-W. Cytotoxic Constituents from Solanum lyratum. Arch. Pharm. Res. 2006, 29, 135–139. [Google Scholar] [CrossRef] [PubMed]
- Silva, T.M.S.D.; Carvalho, M.G.D.; Braz-Filho, R. Spectroscopy Study on Structural Elucidation of Flavonoids from Solanum jabrense Agra & Nee e S. paludosum Moric. Quím. Nova 2009, 32, 1119–1128. [Google Scholar] [CrossRef]
- Lucini, L.; Rocchetti, G.; Kane, D.; Trevisan, M. Phenolic Fingerprint Allows Discriminating Processed Tomato Products and Tracing Different Processing Sites. Food Control 2017, 73, 696–703. [Google Scholar] [CrossRef]
- Alarcón-Flores, M.I.; Romero-González, R.; Martínez Vidal, J.L.; Garrido Frenich, A. Multiclass Determination of Phenolic Compounds in Different Varieties of Tomato and Lettuce by Ultra High Performance Liquid Chromatography Coupled to Tandem Mass Spectrometry. Int. J. Food Prop. 2016, 19, 494–507. [Google Scholar] [CrossRef]
- Kalogeropoulos, N.; Chiou, A.; Pyriochou, V.; Peristeraki, A.; Karathanos, V.T. Bioactive Phytochemicals in Industrial Tomatoes and Their Processing Byproducts. LWT Food Sci. Technol. 2012, 49, 213–216. [Google Scholar] [CrossRef]
- Scervino, J.M.; Ponce, M.A.; Erra-Bassells, R.; Vierheilig, H.; Ocampo, J.A.; Godeas, A. Arbuscular Mycorrhizal Colonization of Tomato by Gigaspora and Glomus Species in the Presence of Root Flavonoids. J. Plant Physiol. 2005, 162, 625–633. [Google Scholar] [CrossRef]
- Gürbüz Çolak, N.; Eken, N.T.; Ülger, M.; Frary, A.; Doğanlar, S. Mapping of Quantitative Trait Loci for Antioxidant Molecules in Tomato Fruit: Carotenoids, Vitamins C and E, Glutathione and Phenolic Acids. Plant Sci. 2020, 292, 110393. [Google Scholar] [CrossRef] [PubMed]
- Da Silva Souza, M.A.; Peres, L.E.; Freschi, J.R.; Purgatto, E.; Lajolo, F.M.; Hassimotto, N.M. Changes in Flavonoid and Carotenoid Profiles Alter Volatile Organic Compounds in Purple and Orange Cherry Tomatoes Obtained by Allele Introgression. J. Sci. Food Agric. 2020, 100, 1662–1670. [Google Scholar] [CrossRef] [PubMed]
- Vagula, J.M.; Rocha, B.A.; Silva, A.R.; Narain, N.; Bersani-Amado, C.A.; Junior, O.O.S.; Visentainer, J.V. Analysis of Solanum Americanum Mill. by Ultrafast Liquid Chromatography with Diode Array and Time-Of-Flight Mass Spectrometry Detection with Evaluation of Anti-Inflammatory Properties in Rodent Models. Anal. Lett. 2018, 51, 1973–1985. [Google Scholar] [CrossRef]
- Błaszczak, W.; Jeż, M.; Szwengiel, A. Polyphenols and Inhibitory Effects of Crude and Purified Extracts from Tomato Varieties on the Formation of Advanced Glycation End Products and the Activity of Angiotensin-Converting and Acetylcholinesterase Enzymes. Food Chem. 2020, 314, 126181. [Google Scholar] [CrossRef] [PubMed]
Disclaimer/Publisher’s Note: The statements, opinions and data contained in all publications are solely those of the individual author(s) and contributor(s) and not of MDPI and/or the editor(s). MDPI and/or the editor(s) disclaim responsibility for any injury to people or property resulting from any ideas, methods, instructions or products referred to in the content. |
© 2025 by the authors. Licensee MDPI, Basel, Switzerland. This article is an open access article distributed under the terms and conditions of the Creative Commons Attribution (CC BY) license (https://creativecommons.org/licenses/by/4.0/).