Abstract
To solve the problems of numerous influencing factors, such as the high uncertainty and leakage risk of gas production pipelines in high-sulfur gas fields, a dynamic analysis of a gas production pipeline’s leakage risk using a dynamic Bayesian network is proposed. By means of Bow-tie model analysis, the primary risk sources of gas pipeline leakage and different accidents are summarized. A temporal dimension was introduced to construct a dynamic Bayesian network model, utilizing the Leaky noisy-OR gate model to rectify and compute conditional probability, thereby facilitating dynamic risk prediction of gas pipeline leakage. Taking the first section of the pipeline of a municipal gas collection station as an example, with the help of GeNIe 4.0 Academic software, the influence degree of each basic event on pipeline gas leakage was revealed. The change curve of gas leakage probability over time was drawn, and the occurrence probability of potential consequences of accidents was computed. The results indicate that the status of flanges, valves, and pipelines are key factors in determining the occurrence of gas leakage accidents, and six risk sources, including medium corrosion in gas leakage accidents, were determined, with these having practical conspicuousness for strengthening the leakage protection of gas pipelines and providing proper support for the formulation of relevant safety measures.
1. Introduction
With large-scale development and the use of high-sulfur gas fields, the frequency of gas leakage accidents has gradually increased. Based on the 11th European Gas Pipeline Incident Data Group’s statistical data, there were 1411 gas leakage incidents from 1970 to 2019 [1]. If gas leakage cannot be appropriately detected and monitored in time, an ignition source with enough energy will ignite the combustible gas and even cause an explosion. The production station platform layout is compact, and once an explosion occurs, a chain explosion reaction may occur, with serious damage and accident consequences. To ensure the safe and regular operation of sulfur-containing oil and gas wells in the petrochemical production area, leakage routes, possible risks, and preventive measures for monitoring and analysis were investigated.
Numerous scholars have used conventional probability analysis methods for failure probability analysis. Badida et al. employed fuzzy fault tree analysis to investigate an oil and gas pipeline and determine the probability of pipeline failure under different natural disasters [2]. Yan and Li employed de-blur to calculate hydrogen sulfide pipeline failure probability and realize quantitative analysis based on fault tree analysis (FTA) and event tree analysis (ETA) [3]. The above ways have some defects when used for uncertainty analysis of complex system risks, but in the realm of conveying and rationalizing uncertain knowledge, the Bayesian network (BN) stands out as a highly efficient theoretical model that can make up for the deficiencies of the above methods. In 2015, Li et al. combined a sequence model of submarine pipeline leakage events with BN to achieve dynamic analysis of the risk of submarine pipeline leakage accidents [4].
However, this method does not demonstrate the characteristics of pipeline leakage risk changing over time. In 2019, Chang et al. (2019b) introduced the time dimension into a traditional static BN and proposed a dynamic analysis of hydrogen leakage risk, combining the Bow-tie (BT) model and dynamic Bayesian network (DBN), which solved the uncertainty and dynamic problem of device leakage risk [5]. In 2020, Feng et al. recommended augmenting the BN framework by incorporating the noisy-OR gate model [6]. In 2023, Dong et al. utilized an enhanced version of the BN, which integrates historical data and expert insights in conjunction with leaky noisy-or-gate model, effectively, predicted the occurrence probability of construction risk accidents and further identified the risk factors with high sensitivity to them [7]. In 2024, Cui et al. quantified the failure probability of each component of a hydrogen-doped pipeline based on the historical failure data of a natural gas pipeline and used these as prior probability to input into the BN for calculation; the results showed that the BN could quantify the failure probability of the hydrogen-doped pipeline more accurately [8]. Wang et al. used the same approach but considered multiple consequences as safety barriers incorporated into the BN, and the results showed that the risk of failure could be mitigated and prevented by considering a multidimensional consequence impact assessment [9]. In 2025, Pang et al. introduced the weakest t-paradigm algorithm and similarity aggregation method for the parameter learning of a fuzzy BN in order to realize an accurate solution. The research results are of great significance for revealing the evolution mechanism of ethane storage tank leakage accidents [10].
The BT model of gas leakage is transformed into a DBN. The likelihood of intermediary events is computed by utilizing the prior probability of crucial occurrences, leading to posterior probability updating, concerning fundamental incidents. The goal of dynamic risk analysis is accomplished by examining gas leakage probability across time.
2. Methodology
This study developed a novel risk analysis framework combining the Bow-tie model and dynamic Bayesian network for gas pipeline leakage, as shown in Figure 1. The BT model is a combination of FTA (hazardous identification) and ETA (accident process). The BT model was mapped to the BN model by parameterizing the Leaky noisy-OR gate model. Sensitivity analysis and diagnostic speculation analysis were performed using GeNIe software. The DBN model was constructed by introducing the time dimension for risk prediction to realize dynamic risk analysis.
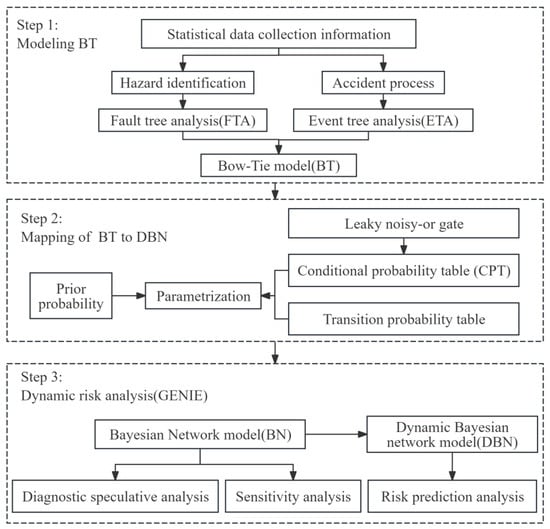
Figure 1.
Risk analysis of gas leakage.
2.1. Method of Dynamic Bayesian Network
In theory, a BN is a potent analytical tool for making deductions in situations characterized by ambiguity. It can consider uncertainties, including the uncertainty of the root nodes, risk factors, and consequences. Furthermore, the conditional dependence of the uncertainty within the bounds of the parent and child nodes is represented by the conditional probability table (CPT) in the BN. It uses the mature rationale of probabilistic calculus as the basis for inference and uncertainty quantification.
However, the BN is time-independent and cannot be used to represent temporal evolution of a system. A dynamic Bayesian network (DBN) is a temporal extension of a static Bayesian network, consisting of a static Bayesian network at the initial moment and a transfer network, where each time slice corresponds to a static Bayesian network. It still has the advantage of BN processing uncertainty. In addition, it models the system’s dynamic behavior by introducing temporal correlation into the network, using the previous state under existing conditions for current inference [7].
In applications, introducing time factors to process dynamic systems is exceedingly complex, and to streamline the representation of intricate systems, the subsequent assumptions have been established as follows [4]:
Smooth hypothesis: The network topology remains unchanged over time, with conditional probabilities remaining unchanged.
Markov model: The state at period T is only dependent on the state at period T − ∆T, without being influenced by the states from time periods prior to T − ∆T. That is Equation (1) below:
The establishment of the DBN model can be divided into two parts: establishment of the SBN, which is used as the network structure and probability distribution at the initial moment, and establishment of the transfer network. Figure 2 shows a simple example of a DBN with a joint probability distribution similar to the BN and can be represented by Equation (2), as follows [11,12]:
where denotes the i-th node at time t (i = 1, 2, …, N), and denotes the parent node of in the network.
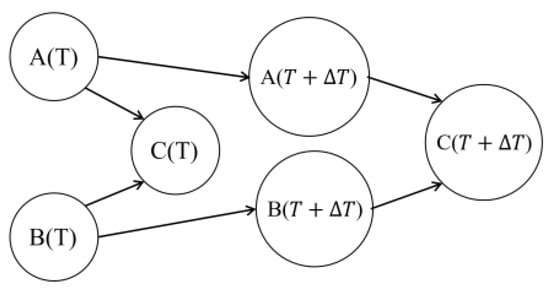
Figure 2.
DBN structure between two time slices.
2.2. Mapping of the BT Model to the BN Model
The BT model is a graphical means used to visually represent the entire accident scenario, which helps to illustrate the cause-and-effect relationship between hazards and potential consequences in a structured and clear manner [13]. It starts from the cause of the incident to the end of the accident consequences and takes the accident as the center. The fault tree (FT) on the left mainly identifies the hazard source and digs into the root cause of the dangerous event, while the right event tree (ET) shows the consequences of the accident. The analysis of the logical relationships among different events through the BT model is beneficial for grasping the causes of the top event, which emerges due to the combination of basic events. It also assists in identifying the failure pathways of safety barriers that promote the escalation of consequences after the top event [14]. The conversion process from the BT to the BN can be effectively segmented into two key stages.
- A node in the BN corresponding to each event, safety barrier, and accident consequence in the BT model is established and connected by a directed arc;
- The prior probabilities of root nodes and the CPT of associated nodes within a BN are determined according to failure probability and the logic gate of the basic event, respectively. The OR gate and the AND gate are the main logical gates of the FT. The method of converting them into conditional probability tables in a BN [15], considering only two states of event occurrence (occurring) and N (not occurring), is illustrated in Figure 3.
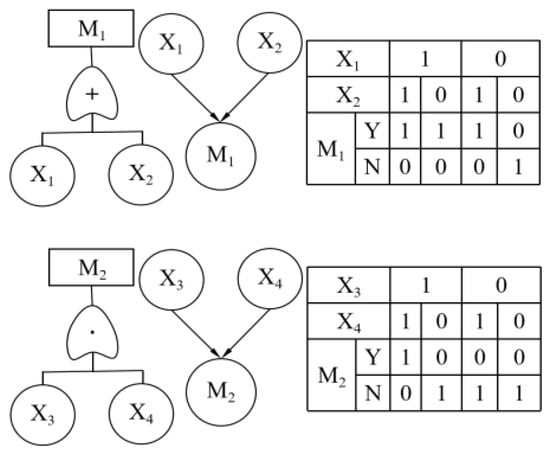
Figure 3.
Conversion process of a logic gate to BN in the fault tree.
After completing the above steps, the conversion process from the BT to the BN can be realized, as shown in Figure 4.
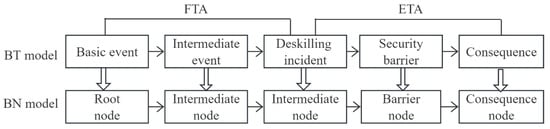
Figure 4.
BT model transformed into a BN.
2.3. The Leaky Noisy-OR Gate Model
In a traditional DBN, the AND gate and the OR gate in FT determine the conditional probabilities. The noisy-OR gate model serves in constructing partially eligible network parameters of the determined network structure and is used in the absence of large data samples. For the BN of this model, the following three conditions should be met:
- Each node in the network represents a binary variable denoting either occurrence (Y) or non-occurrence (N);
- If node M has parent nodes X1, X2, …, Xn, they are conditionally independent of each other;
- For each parent node Xi, there exists a connection probability with Equation (3).
That is, only the probability of node M is Y when Xi is Y and the other is N, presuming that M has only two parent notes, Xi and Xall, where Xall denotes the total of other factors excluding Xi. Meanwhile, the corresponding conditional probability is computed based on Pi and Pall. Then, there are Equations (4) and (5).
By Combining Equations (4) and (5), the connect probability can be obtained accordingly Equation (6).
However, there are numerous influencing factors, and the occurrence of fault events is not absolute (such as Y without N). Henrion first proposed the notion of leak probability and then came up with the Leaky noisy-OR gate extension model, which can cover the deficiency [16]. Therefore, the introduction of this model integrates unknown omission factors into a single element, denoted as XL. Equation (6) can explain the connection probability of holistic parent nodes of node M, thereby enabling the expression of the conditional probability of node M in Equation (7)
where M = Y represents event M occurrence, Xi stands for the i-th parent of the node M, while Xp annotates all parent nodes of M excluding Xi, and PL represents the occurrence probability of omission factor XL.
3. Dynamic Risk Analysis of Gas Leakage
3.1. In Situ Application
The gas production pipeline from a high-hydrogen sulfide gas well in a city to the gas collection station was the central location in the east Sichuan gas transmission project. The hydrogen sulfide content was up to 15.16%. The gas field acid gas gathering and transmission pipeline network includes line 1, line 2, and line 3. The design pressure was 10.7 and 14.4 MPa, and the pipe diameter range was DN150–DN500, totaling ca. 61 km. The pipeline material selected was high-sulfur-resistant carbon steel pipe + a supporting corrosion inhibitor, control technology for laser leakage detection was placed in the tunnel, and the safety measures of interception valve room + emergency plan + emergency evacuation broadcast + emergency torch system were adopted.
3.2. Establishment of the BT Model
In “Hydrogen Sulfide Protection in Natural Gas Extraction and Transmission Operations”, the authors described petrochemical production area gas leakage; the literature research and accident scenario analysis summarize the five main unsafe factors of gas leakage—valve leakage, flange leakage, environmental factors, the dangerous state of the pipeline, and human factors, as shown in Figure 5 [17]. The symbols and specific meanings of the events are given in Table 1 and Table 2.
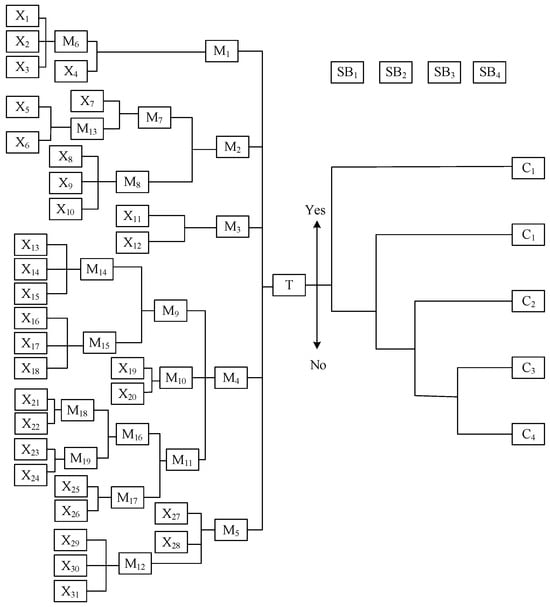
Figure 5.
Bow-tie model of gas leakage.

Table 1.
Description of the intermediate events.
Table 2.
Description and prior probability of basic events.
Gas leakage causes several different physical consequences and associated hazards. Because of the long length of the pipeline, it cannot be closely monitored, monitoring is not timely, and leakages cannot be found immediately; hence, the type of pipeline leakage accident is generally continuous leakage. Continuous gas leakage may cause combustion, explosion, and personnel poisoning. According to event tree process deduction, these consequences are usually caused by the constant failure of safety barriers, which include the gas monitor alarm; when set off, it is effective immediately but can be delayed and result in consequences divided into four stages: corresponding deflagration accidents, jet fires, steam cloud explosions, and personnel poisoning. In this paper, the usual start and manual emergency shutdown of the automatic emergency shutdown were both effective shutdowns, and the realization of this barrier largely depended on the regular operation of the gas detection and alarm system pair. The instant ignition barrier halted the buildup of vapor clouds from gas leakage, consequently averting the escalation of potential faults stemming from leaks. The breakdown of safety barriers can give rise to four consequences of hydrogen sulfide leakage, and the severity of hydrogen sulfide leakage is described by the number of pipe accidents and consequences delineated by Ramírez et al., as summarized in Table 3 [18].
Table 3.
Consequences of pipeline failure.
3.3. Modeling of Dynamic Bayesian Network
Based on the previous theoretical analysis, the Bow-tie model was transformed into a Bayesian network model, as shown in Figure 6.
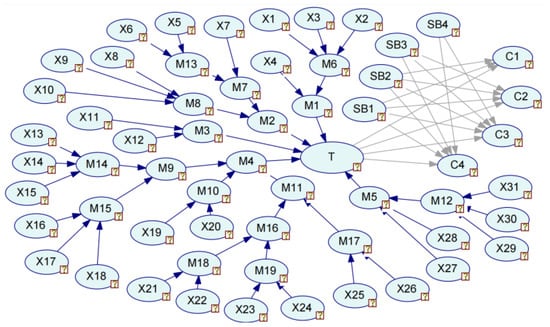
Figure 6.
Bayesian network model of gas leakage.
3.4. Determination of the State Transition Probability
The DBN demonstrates the dynamic nature of accident scenarios through temporal evolution, employing transition probability to regulate node changes across varying time frames. Nodes within a specific time slice exclusively rely on the parent node within the same slice and the corresponding node from the preceding slice [19], with their probabilities interpreted as the state values of the parent node evolving with time [20]. The Weber distribution was selected to describe the failure probability of different events and it fit to the failure probability out of the normal distribution.
Assume that t denotes the present time slice, where λ represents the prior probability, and Δt denotes the time interval between consecutive slices. Wang et al. indicated that the state transition probability of every node could be determined by Equation (8) [21]. Taking node X14, the internal corrosion layer failure, as an example, the construction of the transition probability is expressed in Table 4.
Table 4.
The transition probability of node X14.
The BN mode network model for gas leakage risk was transformed into a DBN as described above in Figure 7.
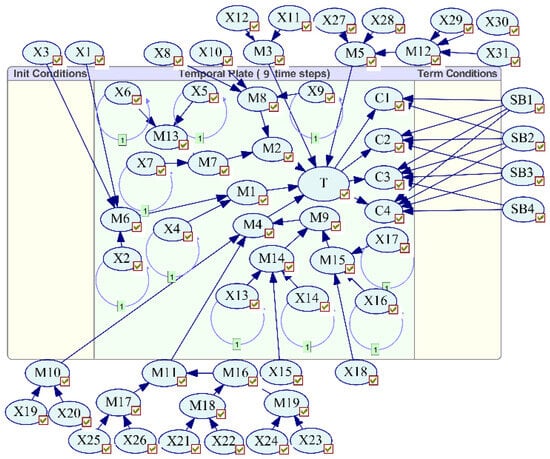
Figure 7.
Bayesian network for a gas leakage accident.
4. Results and Discussion
4.1. Leakage Probability
4.1.1. Probabilities of the Root and Barrier Nodes
Owing to the uniqueness and non-replicability of oil and gas industry accidents, coupled with the difficulties encountered in acquiring a considerable quantity of accident-related data, a portion of the fault data was derived from reference statistics [1,22,23]; with its failure rate as a node prior probability, and for no specific statistical data factors, operational errors, improper maintenance, and other factors were based on published studies [6,21,24,25], as listed in Table 3, where the effective shutdowns include automatic and manual emergency shutdown, and the possibility of failure is derived from the dynamic risk assessment at a natural gas station by Zarei et al. [26]. The failure probability of safety barriers can be treated as the prior failure probability of barrier nodes in the BN.
4.1.2. Preparation of the Conditional Probability Table
Gas pipeline leakage is affected by numerous factors. Employing logical gate operations, the CPT exhibits only two states, occurrence and non-occurrence, but there may be a large error when the parent node is present and the child node is not. Consequently, the Leaky noisy-OR gate model presented in the preceding section enhanced the accuracy of the CPT with the middle node external corrosion (M15). For example, it has three root nodes, X16, X17, and X18, defined as follows:
P(M15 = Y|X16 = Y) = 0.84, P(M15 = N|X16 = N) = 0.73, P(M15 = Y|X17 = Y) = 0.65,
P(M15 = N|X17 = N) = 0.71, P(M15 = Y|X18 = Y) = 0.29, P(M15 = N|X18 = N) = 0.85
The connection probability was obtained according to Equation (6), PC16 = 0.781, PC17 = 0.507, and PC18 = 0.165. Considering the omission factor XL, it is assumed for ease of calculation that it follows a Gaussian probability density distribution with a confidence level of 99%, which ensures that the effect of the unknowns is confined to a small range, beyond which is defined as the leak probability. Thus, P (XL = Y) = 0.01 [6]. With Equation (7), the conditional probability of node M15 is shown in Table 5.
Table 5.
External corrosion (M15) conditional probability table.
Similarly, the CPT of T can also be deduced. Assumptions define the following probability values:
P (T = Y|M1 = Y) = 1, P (T = N|M1 = N) = 0.55
P (T = Y|M2 = Y) = 1, P (T = N|M2 = N) = 0.55
P (T = Y|M3 = Y) = 0.34, P (T = N|M3 = N) = 0.91
P (T = Y|M4 = Y) = 0.89, P (T = N|M4 = N) = 0.89
P (T = Y|M5 = Y) = 0.63, P (T = N|M5 = N) = 0.55
According to Equation (6), the connection probability of C1, C2, C3, and C4 can be obtained; thus, PC1 = 1, PC2 = 1, PC3 = 0.27, PC4 = 0.86, and PC5 = 0.51, the same as M15. Like Equation (7), the CPT of T can be seen in Table 6a,b.
Table 6.
The conditional probability of node gas leakage (T).
The accuracy of the conditional probability tables for all nodes can be enhanced by implementing the aforementioned steps, thereby refining their precision and reliability. Finally, GeNIe software calculates that the gas leakage probability in the gas pipeline was reduced from 0.168 to 0.106. Figure 8 depicts the modified results derived from the model.
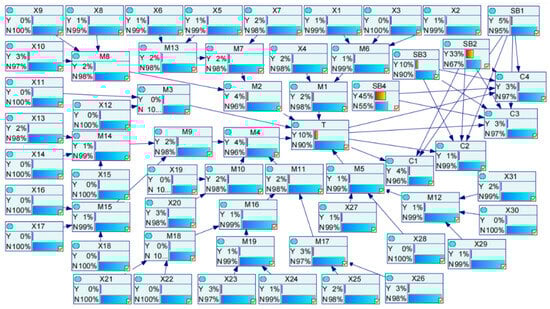
Figure 8.
Failure probability based on the Leaky noisy-OR gate model.
4.2. Sensitivity
Sensitivity analysis is an analytical approach to identifying the factors that prominently influence the target event. It enables quantifying and assessing the extent or sensitivity of the impact on the target event, thereby facilitating a comprehensive understanding of the underlying factors that affect it. GeNIe software was used to conduct sensitivity analysis for gas leakage accidents, and node T was installed as the target node. Figure 9 displays the final results of sensitivity analysis; nodes with darker shades indicate higher sensitivity. Specifically, nodes X1, X2, X4, X7, X15, and M15 exert the most prominent ascendancy on the incidence of gas leakage events.
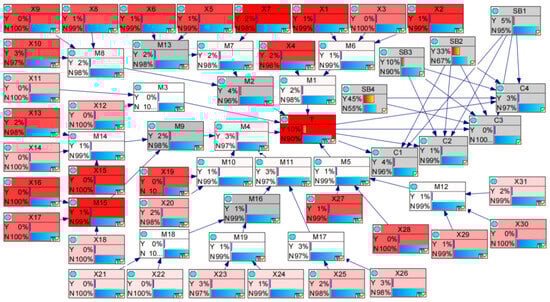
Figure 9.
Sensitivity analysis of node T.
Except for the sensitivity analysis conducted on the marginal probability of nodes, it can also be conducted for the conditional probability and marginal probability of the BN, drawing sensitivity analysis with gas leakage as an example; as shown in Figure 10, the gas leakage accident probability (P(T = Y) = 0.10679) is the conditional probability P(T = Y|M1 = N, M2 = N, M3 = N, M4 = Y, M5 = N), followed by P(M4 = Y|M9 = Y, M10 = N, M11 = N).
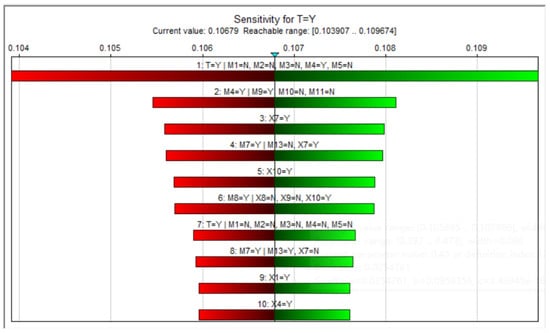
Figure 10.
A tornado plot for BN sensitivity analysis.
4.3. Diagnostic Speculation
The node T is set as an evidence node to indicate that a gas leakage accident occurs, and the probability of the failure of each safety barrier remains unchanged and independent of each other. The reverse inference function of DBN was utilized to receive the posterior probability of every node, update the probability of a basic event, and compare it with the prior probability, as illustrated in Figure 11. There were impurities in the flange X1, flange medium corrosion X4, and valve medium corrosion X7, with an impurity at the junction X10, pipeline in the medium corrosion X13, and poor production process X20 with a higher posterior probability. While the basic events, X1 and X4, can cause a flange leak, X7 and X10 can cause a valve to leak, and X2 and X13 can lead to the intermediate event pipeline being unsafe. These essential events with high posterior probability and a substantial increase in probability are considered key events and can provide corresponding suggestions for reducing the risk of gas leakage. It shows that the status of flanges, valves, and pipes are the key factors determining the occurrence of gas leakage accidents.
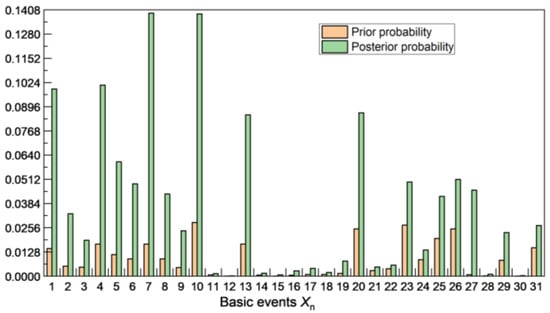
Figure 11.
Comparison of the prior and posterior probabilities for basic events.
4.4. Risk Prediction
The percentage of gas leakage in the pipeline can be predicted within the next ten time slices by utilizing the causal inference feature of the established DBN model. As depicted in Figure 12a, it can be observed that in the first four time slices, the leakage probability shows a gradual upward trend, while the subsequent stabilization proceeds. For the specific topic of gas pipelines, this trend coincides with the regularity of the bath curve, which further verifies the accuracy of the analytical method.
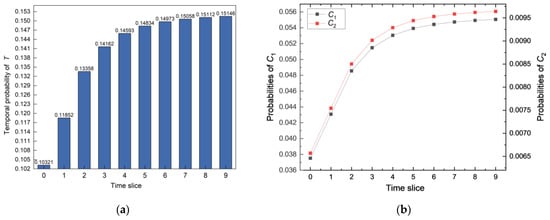
Figure 12.
(a) Time change curve of gas leakage probability; (b) the probability of C1 and C2.
A predictive analysis of the DBN can achieve the dynamic probability of the results. Figure 12b shows the probability of accidents C1 and C2 occurring in ten months. Because of the exceedingly low occurrence probabilities of C3 and C4, they are not depicted here. The dynamic occurrence probability of C1 and C2 gradually increases with time. Once the leakage accident occurs, the occurrence probability of gas-safe diffusion C1 is nearly five times that of C2.
5. Conclusions
A BT model was employed to assess and consolidate the primary risk sources of gas leakage and the consequences of different leakage accidents caused by the failure of the safety barrier. Based on the dynamic Bayesian network, dynamic risk analysis of gas pipeline leakage was performed, and the following conclusions were drawn:
- By conducting sensitivity analysis, the impact of each node in the SBN on the occurrence of gas leakage accidents T was evaluated, and X1, X2, X4, X7, X15, and M15 were the key impact events of gas leakage accidents of node T, which had a notable impact on the occurrence of gas leakage accidents of node T.
- GeNIe software was used to compute the prior probability of the intermediate node, assuming that the probability of a basic event is updated if gas leakage has occurred. By comparing the ratio of the posterior probability to the prior probability, it was determined that the status of the flange, valve, and pipeline are critical factors in the occurrence of gas leakage accidents.
- On the basis of the developed DBN model, the probability of gas leakage in 10-time slices was predicted by GeNIe software, and the gas leakage probability and accident consequences C1 and C2 were drawn over time, indicating that occurrence probability increased with time.
In this study, there was some prior probability, conditional probability, and transition probability determined based on research and mathematical model deduction. Although the Leaky noisy-OR gate model was introduced to enhance accuracy, the validity and reliability of the data are still difficult to verify. In practical engineering scenarios, the accuracy of probability analysis could be improved by combing pipeline-specific corrosion monitoring records and maintenance logs. The Bayesian network can be systematically enhanced by increasing the factors affecting gas pipeline leakage to make it more comprehensive and complete. Additionally, the accuracy of the prediction results of DBN also needs to be further verified. In practical application, it is recommended to collect the probability information of multiple time slices. The probability of the earliest influencing factor with temporal attributes can be set as the initial parameter of the DBN, and the probability of other time slices can be used as reference values to compare and analyze the result of the model. Dynamic risk analysis of gas leakage is crucial for guaranteeing the long-term stable transportation of pipelines. By continuous model optimization and improvement, potential safety accidents can be prevented, and more effective responses can be guaranteed.
Author Contributions
Conceptualization, Z.W.; methodology, Z.W.; software, X.G.; validation, X.G.; formal analysis, X.J.; investigation, X.Z.; resources, X.Z.; data curation, X.J.; writing—original draft preparation, X.G.; writing—review and editing, Z.W.; visualization, X.J.; supervision, W.W.; project administration, W.W.; funding acquisition, W.W. All authors have read and agreed to the published version of the manuscript.
Funding
This research was funded by the National Key R & D Plan of China (2021YFE0105000, 2023YFC3009800), Shaanxi Province Key Research and Development Plan (2021SF-472, 2022QCY-LL-70), and Qin Chuangyuan Scientists and Engineers Team in Shaanxi Province (2023KXJ-052).
Data Availability Statement
The original contributions presented in this study are included in the article. Further inquiries can be directed to the corresponding author.
Conflicts of Interest
The authors declare no conflicts of interest.
References
- EGIG. 11th Report of the European Gas Pipeline Incident Data Group (Period 1970–2019). 2020. Available online: https://www.egig.eu/reports (accessed on 29 November 2023).
- Badida, P.; Balasubramaniam, Y.; Jayaprakash, J. Risk evaluation of oil and natural gas pipelines due to natural hazards using Fuzzy Fault Tree Analysis. J. Nat. Gas Sci. Eng. 2019, 66, 284–292. [Google Scholar] [CrossRef]
- Yan, D.; Li, Y. Discussion on quantitative evaluation of leakage risk of natural gas pipeline based on Fuzzy Bow-tie. Saf. Health Environ. 2019, 19, 42–47+54. [Google Scholar]
- Li, X.; Zhu, H.; Chen, G.; Lv, H.; Meng, X. Dynamic Bayesian model for risk analysis of undersea oil and gas pipeline. China Saf. Sci. J. 2015, 25, 75–80. [Google Scholar] [CrossRef]
- Chang, Y.; Zhang, C.; Shi, J.; Li, J.; Zhang, S.; Chen, G. Dynamic Bayesian network-based approach for risk analysis of hydrogen generation unit leakage. Int. J. Hydrogen Energy 2019, 44, 26665–26678. [Google Scholar] [CrossRef]
- Feng, X.; Jiang, J.; Wang, W. Gas pipeline failure evaluation method based on a Noisy-or-gate Bayesian network. J. Loss Prev. Process Ind. 2020, 66, 104175. [Google Scholar] [CrossRef]
- Dong, H.; Hou, X. Construction risk assessment method based on Leaky noisy-or gate and Bayesian network. Science Tech. and Ind. 2023, 23, 218–223. [Google Scholar]
- Cui, J.; Kong, Y.; Liu, C.; Cai, B.; Khan, F.; Li, Y. Failure probability analysis of hydrogen doped pipelines based on the Bayesian network. Eng. Fail. Anal. 2024, 156, 107806. [Google Scholar] [CrossRef]
- Wang, Y.; Xia, A.; Qin, G. Fuzzy Bayesian Network–Based Multidimensional Risk Assessment for Leakage of Blended Hydrogen Natural Gas Pipelines. J. Pipeline Syst. Eng. Pract. 2024, 15, 04024010. [Google Scholar] [CrossRef]
- Pang, M.; Zhang, Z.; Zhou, Z.; Li, Q. Risk Diagnosis Analysis of Ethane Storage Tank Leakage Based on Fault Tree and Fuzzy Bayesian Network. Appl. Sci. 2025, 15, 1754. [Google Scholar] [CrossRef]
- Chang, Y.; Wu, X.; Zhang, C.; Chen, G.; Liu, X.; Li, J.; Cai, B.; Xu, L. Dynamic Bayesian networks-based approach for risk analysis of subsea wellhead fatigue failure during service life. Reliab. Eng. Syst. Saf. 2019, 188, 454–462. [Google Scholar] [CrossRef]
- Khakzad, N. Application of dynamic Bayesian network to risk analysis of domino effects in chemical infrastructures. Reliab. Eng. Syst. Saf. 2015, 138, 263–272. [Google Scholar] [CrossRef]
- Khakzad, N.; Khan, F.; Amyotte, P. Dynamic safety analysis of process systems by mapping Bow-tie into Bayesian network. Process Saf. Environ. Prot. 2013, 91, 46–53. [Google Scholar] [CrossRef]
- Khakzad, N.; Khan, F.; Amyotte, P. Dynamic risk analysis using BT approach. Reliab. Eng. Syst. Saf. 2012, 104, 36–44. [Google Scholar] [CrossRef]
- Bobbio, A.; Portinale, L.; Minichino, M.; Ciancamerla, E. Improving the analysis of dependable systems by mapping Fault Trees into Bayesian Networks. Reliab. Eng. Syst. Saf. 2001, 71, 249–260. [Google Scholar] [CrossRef]
- Henrion, M. Some Practical Issues in Constructing Belief Networks. In Proceedings of the Third Annual Conference on Uncertainty in Artificial Intelligence, Seattle, WA, USA, 10–12 July 1987; p. 13. [Google Scholar]
- Liao, S.; Zou, B.; Wang, Y.; Zhu, J.; Xie, D. Hydrogen Sulfide Protection for Natural Gas Production and Transportation Operations; Chongqing University Press: Chongqing, China, 2013. [Google Scholar]
- Ramírez-Camacho, J.G.; Carbone, F.; Pastor, E.; Bubbico, R.; Casal, J. Assessing the consequences of pipeline accidents to support land-use planning. Saf. Sci. 2017, 97, 34–42. [Google Scholar] [CrossRef]
- Zhang, Y.; Wang, Y.-H.; Zhao, X.; Tong, R.-P. Dynamic probabilistic risk assessment of emergency response for intelligent coal mining face system, case study: Gas overrun scenario. Resour. Policy 2023, 85, 103995. [Google Scholar] [CrossRef]
- Hong, B.; Shao, B.; Guo, J.; Fu, J.; Li, C.; Zhu, B. Dynamic Bayesian network risk probability evolution for Third-party damage of natural gas pipelines. Appl. Energy 2023, 333, 120620. [Google Scholar] [CrossRef]
- Wang, C.; Liu, Y.; Lian, X.; Luo, J.; Liang, C.; Ma, H. Dynamic risk assessment of plugging and abandonment operation process of offshore wells based on dynamic Bayesian network. Ocean Eng. 2023, 270, 113625. [Google Scholar] [CrossRef]
- Sintef Technology and Society, Norges Teknisk-Naturvitenskapelige Universitet and DNV Gl. Offshore and Onshore Reliability Data Handbook; OREDA, 2015. Available online: https://store.veracity.com/oreda-cloud-offshore-onshore-reliability-data (accessed on 29 November 2023).
- United States Department of Transportation. Pipeline and Hazardous Materials Safety Administration. 2023. Available online: https://www.phmsa.dot.gov/about-phmsa/offices/office-pipeline-safety-organization-chart (accessed on 29 November 2023).
- Chen, K.; Shi, N.; Lei, Z.; Chen, X.; Qin, W.; Wei, X.; Liu, S. Risk classification of shale gas gathering and transportation pipelines running through high-consequence areas. Processes 2022, 10, 923. [Google Scholar] [CrossRef]
- Sun, D.; Chen, S. Study on the leakage risk of hydrogen pipeline based on the dynamic Bayesian model. Saf. Environ. 2022, 22, 901–909. [Google Scholar] [CrossRef]
- Zarei, E.; Azadeh, A.; Khakzad, N.; Aliabadi, M.M.; Mohammadfam, I. Dynamic safety assessment of natural gas stations using Bayesian network. J. Hazard. Mater. 2017, 321, 830–840. [Google Scholar] [CrossRef] [PubMed]
Disclaimer/Publisher’s Note: The statements, opinions and data contained in all publications are solely those of the individual author(s) and contributor(s) and not of MDPI and/or the editor(s). MDPI and/or the editor(s) disclaim responsibility for any injury to people or property resulting from any ideas, methods, instructions or products referred to in the content. |
© 2025 by the authors. Licensee MDPI, Basel, Switzerland. This article is an open access article distributed under the terms and conditions of the Creative Commons Attribution (CC BY) license (https://creativecommons.org/licenses/by/4.0/).