Article

Study on the Mechanism of High-Pressure Spraying of Water-Based Release Agent by External Mixing

School of Mechanical and Electrical Engineering, Anhui Jianzhu University, Hefei 230601, China
*
Author to whom correspondence should be addressed.
Processes 2025, 13(4), 1224; https://doi.org/10.3390/pr13041224
Submission received: 18 March 2025 / Revised: 12 April 2025 / Accepted: 14 April 2025 / Published: 17 April 2025
(This article belongs to the Section Materials Processes)

Abstract

:
In the casting and stamping process of automobile, ship, aerospace, and other fields, improving the atomization quality of the spray release agent can effectively solve the problems of difficult film removal, low efficiency, and poor surface finish, and greatly improve the efficiency of production and manufacturing. The geometric model of the external mixing nozzle was constructed, and the calculation domain and grid were divided. The atomization flow field velocity, liquid film thickness, particle distribution, and cooling amount were calculated using fluid simulation software. Finally, an experimental platform was set up for verification. With the increase in the distance between the iron plate and the nozzle, the velocity of the flow field decreases from the nozzle exit to the periphery, and the frequency distribution of D60–70 increases gradually. With the increase in the pressure ratio (K), the particle velocity increases gradually, the liquid film thickness increases first, and then gently decreases, and the D60–70 frequency distribution decreases. The influence of gas pressure on atomized particle velocity and liquid film thickness is greater than that of liquid phase pressure, and the ion velocity reaches the peak value when K = 2. When K = 1.5, the average thickness increment of absolute liquid film is small, the atomized particle diameter changes the least, the frequency distribution of D65 particles is approximately the same, and the atomization effect is the most stable. When the spraying time is 1 s, the K value is larger, and the smaller the temperature drop will be. In 2–4 s, the change in K value has little influence on the cooling amount.

1. Introduction

A release agent is a functional substance that lies between the mold and the finished product and is widely used in a variety of molding operations, including, but not limited to, metal die casting, polyurethane foams and elastomers, glass fiber reinforced plastics, injection-molded thermoplastics, vacuum-foamed sheets, and extruded profiles. In addition, the release agent is also used in forging, glass, porcelain, paper, and other manufacturing industries, mainly for the surface treatment of casting molds, to facilitate the separation between castings and molds. However, the dispersion of atomization and the mechanism of concentration distribution are the key factors affecting the spraying quality. Therefore, this study aims to deeply explore the dispersion characteristics and concentration distribution mechanism of high-pressure spraying, so as to provide theoretical support and practical guidance for optimizing the spraying process.
Dong et al. [1] established a model of a submerged angular cavitation nozzle. The effects of the inlet contraction part, parallel middle part, and outlet expansion part on the velocity and vapor volume fraction are studied. A cavitation cloud is produced near the rigid wall of the outlet expansion section and diffuses in a vortex ring shape. Zhang et al. [2] investigated the flow state near the nozzle and the distribution mode of lubrication in the meshing part. The pressure near the nozzle increases gradually with the increase in the rotational speed and decreases with the increase in the cone Angle. Vankeswaram et al. [3] studied the characteristics of fuel spray under different injection pressures in the near-nozzle region of the swirl atomizer. They measured the spatial distribution of average particle size and velocity at the nozzle outlet with a Doppler tonometer and concluded that the axial and radial velocities of all droplet sizes in the hollow region were independent of each other, while the core regions were strongly coupled with each other. Chen Bo et al. [4] claimed that the adhesion and sedimentation characteristics of fog droplets and smoke can improve the particle removal efficiency of the nozzle. By using the orthogonal numerical simulation method, they concluded that the smaller the atomized particle size, the larger the maximum particle velocity, and the shorter the time to reach the maximum velocity. Wang et al. [5] used fluid analysis software to simulate the atomization effect of the nozzle in two-phase flow and analyzed the atomization characteristics of the nozzle under different injection pressures. The results show that the atomization cone angle is larger when the compressed air pressure is less than 0.5 bar. When the pressure exceeds 0.7 bar, the atomization cone angle decreases. Tong et al. [6] used the atomization angle and the internal mixing pneumatic atomization droplet particle size test platform to find that the aerosol velocity is 8–11 m/s, the dust velocity is 1 m/s, and the particle size of the droplet is uniformly distributed in the range of 20–40 μm, which can be well coupled with the dust in each particle size range, and the dust removal efficiency is the highest. Based on the large eddy simulation (LES) model and fluid volume (VOF) model, Yu et al. [7] introduced a self-mesh thinning method to predict the fracture of the liquid core. Then, the random generation method of constant radius droplets and the Kelvin–Helmholtz/Rayleigh–Taylor (KH-RT) method are used to calculate the secondary breaking of large droplets, so that the relative error between the simulated and experimental average droplet diameter is less than 21.4%.
The existing research mainly focuses on the influence of changing the geometry and pressure parameters of the external mixing nozzle on the atomization effect, and the liquid phase material selected is mostly water. However, there are few studies on the dispersion characteristics of the spray release agent. Therefore, it is of great significance to explore the factors affecting the release-agent-based special spray nozzle for improving the production efficiency and surface quality of injection stamping products.

2. Model Establishment

2.1. Three-Dimensional Structure Model

In this paper, an external mixing sprinkler is designed, which consists of a gas shell and a liquid inner core. Construct nozzle structure model with solidworks2021. The gas communication path is separated from the liquid path, and the respective flow and pressure can be adjusted. The three-dimensional structure model is shown in Figure 1. The inlet end of the gas phase shell is a ring air inlet with a large diameter of 11.5 mm and a small diameter of 10.5 mm. The outlet end is composed of two symmetrical outlet holes with a diameter of 1 mm. The air passage is a narrow space formed between the gas phase shell and the liquid phase inner core, as shown in Figure 2. The inner core of the liquid phase has a wedge cone outside, and the inner flow channel is a cylindrical cone with a gradually decreasing diameter [8,9].

2.2. Fluid Computational Model

Because the velocity of the flow field, the distribution of particles, and the thickness of the liquid film change at every moment, the transient model is chosen for calculation.
K-epsilon is a classic two-path turbulence model that is suitable for a high Reynolds number, fully developed turbulent flow, ignoring the influence of intermolecular viscosity, and has high computational efficiency. κ ω is sensitive to free-flow conditions, and the inlet boundary conditions are set strictly, which mainly solves the problems of near-wall flow, low Reynolds number turbulence, and flow separation. SST κ ω is suitable for complex flow problems, such as turbine machinery and wind airfoil; moreover, κ ω and SST κ ω are more computational than κ ε . The flow field of the atomizing nozzle is a typical completely turbulent region, and the standard K-epsilon ( κ ε ) model is selected [10]. It can predict turbulence characteristics by solving the transport equations of turbulent kinetic energy and turbulent energy dissipation rate.
t ρ κ + x i ρ κ u i = P κ ε + x j μ + μ t σ κ κ x j
t ρ ε + x i ρ ε u i = C 1 ε ε κ P κ C 2 ε ε 2 κ + x j μ + μ t σ ε κ x j
where κ and ε are the turbulent kinetic energy and turbulent dissipation rate, respectivley, P κ is the generation term of turbulent kinetic energy, μ t is the turbulent viscosity coefficient, and the model constants are C 2 = 1.44 , C 2 = 1.92 , κ = 1.3 , σ ε = 1.0 , and β = 0.09 , respectively.
The discrete phase model is selected, the interaction with the continuous phase is checked, the discrete phase model (DPM) source phase is updated for each flow iteration, the iteration interval is set to 200, and the maximum tracking step number is set to 500. The crushing model and multi-component coupling solution are also checked. The type of injection source is selected as an air atomizing nozzle, and the number of strands is selected as 50. In Euler’s wall liquid film model, Choose to solve the momentum equation and solve the energy equation, as well as for discrete phase coupling, phase coupling, particle splashing, and particle spalling [11]. The pressure inlet is selected for the water and gas phase inlet, the pressure outlet is selected for the outlet, and Euler liquid film wall is selected for the wall.

3. Computing Domain and Grid Independence Test

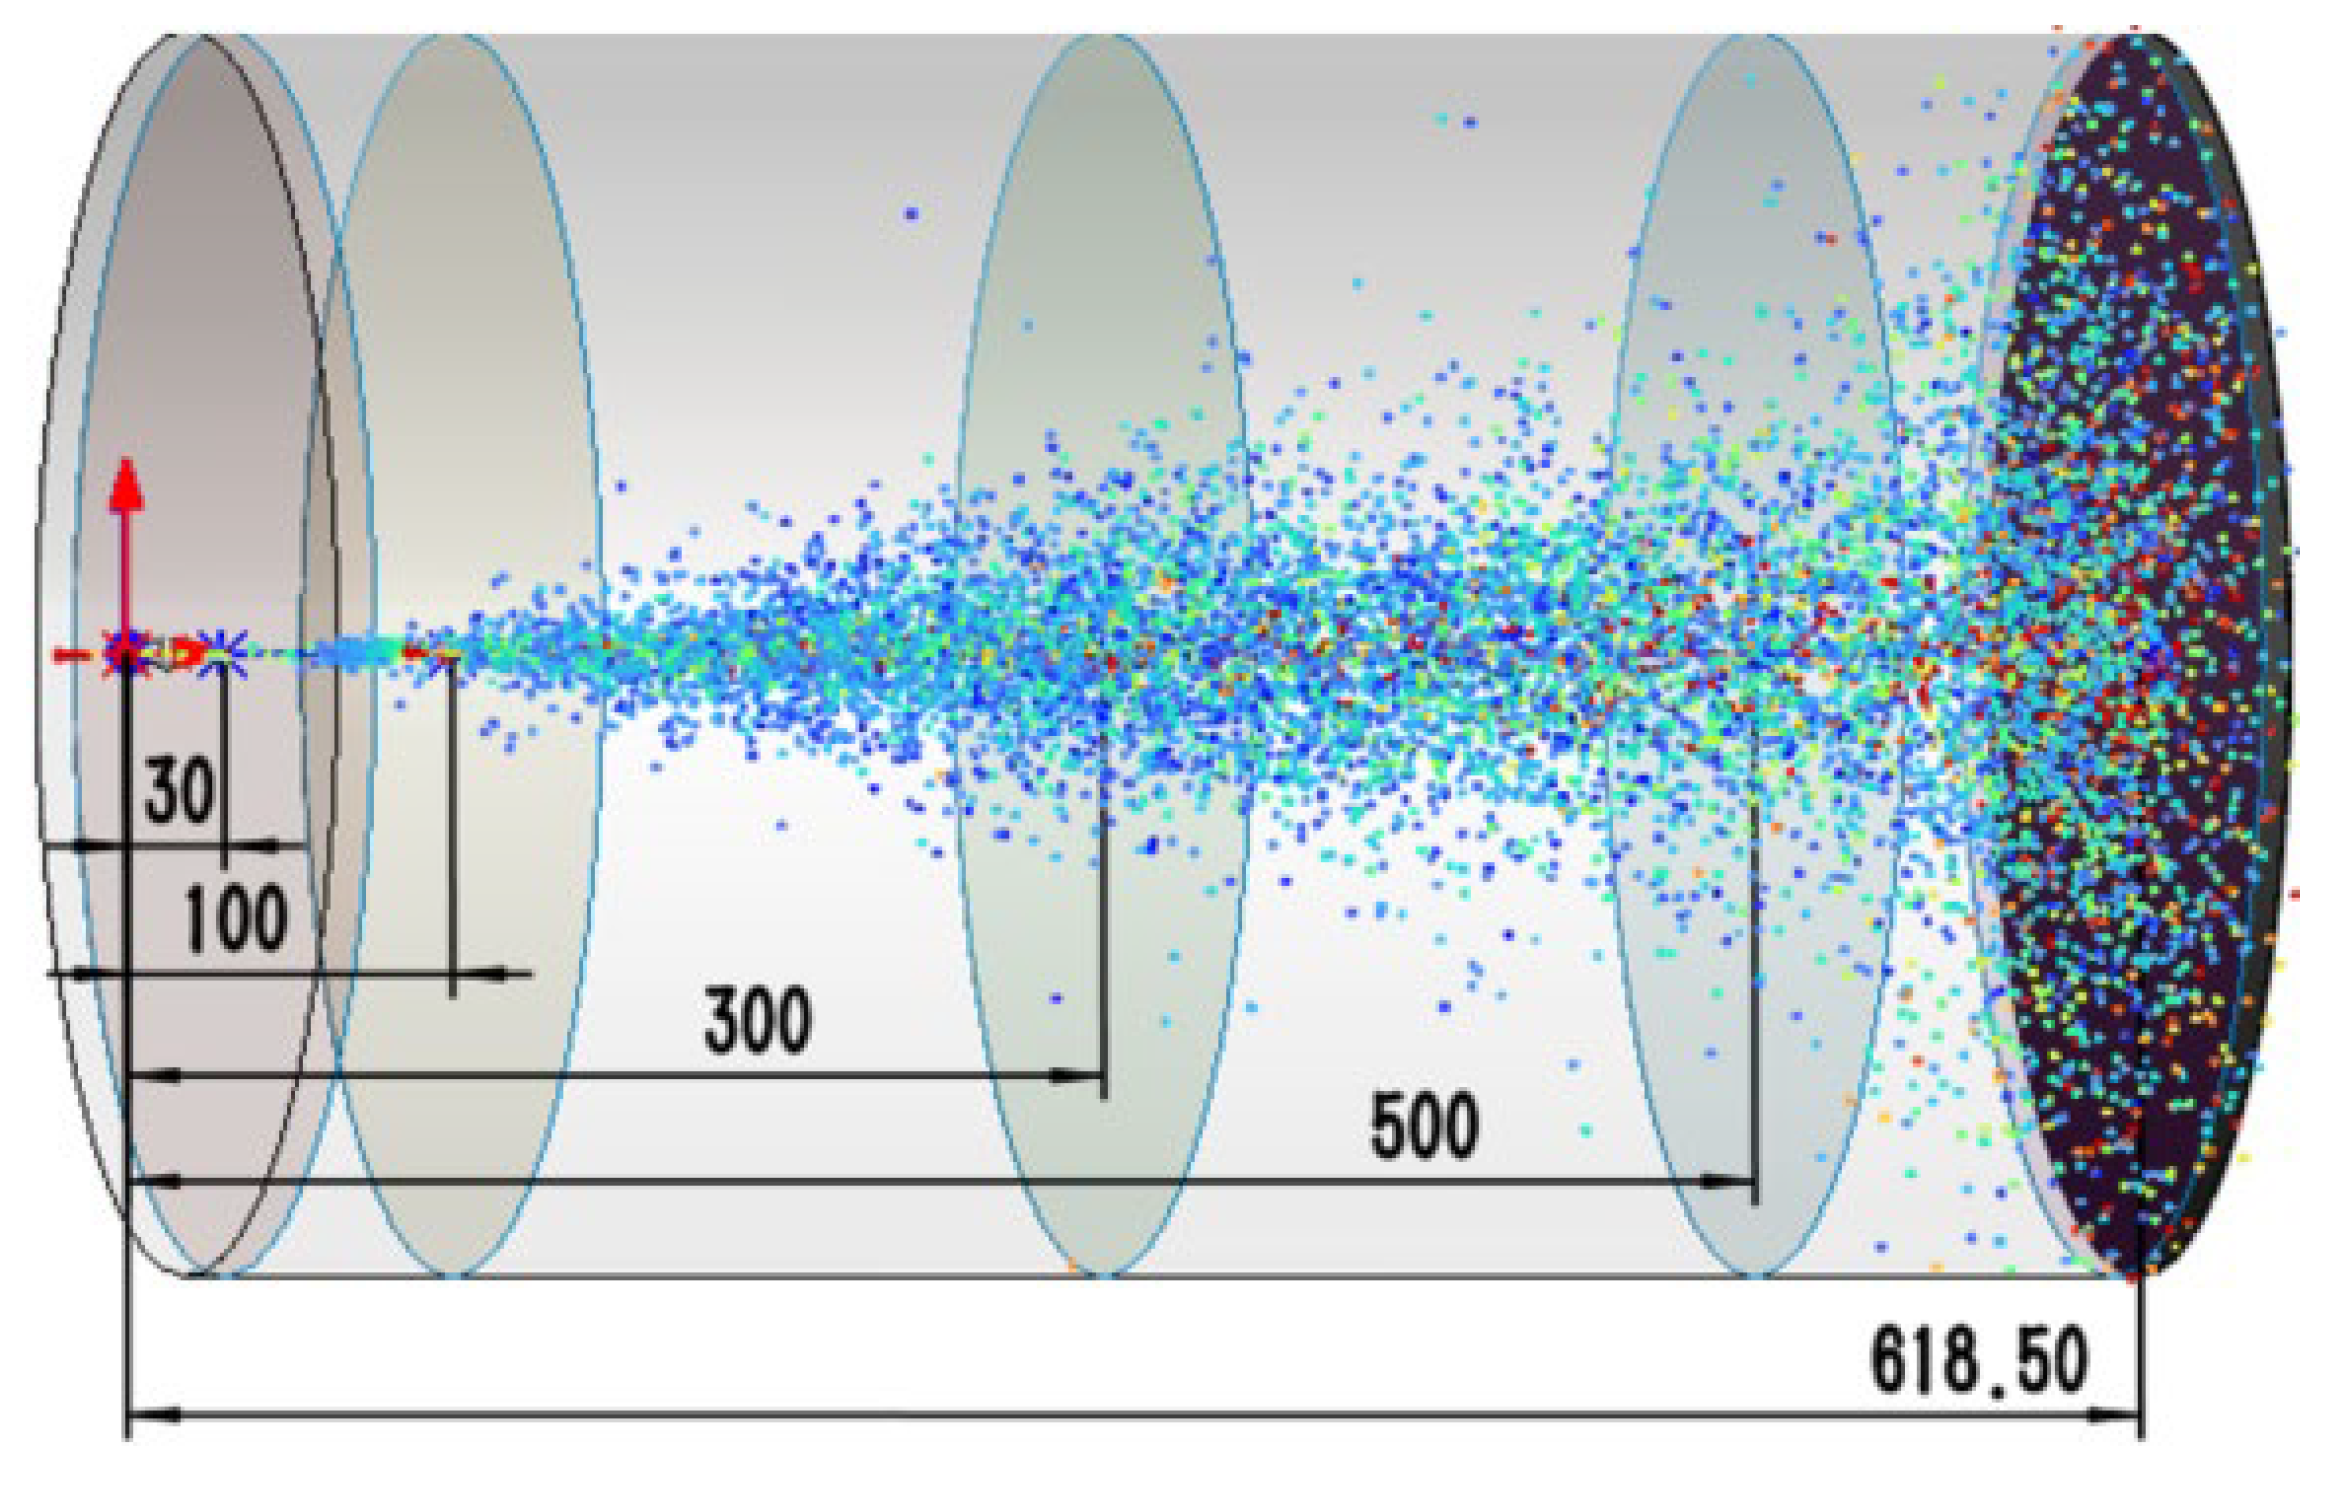
3.1. Fluid Computing Domain Selection

In the whole process of nozzle atomization, the principle of interaction between two gas–liquid phases is complicated. From the nozzle exit to 150 mm, it belongs to the impact collision section. After ejecting the release agent, it collides strongly with the high-pressure gas to form small droplets. The range of 150–450 mm belongs to the crushing and tearing segment, where small droplets with high kinetic energy interact with the air and tear into smaller particles. From 450 mm to the iron plate is the diffusion sputtering section and, at this time, the atomized droplet kinetic energy decreases sharply, some particles further tear and diffuse, and the other part directly impacts with the iron plate and sputters into atomized particles, as shown in Figure 3. The impact section and the crushing and tearing section are the first atomization stage, and the diffusion sputtering is the second atomization stage. Most of the atomized particles adhere to the iron plate to form a liquid film, and a small amount of them escape to the surrounding air or polymerization into new fog particles.
In order to accurately understand the fluid flow and particle distribution in the whole flow field, a cylindrical calculation domain model with a diameter of 400 mm and a length of 600 mm was established at the nozzle outlet. Since the trajectory of the first gas–liquid particle collision has a great influence on the secondary atomization, an additional conical mixing zone is established in the gas–liquid mixing section to better refine the fluid calculation area and obtain more accurate simulation results, as shown in Figure 4.
According to the overall structure of the model, the gas phase fluid region adopts unstructured mesh. The liquid phase fluid region and the cylindrical outflow field are structured grids, and the conical outflow field of the unstructured mesh is meshed [12,13,14], as shown in Figure 5. The interface between the gas phase, liquid phase, and conical outflow field, as well as the interface between the conical outflow field and the cylindrical outflow field, need to control the size of the mesh elements reasonably, so that the size of the contact mesh at the interface is similar. In view of the friction resistance near the wall of the gas phase and liquid phase of the nozzle, the wall mesh needs to be encrypted and refined. For the cylindrical outflow field, two O-cuts are used to make the overall distribution of the mesh close to that of the actual nozzle atomization, and the correct fluid simulation results are obtained as much as possible.

3.2. Grid Independence Test

The meshes of the nozzles generate four different mesh number groups of 390,000, 1.15 million, 1.52 million, and 1.89 million, respectively. The corresponding velocity changes in the four meshes at the distances of 250 mm, 350 mm, 450 mm, and 550 mm from the nozzle are shown in Figure 6. When the grid number is about 1.15 million, the velocity change rate of points at different distances tends to be gentle, and the calculation results converge. Considering the calculation time and result accuracy, 1.15 million grid number groups were finally selected [15].

4. Effect of Gas–Liquid Pressure Ratio on Atomization Quality

In order to explore the influence of gas phase pressure and liquid phase pressure on the atomization effect, reduce the number of simulation groups, and get closer to the most real working situation, dimensionless factor K was introduced to discuss the influence degree of gas phase and liquid phase pressure on atomized particle velocity [16], liquid film thickness, fog particle distribution, and cooling amount. Seven groups of pressures are shown in Table 1.
K = P a p w
K : gas–liquid pressure ratio; P a : pressure of the gas phase; and p w : pressure of the liquid phase.
Aiming at the influence of K value on flow field velocity, particle size distribution, liquid film thickness and cooling amount. If there are numerical mutations and anomalies in the simulation, all parameter settings will be checked to see whether they are correct, and then the simulation of this group of working conditions will be run 2–3 times. We must ensure that the simulation experiment is not affected by the calculation system or human error so that the simulation results are correct in all working conditions.

4.1. Influence of Pressure Ratio on Velocity Field

The center points 50 mm, 150 mm, 250 mm, 350 mm, 450 mm, 550 mm, and 618.5 mm are selected from the nozzle, and the velocity of each center point under different K values is obtained, as shown in Figure 7. When the release agent with high kinetic energy is impacted by high pressure gas, the kinetic energy of the particles is further enhanced, and the velocity near the exit is larger [17,18,19,20]. The jet particles are subjected to air resistance, and the speed decreases gradually. After reaching the iron plate, some particles adhere to the iron plate, making its speed become zero. The other particles lose a lot of kinetic energy in the sputtering process after hitting the iron plate, and the speed becomes close to zero. When the liquid phase pressure is constant, the atomized particle velocity increases with the increase in gas phase pressure. In addition, within 150 mm from the nozzle, the speed change rate is the largest, and the speed decreases slowly after 150 mm.
As the pressure of the liquid phase increases, the atomized particle speed also increases; moreover, at a K value of 2, the velocity of the ion reaches its peak. The maximum velocity corresponding to the liquid phase pressure of 0.3 MPa, 0.4 MPa, 0.5 MPa, and 0.6 MPa is 183 m/s, 210 m/s, 236 m/s, and 259 m/s, respectively. When the pressure of the gas phase is constant, the velocity of atomized particles does not change significantly with the increase in the liquid phase pressure. When the gas phase pressure is 0.3 MPa and the distance from the nozzle is 450 mm, the liquid phase pressure is 0.3 MPa, 0.4 MPa, and 0.6 MPa and the corresponding velocity is about 10.03 m/s, 10.35 m/s, and 10.9 m/s, respectively. When the gas phase pressure is 0.6 MPa and the distance from the nozzle is 450 mm, the liquid phase pressure is 0.3 MPa, 0.4 MPa, and 0.6 MPa corresponding to the velocity of 13.72 m/s, 13.95 m/s, and 14.3 m/s, respectively.
With the increase in K value, the atomized particle velocity gradually increases, and the velocity variation amplitude gradually increases, as shown in Figure 8. As shown in the figure, the larger the distance is, the slower the speed decreases. When the K value is 0.5 and the liquid phase pressure is increased by 0.1 MPa. The incremental velocity changes at 150 mm, 250 mm, 350 mm, 450 mm, 550 mm, and 618.5 mm from the nozzle are 3.3 m/s, 2.02 m/s, 1.44 m/s, 1.12 m/s, 0.83 m/s, and 0.28 m/s, respectively. When the K value is 2 and the liquid phase pressure is increased by 0.1 MPa. The incremental velocity changes at 150 mm, 250 mm, 350 mm, 450 mm, 550 mm, and 618.5 mm from the nozzle are 5.88 m/s, 3.56 m/s, 2.53 m/s, 1.94 m/s, 1.44 m/s, and 0.46 m/s, respectively.

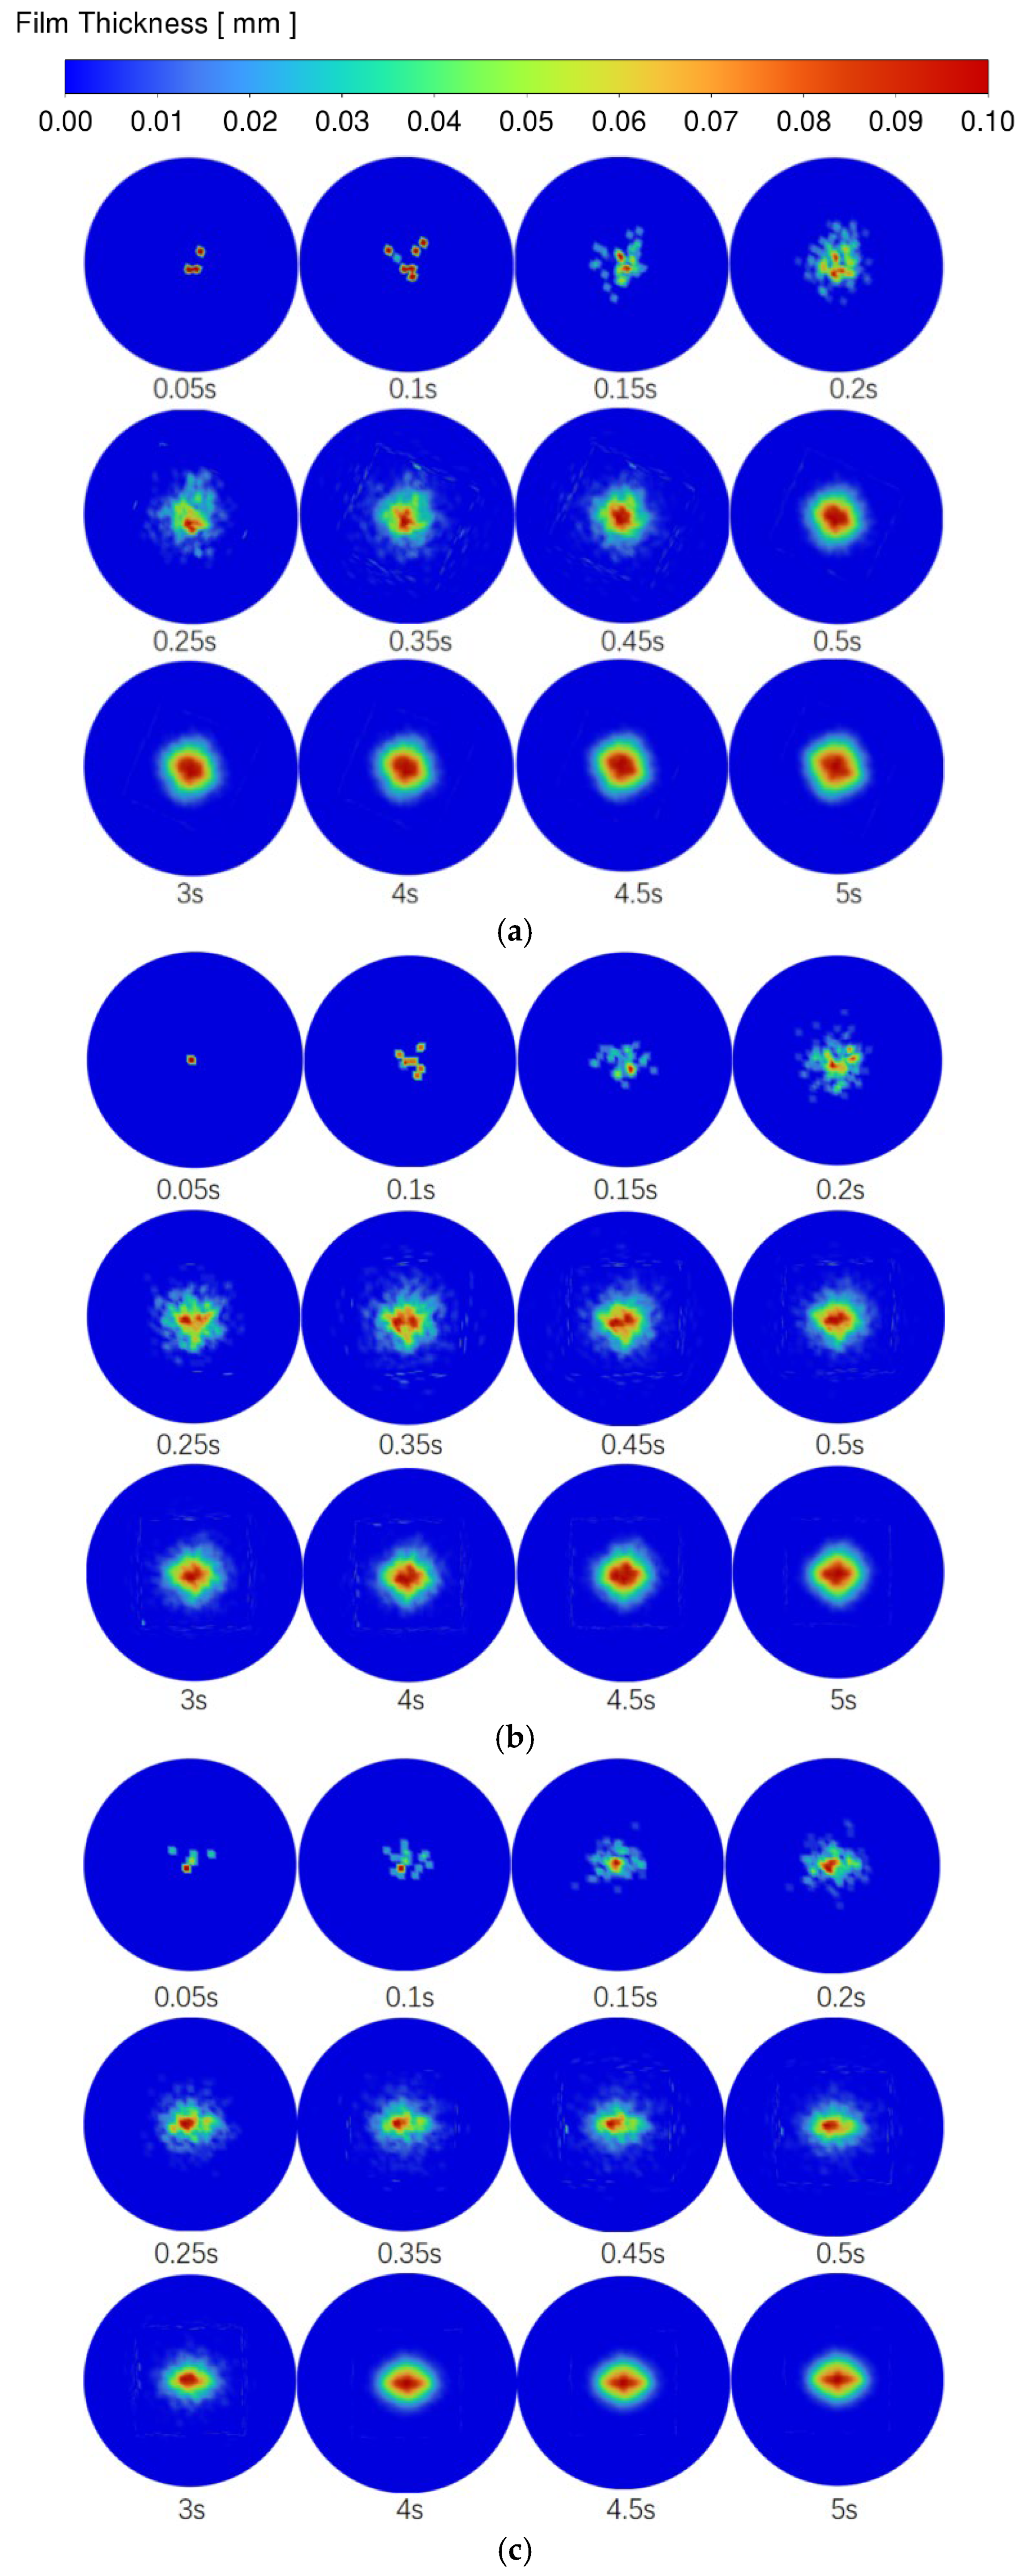
4.2. Influence of Pressure Ratio on Liquid Film

In order to explore the thickness of the liquid film formed after the release agent atomization, the thickness of the liquid film at the central point on the iron plate was monitored to obtain the thickness of the liquid film under different pressures, as shown in Figure 9. When the liquid phase pressure is determined, the liquid film thickness at the central point gradually decreases with the increase in K value. With the increase in liquid phase pressure, the liquid film thickness increases first and then flattens. Especially after the liquid phase pressure reaches 0.4 MPa, the growth rate of the liquid film thickness on the iron plate is not obvious, so the gas phase pressure has a greater impact on the liquid film thickness. Because the release agent gathers a stream and jets from the flow channel, it cannot achieve the atomization effect; in addition, the gas impact is the dominant factor for the dispersion of the release agent into mist droplets. With the continuous increase in air pressure, the particles carry powerful energy to overcome the interparticle force and tear into the atomized particles with smaller diameters, and the thickness of the liquid film attached to the iron plate becomes thinner and more uniform [21].
The thickness of liquid film increases gradually with time, and the change in liquid film thickness is obvious in 0.05–0.5 s. After 0.5 s, the thickness of the liquid film increases slowly, and the injection is about 5 s. Due to the viscosity of the release agent itself, the release agent on the surface of the iron plate is saturated, and the liquid film thickness at the center point does not change greatly [22]. The cloud map of liquid film thickness formed when the K value is 1.5 and the liquid phase pressure is 0.4 MPa, 0.5 MPa, and 0.6 MPa is determined, as shown in Figure 10. According to the cloud image, it is obvious that the thickness and range of the liquid film under the three pressures are very similar, which again indicates that the liquid phase pressure has little influence on the liquid film thickness.
In order to further obtain the degree of influence of the K value on liquid film thickness, the changes in liquid film between 0.4 MPa, 0.5 MPa, and 0.6 MPa under the same K value were explored, and the increment of absolute liquid film average thickness was plotted, as shown in Figure 11. When the K value is 0.5, 0.75, 1, 1.25, 1.5, and 1.75, 2, the corresponding absolute liquid film average thickness increment is 10.5 μm, 10.5 μm, 3.8 μm, 3.6 μm, 2.6 μm, 3.2 μm, and 2.4 μm, respectively. The smaller the absolute liquid film average thickness increment is, the higher the atomization quality, indicating that the film stripping agent is more uniform and stable.
When the K value is 1.5 and 2, the thickness of the liquid film changes stably, and the spraying is more uniform and comprehensive. In order to achieve the best demolding effect, the liquid film thickness should be controlled at about 100 μm. When the liquid phase pressure is 0.4 MPa, the greater the K value, the greater the cost of increasing the gas phase pressure [23,24,25]. In conclusion, a K value of 1.5 has the best effect on the formation of liquid film thickness.
When the K value is smaller, the overall spraying energy consumption efficiency will be reduced, in addition to meeting the target value of the spraying requirements, as far as possible to ensure that the liquid phase pressure value is small. In conclusion, the K value is 1.5 and liquid pressure is 0.4 MPa when the thickness of the liquid film forming effect is best.

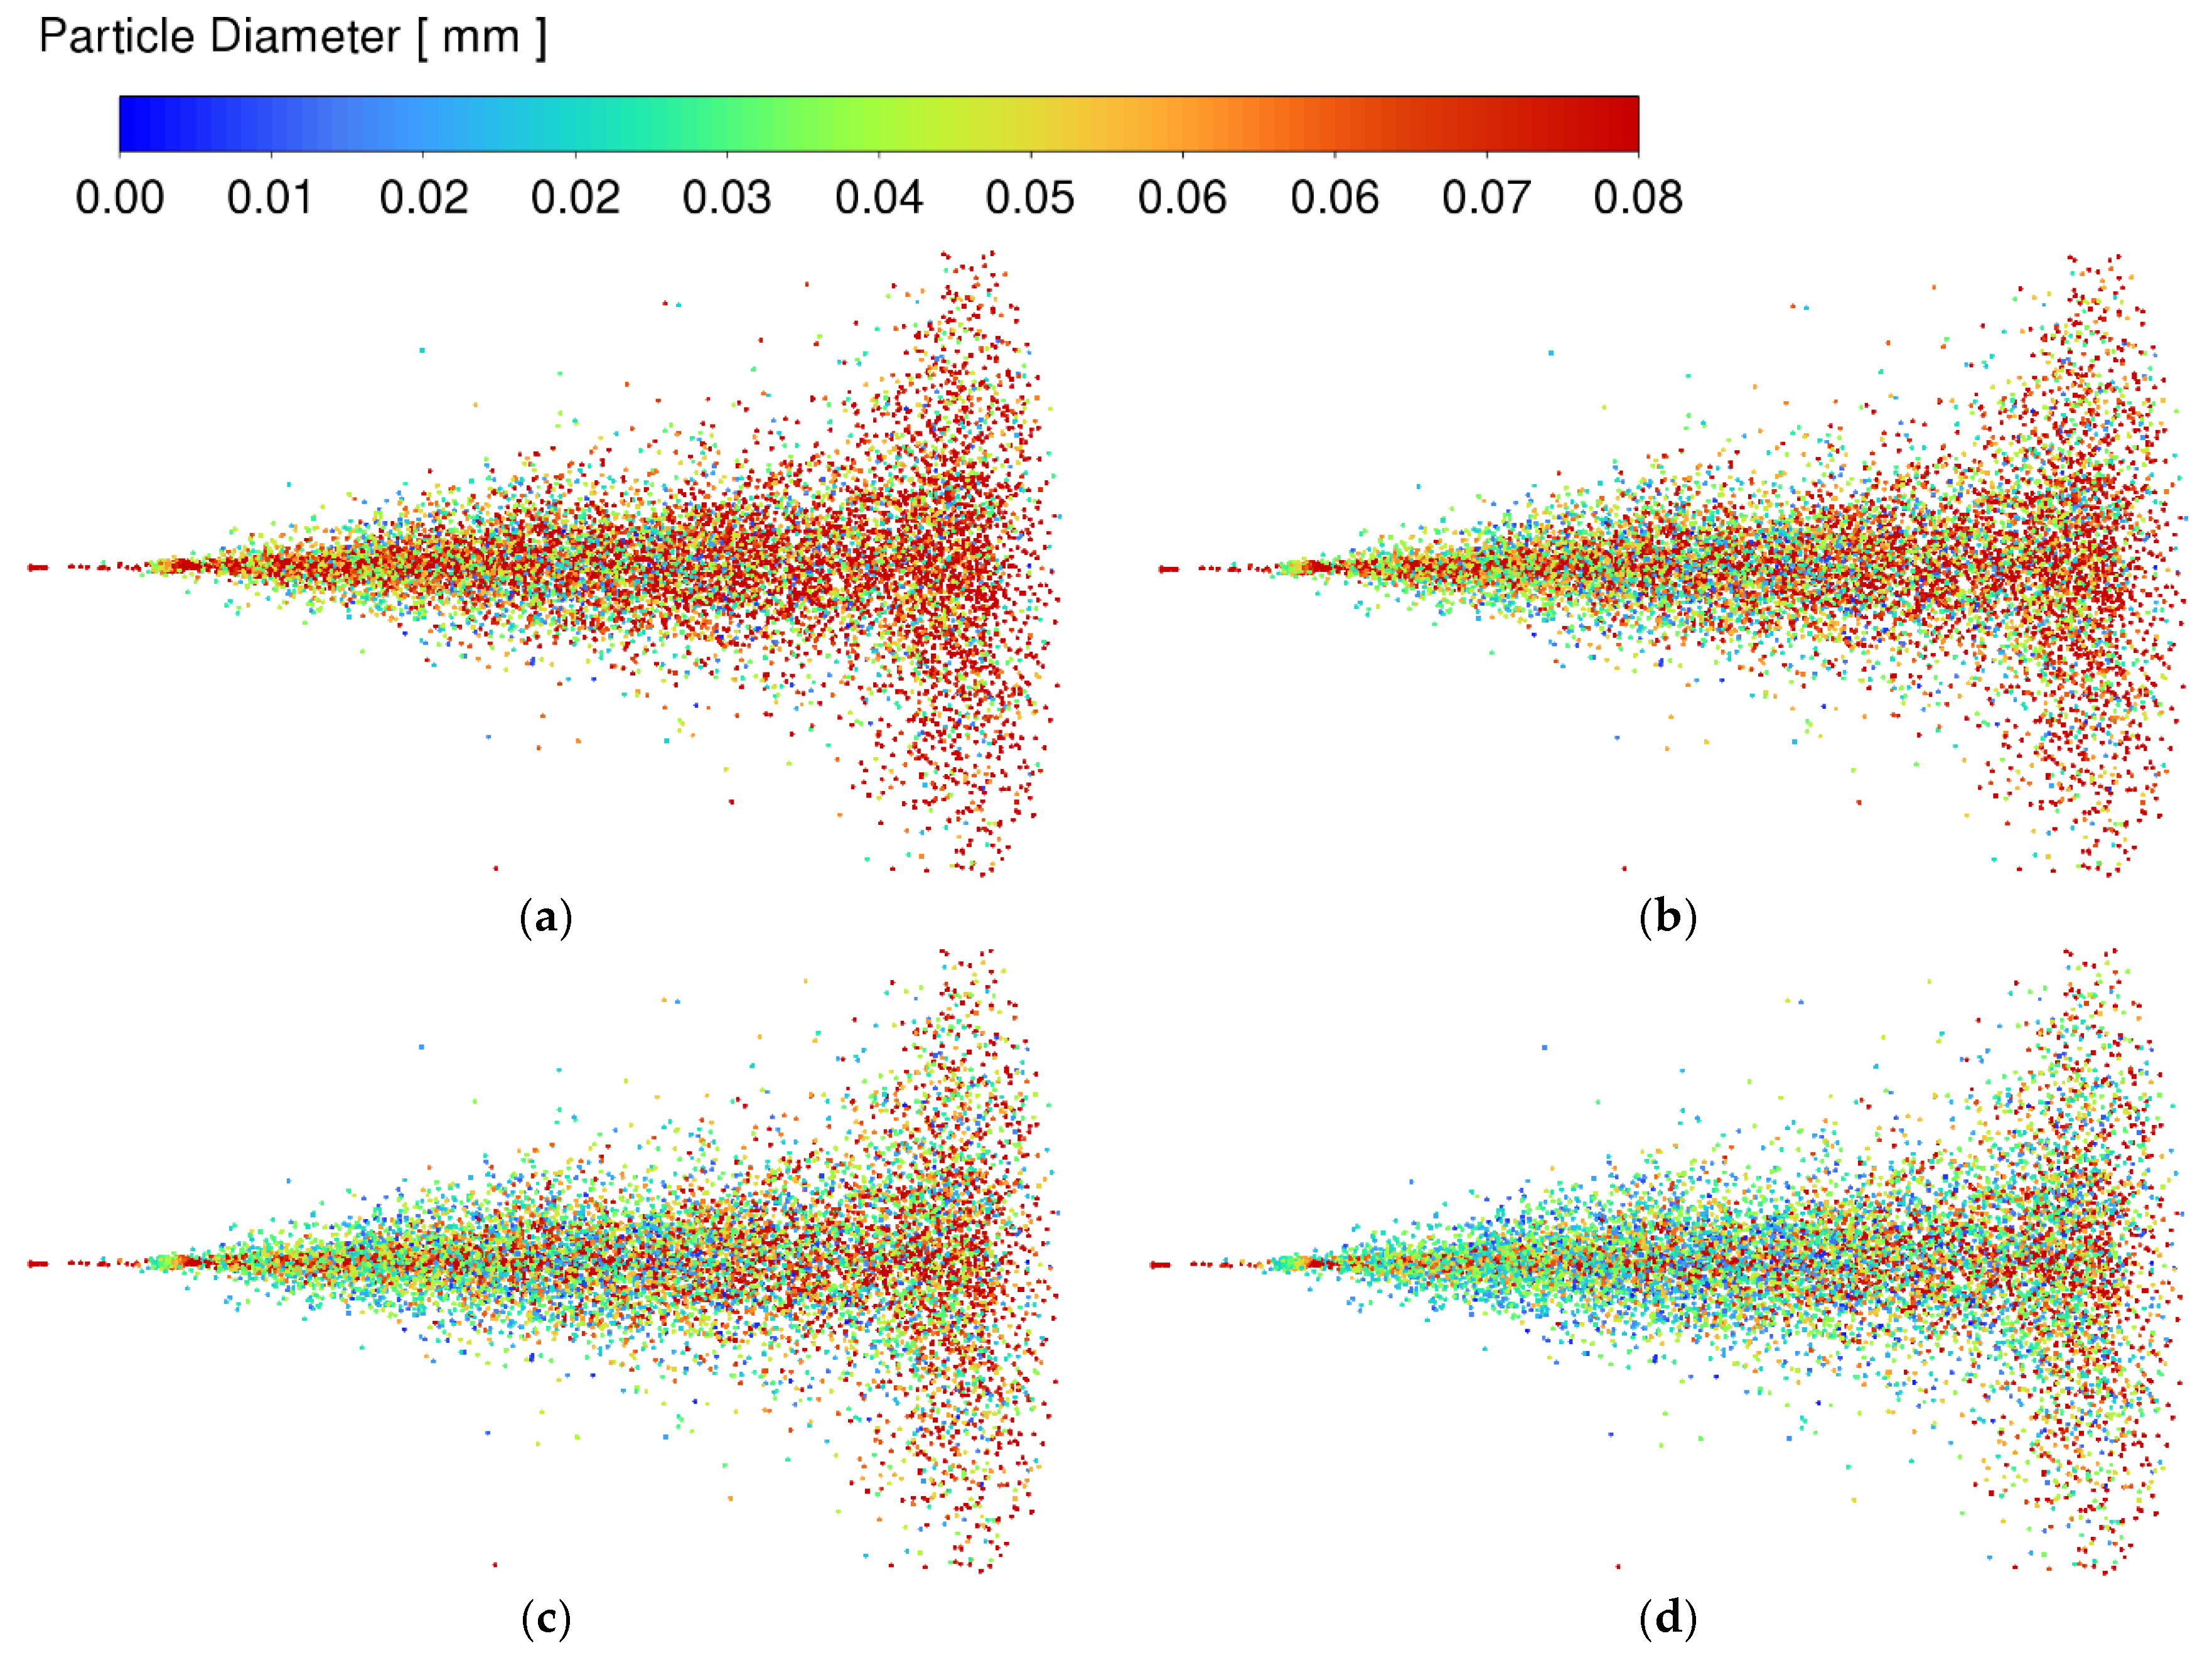
4.3. Influence of Pressure Ratio on Particle Distribution

In the whole process of nozzle spraying, the particles as a whole present solid conical atomization, most of the particles reach the spraying surface, and a small number of particles are dispersed in the air due to insufficient kinetic energy. A plane is set 30 mm, 100 mm, 300 mm, and 500 mm away from the nozzle to capture the particle distribution in the plane, as shown in Figure 12.
Under a water phase pressure of 0.3 MPa and a gas phase pressure of 0.15 MPa, the frequency distribution of atomized particles (D60–70) with a diameter of 60–70 μm is shown in Figure 13. When droplet and droplet contact, the liquid film discharge leads to the decrease in interface energy, and finally the merger is realized. The lower the interfacial tension, the more easily polymerization occurs. Rupture refers to the process by which a droplet splits into multiple subphases under shear force. When the release agent did not touch the iron plate, the droplet size distribution range was wide, and the number of particles of 60–70 microns was relatively small. Some of the particles that hit the iron plate split themselves into smaller droplets, while others sputtered to form small particles on the liquid film [26]. The two parts fuse into larger particles on the surface of the iron plate and the splattered particles recombine, with the particles being ejected in the flow field, Arrows show the direction of droplet rupture and aggregation. as shown in Figure 14. Within 610 mm from the nozzle, the D60–70 distribution frequency is about 24% and the D60–70 distribution frequency on the surface of the iron plate is 29%.
Since the particle diameter distribution on the surface of the iron plate is most closely related to the release agent’s release effect, it is necessary to simulate the particle diameter distribution near the iron plate under different pressure ratios [27], as shown in Figure 15. Under various K values, the particle size distribution is normal, the peak diameter of the atomized particles is stable at about 65 microns, and the change in K value has little effect on the particle size distribution. When the K value is 1.5, the atomized particle diameter changes the least with the change in liquid phase pressure, the atomized particle (D65) with a diameter of 65 μm has the same frequency distribution, and the atomization effect is the most stable.
In the whole atomization process, the atomized particle diameter is mainly distributed in 60–70 microns. When the K value is 0.5, fog particles with a diameter of 60–70 microns on the surface of the iron plate are collected for further analysis [28,29], as shown in Figure 16. The percentage of D60–70 frequency distribution decreases with the increase in liquid pressure. When the pressure is 0.3–0.4 MPa, the frequency distribution percentage of D60–70 decreases rapidly, while when the pressure is 0.4–0.6 MPa, the frequency distribution percentage of D60–70 decreases relatively less. When the liquid phase pressure is small, the high-pressure gas can impact the release agent to break more evenly, and the D60–70 distribution is more concentrated. After 0.4 MPa, the kinetic energy of the pressure impacting the liquid at the same K value is relatively small, the release agent is torn into particles with different particle sizes, and the number of D60–70 is significantly reduced, as shown in Figure 17.

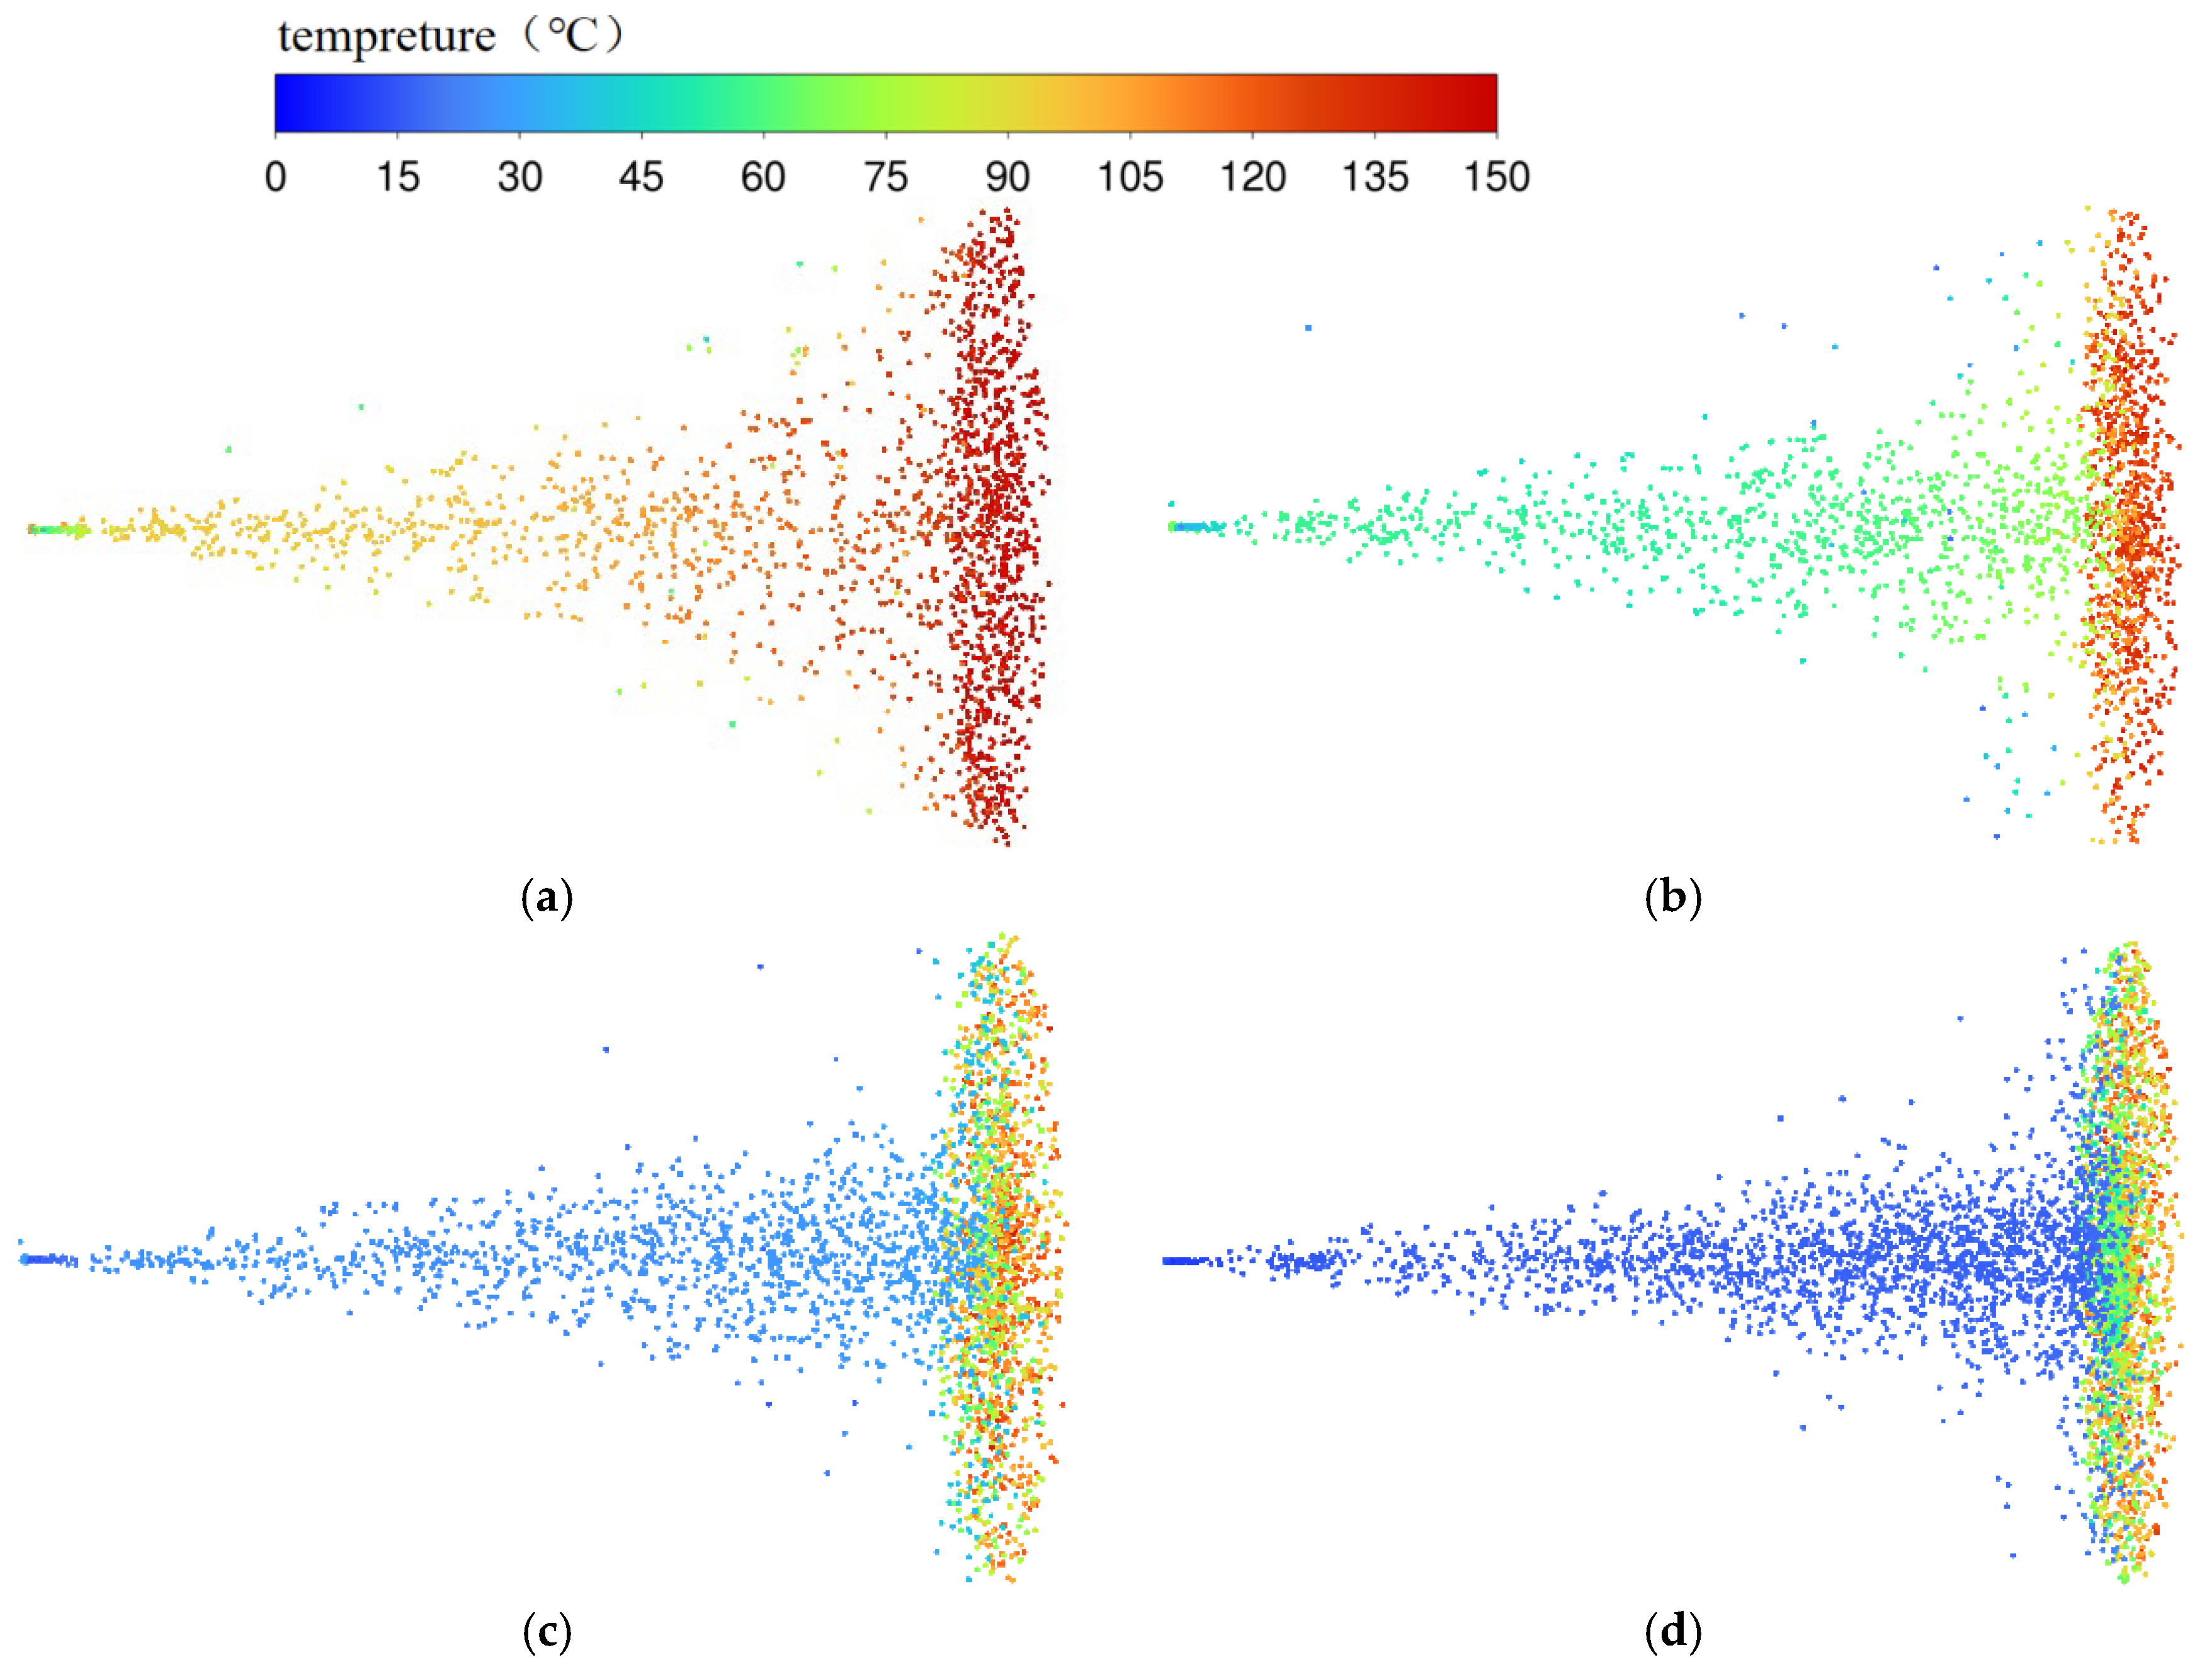
4.4. Influence of Pressure Ratio on Temperature

The diluted release agent is sprayed onto the mold, the high-temperature mold evaporates the water, and the release agent is attached to the surface to facilitate the smooth release of the die casting. The mold temperature affects the surface quality of castings to a great extent, and controlling the mold temperature by changing the release agent spraying variable plays a crucial role.
For the spray release agent of the copying nozzle tooling, the general spray time is within 4 s, and a moderate reduction in the mold surface temperature can ensure the surface quality of the casting. Based on the above simulation of gas–liquid velocity, liquid film thickness, and particle size distribution, when the K value is 1.5 and the liquid phase pressure is 0.4 MPa, the change in mold cooling amount with time is obtained. As shown in Figure 18, within 1 s of spraying, the release agent atomized particles are also affected by the high-temperature mold due to the very high temperature [30]. After spraying for 1 s, the atomized particles formed by the release agent will evaporate quickly after approaching or contacting the plate, which will instantly take away a large amount of heat on the mold, and the mold surface temperature will be significantly reduced. After 2–4 s of spraying, due to the accumulation of a layer of release agent on the surface of the mold, the cooling efficiency of the mold will be slowed down, and the speed of mold temperature reduction will be much slower than that.

5. Analysis of Experimental Results on Cooling Amount Based on K Value

5.1. Building an Experimental Platform

The release agent can form a film on the surface of the mold, which has the functions of separation protection and lubrication, as well as temperature regulation. The commonly used ones include water-based release agents, whose physical parameters are shown in Table 2. To fully utilize the efficiency of water-based release agents, the spray head used in the experiment is an external-mixing-type spray head. The external mixing spray head system can precisely adjust the proportion of gas phase and liquid phase to ensure a uniform spraying area and stable quality and can achieve an excellent spraying effect. The structure of the external mixing spray head is relatively simple and easy to operate and maintain, which not only brings convenience to the workers in coating-related industries, but also greatly saves time and labor costs. The external mixing spray head has strong flexibility in regulating the spray shape and atomization degree and can meet different coating requirements. In conclusion, the external mixing spray head selected in this experiment has the advantages of high spraying quality, energy saving, efficiency, simple operation, flexible adjustment, and wide application range.
In order to obtain real experimental data as much as possible, the experimental environment variables should be the same as the actual working conditions of the die-casting workshop. The variables include, but are not limited to, temperature, humidity, voltage, inlet pressure, intake pressure, etc. The specific environmental variables are shown in Table 3.
All experiments used the same set of equipment, the nozzle used an imported high-precision external mixing nozzle, and the release agent ratio used an imported high-precision drug feeder ratio. The experimental equipment was placed in a room with a constant temperature of 27 °C and constant humidity of 30% to reduce the evaporation effect of indoor temperature and humidity on the temperature of heating steel plates and the process of spraying the release agent. The temperature and flow rate are measured several times before, during, and after each experiment. If there is a large change, the data are discarded and then measured again.
The air source of the external mixing nozzle is provided by the compressor, and the pneumatic diaphragm pump transfers the water from the water tank to the proportional mixing pump. The mixing pump uses its own water drive to dilute and mix the release agent stock and water according to the set concentration. Finally, the release agent evaporates rapidly after atomizing from the nozzle to heating the iron plate, taking away the heat on the iron plate, and the thermal imager monitors the temperature change in the iron plate. Pressure sensors, flow sensors, and thermal imagers transmit data to the computer to monitor the dynamic changes in pressure, flow, and temperature in real time [31], as shown in Figure 19.

5.2. Data Analysis

According to the analysis of experimental data, there is a linear relationship between the cooling amount of the iron plate and the K value within 1 s of spraying time, the cooling amount gradually decreases with the increase in the K value, and the cooling amount reaches the maximum when the K value is 0.5, which is about 50.5 °C.
When the spraying time is within 2–4 s, the temperature reduction range slows down, and the influence of changing the K value on the temperature is weakened. When the spraying time is 1–2 s, 2–3 s, and 3–4 s, the average cooling amount under various K values is stable at about 9 °C, 5 °C, and 9.5 °C, respectively. When the release agent spraying time is short, the water droplets evaporate immediately after contact with the high-temperature iron plate, taking away a lot of heat, and the surface temperature of the iron plate drops the fastest. The release agent, after evaporation, adheres to the surface of the iron plate, and the surface of the iron plate will form a layer of water vapor after evaporation, which plays a certain isolation role. Even if the duration of spray of the release agent is increased, the reduction rate of the iron plate temperature is also greatly affected, as shown in Figure 20.
It can be clearly seen from the simulation data that the cooling amount decreases with the increase in K value, especially the spraying time within 3 s. Within 1 s of spraying time, the K value corresponding to the maximum cooling amount of the iron plate is 0.5, about 55.5 °C. The experimental data are in good agreement with the simulation results, and the error is controlled within 15%, which indicates that the simulation can provide a theoretical basis for the research of the spray mechanism of the release agent.
The comprehensive analysis of the experimental measured cooling amount below the overall simulation obtains the cooling capacity, and the results of the experiment stability are inferior compared to the simulation data. This is mainly because, in the process of re-experiment, the uncontrollable variables in real conditions are more and more complex compared to those of the simulation environment. Especially after the spraying time of 2 s, the small cooling amount is more affected by the ambient temperature, which ultimately makes the experimental data not completely linear in terms of change.

6. Conclusions

Based on the study of the atomization discrete characteristic mechanism of the external mixing nozzle and the introduction of the gas–liquid phase pressure ratio K, the influences of the pressure ratio on the flow field velocity, liquid film thickness, particle distribution, and cooling amount are expounded one by one, and the following conclusions are obtained:
(1)
With the increase in the pressure ratio of the gas phase to the liquid phase, the droplets with a certain kinetic energy encounter the high-pressure gas with a higher kinetic energy, the atomized particle velocity increases gradually, and the velocity variation range increases gradually. When K = 2, the ion velocity reaches its peak, and the influence of gas pressure on atomized particle velocity is greater than that of liquid pressure.
(2)
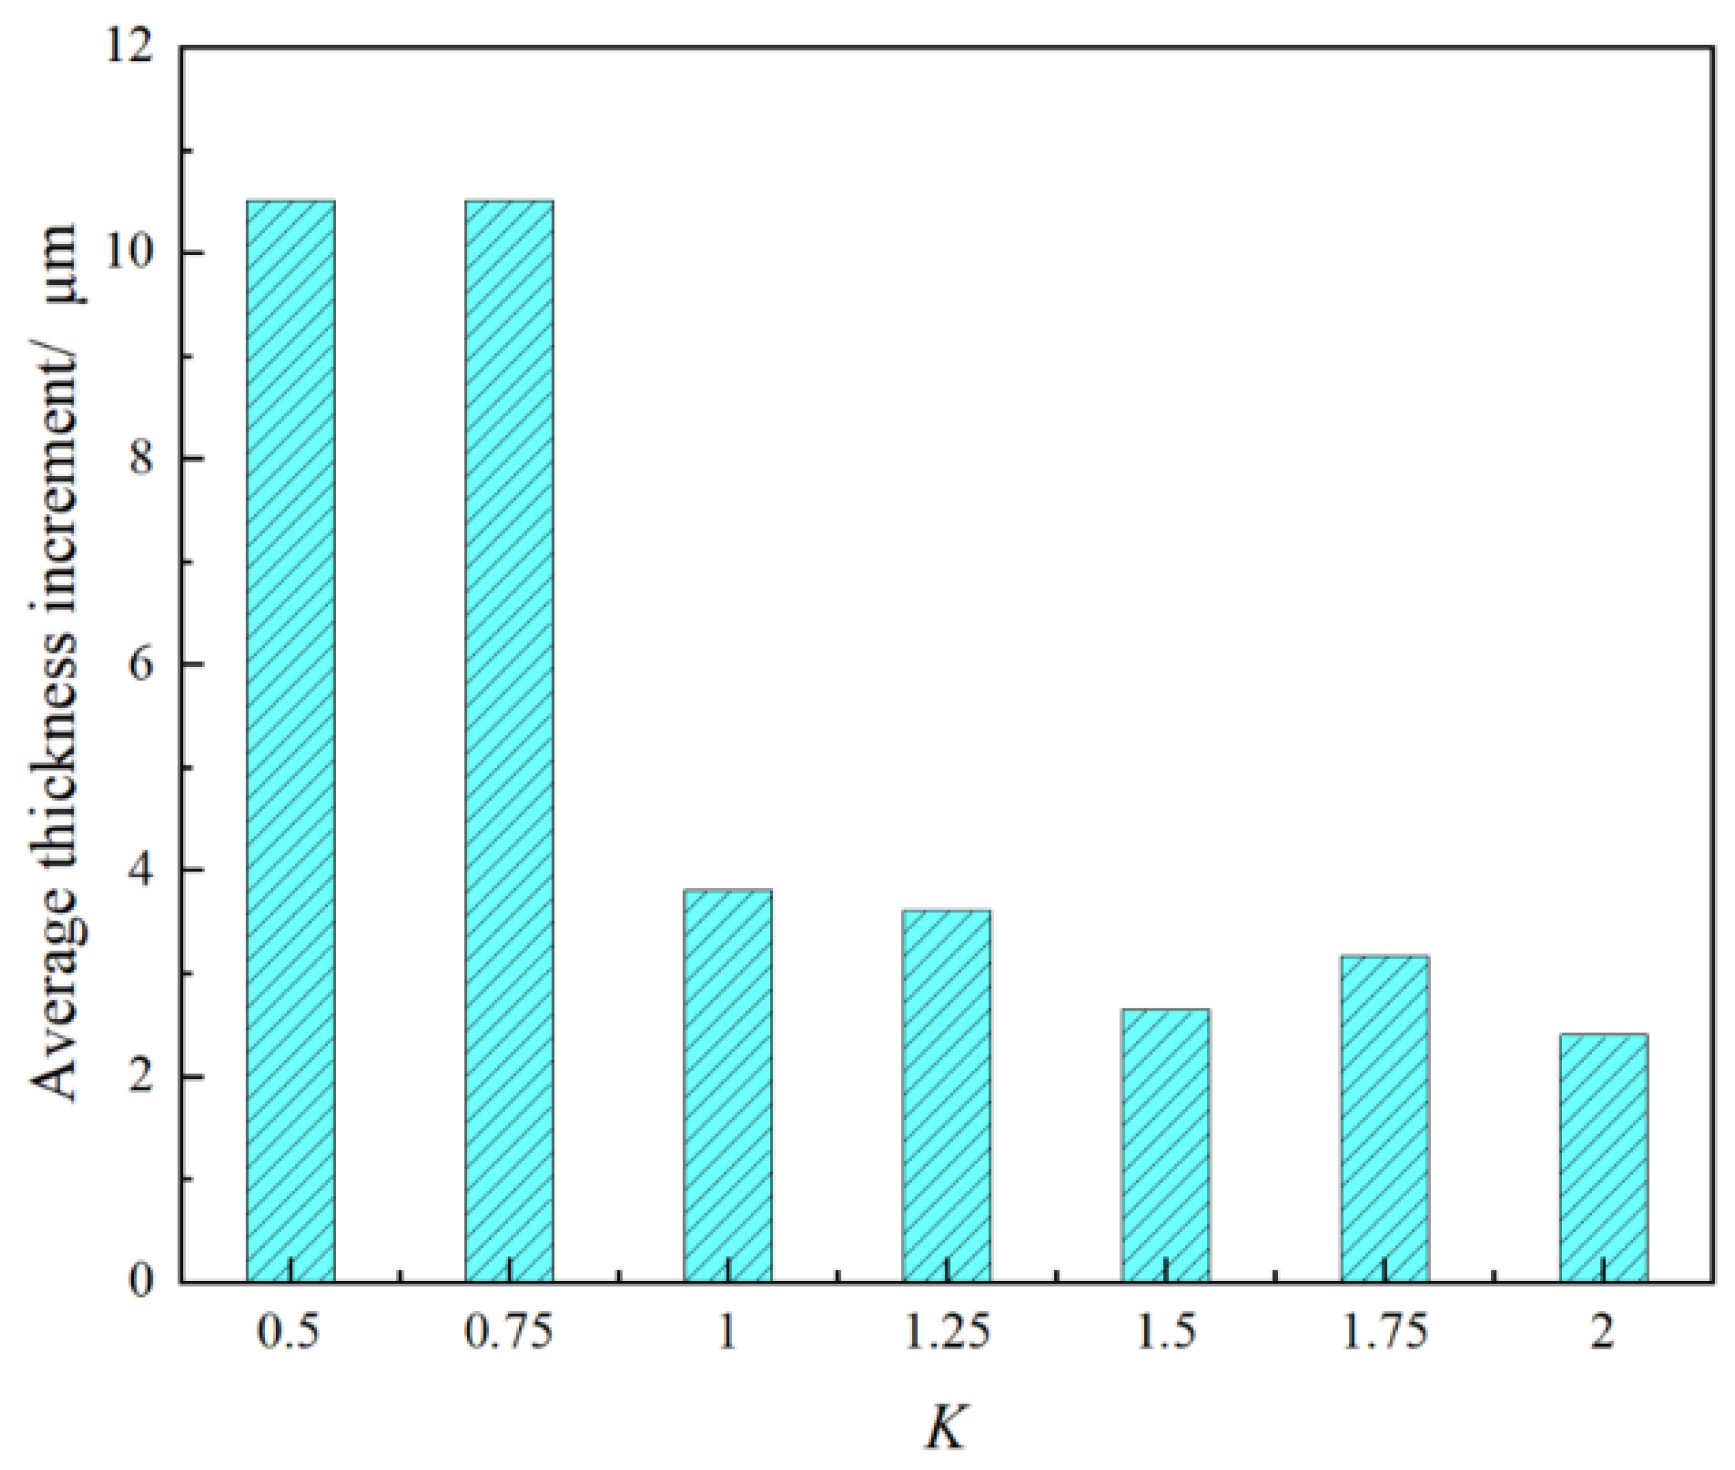
When the liquid phase pressure is determined, with the increase in K value and the increase in air pressure, the particles overcome the shear force and tear into atomized particles with a smaller diameter. The liquid film thickness on the iron plate gradually tends to saturation, and the liquid film thickness increases first and then flattens. After the liquid phase pressure reaches 0.4 MPa, the influence of gas phase pressure on liquid film thickness is greater than that of liquid phase pressure. When K = 1.5, the absolute liquid film average thickness increment is small, which has the best effect on the formation of liquid film thickness.
(3)
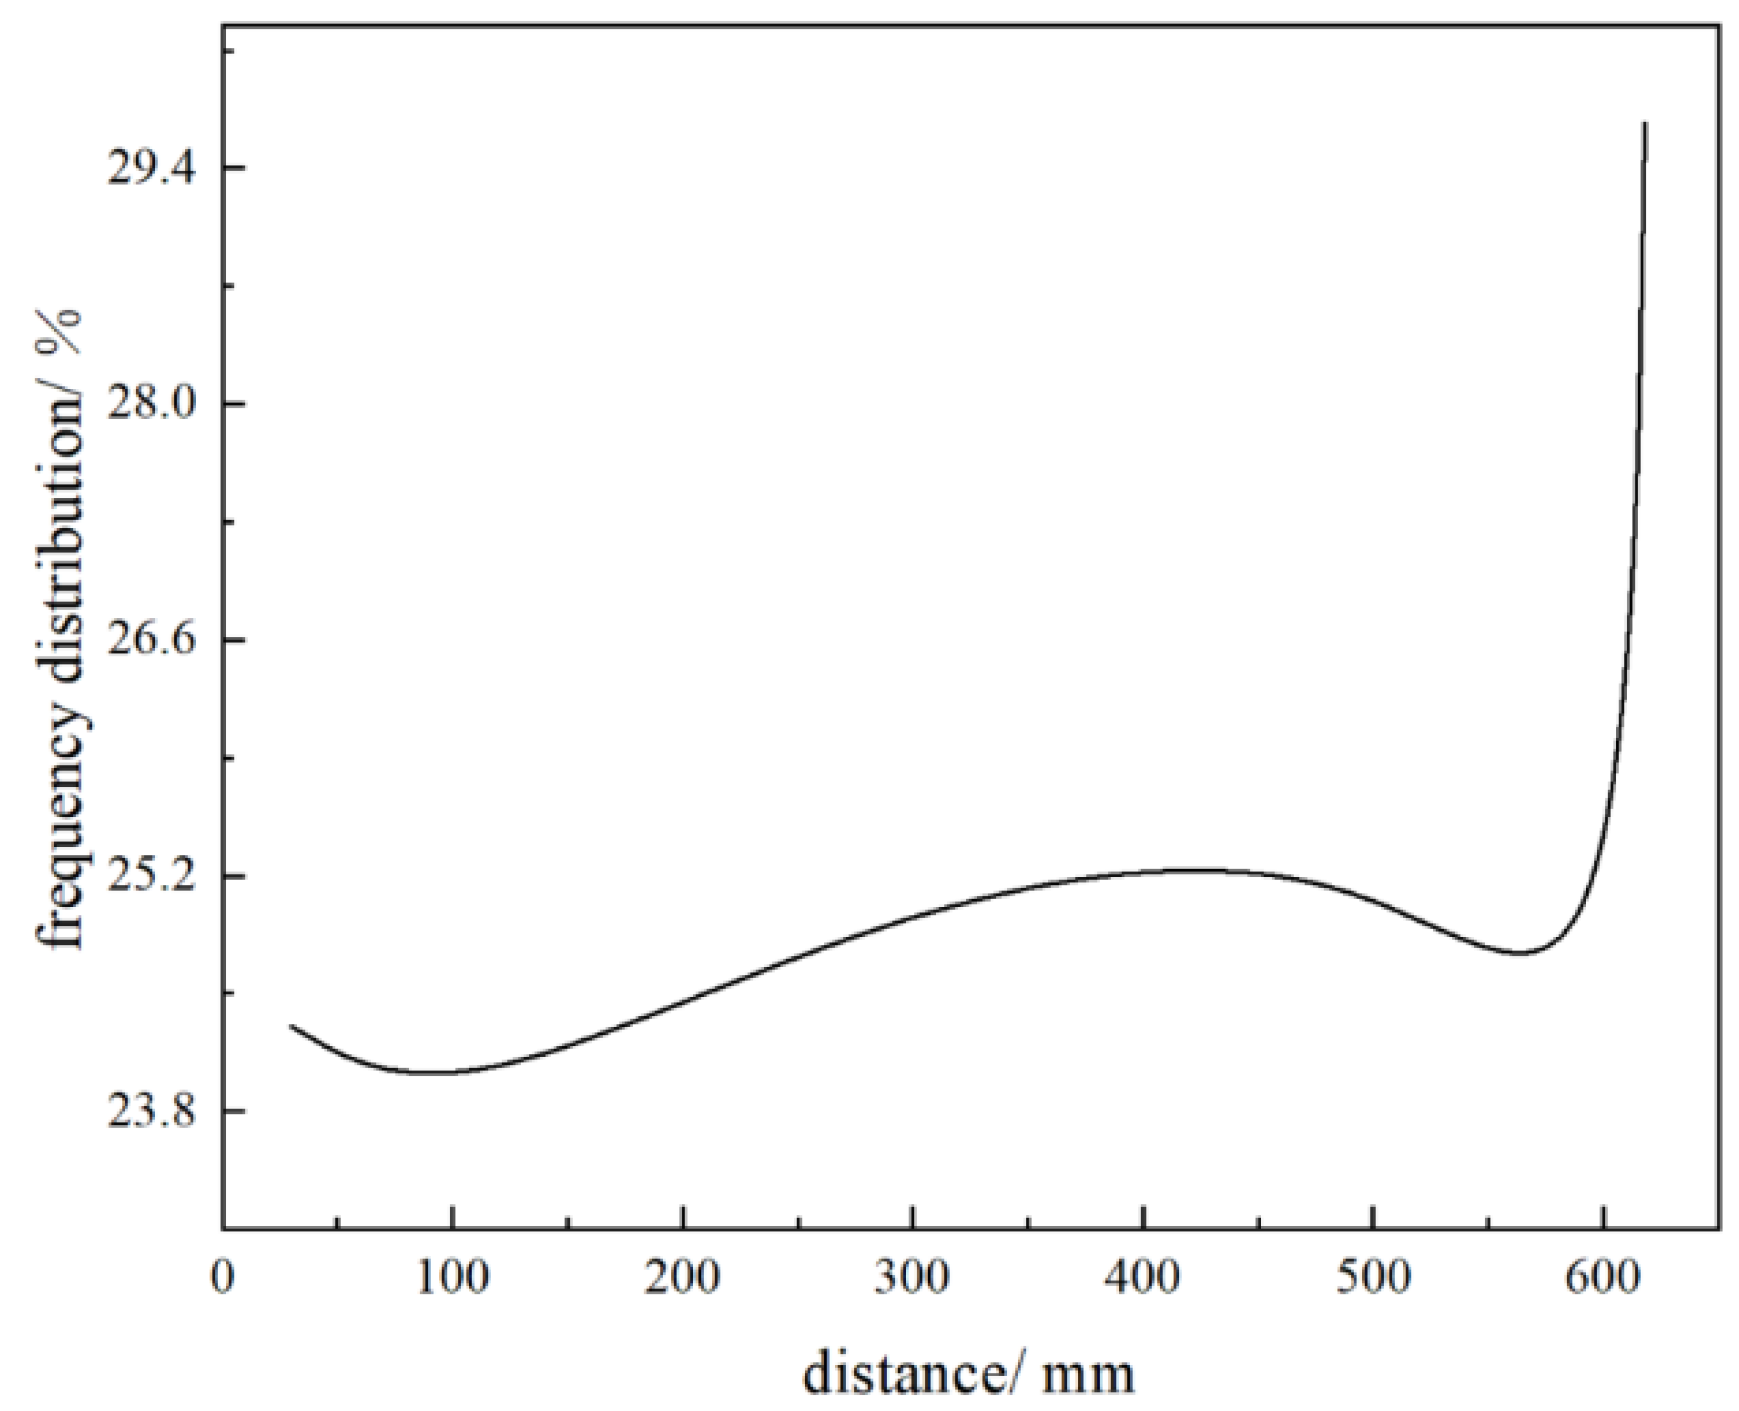
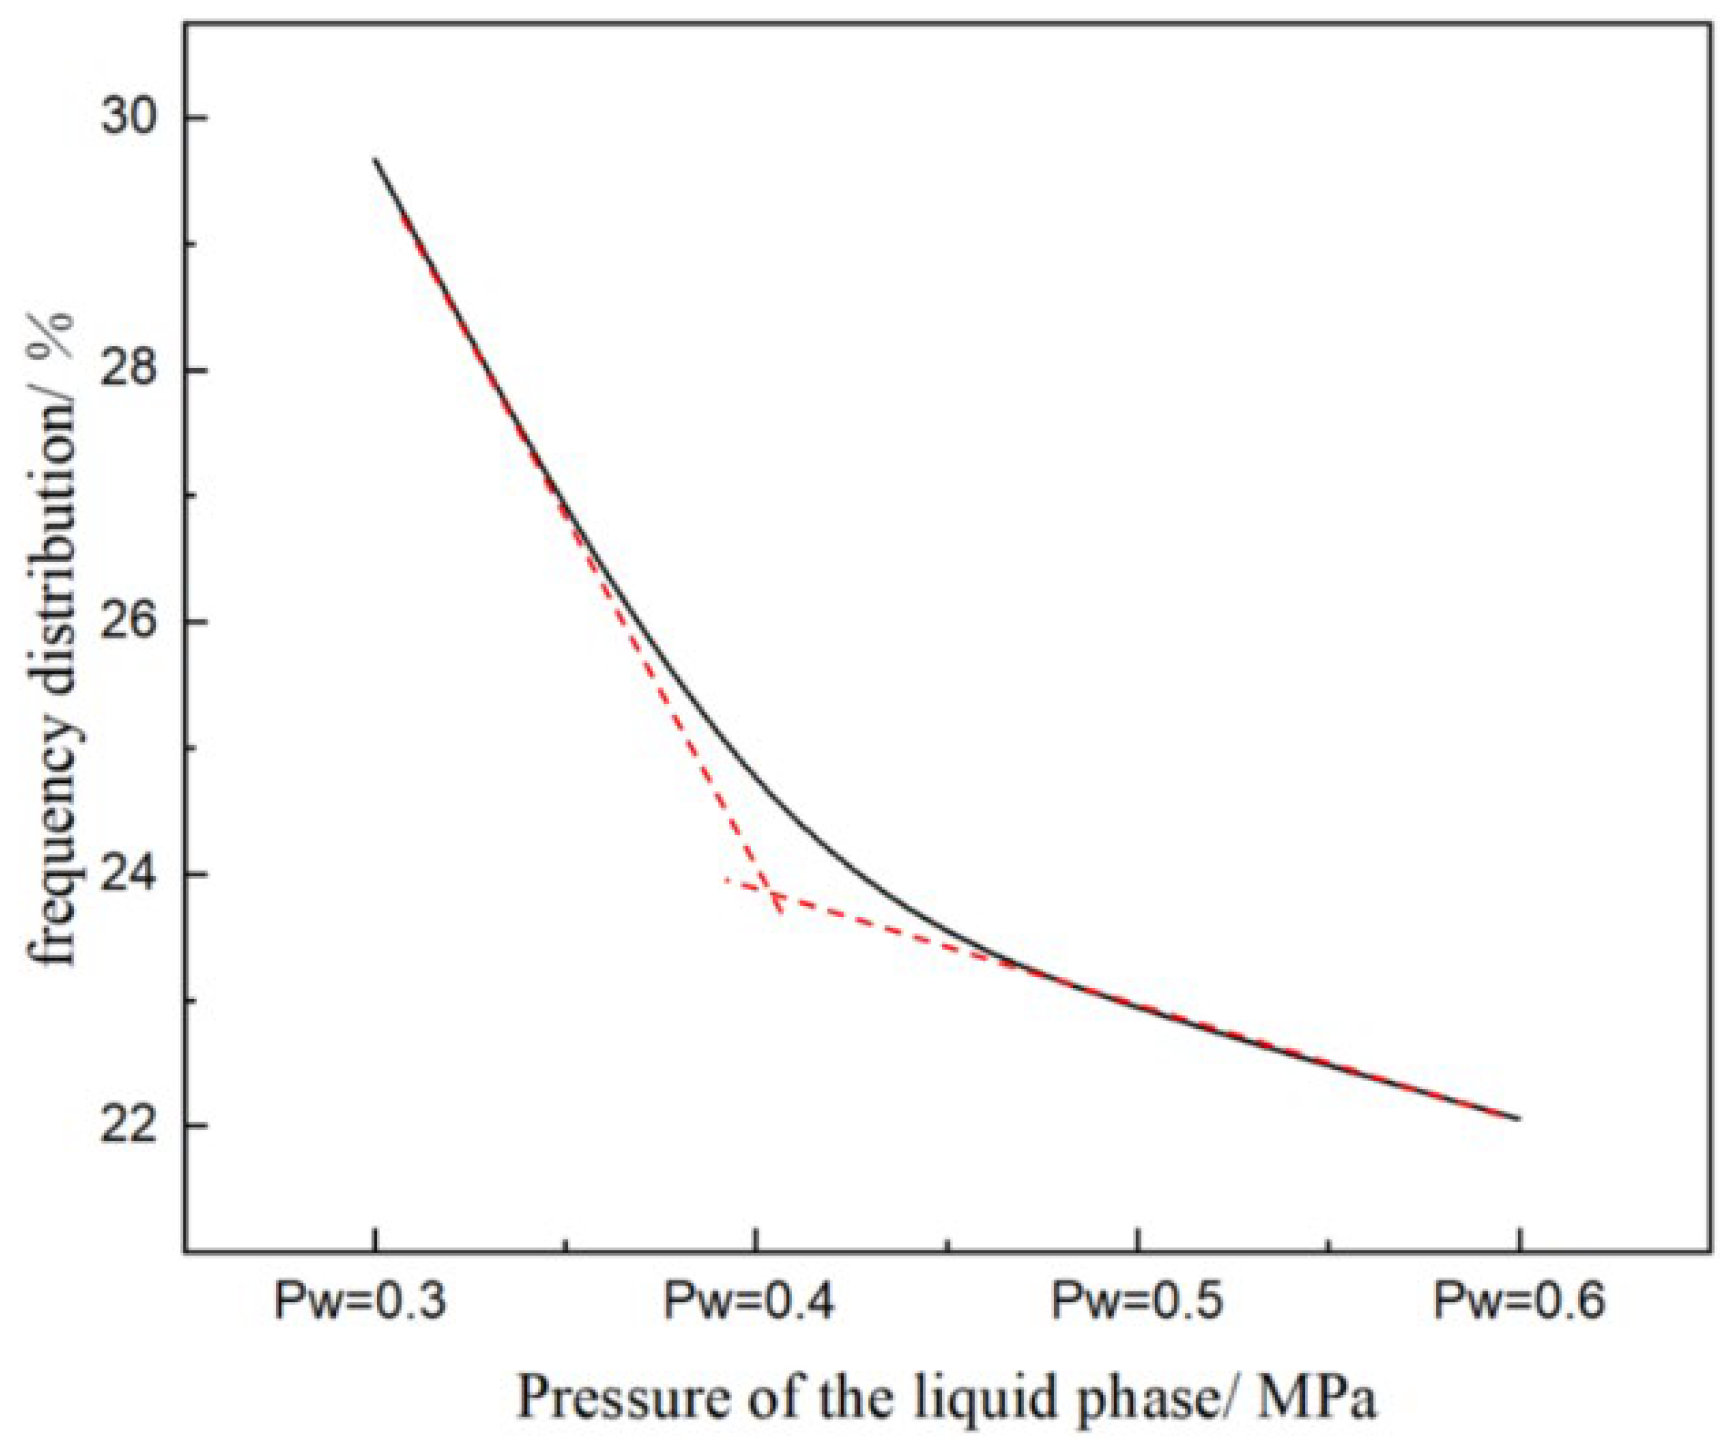
At a normally distributed particle size, the peak of about 65 microns, the D60–70 frequency distribution on the surface of the iron plate reached 29%, and the K value has little effect on the particle size distribution. As K increases, the frequency distribution of D60–70 decreases. When K = 1.5, the atomized particle size changes the least, the frequency distribution of D65 is approximately the same, and the atomization effect is the most stable.
(4)
When K is from 0.5 to 2, the flow field velocity changes continuously increase, the liquid film thickness decreases and becomes stable, and the distribution of D60–70 is almost unchanged and stable by 24.3%. Therefore, the pressure ratio has the greatest effect on the flow field velocity distribution, the second on the atomized particle size distribution, and the least effect on the liquid film thickness.
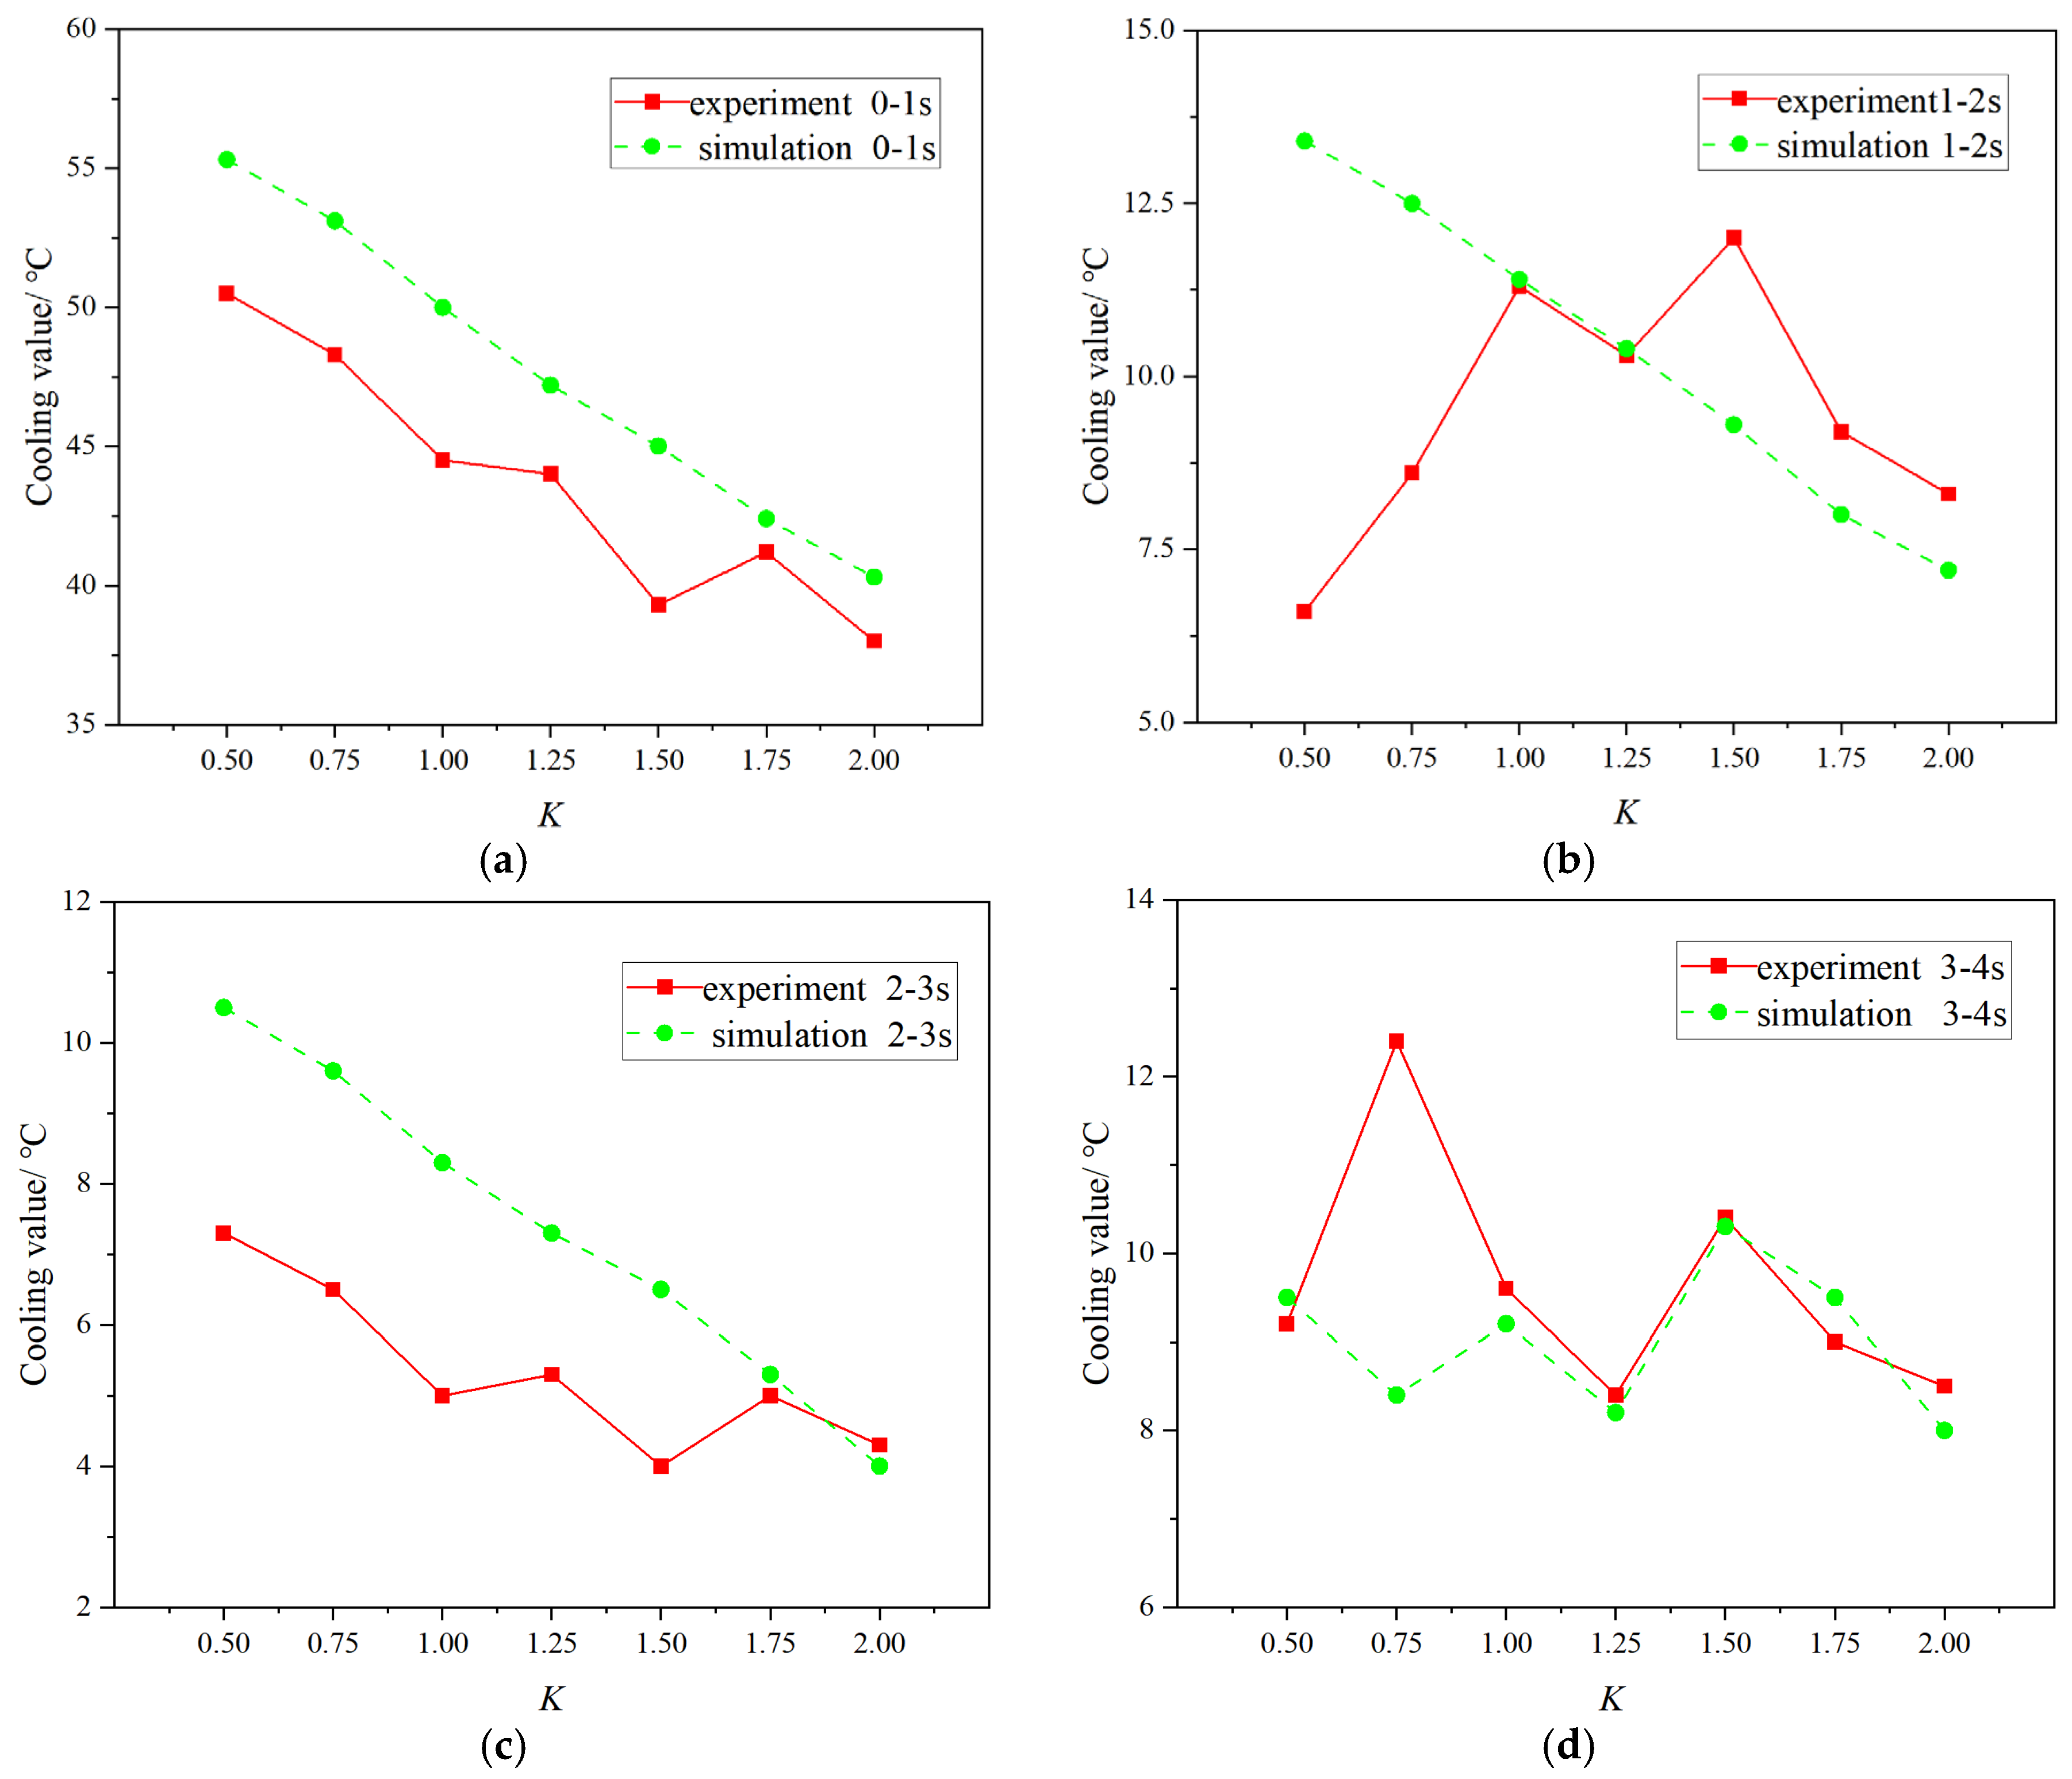
(5)
The analysis of the experimental data shows that the temperature of the iron plate drops the most when the time of spraying the release agent is 1 s, and the lower the K value is, the greater the cooling amount. After 2 s, the temperature change is less than 15 °C, and the change in K value has little effect on the temperature drop.
The atomization and dispersion characteristics of release agent obtained by using external mixing nozzle are helpful to improve the production efficiency in sheet metal stamping, injection mold, casting and other industries. The degree of influence of gas pressure and liquid pressure on the atomization effect of the external mixing nozzle is explained here, which is helpful to further study other related parameters of the external mixing nozzle.

Author Contributions

Conceptualization, Q.Z.; methodology, Z.L.; software, Z.L.; validation, L.H.; formal analysis, L.C.; investigation, S.C.; resources, D.W.; data curation, Z.L.; writing—original draft preparation, Z.L.; writing—review and editing, Z.L.; visualization, Q.Z.; supervision, Q.Z.; project administration, Y.X. All authors have read and agreed to the published version of the manuscript.

Funding

This research was supported by the Scientific Research Project of Anhui University, project approval number: 2022AH040044.

Data Availability Statement

The original contributions presented in this study are included in the article. Further inquiries can be directed to the corresponding author.

Acknowledgments

We would like to express our gratitude to the comprehensive performance test bench of Anhui Jianzhu University for its assistance in this research.

Conflicts of Interest

The authors declare no conflicts of interest.

References

  1. Dong, W.Q.; Yao, L.G.; Luo, W.L. Numerical Simulation of Flow Field of Submerged Angular Cavitation Nozzle. Appl. Sci. 2023, 13, 613. [Google Scholar] [CrossRef]
  2. Zhang, H.C.; Liu, Y.P.; Chen, Q. Analysis and Research on Oil Injection Lubrication of Variable Tooth Thickness Gear Based on CFD Method. Appl. Sci. 2025, 15, 297. [Google Scholar] [CrossRef]
  3. Vankeswaram, S.K.; Maly, M.; Jedelsky, J. Understanding the fuel spray characteristics in the near-nozzle region for a pressure swirl atomizer. J. Aerosol Sci. 2024, 178, 106350. [Google Scholar] [CrossRef]
  4. Chen, B.; Xu, J.H.; Li, Y.Y.; Lu, Y.J.; Zhong, Y.L.; Zhang, Z.Y.; Li, Y.B. Optimization of particle removal characteristics and efficiency of two-fluid nozzle based on CFD-DEM. Chin. High Technol. Lett. 2024, 34, 895–904. [Google Scholar]
  5. Wang, Z.; Han, M.; Zhu, Z.; Jiang, Y.; Jiang, L. Atomization mass transfer in two-phase nozzle flow employing numerical and experimental analyses for a solar energy storage system. J. Energy Storage 2022, 48, 104021. [Google Scholar] [CrossRef]
  6. Tong, L.Q.; Guo, Y.H.; Jia, X.; Lei, M.; Shi, D.M.; Zhang, T. Influence of various factors on the atomization and dust suppression characteristics of internal mixing pneumatic atomization nozzles. J. Saf. Environ. 2024, 24, 4724–4733. [Google Scholar]
  7. Yu, H.M.; Jin, Y.C.; Cheng, W.M.; Yang, X.Y.; Peng, X.L.; Xie, Y. Multiscale simulation of atomization process and droplet particles diffusion of pressure-swirl nozzle. Powder Technol. 2021, 379, 127–143. [Google Scholar] [CrossRef]
  8. Fang, Z.Y.; Qian, L.Y.; Zhu, C.L.; Qiao, W.T. Optimization of Flow Channel Structure in Air Atomization Nozzle Based on Response Surface Method. Chin. J. Hydrodyn. 2024, 39, 788–800. [Google Scholar]
  9. Zheng, Y.Y.; Li, W.P.; Shao, H.; Wang, X.; Cao, Y.R.; Cheng, X. Experimental and simulation study on the influencing factors of atomization of internal mixing air atomizing nozzles. Fluid Mach. 2024, 52, 39–47. [Google Scholar]
  10. Liu, H.Y.; Feng, S.K.; Li, B.K.; Tan, Y.H.; Yu, Y.S. Atomization performance of Y-jet nozzle based on VOF-DPM coupling method. Chem. Eng. 2024, 52, 78–83. [Google Scholar]
  11. Xue, S.S.; Han, J.L.; Xi, X.; Lan, Z.; Wen, R.F.; Ma, X.H. Coordination of distinctive pesticide adjuvants and atomization nozzles on droplet spectrum evolution for spatial drift reduction. Chin. J. Chem. Eng. 2024, 66, 250–262. [Google Scholar] [CrossRef]
  12. Liu, X.R.; Liu, T.; Guo, X.L.; Luo, X.G.; Dai, H.L. Numerical Simulation of the Flow Field Inside the Air Atomization Nozzle in the Normalized Cooling Section of Oriented Silicon Steel. Sci. Technol. Eng. 2024, 24, 12095–12104. [Google Scholar]
  13. Liu, T.; Chen, X.Y.; Zhang, J.; Feng, L.L.; Liu, X.W.; Hao, C. Structural optimization design of ice abrasive water jet nozzle based on multi-objective algorithm. Flow Meas. Instrum. 2024, 97, 102586. [Google Scholar] [CrossRef]
  14. Yang, X.; Long, X.; Yao, X. Numerical investigation on the mixing process in a steam ejector with different nozzle structures. Int. J. Therm. Sci. 2012, 56, 95–106. [Google Scholar] [CrossRef]
  15. Li, J.H.; Wang, P.F.; Sun, S.B.; Wang, X.Z. Design and Application of Outer Spray Device for Coal Mine Boring Machine. Miner. Eng. Res. 2024, 39, 72–78. [Google Scholar]
  16. Liu, L.; Li, G.Z.; Wang, S.J.; Cui, L.Y. Study on atomization performance of pipe catalytic cracking feedstock nozzles. Pet. Refin. Eng. 2024, 54, 33–36. [Google Scholar]
  17. Barbieri, M.R.; Achelis, L.; Fritsching, U. Effect of Y-jet nozzle geometry and operating conditions on spray characteristics and atomizer efficiency. Int. J. Multiph. Flow 2023, 168, 104585. [Google Scholar] [CrossRef]
  18. Cao, H.; Fan, Y.S.; Ma, C.Y.; Li, P.; Zhan, W.; Cao, Y.B.; Duan, F.Y. The simulation and analysis of the spraying status of large sprinkler machines loaded with atomizing micro-sprinklers. Alex. Eng. J. 2024, 106, 467–473. [Google Scholar] [CrossRef]
  19. Cardona, S.; Guiberti, T.F. Effects of boundary conditions on flash boiling ammonia sprays from a twin-fluid atomizer. Int. Commun. Heat Mass Transf. 2024, 159, 107978. [Google Scholar] [CrossRef]
  20. Fröde, F.; Desjardins, O.; Bieber, M.; Reddemann, M.; Kneer, R.; Pitsch, H. Multiscale simulation of spray and mixture formation for a coaxial atomizer. Int. J. Multiph. Flow 2025, 182, 104971. [Google Scholar] [CrossRef]
  21. Rostami, E.; Mahdavy, M.M. Distribution function and atomization parameters of petroleum fuels sprays: An experimental and numerical study. Results Eng. 2024, 21, 101692. [Google Scholar] [CrossRef]
  22. Canado, A.; Lemen, C.; Pages, M.; Violleau, F.; Dietrich, N.; Hébrard, G. Gas-liquid mass transfer characterization in a thin shrinking film at an atomization nozzle. Int. J. Heat Mass Transf. 2022, 189, 122672. [Google Scholar] [CrossRef]
  23. Zerwas, A.A.; Silva, F.C.; Guardani, R.; Achelis, L.; Fritsching, U. Impact of the gas atomizer nozzle configuration on metal powder production for additive manufacturing. Powder Technol. 2024, 443, 119974. [Google Scholar] [CrossRef]
  24. Li, W.J.; Zhou, W.; Wang, J.Y.; Zhang, K.; Zhu, B.Y. Effect of water flow on atomization performance of air atomizer based on numerical simulation. Min. Technol. 2024, 24, 259–264. [Google Scholar]
  25. Ibrahim, I.A.; Elzallat, A.M.; Elsakka, M.M.; Farag, T.M.; Gad, H.M. Effect of atomizing gas type on kerosene spray combustion using gas-blast atomizer: A comparative numerical study. Appl. Therm. Eng. 2024, 239, 121996. [Google Scholar] [CrossRef]
  26. Matsushita, Y.; Katayama, T.; Saito, Y.; Matsukawa, Y.; Okabe, T.; Shirota, M.; Inamura, T.; Daikoku, M.; Fukuno, J.; Aoki, H. A spray painting simulation using high-speed rotary Atomizer—Model development and comparison of LES and RANS—. Results Eng. 2024, 21, 101697. [Google Scholar] [CrossRef]
  27. Navarro, P.; Ruiz, J.; Martínez, P.; Lucas, M. Numerical study of an ultrasonic spray atomiser as an evaporative cooler. Appl. Therm. Eng. 2024, 236, 121455. [Google Scholar] [CrossRef]
  28. Rajendram Soundararajan, P.; Durox, D.; Renaud, A.; Candel, S. Impact of spray dynamics on combustion instabilities investigated by changing the atomizer recess in a swirl combustor. Combust. Flame 2023, 252, 112757. [Google Scholar] [CrossRef]
  29. Shadrin, E.Y.; Anufriev, I.S.; Butakov, E.B.; Kopyev, E.P.; Alekseenko, S.V.; Maltsev, L.I.; Sharypov, O.V. Coal-water slurry atomization in a new pneumatic nozzle and combustion in a low-power industrial burner. Fuel 2021, 303, 121182. [Google Scholar] [CrossRef]
  30. Xie, Z.; Zhao, Z.; Li, D.; Li, F.; Zhang, C.J.; Huang, C.; Xiao, Y.M. Experimental study on the atomization characteristics and dust removal efficiency of a fan-shaped nozzle for purifying working environment. Sci. Total Environ. 2023, 894, 164994. [Google Scholar] [CrossRef]
  31. Urionabarrenetxea, E.; Martín, J.M.; Avello, A.; Rivas, A. Simulation and validation of the gas flow in close-coupled gas atomisation process: Influence of the inlet gas pressure and the throat width of the supersonic gas nozzle. Powder Technol. 2022, 407, 117688. [Google Scholar] [CrossRef]
Figure 1. Three-dimensional model of the sprinkler head.
Processes 13 01224 g001
Figure 2. Cross-sectional view of the nozzle.
Processes 13 01224 g002
Figure 3. Flow field atomization layout diagram.
Processes 13 01224 g003
Figure 4. Calculation flow field diagram.
Processes 13 01224 g004
Figure 5. Flow field grid division diagram.
Processes 13 01224 g005
Figure 6. Verification of grid independence.
Processes 13 01224 g006
Figure 7. Velocity diagram of different liquid phase pressures with distance: (a) P w = 0.3 MPa; (b) P w = 0.4 MPa; (c) P w = 0.5 MPa; (d) P w = 0.6 MPa.
Processes 13 01224 g007
Figure 8. Velocity variation with K value at different distances: (a) 150 mm from the nozzle; (b) 250 mm from the nozzle; (c) 350 mm from the nozzle; (d) 450 mm from the nozzle; (e) 550 mm from the nozzle; (f) 618.5 mm from the nozzle.
Processes 13 01224 g008
Figure 9. Diagram of liquid film thickness variation with liquid phase pressure.
Processes 13 01224 g009
Figure 10. Cloud image of liquid film thickness over time: (a) P w = 0.4 MPa; (b) P w = 0.5 MPa; (c) P w = 0.6 MPa.
Processes 13 01224 g010
Figure 11. The average thickness increment varies with K value.
Processes 13 01224 g011
Figure 12. Spatial distribution of atomized particles.
Processes 13 01224 g012
Figure 13. D60–70 frequency layout at different distances.
Processes 13 01224 g013
Figure 14. Spray sputtering diagram.
Processes 13 01224 g014
Figure 15. Frequency distribution of particle size with different K values: (a) K = 0.5; (b) K = 1; (c) K = 1.5; (d) K = 2.
Processes 13 01224 g015
Figure 16. D60–70 frequency layout of different liquid phase pressures.
Processes 13 01224 g016
Figure 17. Cloud image of particle size distribution at different liquid phase pressures: (a) P w = 0.3 MPa; (b) P w = 0.4 MPa; (c) P w = 0.5 MPa; (d) P w = 0.6 MPa.
Processes 13 01224 g017
Figure 18. Temperature changes at different spraying times: (a) 0–1 s; (b) P w = 1–2 s; (c) 2–3 s; (d) 3–4 s.
Processes 13 01224 g018
Figure 19. Iron plate temperature change measurement diagram.
Processes 13 01224 g019
Figure 20. The variation of cooling amount with the K value under different atomization times: (a) 0–1 s; (b) 1–2 s; (c) 2–3 s; (d) 3–4 s.
Processes 13 01224 g020
Table 1. Pressure ratio and liquid phase pressure.
Pressure RatioLiquid Phase Pressure (MPa)
0.50.3
0.750.4
10.5
1.250.6
1.5
1.75
2
Table 2. Physical parameters of water-based release agent.
ParametersRemarks
IngredientMethyl silicone oil
CharacterMilky white viscous liquid
Density0.96–1.04 g/mL
Specific heat capacity4.18 ± 0.2 J/(g·°C)
PH value6–8
Solid content30 ± 2%
Table 3. Experimental correlation variables.
ParametersRemarks
Indoor temperature27 °C
Humidity30%
Voltage380 v
Hydraulic pressure0.4 MPa
Air pressure0.6 MPa
Diaphragm pump rated power7.5 kw
Diaphragm pump rated flow rate10 m3/h
Flowmeter measuring range0.1–200 L/min
Disclaimer/Publisher’s Note: The statements, opinions and data contained in all publications are solely those of the individual author(s) and contributor(s) and not of MDPI and/or the editor(s). MDPI and/or the editor(s) disclaim responsibility for any injury to people or property resulting from any ideas, methods, instructions or products referred to in the content.

