Article

Techno-Economic Analysis of Sustainable Hydrogen Production from Offshore Wind Farms: Two Italian Study Cases

1
Ricerca sul Sistema Energetico-RSE S.p.A., 20134 Milan, Italy
2
Department of Industrial Engineering, University of Florence, 50139 Florence, Italy
*
Author to whom correspondence should be addressed.
Processes 2025, 13(4), 1219; https://doi.org/10.3390/pr13041219
Submission received: 7 January 2025 / Revised: 3 April 2025 / Accepted: 15 April 2025 / Published: 17 April 2025
(This article belongs to the Special Issue Sustainable Hydrogen Production Processes)

Abstract

:
Renewable energy production is one of the pillars of the decarbonization process for the electricity system. The use of hydrogen can also contribute to the decarbonisation of industrial sectors such as chemicals, steel production, heavy industry, and long-distance transports. In Italy, a significant growth in wind and photovoltaic production is already foreseen by 2030. After that date, a wide deployment of offshore wind is expected with a significant decrease in cost. In a medium-long term scenario, with the massive expansion of renewable energy systems and the growing demand for hydrogen across multiple sectors, it is conceivable that some large-scale offshore wind farms (OWFs) could be exclusively dedicated to on-site green hydrogen production, thereby mitigating the impact on the electrical grid and simultaneously increasing hydrogen availability. This study reports the methods, assumptions, and results of a technical–economic analysis carried out for green hydrogen production from dedicated OWFs in two Italian offshore sites, one in Sicily and one in the Adriatic Sea. Despite the high uncertainty associated with carrying out this type of assessment for emerging technologies, the levelized costs obtained for dedicated offshore wind energy (approximately 70–80 EUR/MWh) and green hydrogen (approximately 5–6 EUR/kg) are in line with corresponding sector studies. Moreover, the simplified methodological approach developed is useful to analyse and compare other marine areas and different system configurations.

1. Introduction

The increase in production from renewable energy sources (RES) is one of the pillars of the decarbonisation of the electricity system [1] and of the security of energy supply [2]. It is supported by many countries through political initiatives that include the definition of RES production targets for future years and decades [3]. The technologies for which greater development is expected are wind turbines and photovoltaic modules, in the long-term ocean energy converters could also contribute. All these technologies are characterised by non-programmable production. Traditional storage systems based on batteries could not satisfy all the offshore wind storage challenges and therefore, hydrogen production could be seen as another way to store renewable energy [4]. Hydrogen is well-suited for storing energy over extended periods, such as seasonal variations in wind availability [5]. While batteries are efficient for short-term storage, their performance and cost-effectiveness diminish over longer durations [6]. Hydrogen can be produced during periods of high wind generation and stored for use during low-wind periods, ensuring a continuous energy supply [7].
In recent years, the use of RES has been considered to produce other energy carriers, such as hydrogen and ammonia, a process known as power-to-gas. Hydrogen produced by electrolysers fed by RES electricity is generally known as “green” hydrogen [8]. Hydrogen itself can contribute to the decarbonisation of industrial sectors such as chemicals, steel production, heavy industry, but also long-distance transport [9]. As a result, hydrogen demand—estimated at 339 TWh in Europe in 2019—is expected to increase drastically by 2050 reaching 2300 TWh according to the European Hydrogen Backbone initiative [10,11], or even a quantity higher depending on the scenario followed [12].
Italy fits into this international context with an important regulatory and strategic system. Focusing specifically on RES, the revision of the National Integrated Energy and Climate Plan [13], submitted to the European Commission in 2023, indicates ambitious renewable production targets for 2030, including 100 TWh of annual production from solar energy and approximately 65 TWh per year from wind energy, part of which from offshore wind farms (OWFs). As regards hydrogen, the National Hydrogen Strategy [14] was published in November 2024, which aims to promote the use of hydrogen as an integral part of Italy’s energy transition. Italy aims, among other things, to strengthen its green hydrogen production capacity. Due to favourable climatic conditions for deploying renewable energy sources (RES) such as solar and wind, the southern regions of the country have significant potential to attract investments aimed at establishing production facilities and integrating green hydrogen into industries, transportation, and power generation. The main quantitative targets for 2030 of the National Hydrogen Strategy relating to green hydrogen are the following: produce 2 million tons of green hydrogen and install at least 5 GW of electrolysis capacity to produce green hydrogen.
Among the RES that could fuel the production of green hydrogen, wind power stands out as a particularly promising candidate, especially given its anticipated substantial growth, notably through large-scale offshore installations [15].
Offshore wind installations involve the use of fixed foundations, typically of the monopile type up to 30 m of sea depth and jackets up to 60 m. For greater water depths, which characterise most Italian marine areas suitable for hosting OWFs, floating platforms are used [16]. They are already known in the oil and gas sector, but not yet completely mature in the wind energy sector. Demonstrative arrays of significant sizes are installed [17,18], and many floating wind projects are in the pipeline in many countries. For example, in Italy, as of November 2024, there are requests for connection to the grid of several dozen OWFs [19], and a couple of projects have already concluded the complete authorisation process.
Offshore wind offers a promising pathway for large-scale green hydrogen production, harnessing abundant and consistent wind resources while minimising land use conflicts [20]. As reported in many literature studies, the coupling of OWFs and hydrogen production can occur in several configurations [20,21], each with its own set of opportunities and challenges. The literature primarily distinguishes these configurations based on the placement of the electrolysers dedicated to hydrogen production—specifically, whether they are installed onshore or offshore.
In the centralised onshore configuration, the typical OWF infrastructure transmits electricity to shore via subsea export cables. Once the power reaches an onshore centralised facility equipped with electrolysers, hydrogen is produced. This solution allows the operator to manage both energy vectors effectively, even enabling the purchase of electricity from the grid to produce hydrogen during periods of very low electricity prices, providing additional load flexibility for the grid operator [7]. Other advantages offered by this solution pertain to a simplified maintenance of the electrolyser system and the proximity to existing infrastructure.
Regarding offshore configurations, according to the literature, offshore solutions represent an emerging, yet nascent, approach [20,22,23,24] and can be further divided into two cases: centralised offshore and decentralised offshore.
In the first case, the intra-array electrical infrastructure of the OWF remains unchanged, and the energy is transmitted through intra-array cables to an offshore platform. This platform hosts the entire hydrogen production system—including the desalination and water treatment plant, electrolysers, and even living quarters for maintenance personnel [20]. Hydrogen is then transported to shore via pipelines, eliminating the need for export submarine cables and reducing transport losses and costs for the same amount of energy transmitted [7,20,25]. Despite in this configuration, as highlighted in several studies [23,25,26,27], exporting both electricity and hydrogen is not economically viable, making hydrogen the sole output of the system.
In the second case, each wind turbine is coupled with its own electrolyser system, enabling hydrogen production directly at the turbine. This configuration enhances system redundancy and reduces electricity transmission losses, though it also introduces challenges related to maintenance, space constraints, and dynamic stability.
A medium–long term time horizon is expected for the construction of these offshore plants, when the costs of offshore wind energy and hydrogen production technologies will decrease depending on their widespread diffusion.
The production of green hydrogen from offshore wind relies on several crucial technologies that present both potential and challenges. The electrolysers, as reported in [7] are “Devices that receive Direct Current (DC) electricity and demineralized water and separates the hydrogen and oxygen atoms from the water molecule through a chemical reaction, generating high purity oxygen and hydrogen”. The choice of electrolyser technology plays a significant role in determining the system’s efficiency, cost, and operational characteristics. For instance, the alkaline electrolyser (AEL) is a mature technology known for its lower cost (employ low-cost earth metals [20,28]), large-scale application [20], and long lifetime, but suffers from slower response times and limited dynamic flexibility [7,20,23,28]. In contrast, the proton exchange membrane electrolyser (PEMEL) is expected to outperform AEL in terms of efficiency and cost, facilitating the development of large-scale plants and transport infrastructure [9].
Those offer faster start-up and dynamic response times [13,23,26,28], broad operational ranges [13,28], higher performance at partial load [13,29], higher current densities [7,20,23,28,29], and higher hydrogen purity [20]; however, they come with greater costs (presence of expensive and rare-earth materials [23,26,28]) and durability limitations [23], as well as higher output pressure of the hydrogen [7,20].
PEMELs have a lower total cost of ownership, with service costs estimated to be one-third of those of AELs [30]. Furthermore, as highlighted by the U.S. Department of Energy, PEMELs are expected to offer significant cost advantages in balance-of-plant economics when scaled, making them a promising solution for the future of hydrogen production [30]. In fact, according to their cost projections, the price of hydrogen is expected to decrease to 2 USD/kg by 2026 and to 1 USD/kg by 2031, with an ultimate target of 50 USD/kW for the capital cost of PEMEL stacks [30]. Furthermore, as highlighted by Niblett et al. in [28], the overall cost of hydrogen production is strongly influenced by capital costs—primarily driven by electrolyser materials and fabrication—along with operational expenditures (OPEX) and overall system efficiency, which depend on the integration and dynamics of renewable power sources and the electrolyser response time. As previously mentioned, PEMELs exhibit a faster response time compared to AELs [26,28], allowing their production rate to be adjusted across the full load range [31]. This enables rapid adaptation to fluctuations in electrical input, such as those experienced in offshore wind applications [26], and operation beyond nominal power levels [7,26,31]. As noted by Niblett et al. [28], efficiency remains a critical area of research for both technologies and is influenced by several key overpotentials (activation, ohmic, and concentration), which vary as current increases in an electrolyser with a fixed electrode area. Notably, electrolyser efficiency is not constant under varying loads, similar to wind energy systems. In fact, increasing the current density decreases the capital cost contribution per mass of hydrogen produced (due to increased reactor throughput) but simultaneously reduces efficiency, leading to higher OPEX [28]. Therefore, an optimal balance must be found between energy efficiency and current density, depending on material and energy costs. Moreover, Niblett et al. [28] indicate that PEMELs can generally achieve higher current densities at the same efficiency level as AELs. Alternatively, they can operate with greater efficiency at lower current densities, achieving efficiencies in the range of 80–90% at 1–2 A/cm2, compared to the lower operational current density of AELs (0.5–0.7 A/cm2) [26].
Since both AEL and PEMEL need processed water to operate, one other crucial element for offshore hydrogen production is the seawater desalination process [25,32]. Reverse osmosis (RO) is commonly employed [20], offering a cost-effective solution [23], but pre-treatment and filtration processes are necessary to address biofouling and blockages of equipment [25]. Emerging technologies like capacitive deionisation and forward osmosis are also being explored [25].
Another cornerstone point of offshore green hydrogen system is the storage and transportation system. In [32] Castillo et al. report the main challenges and opportunities of storage and transportation systems considering the delivery of hydrogen either as compressed gas or liquid or in the form of another fuel, such as ammonia. In transportation via pipelines, the hydrogen embrittlement represents the most challenging issue that requires a specific selection of materials used in pipeline transport of large quantities of hydrogen [26].
From the economic point of view, the levelised cost of hydrogen (LCOH) is a key metric for evaluating the economic feasibility of offshore wind-to-hydrogen systems. LCOH is influenced by various factors, including wind resource availability and capacity factor, capital costs of wind farm, electrolysers, and infrastructure, operating, and maintenance expenses. The profitability (i.e., the net present value) of the systems is influenced by the electricity price, financial incentives, and policies. Scolaro and Kittner [33] emphasise that offshore wind-based hydrogen must participate in ancillary service markets to generate positive revenues at current levels of wind generation, and that by 2030 can achieve cost competitiveness in Germany.
In the frame of a national project on renewables funded by the Ministry of Environment and Energy Security through the Ricerca di Sistema Programme, the authors have already investigated from a technical and economic point of view the possibility of coupling an offshore wind farm with an onshore energy production facility to mitigate potential wind overgeneration and contribute to produce green hydrogen [34].
The LCOH has been calculated for different offshore sites around the Italian peninsula varying key parameters—including electrolyser size, CAPEX, financial factors, and resource availability. The study found that the LCOH for this green hydrogen production solution spans a particularly wide range, from 0.4 to 8.8 EUR/kg of H2.
The authors have also investigated the other two configurations, offshore centralised and offshore decentralised, including the transportation of hydrogen to the shore through pipelines.
The aim of this study is to evaluate the green LCOH produced in two Italian offshore sites and to understand its dependence on several technical and financial parameters. For the offshore centralised configuration, the authors decided to evaluate also the possibility of storing hydrogen offshore. This approach refers to a term scenario longer than the pipeline ones, considering the transportation of the hydrogen to shore by ships or the offshore system directly used as a refuelling station for a ship hydrogen fuelled. Due to the lower technological maturity and to the higher uncertainty on the costs of this approach with respect to the pipeline ones, the costs of transport by ship have not been evaluated in the present study. Even if the calculated LCOH for the configuration with the storage is not directly comparable to the ones with pipelines, the assessment of the CAPEX and performance of the system can be useful for example for incoming studies about the transportation of both the energy vectors through superconducting cable cooled by liquid hydrogen [35,36].
In this paper the methodology and the results of the technical-economic analysis carried out for offshore green hydrogen production in above mentioned configurations are reported for two study cases in Italy. The first case study corresponds to an offshore site in the Sicily region, characterised by higher average wind speeds and medium bathymetry, and the second one to an offshore site in the Emilia-Romagna region, featuring lower wind speeds and the possibility of installing bottom-fixed wind farms. The methods and materials are described in Section 2, the results and their discussion are reported in Section 3, and the conclusions in Section 4.

2. Configurations, Materials and Methods

2.1. System Configurations

To produce offshore hydrogen from dedicated OWFs, the following three plant configurations have been considered according to the position of the hydrogen facilities with respect to the wind farm components and to the way of delivering hydrogen:
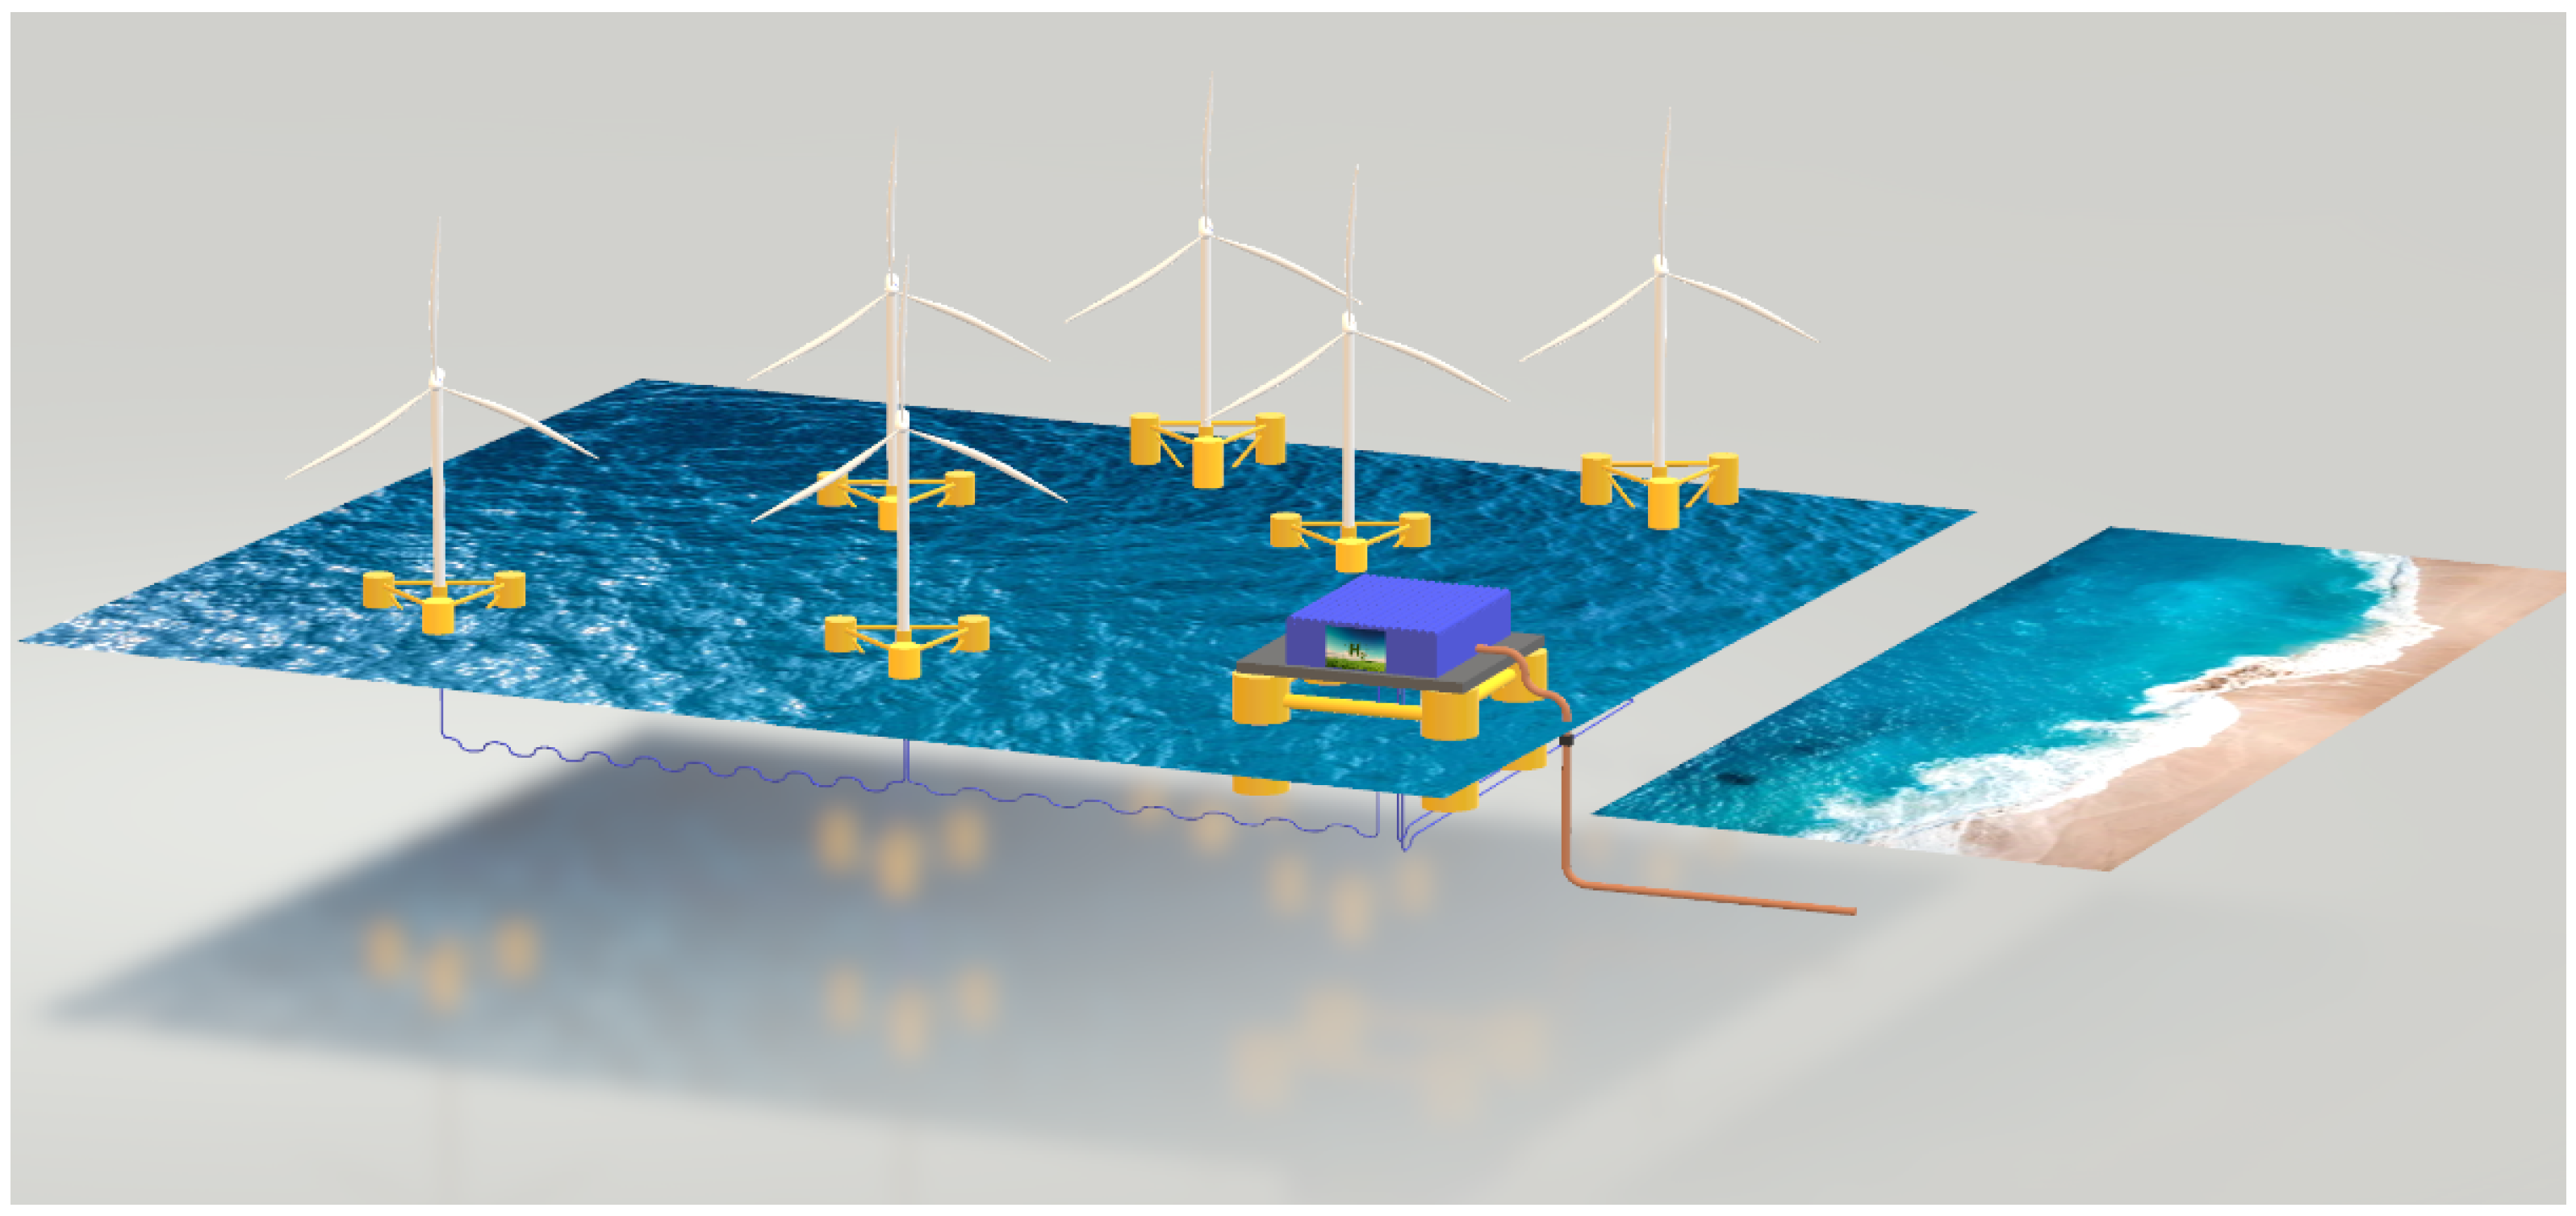
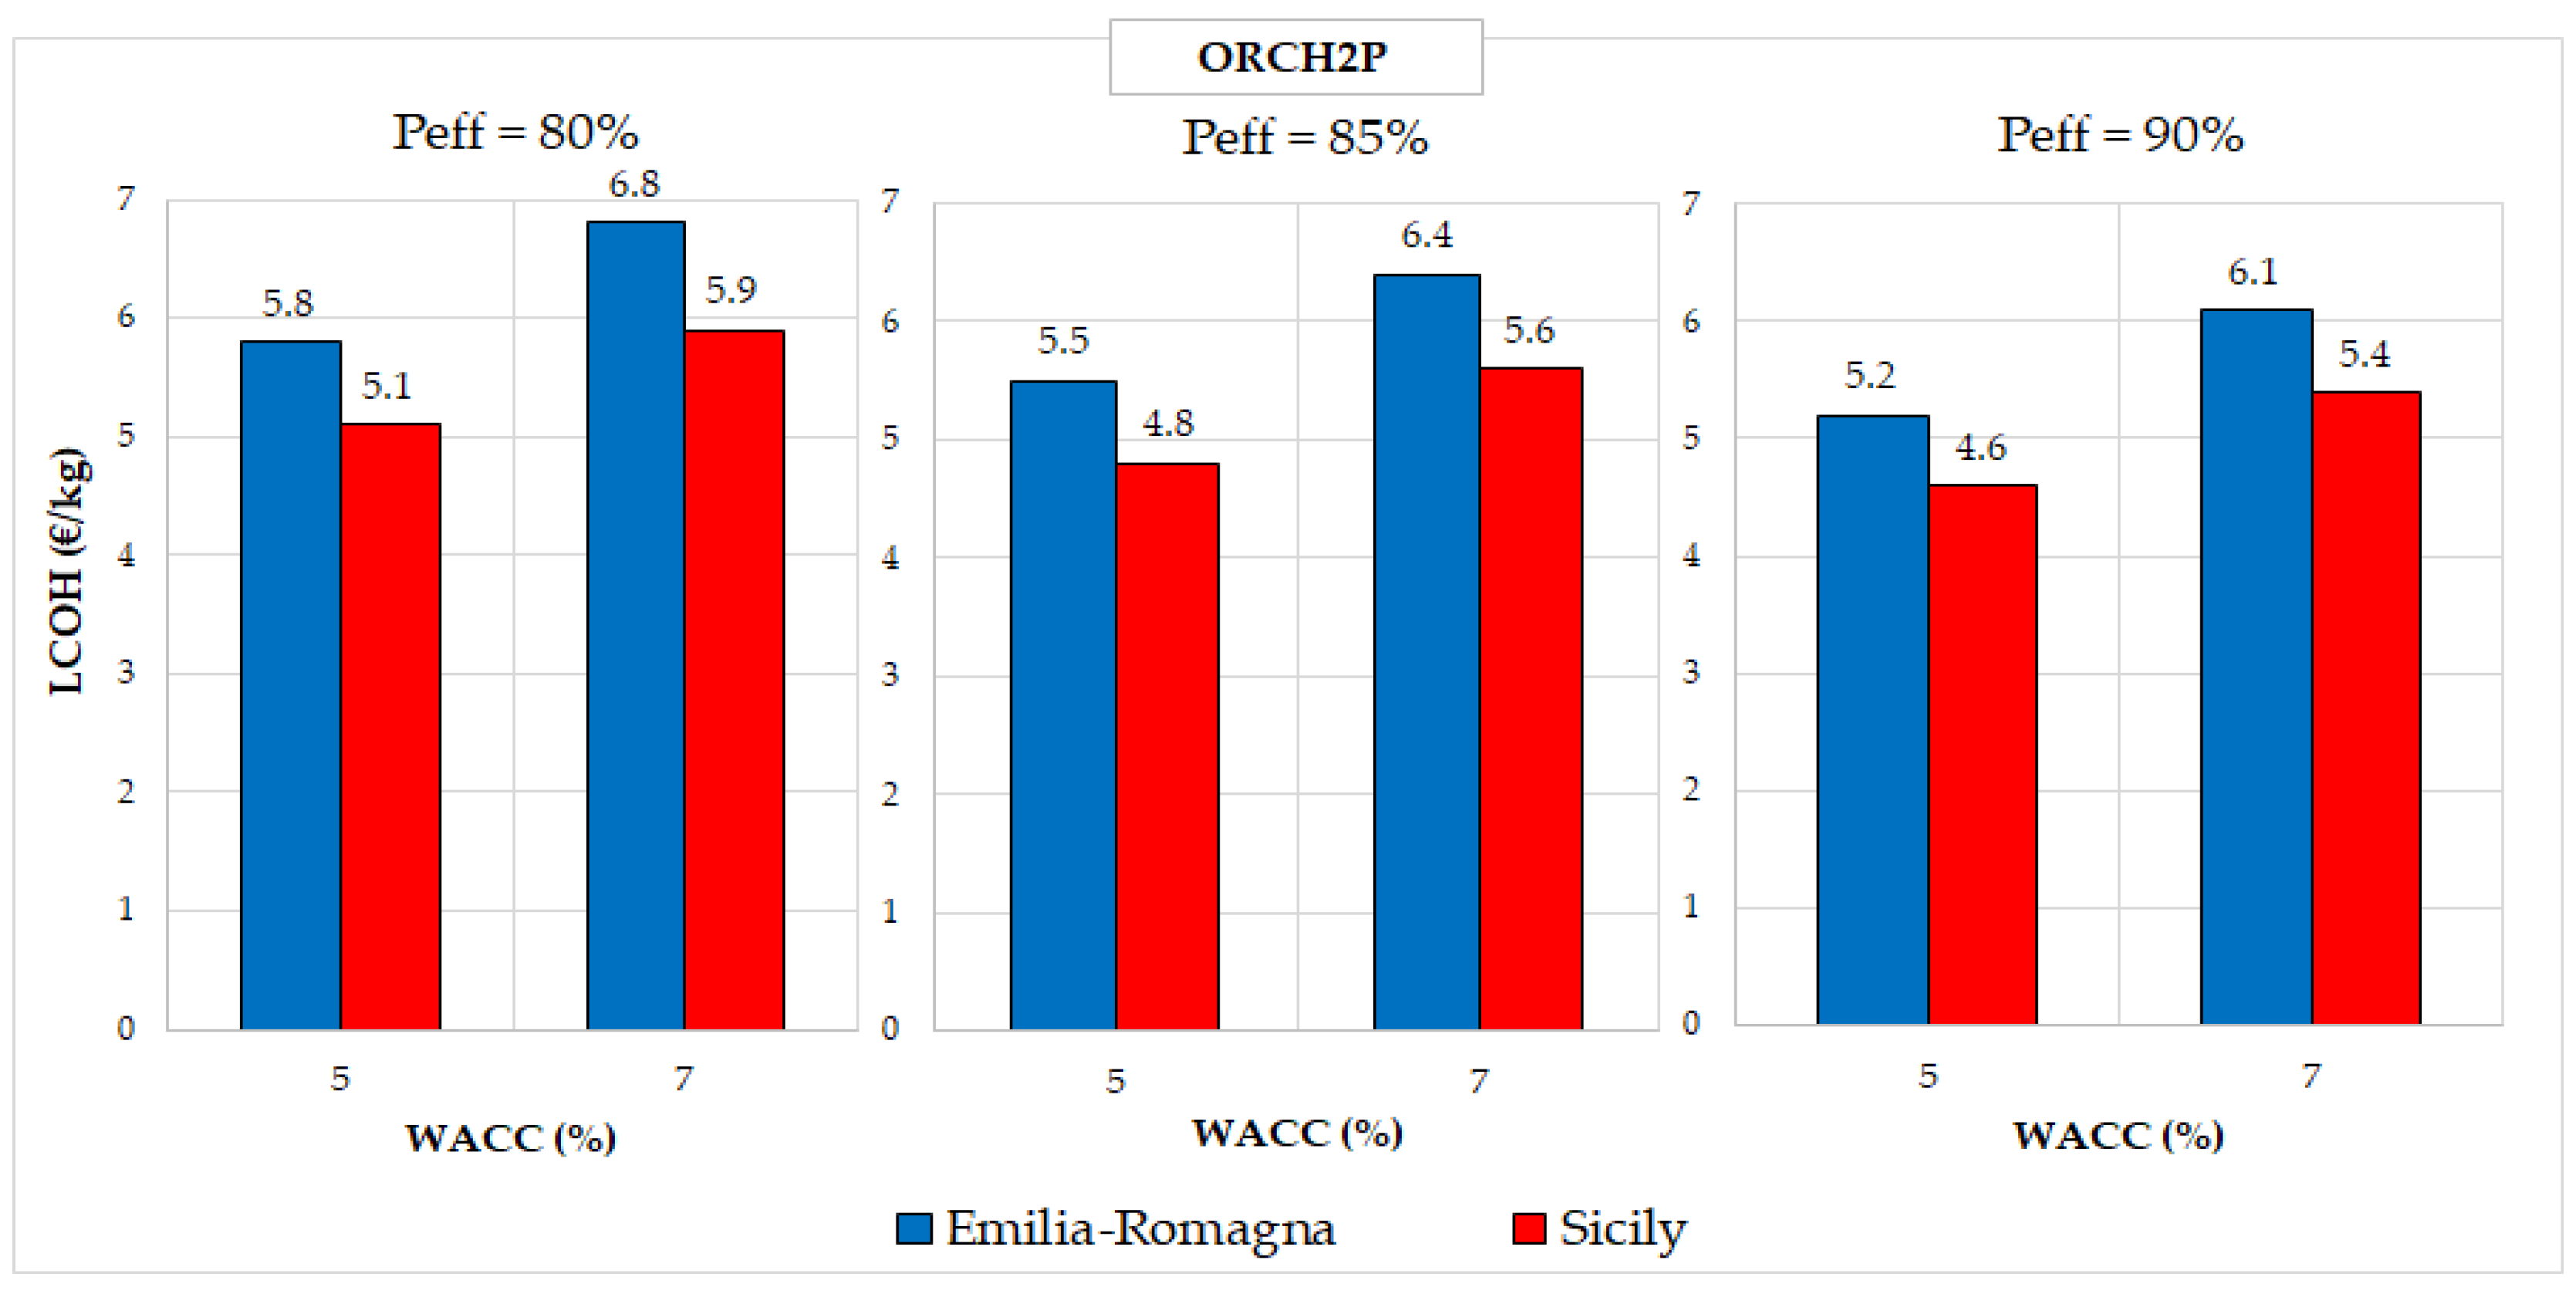
  • The hydrogen production system is centralised on an offshore platform (offshore substation) close to the wind farm. Hydrogen is sent to the land through a pipeline [26]. The acronym identifying this configuration is ORCH2P (offshore renewable centralised hydrogen production with pipeline). A simplified schematic of this configuration is presented in Figure 1. In blue, the intra-array cables are shown, connecting multiple turbines in strings. In brown, the export pipeline is depicted, transporting the hydrogen produced in the electrolyser located on the central offshore platform (represented by the blue parallelepiped).
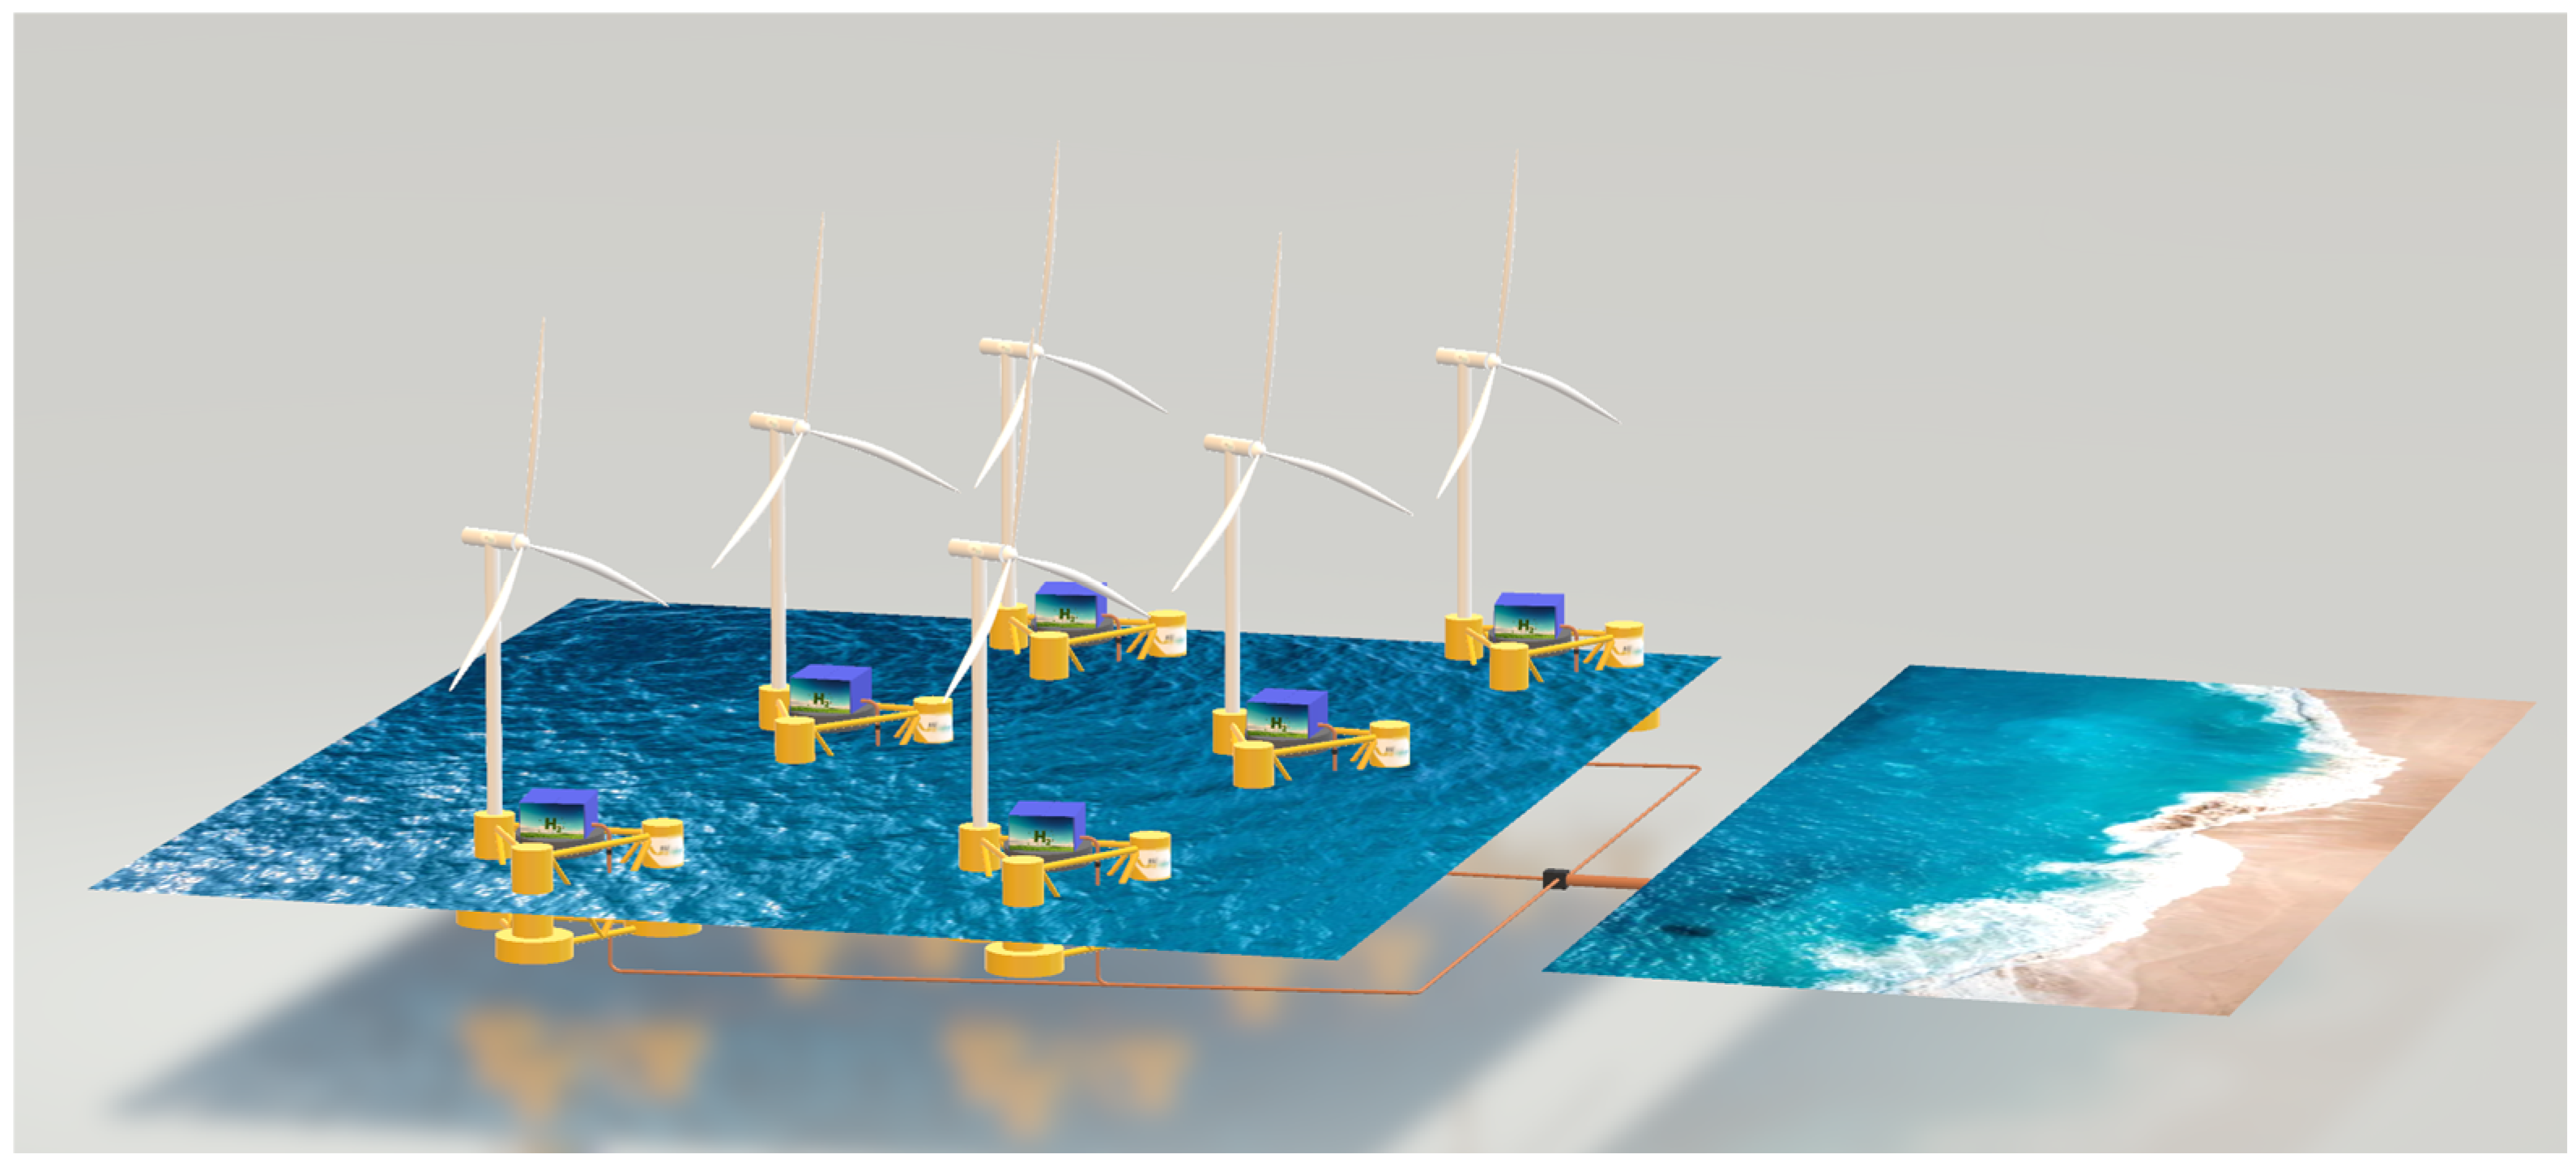
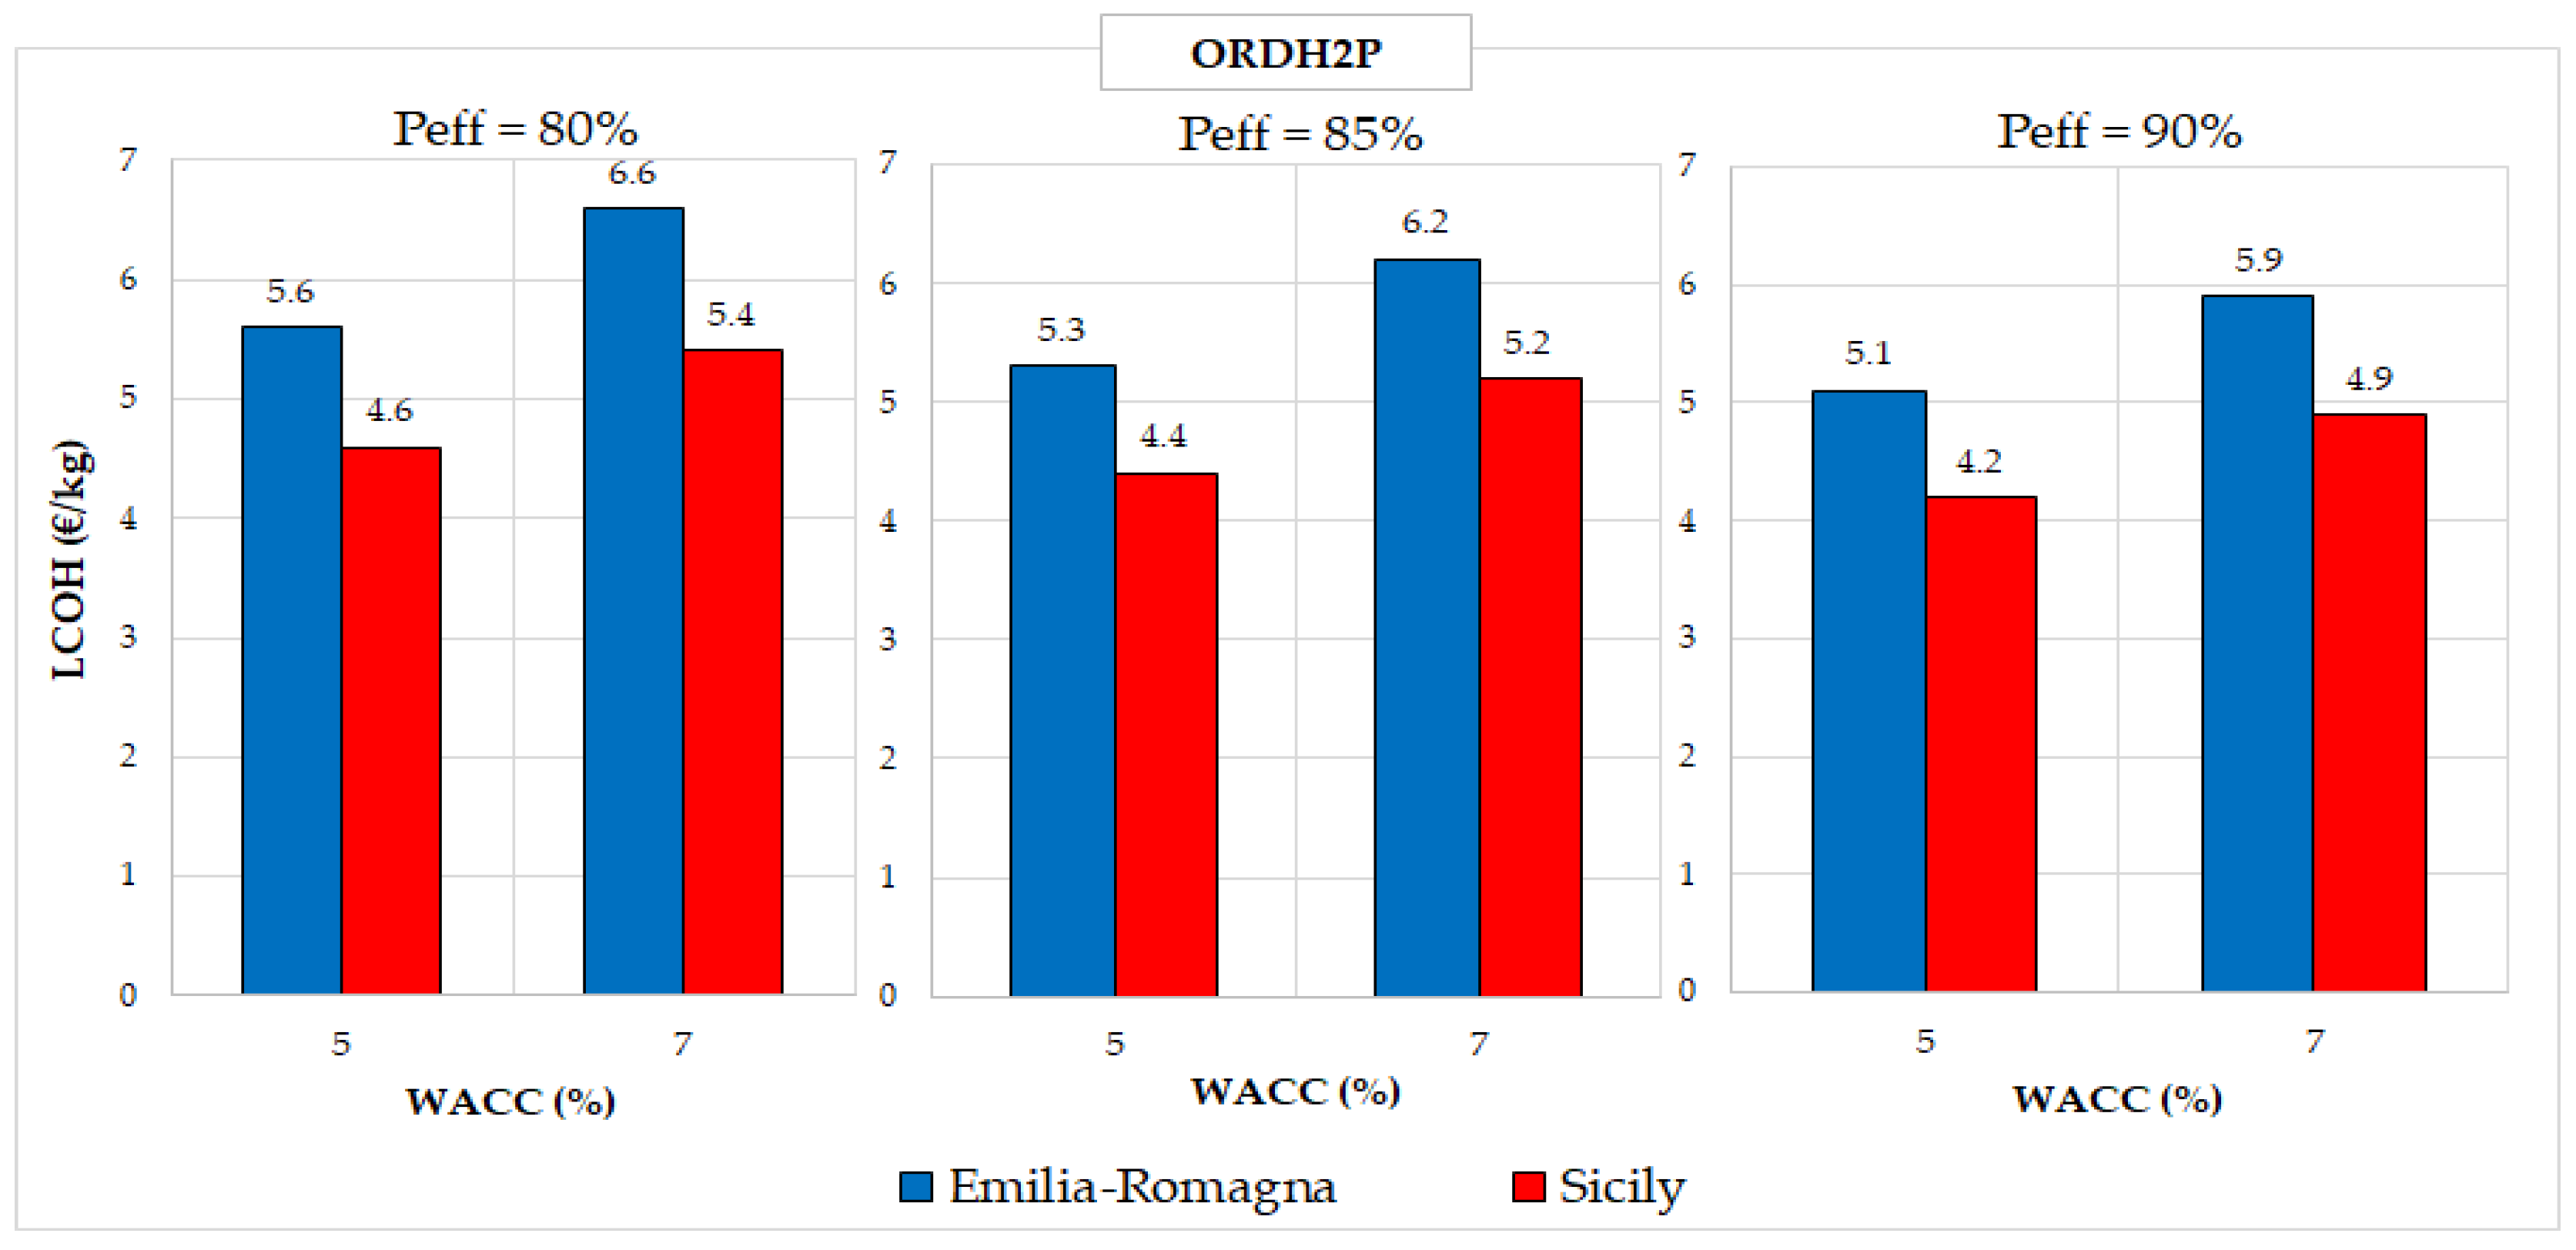
  • The hydrogen production system is decentralized and is directly installed on the turbine platforms/foundations. Hydrogen is transported from the turbines to a central collection point via small pipelines (shown in brown) and then delivered to shore through a larger “export” pipeline [37]. This configuration is identified by the acronym ORDH2P (offshore renewable decentralized hydrogen production with pipeline). A simplified schematic of this setup is presented in Figure 2.
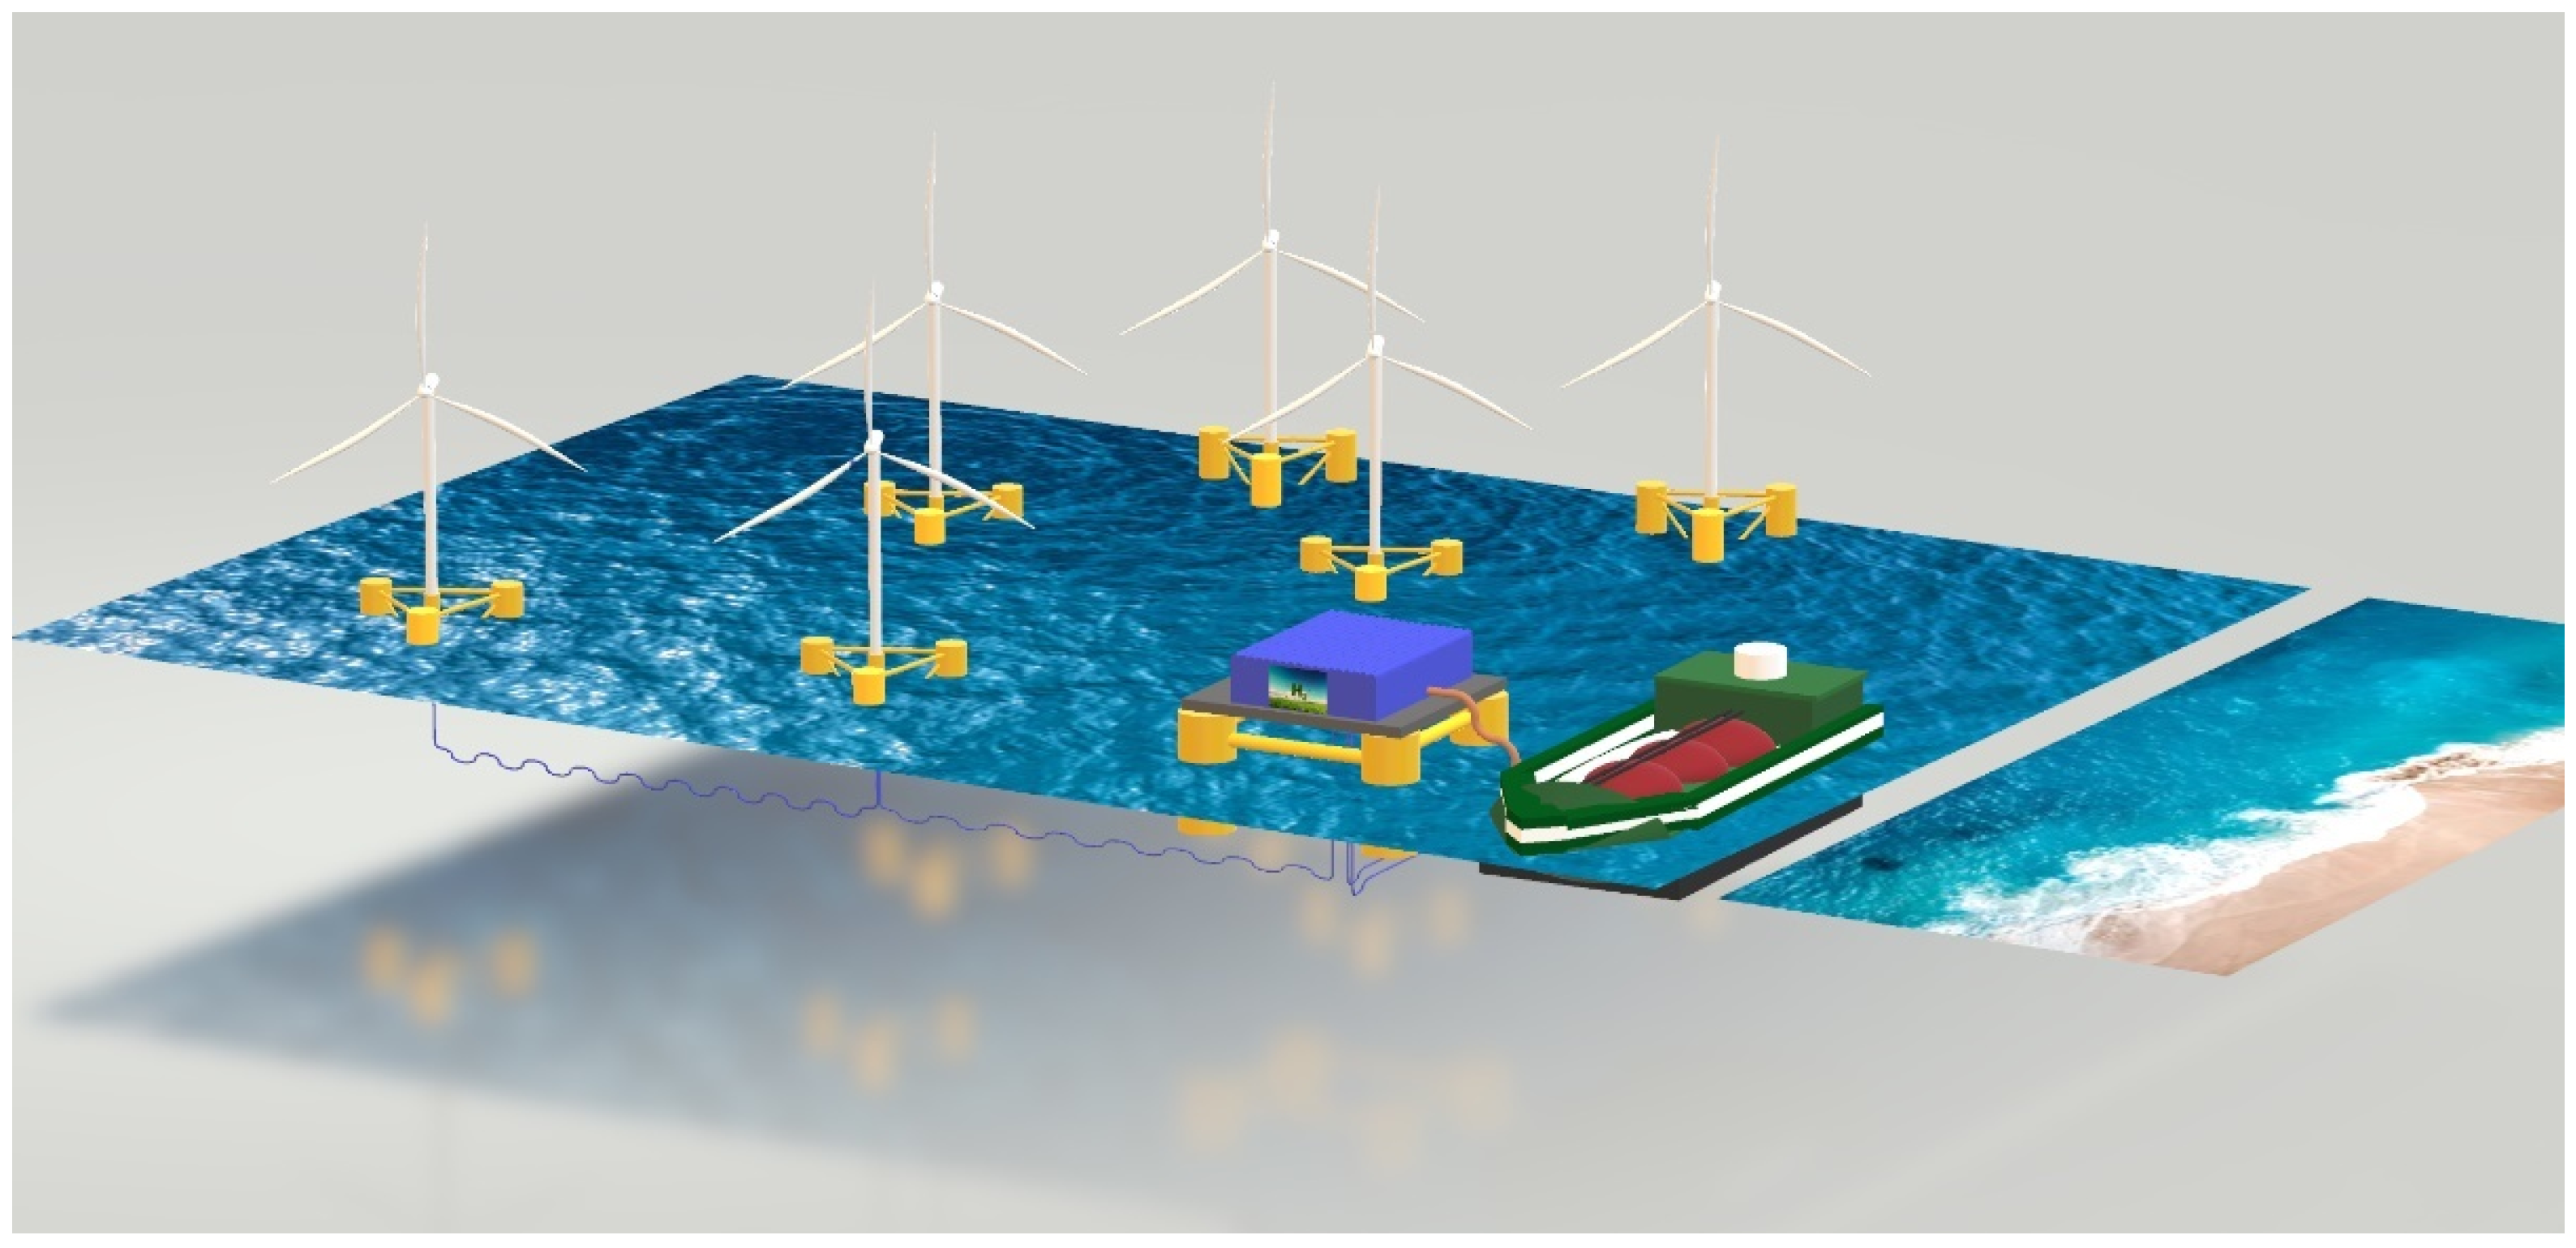
  • The hydrogen production system is centralised on an offshore platform located near the wind farm. Hydrogen is stored in a tank on this platform, and the configuration is denoted by the acronym ORCH2S [15]-which stands for offshore renewable centralised hydrogen production with storage. A simplified schematic of this configuration is presented in Figure 3, where the ship illustrates one possible transportation method, although it is not included in the techno-economic analysis.
The main components considered for the techno-economic evaluations in the three configurations are reported in Table 1.

2.2. Case Studies

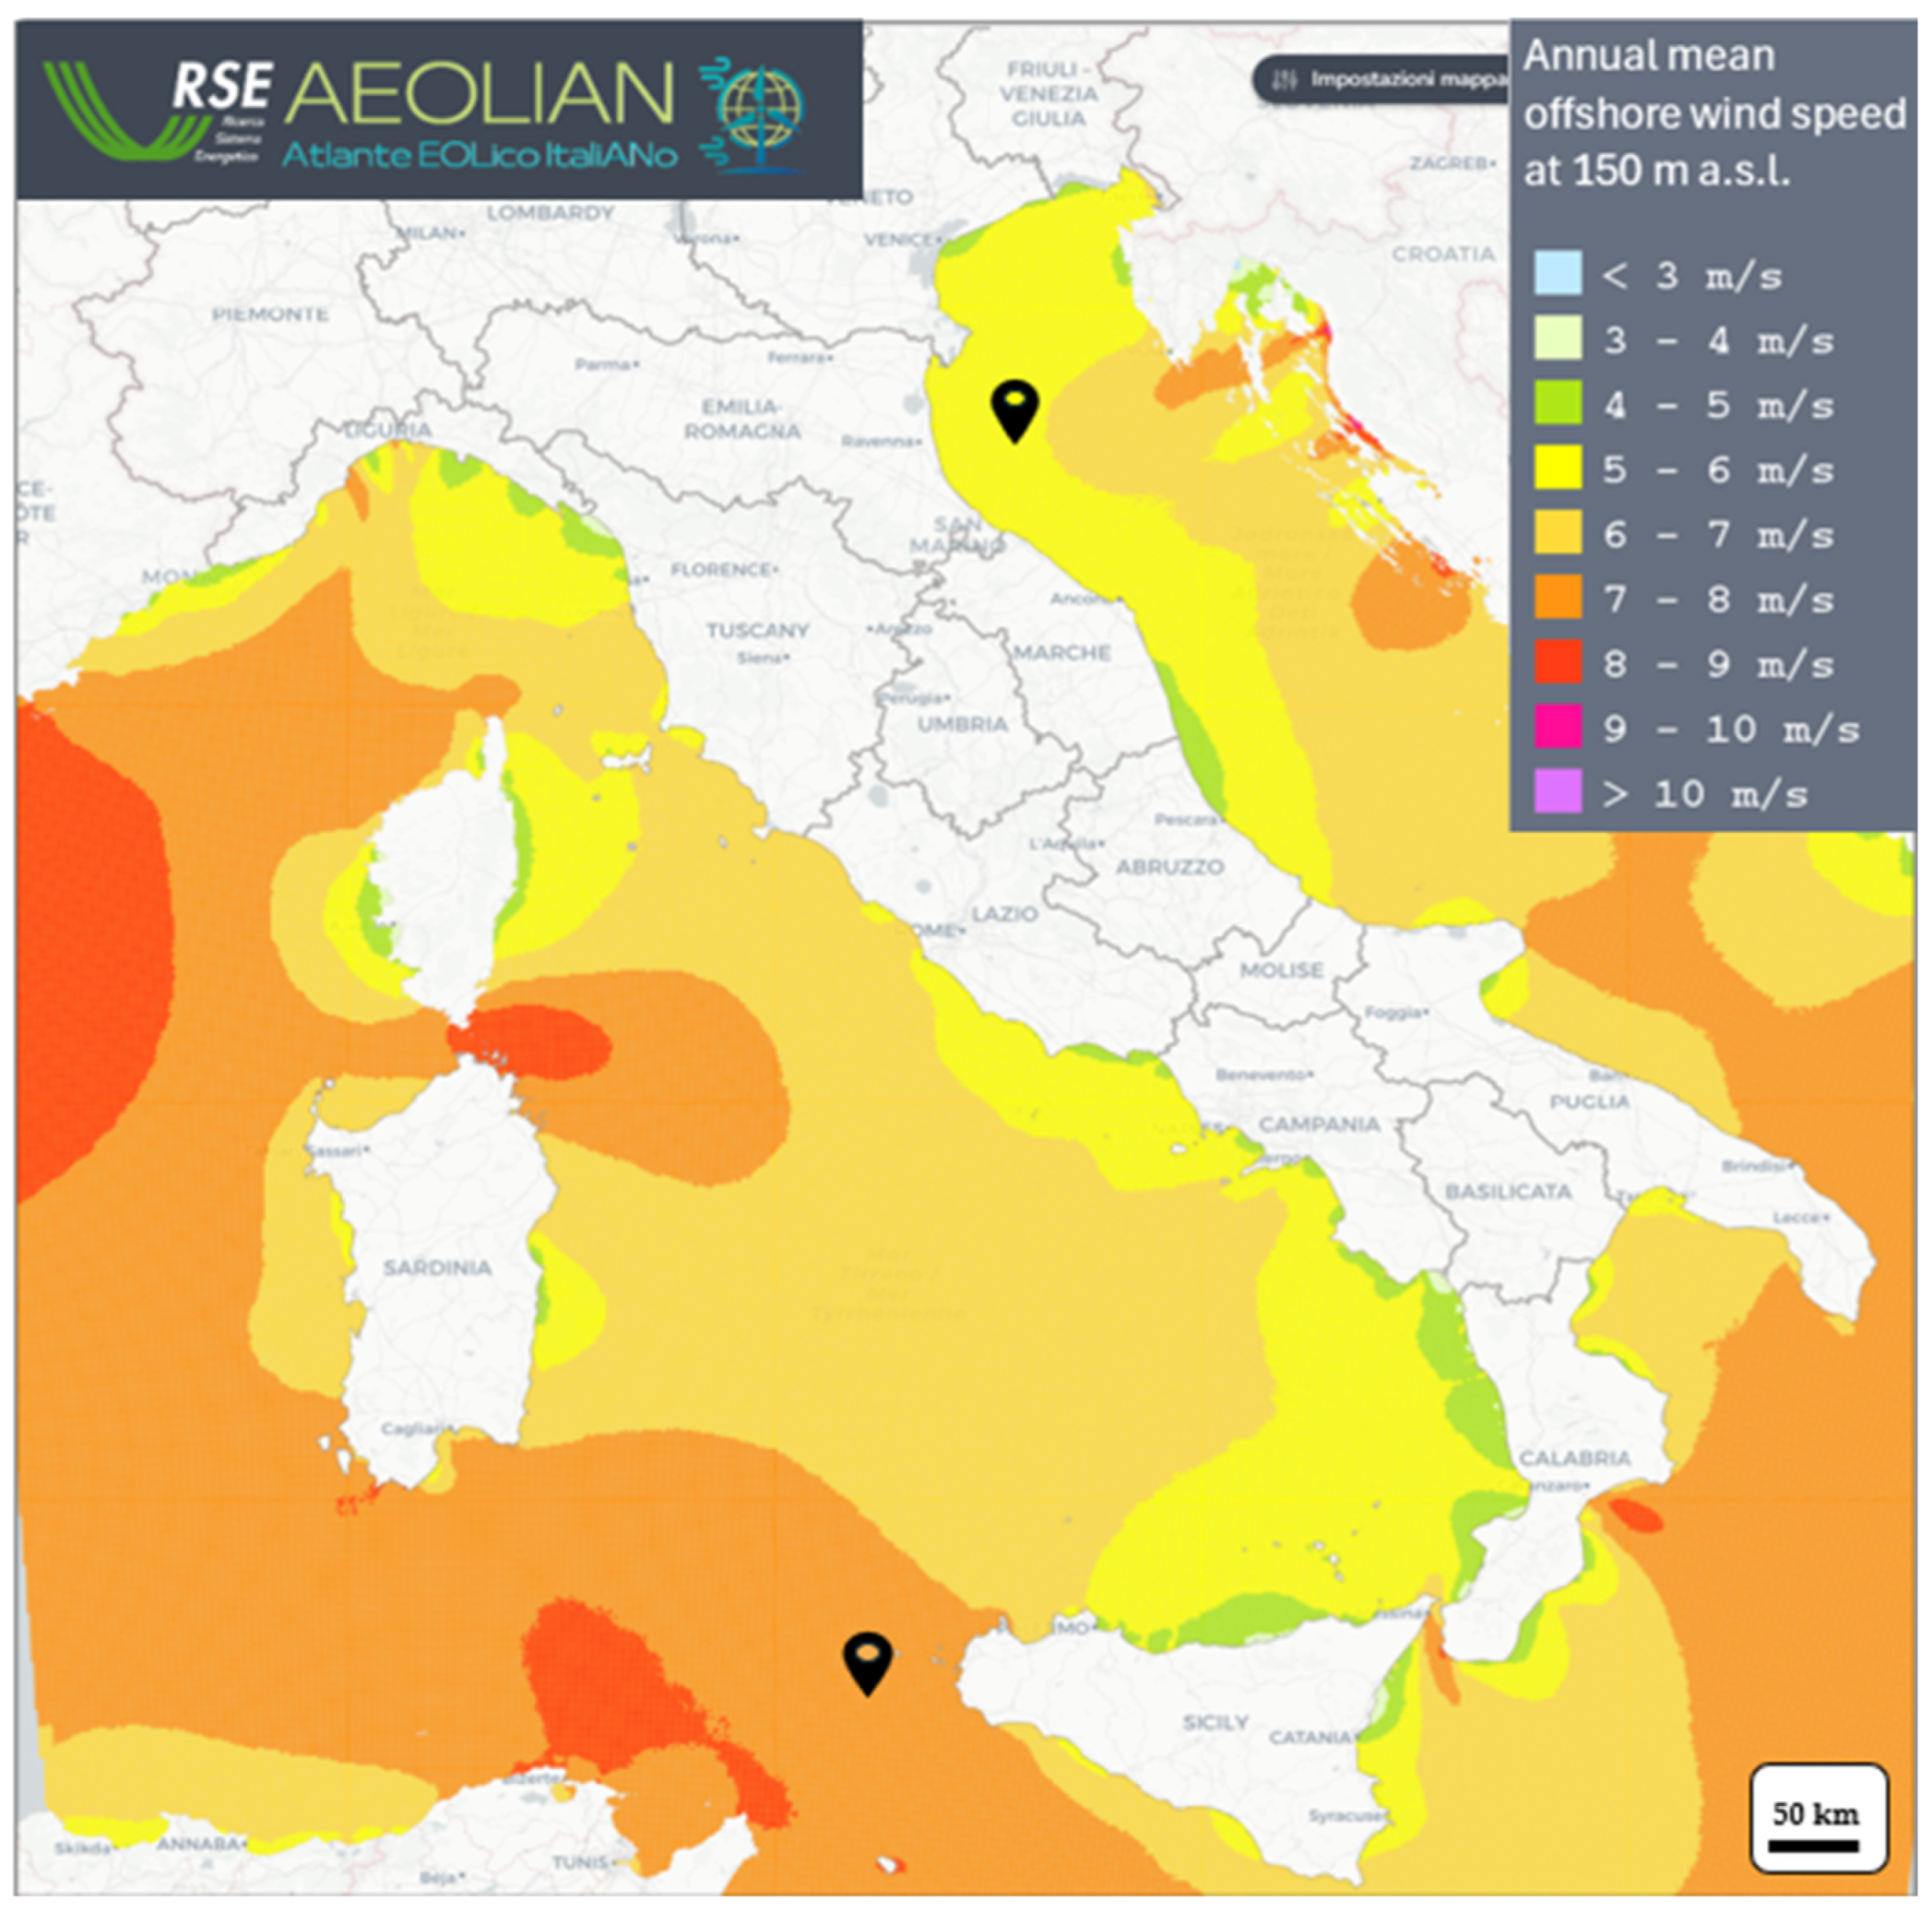
To conduct the initial techno-economic evaluations of offshore hydrogen production, two offshore wind sites representing different contexts in Italy were selected. These sites, located off the coast of the Sicily and Emilia-Romagna Regions, are shown in Figure 4, along with a map of the annual average wind speed at 150 m above sea level (a.s.l.) extracted from AEOLIAN, the wind atlas of Italy developed by RSE [38].
The selection of these sites is driven by the presence of several advanced offshore wind project proposals in these areas. Western Sicily stands out due to the exceptionally high number of connection requests, totalling 82 GW, making it particularly attractive for offshore wind development thanks to its strong wind resources and relatively moderate water depths (200–500 m). In contrast, the Emilia-Romagna case study is set in an area where a hybrid offshore project is currently in the pipeline. This project includes the installation of a bottom-fixed offshore wind farm, an offshore photovoltaic park, hydrogen production, and energy storage.
The specific characteristics of the two sites are reported in Table 2. In particular, the wind speed reported is the average annual mean speed at 150 m a.s.l., which corresponds to the hub height of the turbine used in the analyses, i.e., the IEA-15-240-RWT [39].
The Sicily site is characterised by high wind potential and a significant distance from the coast. Additionally, due to the presence of deep waters, floating wind technology—specifically with a semi-submersible platform design—has been considered. The Emilia-Romagna site, by contrast, features lower wind potential but benefits from a shorter distance to the coast and shallow waters. Consequently, fixed-bottom wind turbines, specifically of the monopile type, have been considered. Furthermore, on this site, there are already offshore extraction platforms at the end of their life, which are assumed to be reused for the installation of the hydrogen production system.

2.3. Models

Regarding economic models, LCOE and LCOH have been used. Due to the high uncertainty of the input parameters, a simplified version of these parameters, indicated as sLCOE [40,41] and sLCOH [5,42], has also been used. These are often employed in comparative analyses on performance and costs with the same financing approach. sLCOE and sLCOH are defined by the following equations:
s L C O E = C R F · C A P E X w + O P E X w E p r o d [ E U R M W h ]
s L C O H = C R F · C A P E X e + O P E X e H 2 p r o d [ E U R k g ]
C R F = W A C C · W A C C + 1 n W A C C + 1 n 1
In Equations (1) and (2), CAPEX represents the capital expenditure for the plant (w for wind farm and e for electrolyser), OPEX the operating expenditure (w for wind farm and e for electrolyser), Eprod the average annual energy produced by the wind farm, and H2prod the amount of hydrogen produced by the respective plants, and n the duration in years of the plant’s useful life. Due to the early stage of the sectors considered in this study, the OPEX are addressed as a percentage of CAPEX and expressed in Equations (1) and (2) with the same units.
In these “simplified” parameters, the financial part is considered through the capital recovery factor (CRF), given by the ratio between the fixed annuity and the present value at which this annuity is received over a certain period. In this type of evaluation, CRF is calculated based on the weighted average cost of capital (WACC). In the present study WACC is the same for wind farm and electrolyser, supposing that both are part of a unique offshore plant with common investors and common owner. However, this simplified approach has certain limitations. It assumes a fixed annual OPEX due to limited data availability and considers a constant cost of capital with a fixed CRF.
Moreover, as highlighted by Idel in [43], LCOE and LCOH do not reflect the costs associated with renewable energy intermittency, as they do not account for the actual electricity/hydrogen supplied to a specific location at a given time but rather refer to a lifetime average.
Finally, it is noted that the connection between the two formulas consists in the fact that the cost of electricity (LCOE) constitutes the predominant part of the OPEXe [44].

2.4. Technological Aspects

2.4.1. Wind Farm

In continuity with the case studies already addressed in previous research activities [40,45], and in agreement with the experts engaged in Task 49 of the International Energy Agency (IEA) Wind Energy Technology Collaboration Programme [46], the current reference floating OWF consists of 67 turbines of 15 MW each. The same wind farm is considered in the case of fixed foundation wind farm.
The energy production of the OWF has been calculated from hourly wind speed data at hub height from AEOLIAN using the turbine power curve [47] over a ten-year dataset (2010–2019). The gross annual energy production (GAEP) has been obtained through the average of the yearly productions [45]. To calculate the net annual energy production (NAEP), the overall losses, estimated at circa 7.5% for an optimal array layout [34] mainly due to aerodynamic losses and turbine unavailability due to failures, are subtracted to GAEP. In the centralised configurations also the electrical losses of intra-array cables are considered. The overall losses are increased by a conservative average value of 0.5% based on previous authors’ evaluations. The wind farm useful life is assumed to be 30 years [45].

2.4.2. Electrolyser, Transport and Storage System

The PEM electrolyser technology has been chosen in the present study. This technology, thanks to the electrolyte made of solid polymers, is more compact, with lower ohmic losses, better efficiency at partial loads (high flexibility), and the ability to operate at higher pressures [40]. The current energy efficiency is between 50 and 68% [48]. In the same report is indicated that in 2050 energy efficiency can reach a maximum of 80%. A simplified approach has been applied to express electrolyser performances based on average yearly values.
For the techno-economic evaluations the following assumption have been made for the PEMEL:
  • An efficiency value of 75%, equal to 22.5 kg/MWh or 44.4 kWh/kg,
  • A specific production of 4000 equivalent hours (annual hours of plant operation at maximum power),
  • A useful life of 30 years,
  • One complete replacement of the electrolyser stacks during the useful life,
  • The replacement of the stacks occurs at present every ten years or certain number of operating hours, but the chosen value represents more performant future stacks [49],
  • The average consumption of fresh water corresponds to about 9 L per kg of hydrogen produced,
  • The system is considered equipped with a desalination plant,
  • To transport the hydrogen produced offshore to the mainland underwater pipelines have been considered.
The main issues regarding hydrogen transport in pipelines are related to diffusion losses and pipeline embrittlement. Regarding maintenance, periodic cleaning is planned, and in case of breakage, the repair cost is high. To contain hydrogen leaks towards the outside in the pipelines, the operating pressure inside the pipes is limited to 50 bar.
This limitation therefore reduces the cost of compressing the gas at the time of production, given that the PEMEL considered in this study already has an outlet pressure of the produced hydrogen at similar levels [49]. If decentralised hydrogen production is considered (ORDH2C), in the case of floating platforms, flexible pipelines are required.
As an alternative to transport by pipeline, in ORCH2S configuration liquid hydrogen can be stored and possibly transported on land by ship with a technology like that adopted for natural gas. In the case of liquid hydrogen [50] its high volumetric capacity makes this storage method particularly promising for this type of application. The liquefaction of hydrogen is highly energy-intensive: the specific consumption of this process corresponds to approximately 10 kWh for each kg of H2 [51]. A further problem relating to the liquefaction of hydrogen is given by the low temperatures required to maintain the liquid state. Maintaining the cryogenic state adds complexity to transportation. In this simplified approach, a detailed model for the storage system has not been considered, although the economic aspects have been included.

2.5. Economic Aspects

2.5.1. Wind Farm

The costs of the main components of a wind farm have been assessed by the authors in previous studies [34,40,45] and are summarised in Table 3. Electrical substation and export cable costs are not considered because the OWF is fully dedicated to hydrogen production.

2.5.2. Electrolyser, Transport and Storage System

The costs of the main electrolyser and pipeline components considered in the study are reported in 
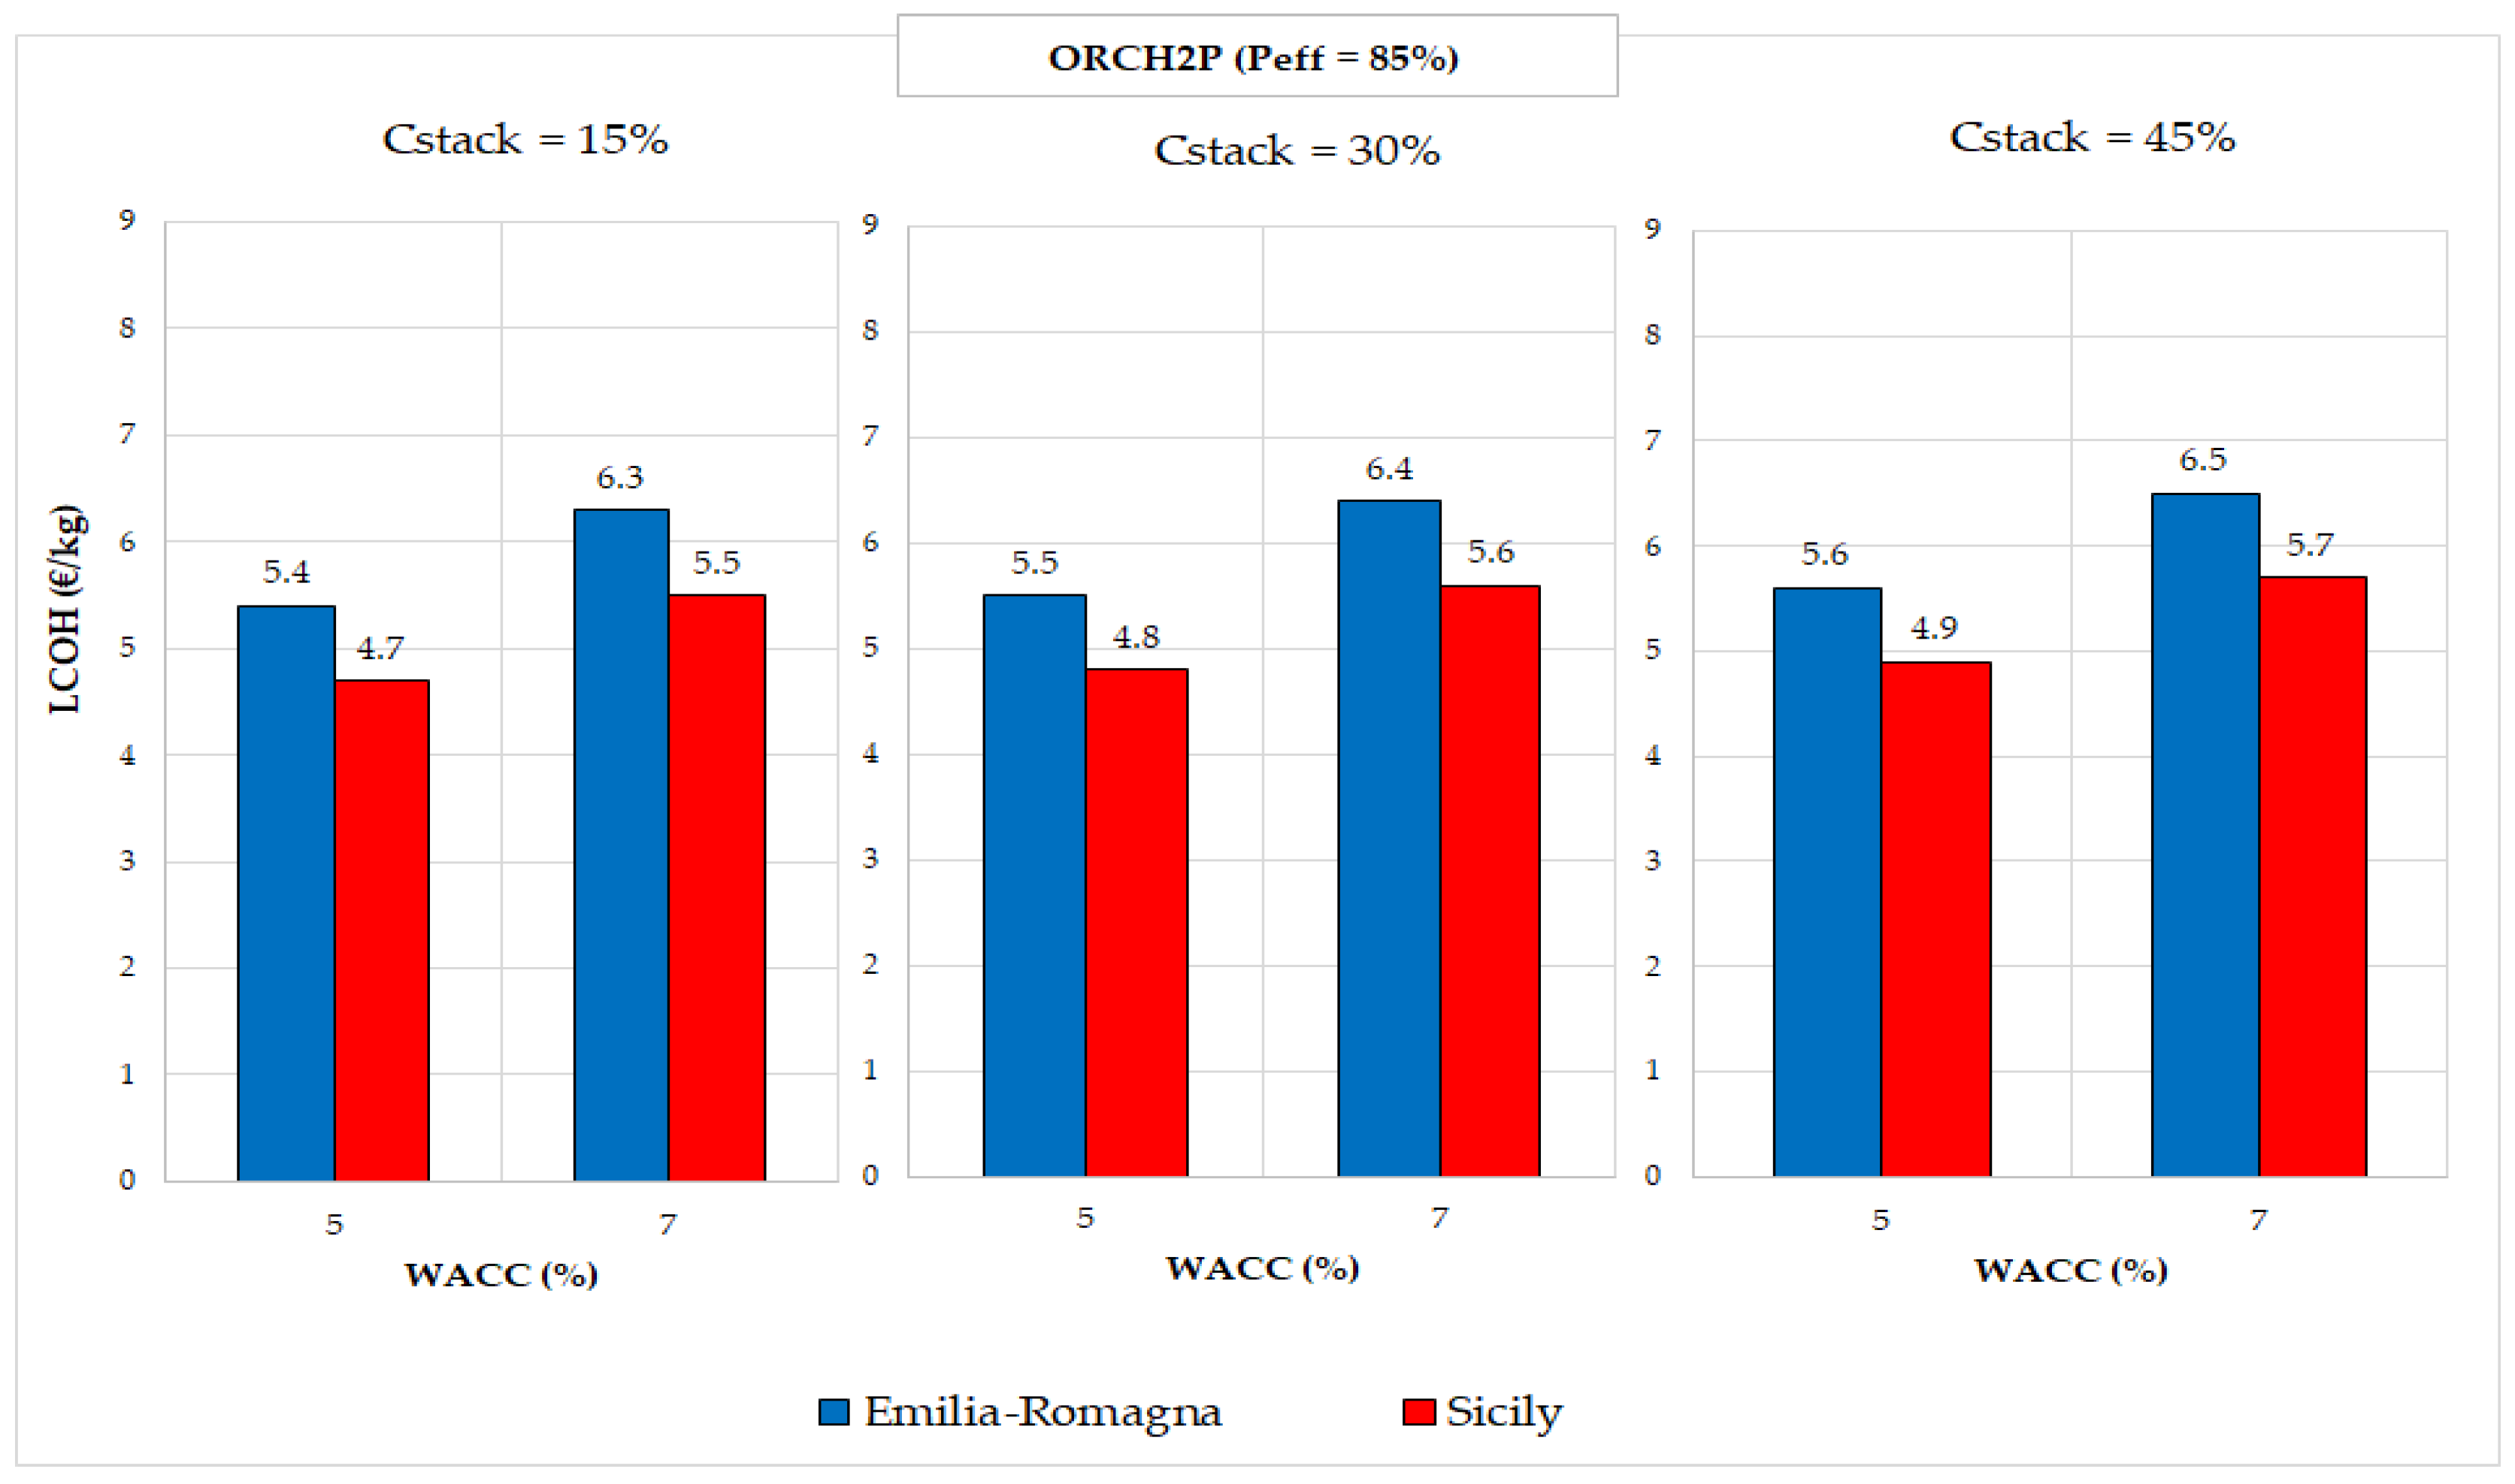
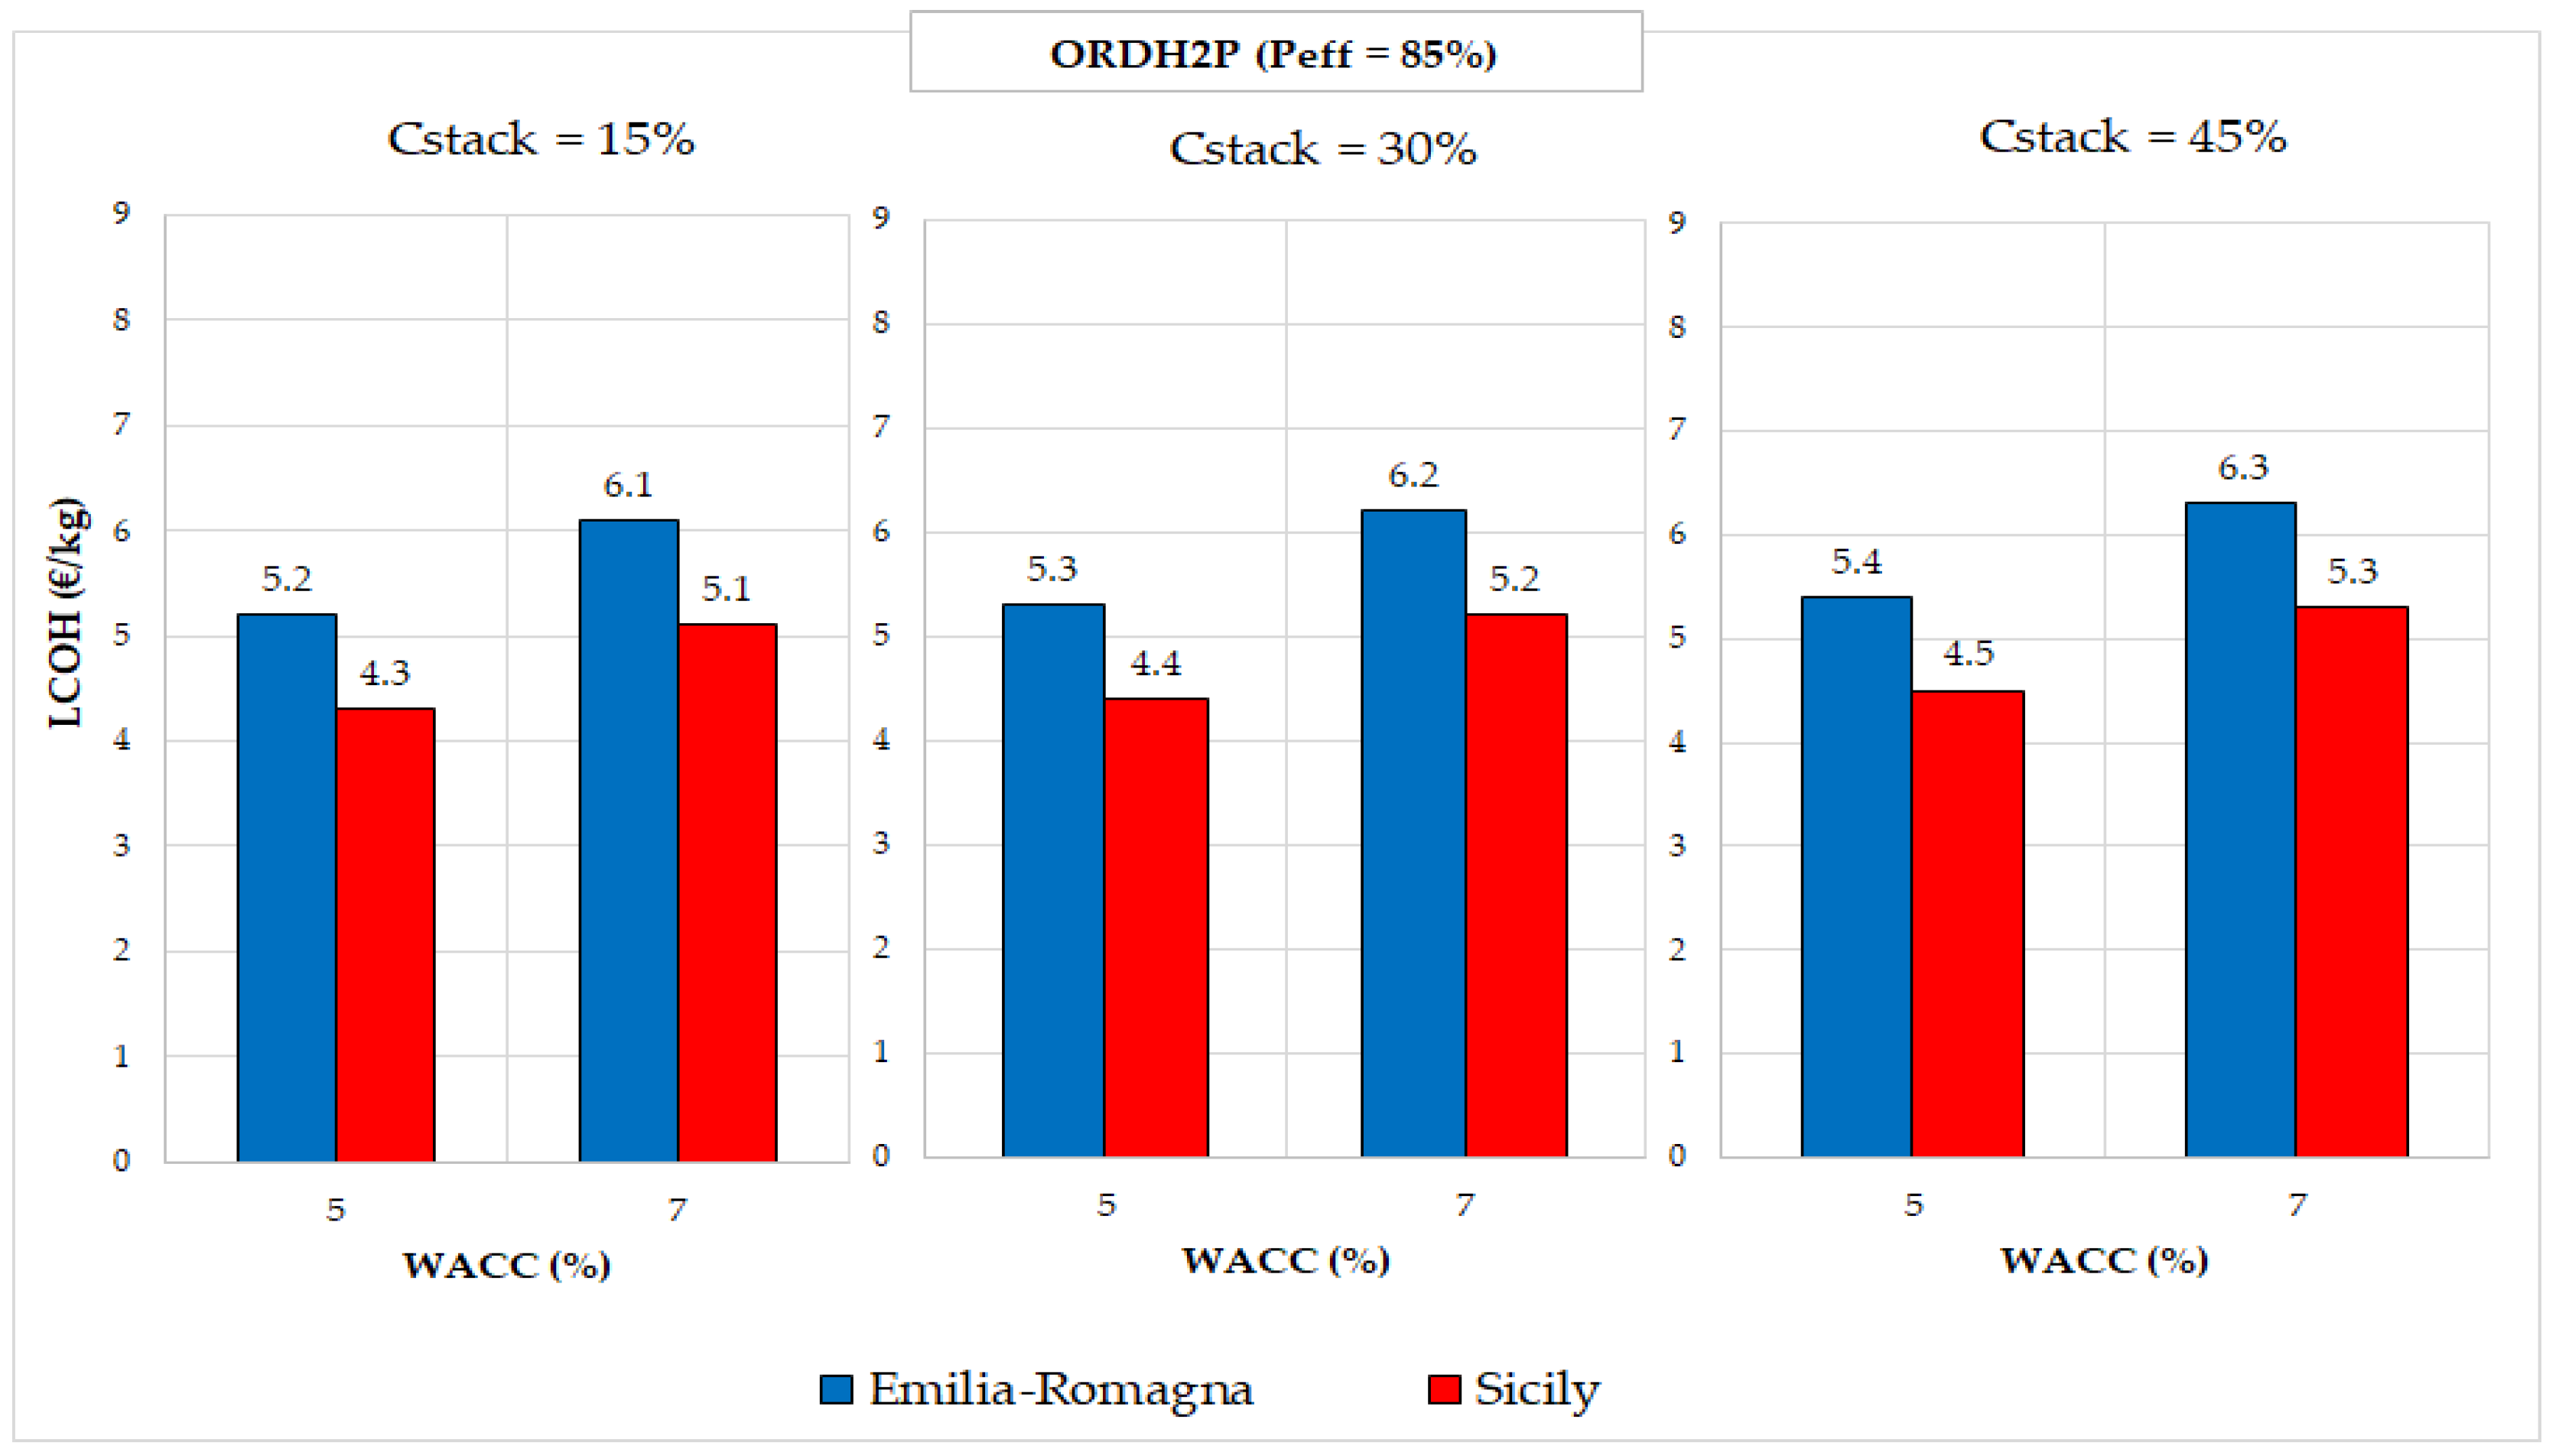
Table 4 together with the source of data. About the cost of the stack substitution, expressed in percentage of the CAPEXe, there is no consensus in the literature data [49,
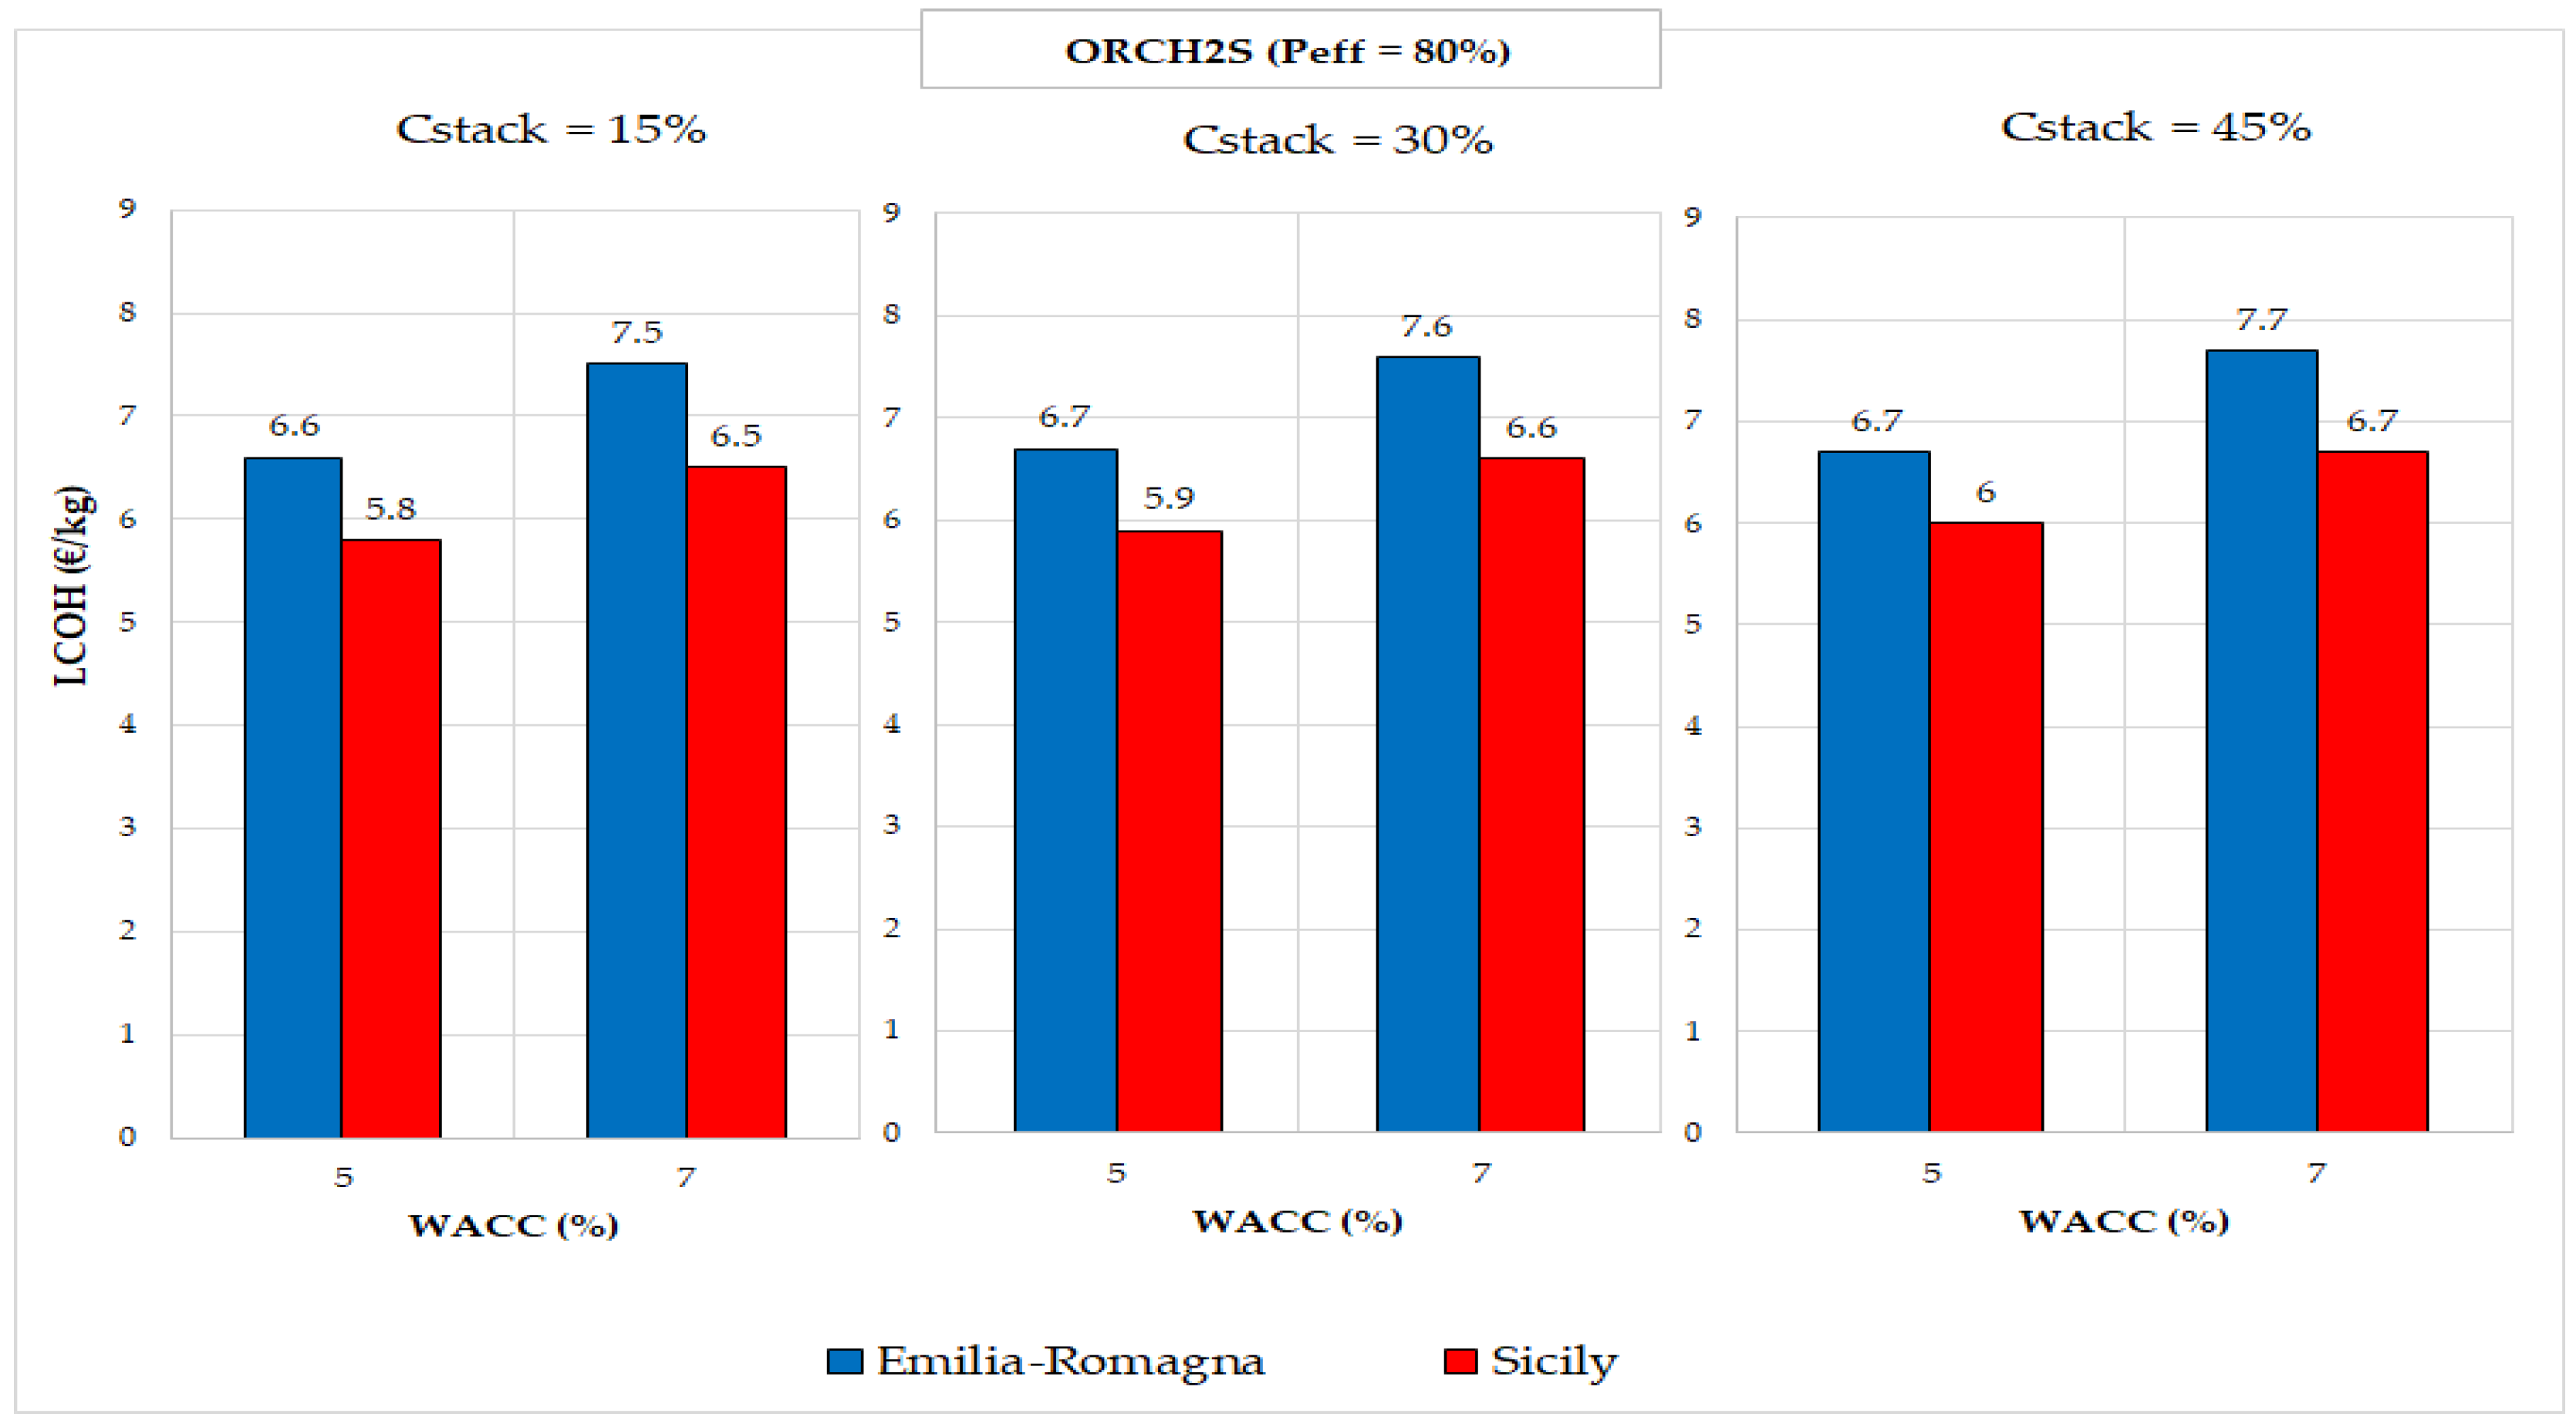
52], and therefore, three values, 15%, 30%, and 45%, have been adopted. Regarding the liquefaction and storage system, the costs are expressed as the cost of storage in EUR per kg of hydrogen produced. According to [53], the value assumed for a large-scale isolated storage system for storage up to a week duration is in the range 0.05÷0.091 USD/kg, with an additional cost of for liquefaction. In this study, a total indicative value for liquefaction and storage of 0.9 EUR/kg was assumed.
All the costs for the hydrogen system components include installation.

2.6. Assumptions

To conduct technical-economic studies of emerging technologies or in any case not yet widely widespread, assumptions are made regarding the performance and the cost, for which it is not possible to make accurate predictions at the time the studies are carried out.
The first assumption made for the analyses reported here is that the electrolysers can be integrated into offshore structures (floating or not): on the single turbine platform, on the electrical substation platform, on a dedicated offshore platform, reusing an oil and gas extraction platform.
Integration issues were not studied in this study, neither from an engineering point of view, nor in terms of health, safety, performance, and ease of access for maintenance. It would also be necessary to conduct specific studies to understand the influence of the movement dynamics of the floating platform on the various equipment in the water treatment and electrolysis system.
The second assumption pertains to the ability of electrolysers to absorb all wind power not allocated to auxiliary systems. Accordingly, three different effective powers (Peff) were analysed: 75, 80, and 85%. These represent the proportion of wind farm energy specifically dedicated to hydrogen production and are based on the literature data, suggesting efficiencies exceeding 80%.
In the ORDH2S configuration, which includes liquefaction and storage systems, Peff is reduced by an additional 5% (estimated by [55]). Consequently, the values considered in this case are 70, 75, and 80%. To better assess the efficiency of the system, models capturing the dynamics of the electrolyser and wind energy production on appropriate time scales (minutes) should be employed. Additionally, the potential integration of a wind energy storage system warrants evaluation.
It is important to note that for ORCH2P and ORDH2P configurations, the calculated hydrogen cost pertains to the point where the pipeline reaches the coast. In contrast, for the ORDH2S configuration, where hydrogen is withdrawn offshore by ship, the cost reflects liquefied hydrogen stored offshore. This latter configuration is the least technologically mature and is associated with a longer-term development timeline. Alternative solutions could also be envisioned, such as utilising the ship itself as a hydrogen storage tank or even equipping it with a complete onboard hydrogen production unit.

3. Results and Discussion

3.1. Wind Production Assessment

Using the methodology described in Section 2.4.1, the GAEP, NAEP, and all related parameters listed in Table 5 were calculated for the wind farm in the two case studies, considering both centralised (ORCH2) and decentralised (ORDH2) configurations. Specifically, full load hours (FLHs) are defined as the ratio of NAEP to the wind farm capacity, while the capacity factor (expressed as a percentage) is the ratio of FLHs to the total hours in a year (8760).
As highlighted in Table 5, a substantial difference in NAEP is observed between the two sites, with Sicily demonstrating higher values compared to Emilia-Romagna, where production averages 64% of that in Sicily. Due to its specific characteristics listed in Table 2, the site can benefit from significantly lower costs compared to those anticipated for Sicily. These cost advantages are sufficient to nearly offset the lower wind energy production when determining the LCOE and LCOH.

3.2. Electrolyser Size Assessment

The size of the electrolyser to be coupled with the wind farm is determined based on the energy requirements of both the electrolyser and the auxiliary system. Specifically, the size of the electrolyser (PH2) is referred to the oversize factor (OF) equal to the ratio between Pwind and PH2 where Pwind expresses the size of the OWF. The results of these calculations for the two case studies are reported in Table 6.
As expected, in the Sicily case study, where the OWF exhibits higher FLHs, the average OF is lower, and vice versa for Emilia-Romagna. Moreover, Table 6 highlights that an increase in the OF corresponds to a decrease in Peff, which is anticipated given the inverse relationship between OF and Peff.
The oversize factor values shown in Table 6 align with those presented in [54]. For the Sicily case, which corresponds to 3600 FLH, the OF ranges from 1.2 to 1.5, fully falling within the 1.1 to 1.6 range estimated in [54]. In the Emilia-Romagna case, corresponding to 2300 FLH, the OF ranges from 1.9 to 2.3, which is close to the maximum value of approximately 2.2 reported in [54].

3.3. LCOE

Based on the inputs reported in Table 5 and the cost input reported in Section 2.5.1 LCOE has been calculated according to Equation (2) in the two case studies for the centralized and decentralized configuration with two WACC values. The results are presented in Table 7.
As expected, in the Sicily site, the LCOE values are lower than the ones in the Emilia-Romagna site; however, the lower costs of the Emilia-Romagna wind farm due to the fixed foundation turbine technology and the shorter distance from the shore partially compensate for the production differences. In fact, the ratio between Sicily LCOE and Emilia-Romagna LCOE is averagely 80% (higher than the inverse of the two production ratios).
Due to the considerable uncertainty associated with the input data—whether technological, economic, or related to offshore resource estimates—each case study shows significant variability in the LCOE calculation (see, for example [55]). However, the authors chose to report the exact LCOE results for each configuration and case study to highlight the dependence of LCOH on system and electrolyser parameters. Their aim is to emphasize a methodological approach that is replicable across different configurations, sites, and ranges of input parameters.

3.4. LCOH

Using the inputs listed in Table 6 and the cost data detailed in Section 2.5.2 and Section 3.3, the LCOH was calculated for the two case studies across three configurations and two WACC values.
With the stack replacement cost (Cstack) fixed at the central value of the range considered (30% of the CAPEXe), the LCOH was determined for various Peff values. The results are reported in Table 8 and Table 9 for WACC values of 5% and 7%, respectively.
To better illustrate the results obtained across various case studies and configurations, Figure 5, Figure 6 and Figure 7 present bar charts summarising the values listed in Table 8 and Table 9. These charts depict the LCOH, expressed in EUR/kg. The blue bars represent the values associated with the Emilia-Romagna case, while the red bars correspond to the Sicily case. Specifically, Figure 5 shows the results for the ORCH2P configuration, varying the WACC and Peff with Cstack set to 30%. Figure 6 presents the results for the ORDH2P configuration, while Figure 7 focuses on the ORCH2S configuration.
Conversely, by fixing the percentage of wind energy that can be allocated for hydrogen production at the central value of the considered range (85 and 80%), the LCOH was calculated for various stack replacement costs. The results are provided in Table 10 and Table 11 for WACC values of 5% and 7%, respectively.
To better illustrate the impact of varying Cstack on the results obtained across various case studies and configurations, Figure 8, Figure 9 and Figure 10 present bar charts summarising the values listed in Table 10 and Table 11. These charts depict the LCOH, expressed in EUR/kg. The blue bars represent the values associated with the Emilia-Romagna case, while the red bars correspond to the Sicily case. Specifically, Figure 8, Figure 9 and Figure 10 report the results of LCOH calculated varying WACC and Cstack value, respectively, for the ORCH2P, ORDH2P, and ORCH2S configurations.
Below are some comments regarding the trends in LCOH values presented in the previous tables:
  • Dependence on WACC: As expected, a lower WACC leads to a lower LCOH. It is important to note that WACC is closely linked to the interest rate and inversely reflects investors’ confidence. The WACC values considered in this study (5% and 7%) align with the assumptions made by the IEA (6%) for similar land-based evaluations [56].
  • Dependence on Peff: The variation in Peff influences both OPEXe and H2prod in Equation (2). The relationship between LCOH and Peff is nearly linear, meaning, for instance, that 90% change in Peff results in approximately a 90% change in LCOH. This is primarily due to the dominant role of energy costs in the OPEXe.
  • Dependence on stack replacement cost: Variations in the chosen Cstack value result in relatively smaller changes in LCOH. For example, increasing Cstack from 15% to 45% of CAPEX (a factor of three) causes LCOH to increase only slightly, from 4.7 to 4.9 EUR/kg.
  • Dependence on the site: All LCOH values for the Sicily site are lower than those for the Emilia-Romagna site. This result is strongly linked to the difference in NAEP between the two wind farm locations. As mentioned in Section 3.1, the Emilia-Romagna OWF generates only 64% of the energy produced by the Sicily OWF, leading to lower hydrogen production. Although costs are relatively lower, this results in a higher LCOH, making it less favourable. To highlight the specific potential of the case studies analysed, Table 12 reports the ratio between LCOE and LCOH values for the two sites across all configurations, with a fixed Peff.
In all cases, the LCOH ratio between the two sites is higher than the corresponding LCOE ratio, reflecting the lower costs associated with the hydrogen production system in the Emilia-Romagna site. This includes cost savings such as the re-use of an existing platform, eliminating the need for a new offshore substation. This finding suggests that, despite the higher hydrogen production costs in Emilia-Romagna, using hydrogen as an energy carrier remains relatively more advantageous than transmitting electricity, when compared to the Sicily case study.
  • Dependence on the configuration: The configuration with storage (ORCH2S) consistently shows higher LCOH values compared to the pipeline-based configurations in all comparable cases. The assessment of the liquefaction and storage system remains very preliminary and carries high uncertainty. Additionally, final costs should account for transportation, which is not included in the present study. A combined assessment of storage and transportation costs would likely yield more accurate results. Among pipeline-based configurations, the decentralised option is the most cost-effective due to the reduced need for components, such as the offshore substation.
  • Comparison with other studies: The LCOH range for the pipeline-based configuration (4.2–6.8 EUR/kg) reflects the variability of multiple parameters, including site-specific factors across Italy. These results are consistent with findings from other sectoral studies, both in global assessments [56] and local onshore evaluations [57]. Furthermore, comparing these results with the LCOH range highlighted in [7] for hydrogen produced by PEMEL powered by offshore wind—ranging from 3.77 EUR/kg to 11.75 EUR/kg based on four different studies—demonstrates alignment with existing research. Additionally, a techno-economic analysis in [15] on offshore wind farms fully dedicated to hydrogen production indicates that such systems could become profitable by 2030 at a hydrogen price of 5 EUR/kg, which sits exactly in the middle of the range identified in this study.
  • Economic feasibility: Based on a preliminary generalisation of the obtained results, it can be concluded that economic feasibility depends on several factors including the hydrogen selling price, potential incentive mechanisms, overall demand, technology adoption, and the cost reductions associated with learning curve effects. As technology becomes more widespread, increased investor confidence is expected to lower the WACC. Additionally, on the cost side, it is important to note that CAPEX has a significantly larger impact than the specific cost of stack replacement. From the wind farm perspective, deploying turbines in areas with high wind availability—as indicated by high NAEP values—is crucial for reducing costs related to site characteristics (such as distance from the coast, water depth, etc.) and the type of technology employed.

4. Conclusions

In this paper the methodology and results of a preliminary techno-economic analysis of OWFs dedicated entirely to the production of green hydrogen offshore are presented. Among the technologies considered in this study, floating offshore wind power and large-scale electrolysers (in the hundreds of megawatts range) are still in the process of maturation and commercial deployment.
The key contribution of this research lies in the development of a comprehensive model that accounts for the various factors influencing the cost of green hydrogen production. This model is adaptable to different configurations and case studies, offering valuable insights for future applications. Only a selection of the results of the study carried out by the authors has been reported.
The results for two different offshore sites in Italy sites have been reported, the first one in Sicily with a high wind resource, but almost far from the coast (70 km) and using floating wind turbines, the second one in Emilia-Romagna with a lower wind resource, but closer to the coast (34 km) and using fixed wind turbines. LCOHs range from approximately 4.3 to 6.0 EUR/kg in Sicily and from 5.2 to 6.7 EUR/kg in Emilia-Romagna or WACC equal to 5%. As expected, LCOHs result on average lower in the Sicily case with higher wind resource availability than Emilia-Romagna case, despite the higher specific CAPEX costs of the system in Sicily due to higher distance from shore and water depth. Offshore decentralised configuration presents the lower LCOH; however, the feasibility of the hydrogen production system integrated in a floating wind turbine has still to be demonstrated. The weight of the stack substitution cost on LCOH is of the second order.
Many refinements could be made in the short term, such as those concerning the detailed simulation of systems at time scales of less than an hour for performance evaluation. Moreover, to have reliable cost data, it is probably necessary to wait for the development and diffusion of technologies in large sizes and large scales. An important next step to this work would be to evaluate different remuneration and possibly incentive systems.
As noted, this study evaluates the costs and performance of large-scale systems within a future commercial deployment scenario. While uncertainties remain regarding the performance and costs of such systems—mainly derived from the literature due to the limited offshore experience—the results for energy and hydrogen costs align well with findings from other sector studies. Producing green hydrogen from dedicated offshore wind farms is an exciting pathway toward a sustainable energy future. However, the realisation of this potential requires sustained innovation, technological advancements, and supportive policies. A concerted effort from researchers, industry stakeholders, and governments is essential to overcome the challenges and unlock the full potential of offshore green hydrogen production.
It is believed that the preliminary results here reported, along with similar research on emerging technologies, can provide valuable support to stakeholders across various sectors and assist decision makers at multiple levels.

Author Contributions

Conceptualisation. F.L. and L.S.; methodology. all; software. F.L.; validation. all; resources. all; data curation. all; writing—original draft preparation. F.L. and L.S.; writing—review and editing. A.B., F.S. and R.T.; visualisation. F.L.; supervision. A.B. All authors have read and agreed to the published version of the manuscript.

Funding

This work has been financed by the Research Fund for the Italian Electrical System under the Three-Year Research Plan 2025–2027 (MASE, Decree n.388 of 6 November 2024), in compliance with the Decree of 12 April 2024.

Data Availability Statement

Wind resource data are publicly available at https://aeolian.rse-web.it/ (accessed on 14 April 2025).

Conflicts of Interest

Authors Francesco Lanni, Laura Serri, Giovanni Manzini were employed by the company Ricerca sul Sistema Energetico-RSE S.p.A. The remaining authors declare that the research was conducted in the absence of any commercial or financial relationships that could be construed as a potential conflict of interest. The company had no role in the design of the study; in the collection, analyses, or interpretation of data; in the writing of the manuscript, or in the decision to publish the results.

References

  1. IRENA. Renewable Energy Innovation: Accelerating Research for a Low-Carbon Future. 2017. Available online: https://www.irena.org/-/media/Files/IRENA/Agency/Publication/2017/Nov/IRENA_Accelerating_research_2017.pdf (accessed on 4 March 2025).
  2. Gökgöz, F.; Taylan Güvercin, M. Energy security and renewable energy efficiency in EU. Renew. Sustain. Energy Rev. 2018, 96, 226–239. [Google Scholar] [CrossRef]
  3. European Commission. Communication from The Commission to The European Parliament, The Council, The European Economic and Social Committee and The Committee of The Regions ‘Fit for 55’: Delivering the EU’s 2030 Climate Target on the Way to Climate Neutrality. COM/2021/550 Final. Available online: https://eur-lex.europa.eu/legal-content/EN/TXT/?uri=celex:52021DC0550 (accessed on 4 March 2025).
  4. Moore, J.; Shabani, B. A Critical Study of Stationary Energy Storage Policies in Australia in an International Context: The Role of Hydrogen and Battery Technologies. Energies 2016, 9, 674. [Google Scholar] [CrossRef]
  5. Superchi, F.; Mati, A.; Pasqui, M.; Carcasci, C.; Bianchini, A. Techno-economic study on green hydrogen production and use in hard-to-abate industrial sectors. J. Phys. Conf. Ser. 2022, 2385, 12054. [Google Scholar] [CrossRef]
  6. Amarapala, V.; Darwish, A.S.K.; Farrell, P. Storage of wind power energy: Main facts and feasibility-hydrogen as an option. Renew. Energy Environ. Sustain. 2023, 8, 16. [Google Scholar] [CrossRef]
  7. Calado, G.; Castro, R. Hydrogen Production from Offshore Wind Parks: Current Situation and Future Perspectives. Appl. Sci. 2021, 11, 12. [Google Scholar] [CrossRef]
  8. IEA. Towards Hydrogen Definitions Based on Their Emissions Intensity. 2007. Available online: https://www.iea.org/reports/towards-hydrogen-definitions-based-on-their-emissions-intensity (accessed on 13 February 2025).
  9. IEA. Global Hydrogen Review 2024. 2024. Available online: https://www.iea.org/reports/global-hydrogen-review-2024 (accessed on 13 February 2025).
  10. Rogeau, A.; Vieubled, J.; de Coatpont, M.; Affonso Nobrega, P.; Erbs, G.; Girard, R. Techno-economic evaluation and resource assessment of hydrogen production through offshore wind farms: A European perspective. Renew. Sustain. Energy Rev. 2023, 187, 113699. [Google Scholar] [CrossRef]
  11. Wang, A.; Jens, J.; Mavins, D.; Moultak, M.; Schimmel, M.; van der Leun, K.; Peters, D.; Buseman, M. Analysing Future Demand Supply and Transport of Hydrogen; Technical Report; European Hydrogen Backbone Initiative: Utrecht, The Netherlands, 2021. [Google Scholar]
  12. Blanco, H.; Nijs, W.; Ruf, J.; Faaij, A. Potential for hydrogen and Power-to-Liquid in a low-carbon EU energy system using cost optimization. Appl. Energy 2018, 232, 617–639. [Google Scholar] [CrossRef]
  13. MISE. Piano Nazionale Integrato per l’Energia e il Clima 2030. 2023. Available online: https://www.mase.gov.it/sites/default/files/PNIEC_2023.pdf (accessed on 4 March 2025).
  14. MASE. Strategia Nazionale Idrogeno. 2024. Available online: https://www.mase.gov.it/sites/default/files/Strategia%20Nazionale%20Idrogeno.pdf (accessed on 4 March 2025).
  15. Dinh, V.N.; Leahy, P.; McKeogh, E.; Murphy, J.; Cummins, V. Development of a viability assessment model for hydrogen production from dedicated offshore wind farms. Int. J. Hydrogen Energy 2021, 46, 24620–24631. [Google Scholar] [CrossRef]
  16. Serri, L.; Airoldi, D.; Lanni, F.; Naldi, R.; Castorrini, A.; Rispoli, F.; Soukissian, T.; Santos, L.C.; Le Boulluec, M.; Maisondieu, C. Technical and economic challenges for floating offshore wind deployment in Italy and in the Mediterranean Sea. Wiley Interdiscip. Rev. Energy Environ. 2024, 13, e533. [Google Scholar] [CrossRef]
  17. HYWIND Scotland. Available online: https://www.equinor.com/energy/hywind-scotland (accessed on 4 December 2024).
  18. WINDFLOAT Atlantic. Available online: https://www.windfloat-atlantic.com/ (accessed on 4 December 2024).
  19. Terna Econnextion. Available online: https://www.terna.it/it/sistema-elettrico/programmazione-territoriale-efficiente/econnextion (accessed on 4 December 2024).
  20. Ligęza, K.; Łaciak, M.; Ligęza, B. Centralized Offshore Hydrogen Production from Wind Farms in the Baltic Sea Area—A Study Case for Poland. Energies 2023, 16, 6301. [Google Scholar] [CrossRef]
  21. Catapult. Offshore Wind and Hydrogen-Solving the Integration Challenges. 2020. Available online: https://ore.catapult.org.uk/resource-hub/analysis-reports/offshore-wind-and-hydrogen-solving-the-integration-challenge (accessed on 4 December 2024).
  22. World’s First Offshore Hydrogen Production Project. Available online: https://www.offshorewind.biz/2023/06/27/worlds-first-offshore-hydrogen-production-project-yields-first-kilograms-of-green-hydrogen/ (accessed on 4 December 2024).
  23. Deep Wind Partners with Hydepoint. Available online: https://www.offshorewind.biz/2024/01/31/deep-wind-partners-with-hydepoint-for-offshore-wind-hydrogen-production/ (accessed on 4 December 2024).
  24. RWE Aquaventus. Available online: https://www.rwe.com/en/research-and-development/hydrogen-projects/aquaventus/ (accessed on 4 December 2024).
  25. Ramakrishnan, S.; Delpisheh, M.; Convery, C.; Niblett, D.; Vinothkannan, M.; Mamlouk, M. Offshore green hydrogen production from wind energy: Critical review and perspective. Renew. Sustain. Energy Rev. 2024, 195, 114320. [Google Scholar] [CrossRef]
  26. Ibrahim, O.S.; Singlitico, A.; Proskovics, R.; McDonagh, S.; Desmond, C.; Murphy, J.D. Dedicated large-scale floating offshore wind to hydrogen: Assessing design variables in proposed typologies. Renew. Sustain. Energy Rev. 2022, 160, 112310. [Google Scholar] [CrossRef]
  27. McDonagh, S.; Ahmed, S.F.; Desmond, C.; Murphy, J.D. Hydrogen from offshore wind: Investor perspective on the profitability of a hybrid system including for curtailment. Appl. Energy 2020, 265, 114732. [Google Scholar] [CrossRef]
  28. Niblett, D.; Delpisheh, M.; Ramakrishnan, S.; Mamlouk, M. Review of next generation hydrogen production from offshore wind using water electrolysis. J. Power Sources 2024, 592, 233904. [Google Scholar] [CrossRef]
  29. Lucas, T.R.; Ferreira, A.F.; Santos Pereira, R.B.; Alves, M. Hydrogen production from the WindFloat Atlantic offshore wind farm: A techno-economic analysis. Appl. Energy 2022, 310, 118481. [Google Scholar] [CrossRef]
  30. U.S. Department of Energy. Technical Targets for Proton Exchange Membrane Electrolysis. Available online: https://www.energy.gov/eere/fuelcells/technical-targets-proton-exchange-membrane-electrolysis (accessed on 13 February 2024).
  31. Tiktak, W.J. Heat Management of PEM Electrolysis: A Study on the Potential of Excess Heat from Medium- to Large-Scale PEM Electrolysis and the Performance Analysis of a Dedicated Cooling System. 2019. Available online: https://repository.tudelft.nl/islandora/object/uuid%3Ac046820a-72bc-4f05-b72d-e60a3ecb8c89 (accessed on 20 June 2024).
  32. Rodríguez Castillo, C.A.; Yeter, B.; Li, S.; Brennan, F.; and Collu, M. A critical review of challenges and opportunities for the design and operation of offshore structures supporting renewable hydrogen production, storage, and transport. Wind. Energ. Sci. 2024, 9, 533–554. [Google Scholar] [CrossRef]
  33. Scolaro, M.; Kittner, N. Optimizing hybrid offshore wind farms for cost-competitive hydrogen production in Germany. Int. J. Hydrogen Energy 2022, 47, 6478–6493. [Google Scholar] [CrossRef]
  34. Travaglini, R.; Superchi, F.; Lanni, F.; Manzini, G.; Serri, L.; Bianchini, A. Towards the development of offshore wind farms in the Mediterranean Sea: A techno-economic analysis including green hydrogen production during curtailments. IET Renew. Power Gener. 2024, 18, 3112–3126. [Google Scholar] [CrossRef]
  35. Cullinane, M.; Judge, F.; O’Shea, M.; Thandayutham, K.; Murphy, J. Subsea superconductors: The future of offshore renewable energy transmission? Renew. Sustain. Energy Rev. 2022, 156, 111943. [Google Scholar] [CrossRef]
  36. Bracco, M.; Balbo, A.; Bruzek, C.-E.; Breschi, M.; Cavallucci, L.; Farinon, S.; Macchiagodena, A.; Mangiulli, G.; Musenich, R.; Soldati, L.; et al. Design of a Submarine 30-km MgB 2 Cable for the Combined Transfer of 0.3 GW e and LH 2 from Offshore Plants to the Ravenna Port. IEEE Trans. Appl. Supercond. 2025, 35, 1–6. [Google Scholar] [CrossRef]
  37. ERM. Opportunity for the World’s First Combined Floating Wind and Green Hydrogen Project Off the East Coast of Scotland. Available online: https://www.erm.com/about/news/opportunity-for-the-worlds-first-combined-floating-wind-and-green-hydrogen-project-off-the-east-coast-of-scotland/ (accessed on 4 December 2024).
  38. RSE. AEOLIAN. Available online: https://atlanteeolico.rse-web.it/ (accessed on 4 December 2024).
  39. IEA 15 MW Offshore Reference Turbine. Available online: https://github.com/IEAWindTask37/IEA-15-240-RWT/ (accessed on 4 December 2024).
  40. Serri, L.; Lanni, F.; Manzini, G. Sistemi Ibridi Offshore: Aspetti di Integrazione di Eolico Offshore e Produzione di Idrogeno nel Contesto Italiano. 2022. Available online: https://www.rse-web.it/rapporti/sistemi-ibridi-offshore-aspetti-di-integrazione-di-eolico-offshore-e-produzione-di-idrogeno-nel-contesto-italiano/ (accessed on 4 December 2024).
  41. Simple Levelised Cost of Energy Calculation. Available online: https://www.nrel.gov/analysis/tech-lcoe-documentation.html (accessed on 4 December 2024).
  42. Liponi, A.; Baccioli, A.; Ferrari, L.; Desideri, U. Techno-economic analysis of hydrogen production from PV plants. E3S Web Conf. 2022, 334, 01001. [Google Scholar] [CrossRef]
  43. Idel, R. Levelized Full System Costs of Electricity. Energy 2022, 259, 124905. [Google Scholar] [CrossRef]
  44. Osk Gardarsdottir, S.; Voldsund, M.; Roussanaly, S. Comparative Techno-Economic Assessment of Low-CO2 Hydrogen Production Technologies. HYPER Closing Seminar 2019-12-10. Available online: https://www.sintef.no/globalassets/project/hyper/presentations-day-1/day1_1200_gardarsdottir_comparative-techno-economic-assessment-of-low-co2-hydrogen-production-technologies_sintef.pdf (accessed on 14 April 2025).
  45. Lanni, F.; Serri, L. Parchi Eolici Offshore Galleggianti: Approfondimenti Relativi a Cavi, Ancoraggi, Installazione, Occupazione Creata e Emissioni Evitate, 2022 Rapporto RdS n. 22014020. Available online: https://www.rse-web.it (accessed on 4 December 2024).
  46. Hall, M.; Lozon, E.; Devoy McAuliffe, F.; Baudino Bessone, M.; Bayati, I.; Bowie, M.; Bozonnet, P.; Castagne, M.; Feng, J.; Housner, S.; et al. The IEA Wind Task 49 Reference Floating Wind Array Design Basis; Technical Report NREL/TP-5000-89709; NREL (National Renewable Energy Laboratory): Golden, CO, USA, 2024; Available online: https://www.nrel.gov/docs/fy24osti/89709.pdf (accessed on 4 December 2024). [CrossRef]
  47. Evan, G.; Rinker, J.; Sethuraman, L.; Zahle, F.; Anderson, B.; Barter, G.; Abbas, N.; Meng, F.; Bortolotti, P.; Skrzypinski, W.; et al. Definition of the IEA 15-Megawatt Offshore Reference Wind; NREL/TP-5000-75698; NREL (National Renewable Energy Laboratory): Golden, CO, USA, 2020; Available online: https://www.nrel.gov/docs/fy20osti/75698.pdf (accessed on 4 December 2024).
  48. IRENA. Green Hydrogen Cost Reduction: Scaling Up Electrolysers to Meet the 1.5 °C Climate Goal; International Renewable Energy Agency: Abu Dhabi, United Arab Emirates, 2020. [Google Scholar]
  49. Krishnan, S.; Koning, V.; Theodorus de Groot, M.; de Groot, A.; Granados Mendoza, P.; Junginger, M.; Kramer, G.J. Present and future cost of alkaline and PEM electrolyser stacks. Int. J. Hydrogen Energy 2023, 48, 32313–32330. [Google Scholar] [CrossRef]
  50. Babarita, A.; Gilloteauxa, J.-C.; Clodic, G.; Maxime Simoneau, A.; Platzer, M.F. Techno-economic feasibility of fleets of far offshore hydrogen-producing wind energy converters. Int. J. Hydrogen Energy 2018, 43, 7266–7289. [Google Scholar] [CrossRef]
  51. Setti, L.; Sandri, S. Studio Sulla Sostenibilità Economica Della Filiera di Produzione di Idrogeno Verde per una Hydrogen Backbone Italiana. Available online: https://www.qualenergia.it/wp-content/uploads/2022/07/Studio-idrogeno-ReCommon.pdf (accessed on 4 December 2024).
  52. Roeder, T.; Rosenstiel, A.; Monnerie, N.; Sattler, C. Impact of expected cost reduction and lifetime extension of electrolysis stacks on hydrogen production costs. Int. J. Hydrogen Energy 2024, 95, 1242–1251. [Google Scholar] [CrossRef]
  53. Burke, A.; Ogden, J.; Fulton, L.; Cerniauskas, S. Hydrogen Storage and Transport: Technologies and Costs; Reference No. UCD-ITS-RR-24-17; Institute of Transportation Studies UC Davis: Davis, CA, USA, 2024. [Google Scholar]
  54. Vidas, L.; Castro, R.; Bosisio, A.; Pires, A. Optimal sizing of renewables-to-hydrogen systems in a suitable-site-selection geospatial framework: The case study of Italy and Portugal. Renew. Sustain. Energy Rev. 2024, 202, 114620. [Google Scholar] [CrossRef]
  55. Connelly, E.; Penev, M.; Elgowainy, A.; Hunter, C. Current Status of Hydrogen Liquefaction Cost; DOE (Department of Energy) Hydrogen and Fuel Cells Program Record; United States Department of Energy: Washington, DC, USA, 2019; Available online: http://hydrogen.energy.gov/docs/hydrogenprogramlibraries/pdfs/19001_hydrogen_liquefaction_costs.pdf?Status=Master (accessed on 14 April 2025).
  56. IEA. Levelised Cost of Hydrogen Maps. Available online: https://www.iea.org/data-and-statistics/data-tools/levelised-cost-of-hydrogen-maps (accessed on 4 December 2024).
  57. Spazzafumo, G.; Raimondi, G. Economic assessment of hydrogen production in a Renewable Energy Community in Italy; e-Prime-Advances in Electrical Engineering. Electron. Energy 2023, 4, 100131. [Google Scholar] [CrossRef]
Figure 1. Scheme of the ORCH2P (offshore renewable centralised hydrogen production with pipeline) system configuration for a floating offshore wind farm. Under the sea level, the intra-array electrical cables are coloured blue, while the export pipeline is coloured brown (Source RSE).
Processes 13 01219 g001
Figure 2. Scheme of the ORDH2P (offshore renewable decentralised hydrogen production with pipeline) system configuration for a floating offshore wind farm. Under the sea level, all pipelines are coloured brown: the intra-array pipelines have a smaller diameter, while the export pipeline has a larger diameter. The black box represents a collector that connects the intra-array pipelines to the export pipeline (Source RSE).
Processes 13 01219 g002
Figure 3. Scheme of the ORCH2S (offshore renewable centralized hydrogen production with storage) system configuration for a floating offshore wind farm. Under the sea level, the intra-array electrical cables are coloured blue. The centralised offshore platform hosts a storage system, which in the figure functions as a refuelling hub for ships carrying hydrogen or powered by it (Source RSE).
Processes 13 01219 g003
Figure 4. Position of the two case studies on the map of mean annual wind speed at 150 m a.s.l. (source RSE).
Processes 13 01219 g004
Figure 5. LCOH for the ORCH2P configuration at varying Peff (80%, 85%, 90%) and WACC (5%, 7%). Blue: Emilia-Romagna, red: Sicily.
Processes 13 01219 g005
Figure 6. LCOH for the ORDH2P configuration at varying Peff (80%, 85%, 90%) and WACC (5%, 7%). Blue: Emilia-Romagna; red: Sicily.
Processes 13 01219 g006
Figure 7. LCOH for the ORCH2S configuration at varying Peff (75%, 80%, 85%) and WACC (5%, 7%). Blue: Emilia-Romagna; red: Sicily.
Processes 13 01219 g007
Figure 8. LCOH for the ORCH2P configuration at varying Cstack (15%, 30%, 45%) and WACC (5%, 7%) and Peff (85%). Blue: Emilia-Romagna; red: Sicily.
Processes 13 01219 g008
Figure 9. LCOH for the ORDH2P configuration at varying Cstack (15%, 30%, 45%) and WACC (5%, 7%) and Peff (85%). Blue: Emilia-Romagna; red: Sicily.
Processes 13 01219 g009
Figure 10. LCOH for the ORCH2S configuration at varying Cstack (15%, 30%, 45%) and WACC (5%, 7%) and Peff (80%). Blue: Emilia-Romagna; red: Sicily.
Processes 13 01219 g010
Table 1. Components considered for the techno-economic evaluations in the three configurations (An “X” indicates the component is considered, while “-” indicates it is not.).
ComponentORCH2PORDH2PORCH2S
Wind turbinesXXX
Floating platform or fixed foundationXXX
Intra-array electric cablesX-X
Export electric cables---
Electrolysers and auxiliary systemsXXX
Desalination plantXXX
Intra-array pipelines-X-
Pipeline collection system-X-
Export pipelineXX-
Hydrogen liquefaction and storage system--X
Table 2. Geomorphological and environmental characteristics of the considered case studies referred to the centroid of the park unless otherwise indicated.
ParameterSicilyEmilia-Romagna
Minimum distance from the coast [km]7034
Average seabed depth [m]40036
Annual average wind speed @ 150 m a.s.l.7.835.90
Table 3. Estimated cost of main offshore wind farm components in a commercial scenario [45].
ComponentUnitCost Fixed FoundationCost Floating Platform
Development and consenting% CAPEXw3.83.8
Wind turbine + foundationM EUR/MW1.451.73
Anchoring and mooringM EUR/MW-0.12
Intra-array connectionM EUR/MW0.0530.145
Installation% CAPEXw8.28.4
OPEXw% CAPEXw55
Table 4. Estimated cost for electrolyser, pipeline, and storage main components in a commercial scenario.
ComponentsUnitCostSource
Electrolyser and auxiliary systemsEUR/kW500[40]
Electrolyser stack replacement% CAPEXe15–30–45[40,49,54]
Offshore substationM EUR100Est. from [45]
Pipeline collection substationk EUR50Est. from [45]
Intra-array and export pipelineM EUR/GW/km0.96[40]
OPEXe electrolyser% CAPEXe4[40]
OPEXe pipeline% CAPEXe4[40]
OPEXe substation% CAPEXe7[40]
Liquefaction and storage systemEUR/kg0.9[53]
Table 5. Wind production calculation in the two case studies for the centralised and decentralised configuration.
QuantityORCH2
Sicily Case
ORDH2
Sicily Case
ORCH2
Emilia-Romagna Case
ORDH2
Emilia-Romagna Case
GAEP (MWh/a)3,892,3663,892,3662,295,4162,295,416
Overall wind farm losses (%)7.587.58
NAEP (MWh/a)3,600,4383,580,9762,308,2592,295,782
FLHs (hours)3600358123082296
Capacity factor (%)40.940.726.226.1
Table 6. Oversize factors calculated in the three different offshore configurations in the two case studies expressed varying Peff.
Sicily CaseEmilia-Romagna Case
ParameterORCH2PORDH2PORCH2SORCH2PORDH2PORCH2S
Peff (%)808075808075
OF (-)1.41.41.52.22.22.3
Peff (%)858580858580
OF (-)1.31.31.42.12.12.2
Peff (%)909085909085
OF (-)1.21.21.31.91.92.1
Table 7. LCOE calculated in the two case studies for the centralized and decentralized configurations with two WACC values.
LCOE (EUR/MWh)—Wind Farms Dedicated to Offshore Hydrogen Production.
Sicily CaseEmilia-Romagna Case
WACCORCH2PORDH2PORCH2SORCH2PORDH2PORCH2S
5%72.967.672.989.785.889.7
7%85.579.485.5105.3100.7105.3
Table 8. Calculated LCOH for the different configurations with different Peff (Cstack 30%—WACC 5%).
Sicily CaseEmilia-Romagna Case
ParameterORCH2PORDH2PORCH2SORCH2PORDH2PORCH2S
Peff (%)808075808075
LCOH (EUR/kg)5.14.66.05.85.67.0
Peff (%)858580858580
LCOH (EUR/kg)4.84.45.95.55.36.7
Peff (%)909085909085
LCOH (EUR/kg)4.64.25.65.25.16.4
Table 9. Calculated LCOH for the different configurations with different Peff (Cstack 30%—WACC 7%).
Sicily CaseEmilia-Romagna Case
ParameterORCH2PORDH2PORCH2SORCH2PORDH2PORCH2S
Peff (%)808075808075
LCOH (EUR/kg)5.95.46.86.86.68.0
Peff (%)858580858580
LCOH (EUR/kg)5.65.26.66.46.27.6
Peff (%)909085909085
LCOH (EUR/kg)5.44.96.46.15.97.3
Table 10. Calculated LCOH for the different configurations with different Cstack (Peff 85 and 80%—WACC 5%).
Sicily CaseEmilia-Romagna Case
ParameterORCH2PORDH2PORCH2SORCH2PORDH2PORCH2S
Cstack (% CAPEX)151515151515
LCOH (EUR/kg)4.74.35.85.45.26.6
Cstack (% CAPEX)303030303030
LCOH (EUR/kg)4.84.45.95.55.36.7
Cstack (% CAPEX)454545454545
LCOH (EUR/kg)4.94.56.05.65.46.7
Table 11. Calculated LCOH for the different configurations with different Cstack (Peff 85 and 80%—WACC 7%).
Sicily CaseEmilia-Romagna Case
ParameterORCH2PORDH2PORCH2SORCH2PORDH2PORCH2S
Cstack (% CAPEX)151515151515
LCOH (EUR/kg)5.55.16.56.36.17.5
Cstack (% CAPEX)303030303030
LCOH (EUR/kg)5.65.26.66.46.27.6
Cstack (% CAPEX)454545454545
LCOH (EUR/kg)5.75.36.76.56.37.7
Table 12. Ratio between LCOE and LCOH in the Emilia-Romagna site and LCOE and LCOH in the Sicily site for the three configurations (Cstack 30%, WACC 5%).
ParameterORCH2PORDH2PORCH2S
Peff (%)858580
L C O E S i c i l y L C O E E M I L I A R O M A G N A (%)81.378.881.3
L C O H S i c i l y L C O H E M I L I A R O M A G N A (%)87.383.088.1
Disclaimer/Publisher’s Note: The statements, opinions and data contained in all publications are solely those of the individual author(s) and contributor(s) and not of MDPI and/or the editor(s). MDPI and/or the editor(s) disclaim responsibility for any injury to people or property resulting from any ideas, methods, instructions or products referred to in the content.

