Abstract
There are numerous quantities and types of electrical loads, and their electrical characteristics have similarities and differences. To adapt to the development trend of refined management and scheduling on the load side, it is necessary to explore the electricity consumption patterns of loads and classify them. However, the classification performance is affected by data redundancy, the complexity of feature selection, and the diversity of power consumption behavior. To adapt to the development trend of refined management and scheduling on the load side, it is imperative to classify loads based on their electrical characteristics. Firstly, based on a statistical analysis of load-side electricity consumption data, the monthly electricity consumption of each load throughout the year is extracted to reflect the continuous electricity consumption characteristics of each load. By calculating the annual load rate, maximum load utilization hours, and rated capacity of each load and then using a Gaussian Mixture Model (GMM) for clustering analysis, the discrete electricity consumption characteristics of each load are obtained. Then, based on the K-prototypes clustering model, a load classification method is proposed based on continuous and discrete hybrid electricity characteristics. By setting the weight between continuous and discrete electrical characteristics, the optimal number of categories can be determined through the elbow method. Finally, using 86 industrial electricity-consuming enterprises in a region of Northwest China as experimental subjects, the results demonstrate that the method proposed in this study outperforms the K-means, GMM, and Gower.
1. Introduction
With the continuous popularization of smart meters, a vast amount of electricity consumption data have been accumulated on the load side. Based on these data, numerous scholars have undertaken in-depth research on the load side’s electricity usage across various aspects, including load forecasting [1,2,3], load clustering, user profiling [4,5], and anomaly detection [6], of electricity consumption. Concurrently, as the process of electrification accelerates, electrical loads are becoming increasingly diverse and complex. Different industries and types of electrical loads exhibit distinct electricity consumption characteristics, which poses significant challenges for power grid companies in classifying and managing all electricity users within a region and in conducting power dispatch operations. Therefore, it is essential to analyze the electricity consumption data on the load side, categorize users with similar electricity consumption features into the same group, and develop tailored power supply and distribution strategies based on the unique electricity usage habits of different user types [7]. However, the extraction of multi-dimensional power consumption features from extensive historical operational data to characterize the differences among various loads and the classification of these loads based on such features remain critical issues that need to be addressed.
In recent years, domestic and foreign scholars have carried out a great deal of research on the classification of power loads. Based on load data, several results about load classification have been achieved. In the literature [8], two dimensional spaces of monthly and annual electricity consumption were established. The subspace clustering results of all power loads were obtained by taking the membership degree of loads to different subspace electricity consumption patterns as coordinates, and then the classification of power loads was realized. In the literature [9], after extracting the typical load curves of each load, a time series clustering algorithm was used to classify power loads. The literature [10] proposed a multi-resolution clustering method, which directly classifies end customers based on smart meter data. By improving the K-means clustering algorithm, the literature [11] classified loads with similar or the same load characteristics into the same category and performed secondary clustering of loads to realize the fine division of different types of load characteristic curves. On the basis of extracting typical load curves, the literature [12] proposed a dual-scale spectrum clustering method to cluster load curves. On the basis of considering seasonal loads, the literature [13] divided a power load into a base load and a sensitive load affected by other factors, and it used the Gaussian Mixture Model (GMM) clustering algorithm to divide loads. In addition, k-medoids, hierarchical clustering, fuzzy C-means, and other clustering algorithms can also be used to classify loads according to load data [14,15,16,17,18]. The clustering method using only the load data set that classifies users can directly display the consumption behavior habits of different categories of electricity users; it cannot quantify the power consumption characteristics of electricity loads.
Some scholars cluster loads indirectly based on the extracted load mode or other forms of power consumption behavior characteristics [19,20,21,22,23,24,25]. Table 1 shows a review of such works in the methodology and selection of features. In the literature [19], a random forest algorithm was introduced to select power consumption features from the original feature set, and the authors built a multidimensional power consumption feature labeling system. On the basis of extracting eight characteristic indicators of load, the literature [20] adopted a singular-value decomposition method to reduce the dimension of data and adopted a K-means algorithm to cluster the load characteristics. In the literature [21], electricity consumption characteristics of different users were classified from the perspectives of enterprise production and operation period, holidays, working days, production load, etc., and the authors achieved the classification of users. The literature [22] used the ReliefF algorithm to extract and weight 14 features closely related to electricity consumption patterns. The literature [23] identified nine characteristics of power load and utilized these features to build a database of electricity consumption behavior labels. The K-means clustering algorithm was applied to classify 2000 industrial and commercial users based on these features. The literature [24] developed a multi-dimensional load feature evaluation index system using the electricity consumption data from community users within a smart grid context. It then employed an enhanced K-means algorithm to ascertain the optimal number of user categories and performed clustering analysis on electricity consumption features. The literature [25] extracted five indicators, including daily electricity consumption, daily off-peak and peak values, seasonal fluctuations, electricity arrears rate, and price sensitivity. Based on these indicators, the K-means algorithm was employed to cluster electricity users in a certain region. The clustering method that only uses load characteristic indicators can indirectly quantify the power consumption behavior characteristics of loads and achieve user classification. Although this method can reduce the dimensionality of data and simplify the clustering analysis process, it may result in information loss and cannot fully reflect the electricity consumption patterns of each load.

Table 1.
A review of load classification based on features.
To summarize, existing methods predominantly focus on either fluctuation characteristics or characteristic indicators for load classification. An approach based exclusively on the fluctuation characteristics of load data lacks the ability to quantify electricity consumption features. Conversely, relying solely on characteristic indicators may result in information loss. Neither strategy provides an accurate and comprehensive depiction of electricity consumption characteristics. Therefore, to achieve a more comprehensive and precise representation of electricity consumption behavior, the integration of both load data and load characteristic indicators is essential.
Inspired by the above literature studies, this paper proposes a load classification method based on hybrid clustering of extracted continuous and discrete electrical features. By calculating the electricity consumption of each load from 1 to 12 months, the continuous electricity consumption characteristics can be obtained and used as a numerical data set. By calculating the three characteristic indexes of the annual load rate, maximum load utilization hours and rated capacity, then clustering them, respectively, by using the GMM algorithm, the discrete electricity consumption characteristics can be obtained and used as a category-type data set. On this basis, a hybrid clustering model based on k-prototypes is built for the realization of effective classification of power loads according to continuous and discrete power consumption characteristics. The contributions of this paper are as follows:
- In addition to utilizing the continuous feature of historical load data, this paper also proposes three load characteristic indicators that can quantify user electricity consumption behavior to a certain extent. The hybrid electricity characteristics can more comprehensively describe the behavioral characteristics of the load side.
- Considering that different characteristic indicators often vary in magnitude and that power grid companies pay more attention to the relative level of each user’s characteristic indicators, the discrete power consumption characteristics are extracted by the GMM clustering algorithm based on the values of the indicators.
- On the basis of appropriately selecting the weights of continuous and discrete power consumption characteristics, a load classification method based on the K-prototypes hybrid clustering is proposed.
The remaining sections are as follows: Section 2 presents the relevant methodological research, including the extraction of load features, the classification process, and the clustering algorithm principle of GMM and K-prototypes. Section 3 describes the load classification method based on hybrid clustering, including the clustering process and the performance indicators used for evaluation. Section 4 provides an experimental analysis based on the proposed hybrid clustering algorithm, including the experimental process, results, and comparative experiments with other methods. Section 5 provides a comparative discussion of the proposed method in this paper with other related methods. Section 6 summarizes the work and contributions and discusses potential directions for future research.
2. Methodology
This section aims to detail the methodologies employed in extracting continuous and discrete electricity consumption features from power big data and to explain the underlying principles of the clustering algorithms utilized in the user classification process.
2.1. Data Analysis and Feature Extraction
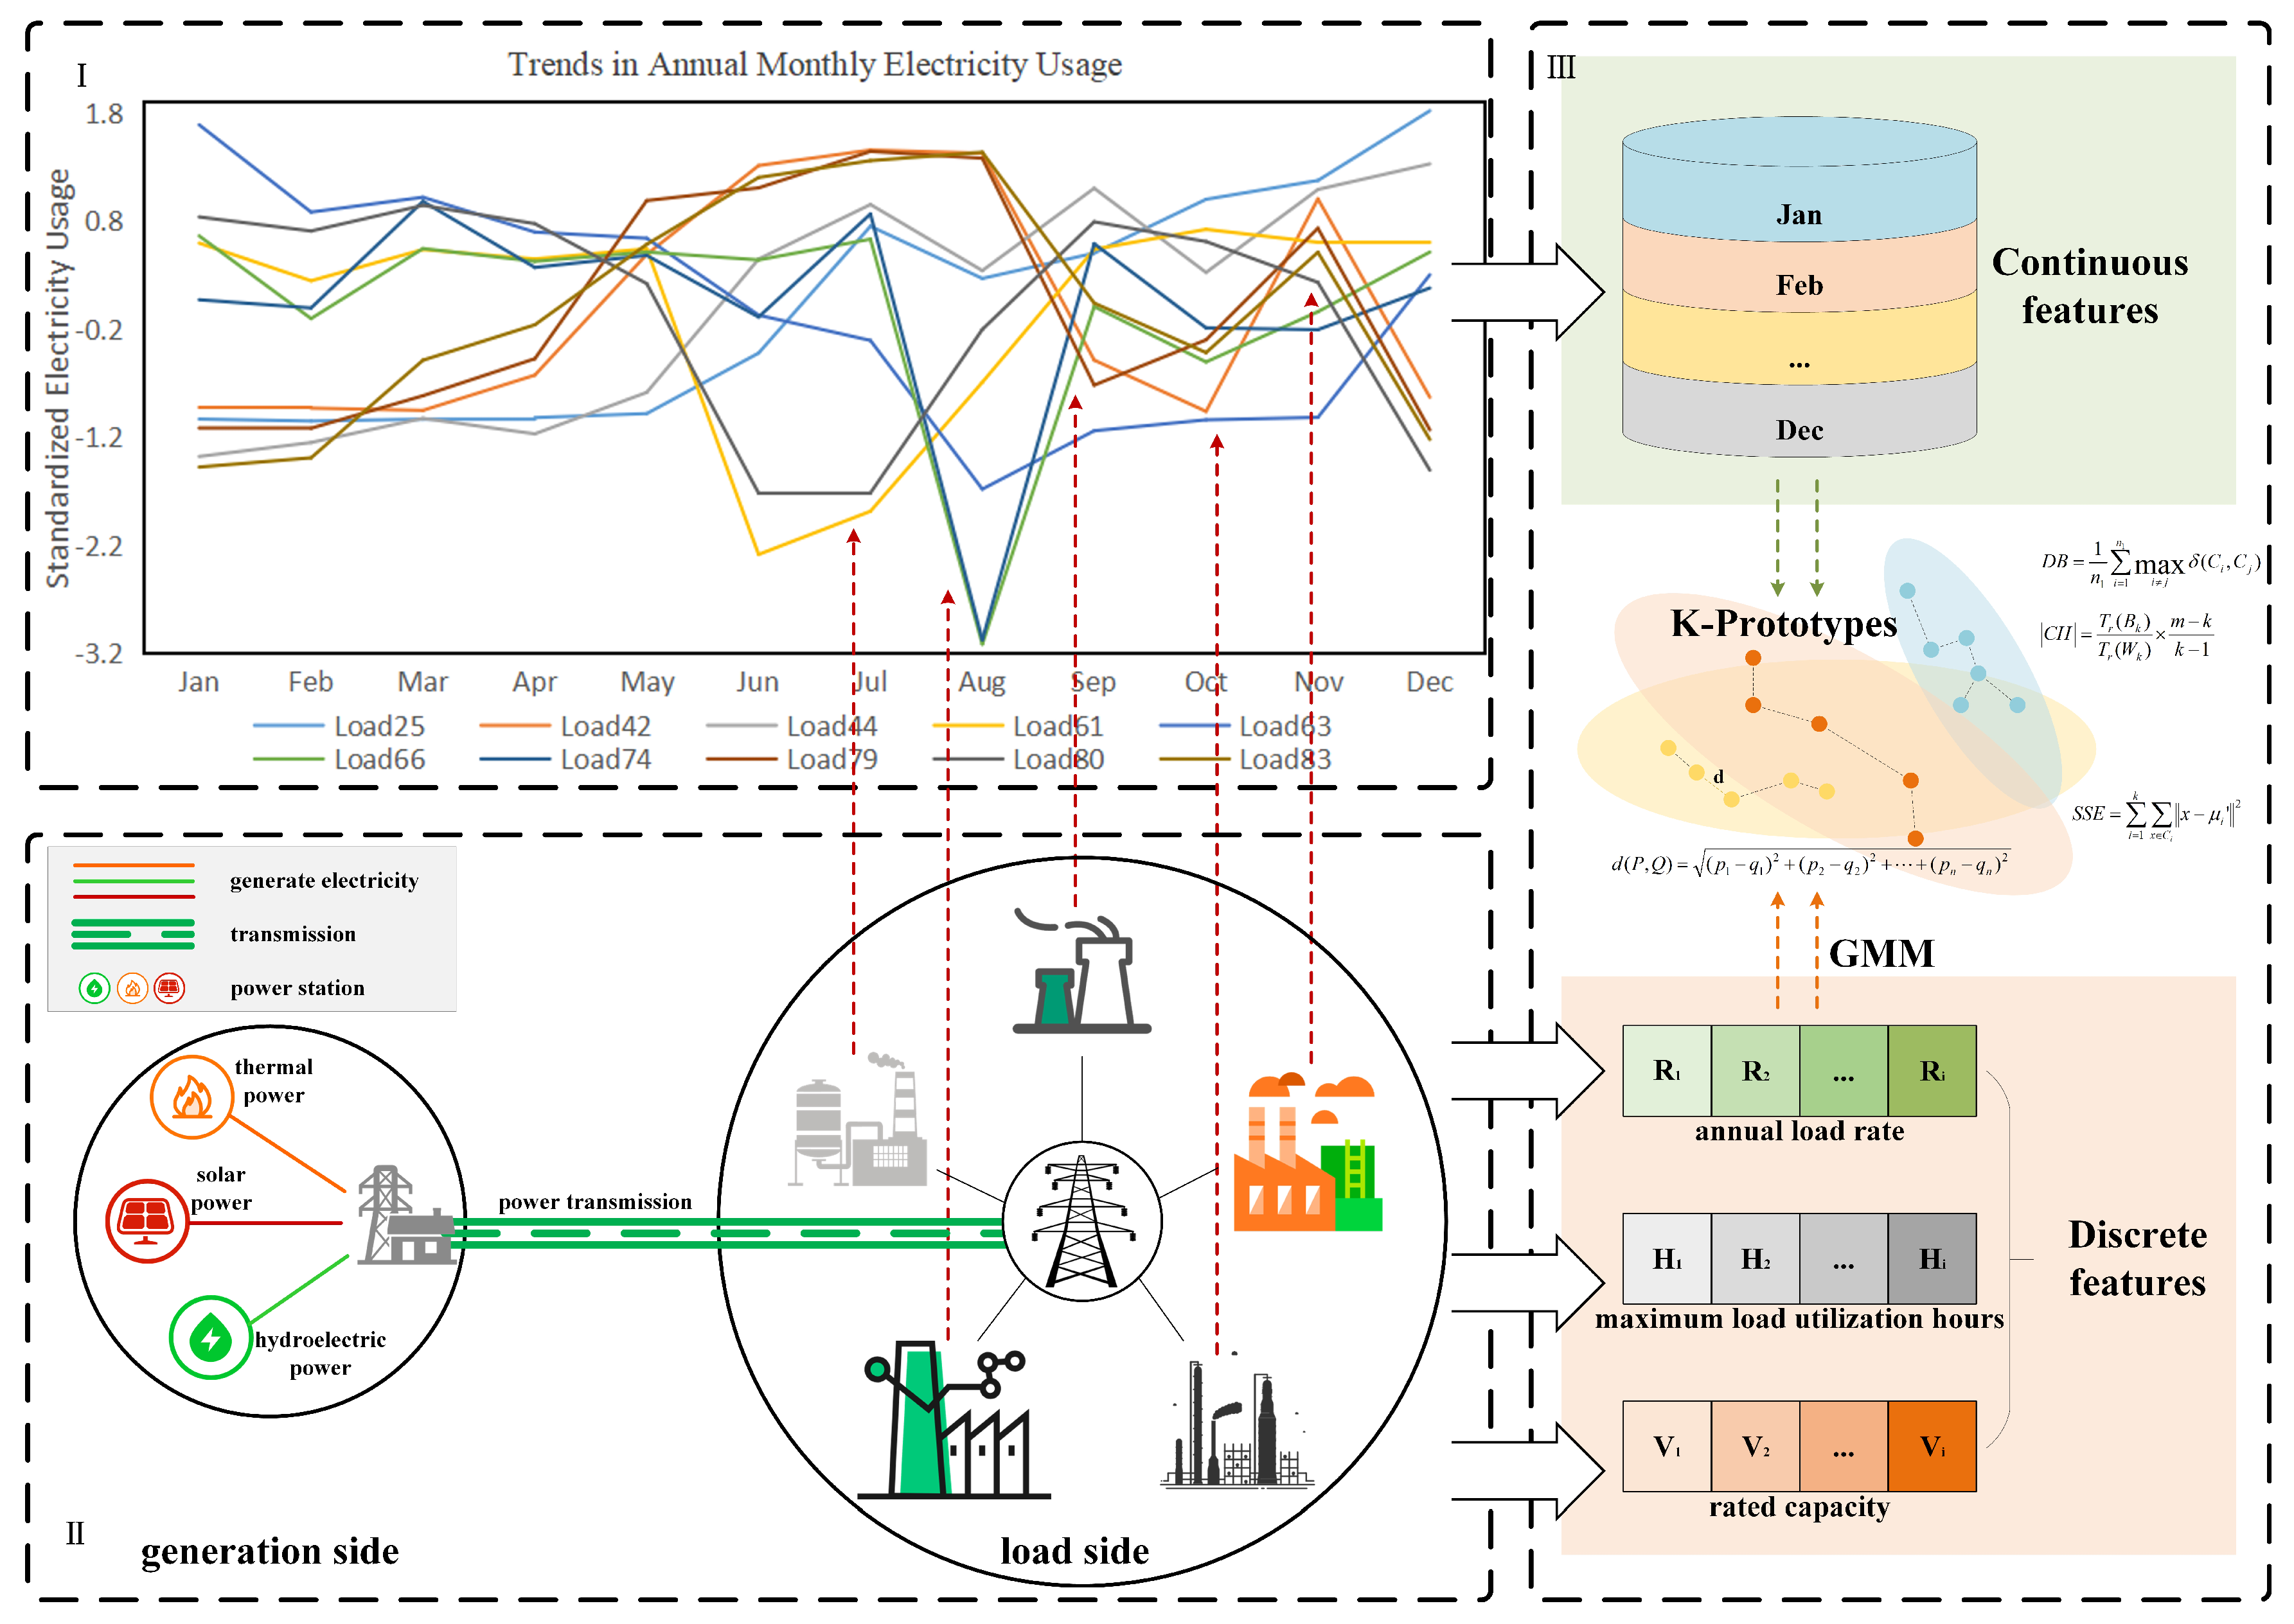
The data analysis is performed in accordance with the workflow depicted in Figure 1. Continuous electricity consumption characteristics are extracted from load data, and discrete electricity consumption features are extracted in combination with the enterprises’ own attributes to cluster and classify different electricity consumption behaviors. Ten loads are randomly selected to plot their electricity consumption data from January to December after Z-score standardization, and the annual monthly electricity consumption trend chart is shown in Figure 1I, which demonstrates that enterprises on the load side exhibit diverse patterns of electricity consumption behavior, with varying electricity demands across different periods.
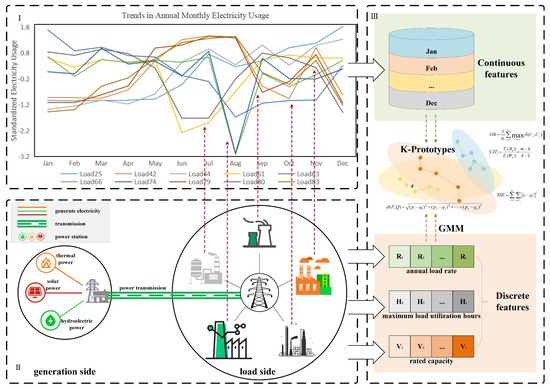
Figure 1.
Data analysis and Extraction of Continuous−Discrete Indicators. (I) shows the load curve of power consumers on the load side, enabling the extraction of continuous power consumption features. (II) depicts the transmission of electric energy generated at the power generation end to various types of load-side users, facilitating the extraction of discrete power consumption features. (III) presents the analysis and clustering of hybrid continuous-discrete power consumption features using the K-prototypes algorithm.
As shown in Figure 1I, the electricity consumption of load 66 (a smelting user) and load 74 (a material processing user) significantly decreased in August, while the electricity consumption fluctuation was relatively stable in the other months. The electricity consumption of load 42 (a cement manufacturing user), load 79 (a water conservancy user), and load 83 (a water conservancy user) gradually increased from January to May and remained consistently high from June to August; and between September and December, the demand in November was relatively high, while the demand in other months was relatively low. From this, it can be inferred that although there are differences in the continuous fluctuation characteristics of the total monthly electricity consumption for these 10 loads, some loads still exhibit a similar pattern in the trend of the continuous electricity consumption curve from January to December in the time series. Therefore, the differences and similarities in the continuous electricity consumption characteristics are important bases for load classification.
The fluctuation curve of electricity consumption of loads from January to December reflects the dynamic change of electricity demand and behavior habits of loads and can be used as one of the characteristics of continuous electricity consumption. Since the order of magnitude of monthly electricity consumption of different loads is not consistent, the electricity consumption of each load is standardized by Z-score:
where represents the electricity consumption of the i-th load in the j-th month, is the average monthly electricity consumption of the i-th load over 12 months, is the standard deviation of monthly electricity consumption for the i-th load over the same period, and represents the standardized electricity consumption of the i-th load in the j-th month.
Some parameters used in our proposed user classification method are shown in Table 2. To provide a more comprehensive view of loads’ electricity consumption traits, the three load characteristic indexes of annual load rate, maximum load utilization hours, and rated capacity can be selected to reflect the power consumption characteristics of loads.
Table 2.
Parameter nomenclature.
The annual load rate describes the ratio of the average load to the maximum load in a year, which can reflect the peak valley difference of the load. If the annual load rate is high, it indicates that the power grid load is relatively average and the peak valley difference is small, and vice versa. Its calculation formula is as follows:
where is the average annual electricity consumption and is the maximum electricity consumption.
Maximum load utilization hours refer to the number of hours that can be sustained when the actual annual electricity consumption of the power user is operated at the maximum load. When this index is higher, the load value at the peak for the power user is closer to the daily load value, and the load change is relatively stable; on the contrary, when this index is lower, the load at the peak for the power user is significantly larger than the daily load, and the load change is more drastic. Its calculation formula is as follows:
where is the annual total electricity and is the maximum load power in the year.
The rated capacity is usually set by the power provider based on the user’s equipment capacity and electricity demand and the carrying capacity of the grid, and it is the maximum amount of electricity that the user can safely use at any given time. This indicator can help users calculate the energy efficiency and operating costs of the equipment, as it is directly related to the energy consumption and output of the equipment.
Through the above calculation, the data set composed of the corresponding annual load rate, maximum load utilization hours, and rated capacity of power loads is recorded as :
However, in the process of actual regional power user analysis, the power grid company pays more attention to the level of each user’s feature indicators, that is, whether the feature indicator of a user is at a higher level or a lower level than that of other users in the region. At the same time, the feature indicators are often different in order of magnitude, for example, the annual load rate ranges from 0 to 1, and the maximum load utilization hours range from 0 to 8760. Therefore, the actual value of the feature indicators is not directly used as the cluster variable in this paper, but the index value is first classified, and then the regional load is classified based on the corresponding category of the index and the historical load data. The GMM clustering algorithm is used to cluster each column of data, and the specific category number corresponding to each index constitutes the discrete power consumption feature data set :
where , , and are, respectively, the annual load rate, maximum load utilization hours, and rated capacity corresponding to load i. , , and are the categories of , , and , respectively. That is, when the first column of is divided into class a, the possible value of ranges from 1 to a; if belongs to class 3, then .
2.2. GMM Clustering Principle
To extract discrete electricity consumption features, the GMM clustering algorithm is employed. This probabilistic clustering method is based on the assumption that the data are derived from a mixture of several Gaussian distributions.
In the GMM model, each Gaussian distribution is defined by its mean () and variance (), which together determine the shape and location of the distribution. The goal of GMM clustering is to identify a set of parameters that maximize the likelihood of the data given the Gaussian distributions specified by these parameters. In particular, for each feature indicator, the optimal classification is determined by optimizing the following objective function :
where is the weight of the k-th Gaussian distribution, is the probability density function of the i-th sample belonging to the k-th Gaussian distribution, N is the total number of samples, and K is the number of Gaussian distributions.
By employing GMM clustering, the values of each feature indicator are mapped onto specific categories, resulting in a discrete data set of electricity consumption features. When integrated with continuous features, these discrete features offer a robust and comprehensive data basis for constructing the K-prototypes hybrid clustering model.
2.3. K-Prototypes Clustering Principle
The traditional K-means clustering algorithm is only suitable for processing numerical data, but in practical engineering problems, it is often necessary to consider other category attribute data. The K-modes algorithm is an effective algorithm for processing category data. In order to process numerical data and categorical data simultaneously, the work [26] integrated the characteristics of K-means and K-modes clustering algorithms and proposed the K-prototypes hybrid clustering algorithm. At present, the K-prototypes algorithm has been widely used in load clustering [7], data retrieval [27], anomaly detection [28], medical treatment [29], and other fields. Therefore, the K-prototypes hybrid clustering algorithm is selected to partition the load, which is highly applicable for processing the mixed data sets in this paper.
In the clustering process, different distance measures are used for different types of data. For numerical features, Euclidean distance is used to measure the similarity between data points. For two points and in n-dimensional space, the Euclidean distance between them can be calculated using the following formula:
For categorical features, matching distance is adopted to measure the similarity between data points. This method returns 0 when the categories are completely matched and 1 otherwise. This measure is simple and effective, especially suitable for handling nominal or ordinal categories of data [26].
By changing the weight factor, the importance of numerical and categorical data in the clustering process can be balanced. The larger the value, the greater the influence of categorical features. In the K-prototypes clustering algorithm, the value can be set manually according to performance indicators and research requirements or calculated automatically based on the statistical characteristics of the data. The calculation formula is as follows:
where n is the number of columns of numerical features and is the standard deviation of numerical features in column i.
3. Load Classification Method
In this section, a hybrid clustering model based on the k-prototypes algorithm is introduced to classify loads. This method integrates the mixed data set of load power consumption features generated in Section 2 and the evaluation index system. Specifically, continuous power consumption features are treated as numerical data, whereas discrete power consumption features are considered as categorical data.
3.1. Classification Process
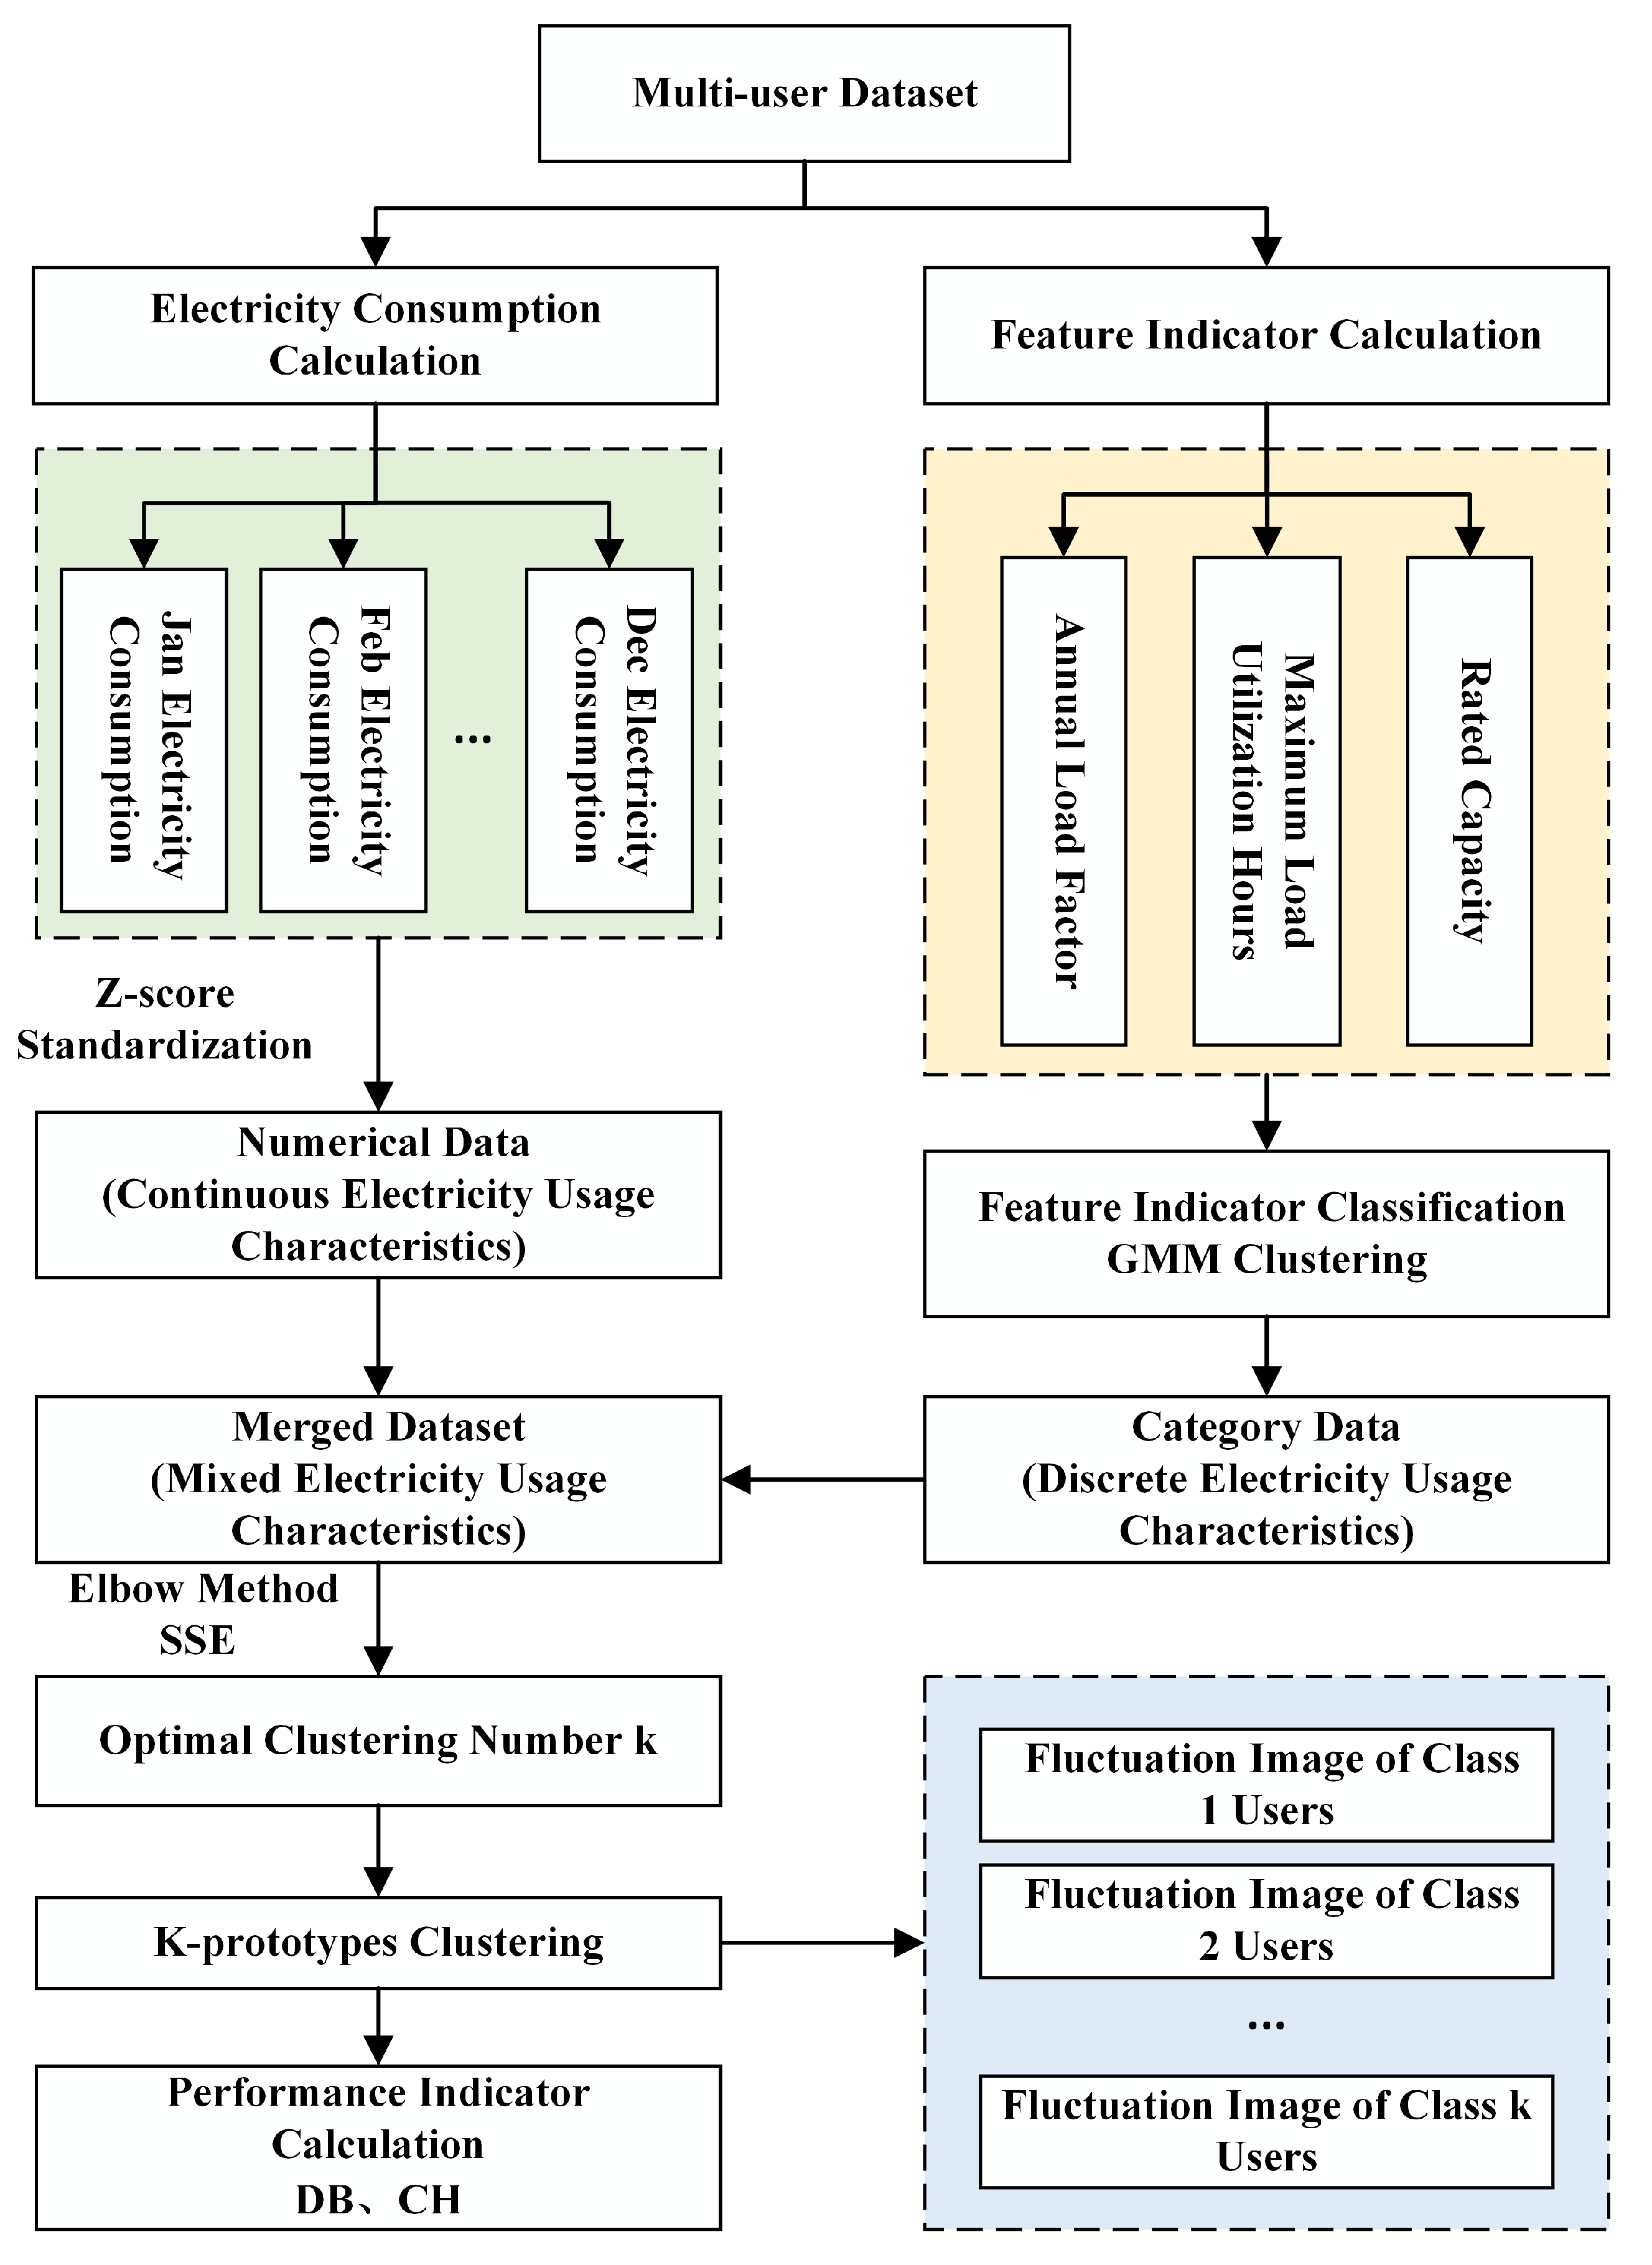
Based on the hybrid clustering method and the corresponding evaluation index system, the flow chart of the load division method proposed in this paper is shown in Figure 2.
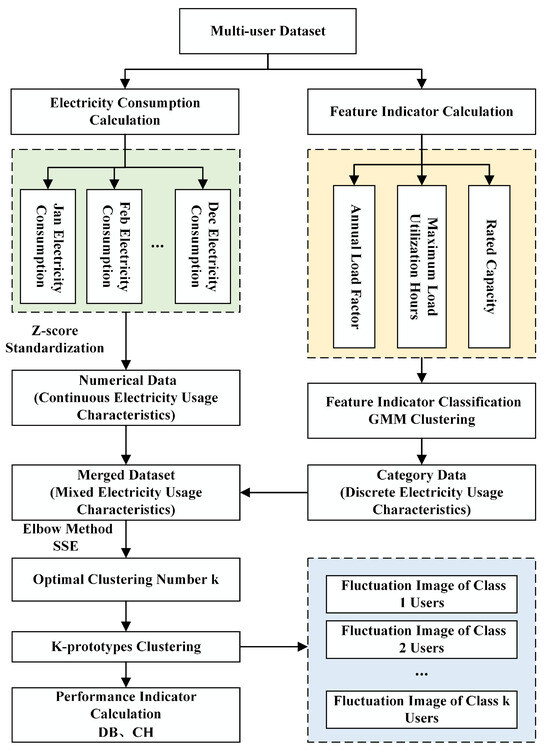
Figure 2.
Load classification process.
Firstly, the power consumption data set of each load from January to December is calculated, and the continuous power consumption characteristic data set is obtained by Z-score standardization.
Secondly, based on the formulas presented in Section 2, the annual load rate and maximum load utilization hours for each load are calculated. Subsequently, the GMM clustering algorithm is employed to categorize the annual load rate into clusters and the maximum load utilization hours into clusters. Furthermore, the rated capacity of the load is divided into categories. Through this multi-level clustering approach, a discrete power consumption characteristic data set is ultimately obtained.
Then, a hybrid data set is obtained by combining continuous and discrete data sets based on the above two steps, which are used as an input to a hybrid clustering model.
Moreover, the clustering process is optimized by adjusting the weights assigned to continuous and discrete electricity consumption features. The optimal number of clusters k is determined through the application of the elbow method.
Finally, the K-prototypes hybrid clustering model is established and used to achieve load classification, generating the load fluctuation curves for each user category and providing the corresponding values of the performance metrics DB and CH.
3.2. Performance Indicator
In this paper, several metrics are employed to evaluate the performance of the proposed load classification method. The SSE (sum of squared error) is chosen as the primary evaluation index for determining the optimal number of clusters. DB (Davies–Bouldin) and CH (Calinski–Harabasz) are selected to assess the clustering results comprehensively.
3.2.1. The SSE Indicator
The SSE measures the within-cluster variance and is calculated as the sum of the squared distances between each point and the centroid of its cluster. A lower SSE value indicates that the points in the cluster are closer to the centroid, suggesting better clustering quality. The calculation formula of the SSE is as follows:
where k is the number of clusters, is a cluster in the cluster, x is a point in the cluster, and is the mean of each data point in .
According to the SSE values corresponding to different cluster numbers, the elbow rule diagram can be drawn. Assuming that the optimal cluster number is k, when the cluster number is less than k, the SSE will rapidly decrease with the increase in k; when the cluster number is greater than k, the decrease rate of the SSE will significantly slow down with the increase in k.
3.2.2. The DB Indicator
The DB indicator evaluates the clustering by measuring the average silhouette score of each cluster, where a lower score indicates that clusters are more similar to their own cluster than to neighboring ones, hence indicating better clustering [30].
DB is calculated as the average ratio of the sum of the within-cluster distances to the smallest distance to the nearest cluster of a different label. For each cluster , the average distance from all internal points to the cluster center can be calculated as
where is the average tightness of the cluster , x is the sample point in the cluster, is the centroid of the cluster , and is the number of samples in the cluster .
Note that the centroid distance , under which the similarity of class clusters and is calculated as follows:
where and are the average tightness of the class clusters and , respectively.
Then the DB indicator is
where is the total number of class cluster pairs.
3.2.3. The CH Indicator
The CH indicator mainly determines the clustering effect by calculating the dispersion matrix between clusters of the same class and clusters of different classes separately [31]. The larger the CH index, the closer the data points within the same class of clusters and the lower the correlation between the data points among different class of clusters.
Specifically, the global centroid and the centroid of the class cluster are calculated as follows:
where is the entire data set, x is the sample point in the class cluster, and m is the total number of samples in the data set.
The calculation method of intra-class dispersion matrix and inter-class dispersion matrix is as follows:
Then the CH indicator is
where is the trace of the inter-class dispersion matrix, is the trace of the intra-class dispersion matrix, m is the total number of samples in the data set, and k is the number of class clusters.
4. Experiment and Analysis
In this section, the effectiveness and superiority of the proposed load classification method based on hybrid clustering are validated through experiments. The practical application outcomes of this method in electricity load classification are exhibited through the analysis of real data and performance comparisons with conventional methods.
4.1. Experimental Process and Parameter Setting
The data set utilized in this study is derived from the actual electricity consumption data of 86 enterprises in a region of northwest China in 2023, all of which are industrial users, such as mining, smelting, cement manufacturing, drainage, water conservancy, irrigation, material processing, etc.
In the experimental process, the annual load rate and the maximum load utilization hours are calculated through (2) and (3), and the rated capacity indicator can be obtained from the basic information of the power loads, from which the data set composed of these three characteristic indicators can be derived. Then, the GMM clustering algorithm is applied to classify the three characteristic indicators separately, dividing annual load rate and maximum load utilization hours into three categories and rated capacity into four categories; the results are shown in Table 3.
Table 3.
Classification of characteristic indicators.
Therefore, the discrete electricity consumption feature data set for this experiment can be obtained, where the first and second columns of the data set are composed of the numbers 1, 2, and 3 and the third column is composed of the numbers 1, 2, 3, and 4. Subsequently, the weight between continuous and discrete electricity consumption features is chosen as 0.453, and a K-prototypes hybrid clustering model is constructed.
Moreover, the elbow curve is plotted according to the SSE values corresponding to different cluster numbers, as shown in Figure 3. From this, it can be seen that when the number of clusters is five, the rate of decrease in the SSE value significantly slows down as the number of clusters increases further. Therefore, the optimal number of clusters is determined to be five, ultimately dividing the electricity loads into five categories.
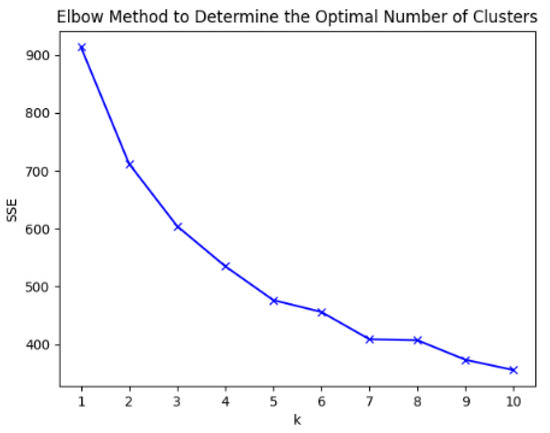
Figure 3.
Load classification flow chart.
4.2. Comparative Experiment and Results Analysis
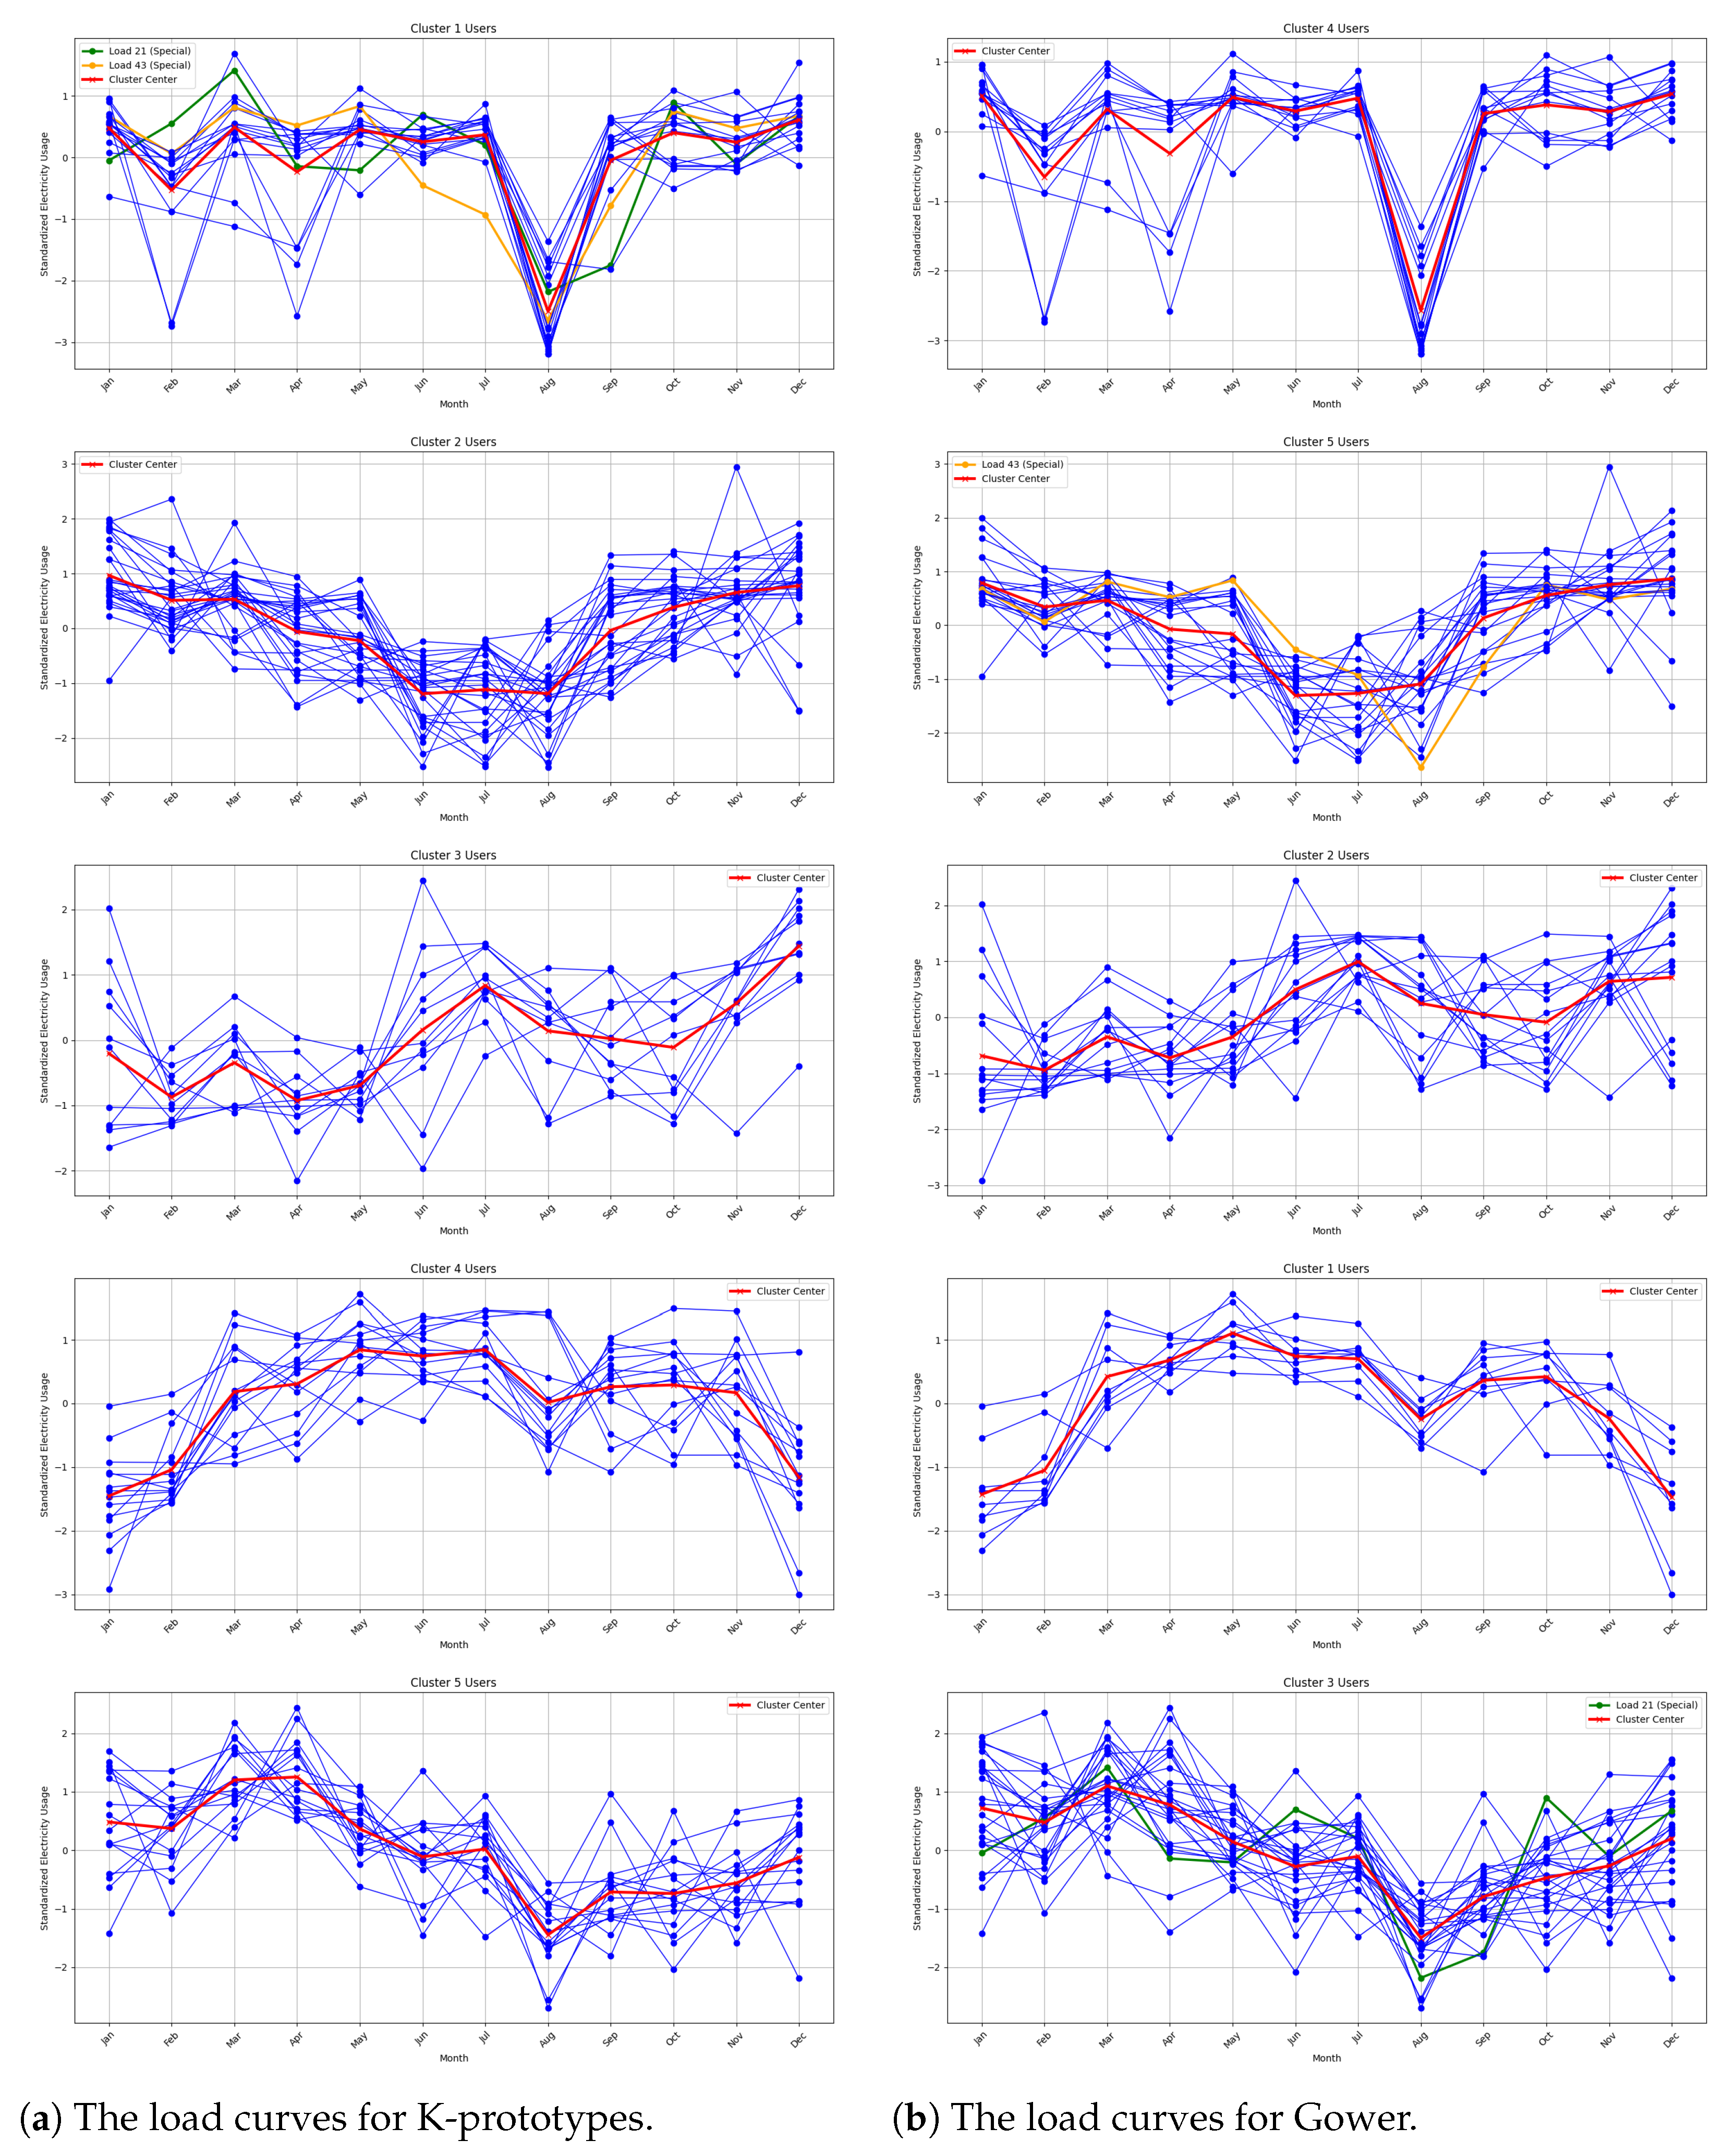
Based on the above experimental process, the clustering results of the K-prototypes algorithm is illustrated in Figure 4, and the performance is evaluated from the characteristics of image fluctuations and performance indicators. The figure shows the annual load fluctuation curves for electricity users in each cluster after classification. Specifically, the blue line indicates the individual load consumption pattern from January to December, while the red line represents the central tendency of each cluster.
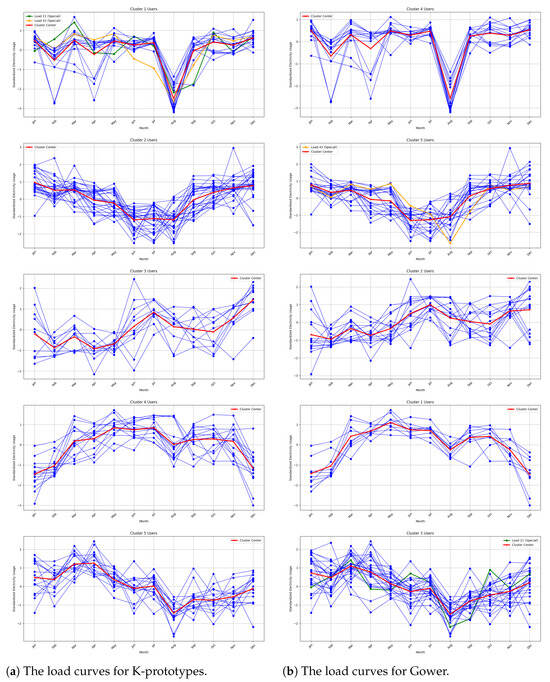
Figure 4.
Comparison of load curves for K-prototypes (a) and Gower (b) methods across five clusters.
Different types of loads demonstrate distinct behaviors in electricity consumption:
- Cluster 1: In this type of load in August, power consumption decreased significantly, while the other months showed relatively stable fluctuations, mainly for smelting and material processing industrial users, taking into account the impact of high summer temperatures.
- Cluster 2: In this type of load, from January to June, consumption decreased, from June to August it remained at a low level, and then it increased from August to December; this belongs to the summer low-load type, mainly including smelting and chemical loads.
- Cluster 3: The electricity demand of this type of load is low from February to May, and the electricity demand is high near July and December, mainly for railway-type users.
- Cluster 4: The annual electricity consumption of this type of load generally shows a trend of first rising and then declining; within this trend, the electricity consumption is relatively high from May to June, and the electricity demand is the lowest in January, mainly for water conservancy and cement manufacturing industry users.
- Cluster 5: The peak electricity consumption period for this type of load is between March and April, with the lowest electricity demand in August, which belongs to the spring high-load type, mainly for oil and gas industry users.
To illustrate the superior performance of the method proposed in this paper from the aspect of image fluctuation characteristics, the Gower algorithm is used as an example for comparison. As shown in Figure 4a,b, while the fluctuation trends of the five types of loads derived from the Gower algorithm are largely consistent with those from the K-prototypes algorithm, a small number of users are still misclassified. Specifically, load 21 (a mining user) and load 43 (a material processing user), represented by the orange and green curves in Figure 4, exhibit a significant decrease in electricity consumption in August and relatively smaller fluctuations in other months. These characteristics align with the first type of load curve, which is accurately captured by the K-prototypes algorithm. However, the Gower clustering algorithm incorrectly assigns these loads to the fifth and third categories, respectively. From the clustering results in Figure 4, it can be seen that the load classification method with hybrid power characteristics based on the K-prototypes algorithm has a better classification effect.
Moreover, comparative experiments using K-means and GMM algorithms are also conducted. To quantitatively compare clustering performance, the DB and CH indices of different clustering algorithms are evaluated. As shown in Table 4, the k-prototypes algorithm proposed in this paper based on continuous discrete hybrid power characteristics has the smallest DB value, which is reduced by 0.9%, 5.0%, and 8.1% compared with the K-means, GMM, and Gower algorithms, respectively. The CH value is the largest, which is increased by 0.2%, 2.0%, and 10.0% compared with the K-means, GMM, and Gower algorithms, respectively. The results show that the clusters formed by the proposed method have the largest spacing among different classes and the highest compact degree in the class.
Table 4.
Evaluation indicators for clustering algorithms.
Therefore, the proposed method in this paper is capable of more accurately identifying the electricity consumption patterns of different power loads and classifying them effectively. This offers significant references for power companies to develop targeted power supply strategies and optimize the operation of the power grid. For instance, based on the load classification results and electricity consumption behavior analysis from this study, the local power grid company can formulate power supply strategies in advance. Specifically, for the first type of power users, the company can plan to reduce the number of operating generating units in August, and for the fifth type of power users, considering that the peak electricity consumption period is concentrated in March and April, the company can plan to increase the number of operating generating units, thereby enhancing the economic efficiency of the power system.
5. Discussion
With the widespread adoption of smart meters, the analysis and application of power load data is a long-term task. In particular, load classification, which mainly focuses on mining and categorizing the electricity consumption patterns of enterprises on the load side, is crucial for refined power dispatch on the load side. In existing research, scholars mainly use time series clustering techniques such as K-means [10] and GMM [13] based on power load data to achieve load classification. Alternatively, they may use feature-extraction-based clustering techniques to analyze the electricity consumption behavior patterns of power loads [19,22]. However, these methods focus on classifying either load data or characteristic data alone, which limits their ability to provide a comprehensive reflection of the actual electricity consumption patterns exhibited by different types of enterprises.
Therefore, this study extracted three discrete feature indicators from the continuous time series of monthly electricity consumption of power users. By introducing weighting factors and integrating discrete features with continuous data on the monthly electricity consumption of users, a more accurate load classification has been achieved using the K-prototypes hybrid clustering method. However, the discrete features extracted in this study are relatively limited. In future work, it is possible to consider incorporating industry type and multi-time-scale discrete feature indicators to improve the effectiveness of load classification.
6. Conclusions
This paper proposes a load classification method based on hybrid clustering of continuous–discrete power features. Specifically, the continuous feature is represented by electricity consumption data spanning from January to December. Additionally, three discrete electricity consumption features are derived from the monthly electricity consumption data. By judiciously selecting weighting factors and employing the elbow method, the k-prototypes hybrid clustering model incorporating both continuous and discrete power consumption features is established. Experimental comparisons reveal that the proposed method outperforms the K-means, GMM, and Gower algorithms in terms of clustering performance, yielding the most effective and accurate classification of electrical loads. Specifically, when compared with the other three user classification methods, the proposed method achieved effective enhancements in both the DB and CH indices. The minimum improvements are 0.9% and 0.2%, respectively, while the maximum enhancements reach 8.1% and 10.0%. This method not only enables power supply companies to address the specific needs of diverse loads but also enhances the operational efficiency of the power system, thereby facilitating the efficient utilization and sustainable development of energy resources.
However, research on electricity consumption behavior is primarily based on monthly consumption data and is confined to industrial loads. Future studies should therefore focus on reducing the temporal granularity of electricity user load analysis to hourly or daily consumption levels to achieve a more detailed and precise understanding of electricity consumption behavior. The scope of research should also be expanded to encompass other load types within the region, including residential and commercial users, to conduct a comprehensive analysis and classification of their electricity consumption behavior.
Author Contributions
Writing—original draft, J.L. and Y.M.; Writing—review & editing, H.L. and Y.L. (Yue Liu); Project administration, Y.L. (Yalong Li). All authors have read and agreed to the published version of the manuscript.
Funding
This research received no external funding.
Data Availability Statement
The raw data supporting the conclusions of this article will be made available by the authors on request.
Conflicts of Interest
Authors Jing Li, Yarong Ma and Hao Li were employed by the Development Division of State Grid Gansu Electric Power Company (Economic and Technological Research Institute). The remaining authors declare that the research was conducted in the absence of any commercial or financial relationships that could be construed as a potential conflict of interest.
References
- Ghasempour, A.; Martínez-Ramón, M. Short-Term Electric Load Prediction in Smart Grid using Multi-Output Gaussian Processes Regression. In Proceedings of the 2023 IEEE Kansas Power and Energy Conference (KPEC), Manhattan, KS, USA, 27–28 April 2023; pp. 1–6. [Google Scholar] [CrossRef]
- Pavlatos, C.; Makris, E.; Fotis, G.; Vita, V.; Mladenov, V. Enhancing Electrical Load Prediction Using a Bidirectional LSTM Neural Network. Electronics 2023, 12, 4652. [Google Scholar] [CrossRef]
- Cao, Z.; Wang, J.; Yin, L.; Wei, D.; Xiao, Y. A hybrid electricity load prediction system based on weighted fuzzy time series and multi-objective differential evolution. Appl. Soft Comput. 2023, 149, 111007. [Google Scholar] [CrossRef]
- Wu, D.; Du, X.; Peng, F. Multi-layer and multi-source features stacking ensemble learning for user profile. Electr. Power Syst. Res. 2024, 229, 110128. [Google Scholar] [CrossRef]
- Wen, Z.; Hongbo, G.; Bao, Y.; Yan, C.; Hong, O.; Jing, Z.; Furong, Y. Research on load forecasting method based on power user profile. In Proceedings of the 2022 IEEE 5th International Conference on Automation, Electronics and Electrical Engineering (AUTEEE), Shenyang, China, 18–20 November 2022; pp. 200–204. [Google Scholar] [CrossRef]
- Wang, X.; Yao, Z.; Papaefthymiou, M. A real-time electrical load forecasting and unsupervised anomaly detection framework. Appl. Energy 2023, 330, 120279. [Google Scholar] [CrossRef]
- Peng, B.; Liu, Y. Research on Power System Load Clustering based on Signal Analysis and K-Prototypes. In Proceedings of the 2023 3rd International Conference on Electrical Engineering and Control Science (IC2ECS), Hangzhou, China, 29–31 December 2023; IEEE: Piscataway, NJ, USA, 2023; pp. 233–240. [Google Scholar]
- Zhang, Y.; Zhang, F.; Yao, X.; Yu, J.; Wang, B.; Wang, L. Research on the classification of electricity consumption characteristics of massive users. In Proceedings of the 2022 4th International Conference on Intelligent Control, Measurement and Signal Processing (ICMSP), Hangzhou, China, 8–10 July 2022; IEEE: Piscataway, NJ, USA, 2022; pp. 679–682. [Google Scholar]
- Xiao, W.; Ding, T.; Chen, H. Load Characteristics Classification of Multiple Users Based on Time Series Clustering. In Proceedings of the 2021 11th International Conference on Power and Energy Systems (ICPES), Shanghai, China, 18–20 December 2021; IEEE: Piscataway, NJ, USA, 2021; pp. 569–574. [Google Scholar]
- Li, R.; Li, F.; Smith, N.D. Multi-resolution load profile clustering for smart metering data. IEEE Trans. Power Syst. 2016, 31, 4473–4482. [Google Scholar] [CrossRef]
- Li, D.; Liu, S.; Sun, Y.; Qiu, Y.; Liu, C.; Wang, S.; Cui, H.; Peng, T. Fine Classification Methods for Multi-load users at Different Time Scales. In Proceedings of the 2020 7th International Conference on Information Science and Control Engineering (ICISCE), Changsha, China, 18–20 December 2020; IEEE: Piscataway, NJ, USA, 2020; pp. 644–648. [Google Scholar]
- Fu-lin, M.; Hong-yang, L. Power load classification based on spectral clustering of dual-scale. In Proceedings of the 2014 IEEE International Conference on Control Science and Systems Engineering, Yantai, China, 29–30 December 2014; IEEE: Piscataway, NJ, USA, 2014; pp. 162–166. [Google Scholar]
- Cui, C.Y.; Ren, W.; Feng, S.; Jia, T.; Wang, H. User Seasonal Electricity Behavior Portrait Based on Data Feature Extraction and K-Means Clustering. In Proceedings of the 2023 IEEE 11th Joint International Information Technology and Artificial Intelligence Conference (ITAIC), Chongqing, China, 8–10 December 2023; IEEE: Piscataway, NJ, USA, 2023; Volume 11, pp. 1475–1479. [Google Scholar]
- Zhang, L.; Chen, Y.; Han, Z. Traction load classification method based on improved clustering method. J. Southwest Jiaotong Univ. 2020, 55, 27–33. [Google Scholar]
- Wang, P.; Zhang, W.; Ma, M.; Jin, W.; Wang, X. Research on load data classification method based on the characteristics of electricity consumption behavior by extreme learning machine. In Proceedings of the 2023 IEEE International Conference on Sensors, Electronics and Computer Engineering (ICSECE), Jinzhou, China, 18–20 August 2023; pp. 1259–1264. [Google Scholar] [CrossRef]
- Song, R.; Yang, Y.; Xue, Y.; Zhang, P.; Wang, C.; Yang, L. Research on clustering algorithm of user electricity behavior for identification of typical should scene. In Proceedings of the 2021 International Conference on Wireless Communications and Smart Grid (ICWCSG), Hangzhou, China, 13–15 August 2021; pp. 213–216. [Google Scholar] [CrossRef]
- Yang, H.; Li, X.; Su, M.; Liu, J.; Zhang, R. Power Consumption Portrait of Users Based on Improved ISODATA Clustering Algorithm. In Proceedings of the 2022 9th International Forum on Electrical Engineering and Automation (IFEEA), Zhuhai, China, 4–6 November 2022; pp. 1060–1064. [Google Scholar] [CrossRef]
- Zhu, Y.; Cheng, R.; Zhang, F.; Li, F.; Zheng, X.; Wang, J. Double-Layer Improved K-Means Based Electricity Industry Classification Method. In Proceedings of the 2021 International Conference on Wireless Communications and Smart Grid (ICWCSG), Hangzhou, China, 13–15 August 2021; pp. 513–516. [Google Scholar] [CrossRef]
- Hu, H.; Wang, Y.; Han, J.; Zhang, Y.; Yan, Q. Analysis of user power consumption characteristics and behavior portrait based on KS-rf algorithm. In Proceedings of the 2021 IEEE/IAS Industrial and Commercial Power System Asia (I&CPS Asia), Chengdu, China, 18–21 July 2021; IEEE: Piscataway, NJ, USA, 2021; pp. 1586–1590. [Google Scholar]
- Wang, J.; Wang, K.; Jia, R.; Chen, X. Research on load clustering based on singular value decomposition and k-means clustering algorithm. In Proceedings of the 2020 Asia Energy and Electrical Engineering Symposium (AEEES), Chengdu, China, 29–31 May 2020; IEEE: Piscataway, NJ, USA, 2020; pp. 831–835. [Google Scholar]
- Liu, J. Cluster analysis of electricity consumption characteristics and electricity consumption behavior of typical industry users. In Proceedings of the 2023 5th Asia Energy and Electrical Engineering Symposium (AEEES), Chengdu, China, 23–26 March 2023; IEEE: Piscataway, NJ, USA, 2023; pp. 1389–1395. [Google Scholar]
- Tian, L.; Liu, J.; Zhao, B.; Luan, W. An Investigation on Electricity Consuming Features for User Classification in Demand-Side Management Schemes. In Proceedings of the 2021 IEEE 5th Conference on Energy Internet and Energy System Integration (EI2), Taiyuan, China, 22–24 October 2021; IEEE: Piscataway, NJ, USA, 2021; pp. 554–559. [Google Scholar]
- Zhong, C.; Shao, J.; Zheng, F.; Zhang, K.; Lv, H.; Li, K. Research on Electricity Consumption Behavior of Electric Power Users Based on Tag Technology and Clustering Algorithm. In Proceedings of the 2018 5th International Conference on Information Science and Control Engineering (ICISCE), Zhengzhou, China, 20–22 July 2018; pp. 459–462. [Google Scholar] [CrossRef]
- He, F.; Wu, M.; Zhao, Y. Research on Community User Clustering Based on Multidimensional Power Consumption Features. In Proceedings of the 2020 Prognostics and Health Management Conference (PHM-Besançon), Besancon, France, 4–7 May 2020; pp. 314–319. [Google Scholar] [CrossRef]
- Fan, R.; Jing, Z.; Guo, D. Digital Marketing Technology Based on Electricity User Portrait and K-means Clustering Algorithm. In Proceedings of the 2022 IEEE Conference on Telecommunications, Optics and Computer Science (TOCS), Dalian, China, 11–12 December 2022; pp. 800–806. [Google Scholar] [CrossRef]
- Huang, Z. Extensions to the k-means algorithm for clustering large data sets with categorical values. Data Min. Knowl. Discov. 1998, 2, 283–304. [Google Scholar] [CrossRef]
- Pasarate, S.; Shedge, R. Concept based document clustering using K prototype Algorithm. In Proceedings of the 2018 International Conference on Control, Power, Communication and Computing Technologies (ICCPCCT), Kannur, India, 23–24 March 2018; IEEE: Piscataway, NJ, USA, 2018; pp. 579–583. [Google Scholar]
- Zhao, B.; Fan, K.; You, W.; Yang, K.; Wang, Z.; Li, H. A Weight-based k-prototypes algorithm for anomaly detection in smart grid. In Proceedings of the ICC 2020–2020 IEEE International Conference on Communications (ICC), Dublin, Ireland, 7–11 June 2020; IEEE: Piscataway, NJ, USA, 2020; pp. 1–6. [Google Scholar]
- Setianingsih, E.S.; Pratiwi, H.; Susanti, Y.; Nirwana, M.B. Clustering of Risk Factors for Coronary Heart Disease Using The k-prototypes Algorithm. In Proceedings of the 2023 3rd International Conference on Electrical, Computer, Communications and Mechatronics Engineering (ICECCME), Tenerife, Canary Islands, Spain, 19–21 July 2023; IEEE: Piscataway, NJ, USA, 2023; pp. 1–6. [Google Scholar]
- Davies, D.L.; Bouldin, D.W. A cluster separation measure. IEEE Trans. Pattern Anal. Mach. Intell. 1979, PAMI-1, 224–227. [Google Scholar] [CrossRef]
- Caliński, T.; Harabasz, J. A dendrite method for cluster analysis. Commun.-Stat.-Theory Methods 1974, 3, 1–27. [Google Scholar] [CrossRef]

Disclaimer/Publisher’s Note: The statements, opinions and data contained in all publications are solely those of the individual author(s) and contributor(s) and not of MDPI and/or the editor(s). MDPI and/or the editor(s) disclaim responsibility for any injury to people or property resulting from any ideas, methods, instructions or products referred to in the content. |
© 2025 by the authors. Licensee MDPI, Basel, Switzerland. This article is an open access article distributed under the terms and conditions of the Creative Commons Attribution (CC BY) license (https://creativecommons.org/licenses/by/4.0/).