1. Introduction
With the advancement of science and technology and rapid industrial development, water and air pollution have become increasingly severe. Addressing environmental pollution has emerged as a critical challenge in regard to green development strategies. Industrial wastewater and exhaust emissions, in recent years, have imposed significant adverse impacts on ecosystems and public health. Mobile-source emissions constitute a major contributor to air pollution, while the growing demand for clean water, driven by industrialization, population expansion, and prolonged droughts, has led to global water scarcity [
1]. Consequently, the urgency to enhance air pollution control and secure clean water resources has become critically prominent.
The application of photocatalytic technology in regard to environmental remediation has been extensively investigated due to its environmentally friendly nature and high efficiency, making it a promising approach for sustainable pollution control. Photocatalysts can be categorized into various types, including metal oxides (e.g., TiO
2, Fe
2O
3, ZnO), metal sulfides (e.g., CdS, MoS
2), Bi-based photocatalysts (BiOX, X = Cl, Br, I), Ag-based photocatalysts (e.g., Ag
3PO
4, Ag
2CrO
4, AgBr), graphitic carbon nitride (g-C
3N
4), elemental semiconductors, and conjugated photocatalysts. Among these materials, titanium dioxide (TiO
2) has been widely recognized as an exceptional photocatalyst for degrading organic pollutants, owing to its superior photocatalytic activity, robust oxidative capacity, non-toxicity, excellent stability, and cost effectiveness [
2,
3,
4].
However, titanium dioxide (TiO
2) suffers from inherent limitations that hinder its practical application, such as its narrow light absorption range, namely strong absorption in the ultraviolet (UV) region but weak visible-light utilization, resulting in low solar energy conversion efficiency (~4%) [
5] and, consequently, poor photocatalytic activity under visible light. Additionally, rapid electron–hole recombination occurs under photoexcitation, wherein photogenerated charge carriers on the TiO
2 surface readily recombine, significantly reducing its photocatalytic efficiency. To address these issues, ion doping strategies have been employed to broaden the visible-light response range and suppress electron–hole recombination. Metal dopants (e.g., Fe, Cr, Cu, Ce) have been widely utilized as co-catalysts to enhance TiO
2 performance [
6,
7,
8,
9,
10,
11,
12,
13]. Nonmetallic doping (e.g., N, F, S, P, I) has also been adopted to modify the surface or bulk properties of TiO
2, thereby improving its photocatalytic activity [
14,
15,
16,
17,
18,
19,
20,
21,
22].
Related studies have shown that transition metal doping extends the light absorption range of TiO
2 into the visible region. The 3d orbitals of transition metals enable electron excitation under visible light, while their unfilled 3d orbitals facilitate charge transfer between photogenerated electrons and holes. Additionally, the 3d orbitals of transition metals align with Ti
3+ 3d orbitals, forming continuous energy levels within the conduction band [
23]. Nickel, a cost-effective transition metal, has been extensively applied across multiple fields. Esfandian et al. [
24] synthesized Ni-doped ZnO–TiO
2 nanocomposites to investigate their electrochemical behavior and photocatalytic performance in regard to chlorpyrifos pesticide degradation. Mollavali et al. [
25] enhanced the visible-light photocatalytic activity of TiO
2 nanotube arrays (TNAs) via co-doping with nitrogen, nickel, and carbon. Varimalla et al. [
26] demonstrated that rutile TiO
2 serves as a more effective carrier for nickel than anatase. Gul et al. [
27] fabricated NiO/TiO
2 nanocomposites via chemical reduction, revealing its superior photocatalytic degradation efficiency and biological activity.
Numerous methods have been developed to synthesize TiO
2, including the impregnation method [
28], ceramic synthesis, precipitation, hydrothermal synthesis, and the sol–gel method [
29,
30,
31,
32,
33]. The sol–gel method, widely adopted for preparing ultrafine metal oxides [
34], is particularly prevalent in fabricating nano-TiO
2. This method typically employs metal alkoxides or salts as precursors, with anhydrous ethanol as the organic solvent and acidic solutions as hydrolysis inhibitors. Upon the addition of deionized water, the precursor solution undergoes hydrolysis, polycondensation, and gelation [
35].Velázquez-Martínez et al. [
36] synthesized TiO
2 and Fe-doped TiO
2 micropowders via a sol–gel–hydrothermal hybrid approach, demonstrating a high level of photocatalytic activity in regard to azo dye degradation experiments. Cheng et al. [
37] developed a water-free sol–gel strategy to prepare polyethylene glycol/titanium dioxide shape-stable composite phase change materials (PEG/TiO
2 ss-CPCM), exhibiting advantages such as enhanced thermal energy storage capacity, shape stability, thermal reliability, and effective thermal management. Lal et al. [
38] synthesized Nd-doped TiO
2 nanoparticles via a sol–gel–ultrasonic route, achieving 96.42% degradation efficiency under sunlight irradiation. Yurtsever et al. [
28] prepared Cu-doped and lanthanide–copper co-doped TiO
2 powders using sol–gel synthesis, investigating the synergistic effects of co-doping on the photocatalytic redox activity.
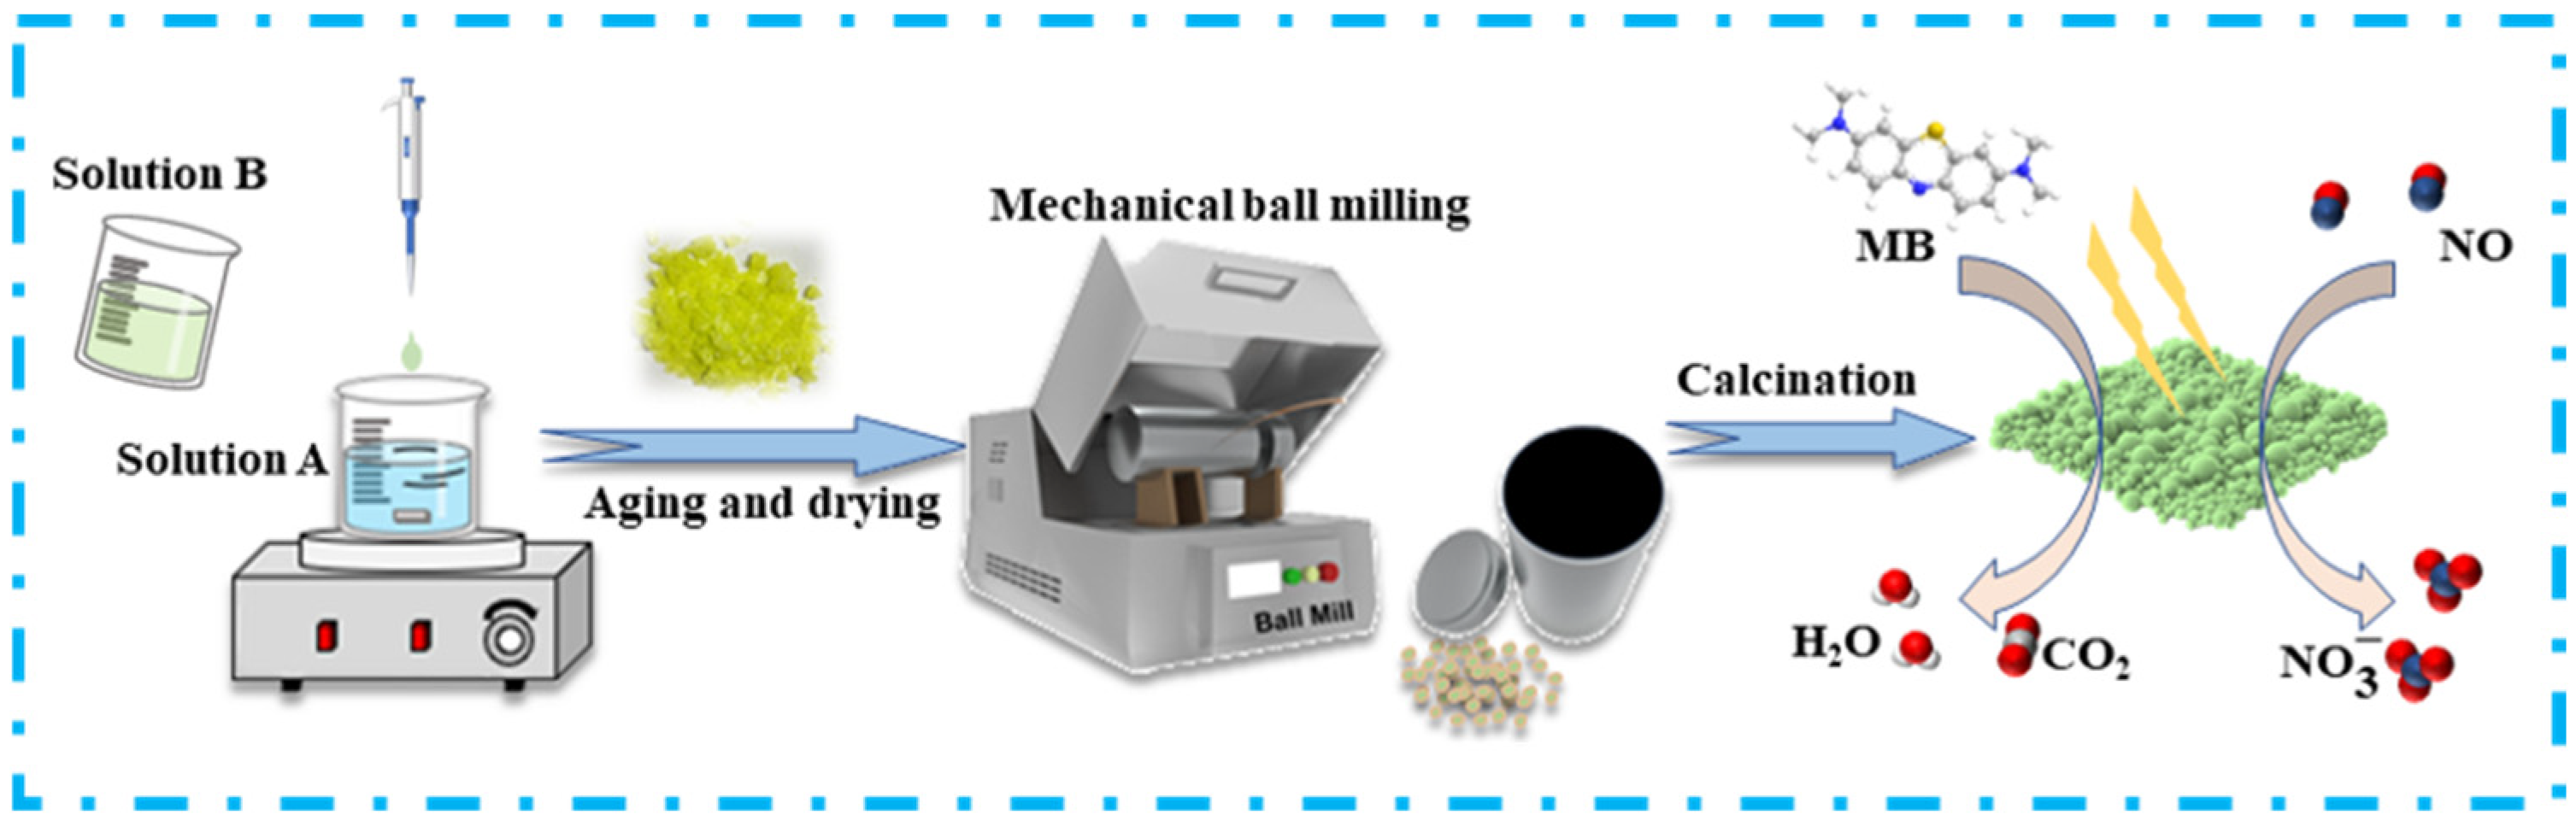
In contrast to the hydrothermal and impregnation methods, the sol–gel method is characterized by its shorter processing time and higher yield. This study innovatively employs mechanical ball milling to pre-treat the precursor prior to calcination, thereby replacing traditional manual labor in the preparation of modified TiO2 via the conventional sol–gel approach. Mechanical ball milling leverages the high-speed movement of grinding media (such as steel or ceramic balls) within the mill to subject the precursor to impact, grinding, and stirring. This process ensures thorough and uniform mixing of the precursor with other additives at the microscopic level, thereby guaranteeing the consistent distribution of all the components. As a result, the subsequent reaction proceeds more uniformly, enhancing the quality and performance stability of titanium dioxide products. Furthermore, mechanical ball milling refines the particle size of the precursor before calcination, yielding a more uniform particle size distribution. This refinement is advantageous for the calcination process. Additionally, the limited exposure of the precursor to the external environment during grinding minimizes the risk of impurity contamination. The mechanical ball milling technique enables precise control over the grinding effect on the precursor, thereby achieving high actual production efficiency.
In this study, Ni-doped TiO
2 catalysts with varying nickel contents were synthesized via a sol–gel method, combined with mechanical ball milling of the gel precursors. The photocatalytic performance of the catalysts was evaluated through the degradation of nitric oxide (NO) and methylene blue (MB). The crystal structure, morphology, and optical properties of the materials were characterized using UV–Vis spectroscopy, X-ray diffraction (XRD), X-ray photoelectron spectroscopy (XPS), and scanning electron microscopy (SEM). The results demonstrate that Ni doping and ball milling of the precursor significantly enhance its photocatalytic activity. A schematic illustration of the research process is presented in
Figure 1.
2. Experimental Process
2.1. Catalyst Preparation
Firstly, 38 mL of anhydrous ethanol was added to a beaker, followed by 17 mL of tetrabutyl titanate. The mixture was magnetically stirred at 500 rpm for 10 min and ultrasonicated for 5 min, denoted as Solution A. In a separate beaker, 38 mL of anhydrous ethanol, 6 mL of glacial acetic acid, 12 mL of deionized water, and Ni(NO3)2·6H2O (Ni2+/Ti4+ mass ratios: 0.1, 0.3, 0.5, 0.7, 0.9, 1 wt%) were mixed, magnetically stirred for 20 min, and ultrasonicated until complete dissolution. The pH was adjusted to 2 using pH test paper, yielding Solution B. Solution B was added dropwise to Solution A at 2 drops/s via a rubber dropper, with continuous stirring until a sol-like mixture formed. The sol was then transferred to a 50 °C water bath and stirred until gelation occurred. The gel was aged at room temperature for 12 h, dried at 80 °C, and ground with 25 corundum balls (five balls: 1.0 cm diameter, 2.25 g each; 20 balls: 0.5 cm diameter, 0.26 g each) in a 50 mL zirconia ball mill at 100 rpm for 15 min, producing Ni2+/Ti4+-modified TiO₂ precursors (0.1–1 wt%). Finally, the precursors were calcined in a muffle furnace at 500 °C (heating rate: 5 °C/min) for 2 h in air, followed by cooling to 50 °C at 5 °C/min. The resulting catalysts were labeled as x% NIT (x = 0.1, 0.3, 0.5, 0.7, 0.9, 1).
Pure TiO2 was synthesized using an identical procedure to the Ni-doped samples but omitting Ni(NO3)2·6H2O in Solution B, denoted as T.
2.2. Catalyst Characterization
The X-ray diffraction (XRD) analysis was conducted using a TD-3500 diffractometer (Dandong Tongda Science and Technology Co., Ltd., Dandong, China) in continuous scanning mode, with a biaxial linkage drive. The operating parameters were set as follows: voltage = 35 kV, current = 25 mA, scanning range = 10–80° (2θ), and scanning rate = 5°/min. The UV–Vis diffuse reflectance (DR) spectra were recorded using a Shimadzu UV-2600 spectrophotometer (Shimadzu Co., Ltd., Hong Kong, China) (200–800 nm wavelength range). The surface morphology was characterized using a Zeiss Sigma 300 field-emission scanning electron microscope (FE-SEM) (Carl Zeiss Management Co., Ltd., Shanghai, China). High-resolution transmission electron microscopy (HRTEM) images and selected area electron diffraction (SAED) patterns were acquired with a Thermo Fisher Tecnai G2 F20 TEM (FEI Corporation, Hillsboro, OR, USA), operated at 200 kV. The X-ray photoelectron spectroscopy (XPS) analysis was performed using a Kratos AXIS Ultra DLD (Thermo Kalpha, Waltham, MA, USA) spectrometer, with monochromatic Al Kα radiation (hv = 1486.6 eV). Raman spectra were collected using a WITec Alpha-300R confocal Raman microscope (WITec GmbH, Ulm, Germany), over a spectral range of 100–800 cm−1. Nitrogen adsorption–desorption isotherms were measured at 77 K using a Micromeritics 3 Flex analyzer (McMurdik Instrument Co., Ltd., Shanghai, China). Prior to analysis, the samples were degassed at 150 °C under a vacuum for >6 h. The specific surface area was calculated via the Brunauer–Emmett–Teller (BET) method, while the pore size distribution was derived from the adsorption branches using the Barrett–Joyner–Halenda (BJH) model.
2.3. Photocatalytic Activity Evaluation
The photocatalytic degradation activities of T and Ni–TiO
2 (NIT) were evaluated using methylene blue (MB) and nitric oxide (NO) as model pollutants. A schematic diagram of the NO degradation setup is illustrated in
Figure 2. The photocatalytic procedure was conducted as follows:
For MB degradation, a BILON-CHX-V photoreactor (China Shanghai Bilon Instruments Manufacture Co., Ltd., Shanghai, China), equipped with a 300 W xenon lamp, was employed at 25 °C. In a typical experiment, 10 mg of catalyst was dispersed in 50 mL of MB solution (1 × 10
−4 mol L
−1) and stirred in the dark for 1 h to establish the adsorption–desorption equilibrium. At predetermined intervals, 1 mL aliquots were collected, centrifuged at 10,000 rpm for 5 min, and analyzed using a Japan Shimadzu UV-3600 UV–Vis spectrophotometer. The photodegradation efficiency was calculated via the following equation:
where C
0 is the initial concentration of MB and C
t is the concentration of MB at a given irradiation time.
The photocatalytic degradation of NO was evaluated using a continuous-flow fixed-bed reactor (360 mm × 210 mm × 110 mm), equipped with a xenon lamp. The catalyst (200 mg) was evenly coated on the bottom of the reactor. A reactant mixture (5 vol% NO balanced with air) was introduced at a total flow rate of 900 mL·min⁻1, corresponding to a weight hourly space velocity (WHSV) of 270 L·g⁻1·h⁻1. The concentrations of NO and the products were monitored in real time using a Thermo Scientific 42i-TL NOₓ analyzer from the United States.
3. Results and Discussion
3.1. Photocatalytic Performance
3.1.1. Photodegradation of MB
Methylene blue (MB), a cationic thiazine dye, is widely employed in chemical and pharmaceutical industries. In an aqueous solution, oxidized MB exhibits a dark blue color, which becomes colorless upon reduction.
Figure 3a–g displays the time-dependent UV–Vis absorption spectra of MB degraded by different catalysts. The gradual decrease in absorption intensity under illumination confirms the photocatalytic degradation of MB by NIT (0.1–1 wt%) catalysts.
As shown in
Figure 3h, pure TiO
2 achieves a degradation efficiency of 68.2%. In contrast, NIT catalysts with varying Ni loadings (0.1–1.0 wt%) exhibit MB degradation efficiencies of 74%, 81.7%, 93.1%, 91.4%, 77.7%, and 60.9%, respectively, after 60 min of illumination. The photocatalytic activity initially increases with the Ni content, peaking at 0.5 wt%, followed by a decline at higher doping levels. To quantify the degradation kinetics, the Langmuir–Hinshelwood pseudo-first-order model [
39] was applied, as expressed in Equation (2):
where k is the photocatalytic rate and t is the illumination time. The photocatalytic rate of the samples with different nickel contents is shown in
Table 1.
As shown in
Table 1, the 0.5% NIT-doped sample exhibits the highest reaction rate constant (k) for methylene blue (MB) degradation, followed by the 0.7% NIT-doped sample. The reaction rate constant k, derived from the slope of the pseudo-first-order reaction kinetics, based on the Langmuir–Hinshelwood model, demonstrates a direct correlation with photocatalytic efficiency, higher k values correspond to enhanced catalytic performance. Notably, significant variations in the k values among the samples with different doping concentrations suggest intrinsic correlations with certain material characteristics such as the specific surface area and crystallite size. Extensive studies have revealed that an enlarged specific surface area provides more active sites, thereby facilitating the adsorption of MB molecules on catalyst surfaces and promoting photocatalytic reactions. Concurrently, enhanced light scattering and absorption efficiency achieved through an increased surface area optimize photon utilization, ultimately accelerating the reaction kinetics. Furthermore, reduced crystallite dimensions benefit the diffusion and transport of photogenerated charge carriers by shortening the migration distance from crystal interiors to surfaces. This spatial advantage effectively minimizes the carrier recombination probability, leading to improved photocatalytic activity and elevated k values. It is worth emphasizing that photocatalytic performance is comprehensively influenced by multiple parameters, such as the degree of crystallinity, the number of surface active sites, particle size distribution, bandgap energy, and recombination rates. These interdependent factors collectively govern the photochemical conversion efficiency in heterogeneous catalytic systems.
Based on the experimental results, 0.5 wt% NIT exhibits the highest photodegradation efficiency for MB, followed by 0.7 wt% NIT. This enhancement can be attributed to the incorporation of Ni
2+ ions, which suppress the recombination of photogenerated electron–hole pairs and facilitate electron transfer to adsorbed O
2 molecules, generating reactive oxygen species. However, excessive Ni
2+ doping (>0.5 wt%) leads to a decline in efficiency, likely due to Ni
2+ ions occupying active sites or acting as recombination centers, thereby reducing charge separation efficiency [
8].
According to relevant studies, the investigation of methylene blue (MB) degradation mechanisms via radical scavengers is a feasible approach to identify the dominant reactive species in TiO2-mediated photocatalytic processes. The primary function of scavengers lies in their ability to selectively trap specific radicals, thereby elucidating the contribution of individual reactive species (e.g., hydroxyl radicals ·OH, superoxide radicals ·O2−, or holes h+) to the overall degradation pathway. When investigating the degradation mechanism of MB using radical scavengers, the adsorption strength of scavengers on TiO2 surfaces and pH variations during the process can exert certain influences on the reaction efficiency. However, most studies implicitly assume that the addition of scavengers is uniformly distributed in the solution, suggesting the influence of a very small amount of scavengers on the TiO2 surface.
To identify the dominant reactive species in the 0.5 wt% NIT photocatalytic system, radical trapping experiments were conducted using isopropyl alcohol (IPA, ·OH quencher), benzoquinone (BQ, ·O
2− scavenger), and potassium iodide (KI, h
+ inhibitor). Each scavenger (1 mmol/L) was introduced into 100 mL of MB solution (10 mg/L) prior to irradiation. As shown in
Figure 4, the degradation efficiency of MB reached 93.1% in the absence of scavengers. Upon adding IPA, BQ, and KI, the efficiencies decreased to 78%, 60%, and 45%, respectively, after 60 min of illumination. The pronounced inhibition effects (KI > BQ > IPA) suggest that h
+ and ·O
2− serve as the primary reactive species governing MB photodegradation, while ·OH plays a secondary role. Based on these findings, the MB degradation mechanism is proposed as follows [
40]:
3.1.2. Photodegradation of NO
Figure 5a,b illustrates the NO degradation activity of NIT catalysts with Ni
2+/Ti
4+ ratios ranging from 0.1 to 1.0 wt%. The NO conversion efficiency of Ni–TiO
2 exceeds that of pure TiO
2, with the 0.7 wt% NIT catalyst achieving the highest NO conversion rate of 45.4% (9.7% higher than pure TiO
2). This enhancement is attributed to the substitution of Ti
4+ by Ni
2+ ions during doping, which narrows the bandgap from 3.2 eV (pure TiO
2) to 2.9 eV (NIT). The optimized doping ratio facilitates the formation of shallow potential wells within the TiO
2 lattice, thereby enhancing surface reactivity [
41].
As shown in the diagram, the NO degradation rate increases correspondingly with the Ni
2+/Ti
4+ doping ratio (0.1–0.7 wt%), peaking at 0.7 wt% NIT. Beyond this threshold, the degradation efficiency declines. This trend can be attributed to two factors: (1) at low Ni
2+ doping levels (<0.7 wt%), insufficient shallow potential wells limit electron–hole pair separation, restricting photocatalytic activity enhancement; (2) excessive doping (>0.7 wt%) induces localized agglomeration, compromising charge transport, and reduces the average distance between trapping sites, thereby significantly enhancing charge recombination and suppressing the photocatalytic efficiency. Furthermore, the NO degradation rate progressively declines and stabilizes with a prolonged reaction time. This behavior likely stems from the rapid generation of strongly oxidizing species (e.g., ·OH and ·O
2−) on the TiO
2 surface during the initial irradiation, which oxidize NO to nitrate ions (NO
3−). The adsorbed NO
3− occupies active sites, reducing the degradation kinetics [
42]. The proposed NO photodegradation reaction pathways are as follows:
As elucidated by mechanistic studies, the photocatalytic degradation of (NO) over NIT primarily proceeds as a result of oxidation mediated by photogenerated holes (h+) and reactive oxygen species, such as ·OH and superoxide radicals ·O2−. However, this process inevitably generates byproducts, including: (1) NO2 (a highly toxic intermediate oxidation product), (2) N2O (a greenhouse gas formed via incomplete NO reduction), (3) NH3 (potentially generated in strongly reductive conditions), and (4) NO3− (an environmentally benign nitrate, representing the ideal terminal product).
Critical insights from relevant studies reveal that low Ni doping concentrations favor high selectivity toward NO→NO3− conversion, with minimal NO2 emissions and negligible N2O/NH3 formation. This selectivity arises from moderate oxygen vacancy (Ov) concentrations, which enhance ·O2− generation to accelerate deep oxidation of NO, while optimized electronic structures suppress reductive pathways. Conversely, excessive Ni doping reduces NO3- selectivity, elevates NO2 yields, and risks N2O formation. This degradation stems from two factors: (1) NiO impurity phases, formed at high doping levels, act as charge recombination centers that impede deep oxidation; and (2) overabundant defects exacerbate electron–hole recombination and amplify reductive pathways. These findings underscore that precise control of the Ni doping concentration is pivotal to balancing Ov-mediated oxidation enhancement and defect-induced recombination suppression, thereby steering reaction pathways toward environmentally favorable NO3− production.
Figure 5c,d illustrates the cycling stability of NO degradation over 0.7 wt% NIT. After four consecutive cycles, the NO degradation efficiency decreased by only 1.9%, demonstrating exceptional operational stability.
Figure 6 demonstrates the adsorption performance of NIT samples toward methylene blue (MB) and nitric oxide (NO) in dark conditions. As illustrated in
Figure 6a, no significant variation in MB concentration was observed without photocatalysts, while the introduction of NIT samples induced a gradual decline in the MB concentration over time, with the 0.3–0.7% NIT samples exhibiting markedly superior adsorption capacities compared to other doping levels.
Figure 6b reveals that the NO concentration remained stable in the absence of catalysts, whereas all the NIT-doped samples progressively reduced the NO concentration during adsorption, particularly the 0.5% and 0.7% NIT samples, which showed optimal performance. This adsorption enhancement can be attributed to three principal mechanisms: (1) lattice defects (e.g., oxygen vacancies) generated by Ni
2+ substitution for Ti
4+ served as electron-enriched regions in darkness, facilitating enhanced chemical bonding interactions with the lone electron pairs of MB amino groups or NO free radicals; (2) Ni
2+ species act as active sites for direct coordination adsorption; and (3) distinct adsorption pathways governed by pollutant characteristics, namely MB adsorption primarily involved electrostatic interactions, π-π stacking, and hydrogen bonding, amplified through Ni-induced surface charge modulation and π-conjugated structure optimization, while NO adsorption relied on oxygen vacancy-mediated chemical adsorption (via NO
2−/NO
3− formation) coupled with physical adsorption. Notably, excessive Ni doping (>0.7%) induced surface over-modification, causing microporous blockage and active site occlusion that compromised the NO adsorption efficiency. These findings demonstrate that Ni doping levels critically regulate adsorption performance through synergistic effects between the pollutant’s molecular properties and the defect state distribution on the material surfaces.
3.2. X-Ray Diffraction Analysis
Figure 7 displays the XRD patterns of TiO
2 and Ni-doped TiO
2 (NIT), confirming the anatase phase structure. The diffraction peaks at 2θ = 25.3°, 37.9°, 48.2°, 54.0°, 55.2°, and 62.8° correspond to the (101), (004), (200), (105), (211), and (204) crystal planes of anatase TiO
2 [
43]. Notably, no characteristic peaks of nickel oxide (NiO) are observed in the NIT patterns, indicating that Ni
2+ doping does not alter the TiO
2 lattice structure, and Ni
2+ is likely incorporated into the anatase framework via substitutional doping.
3.3. SEM Analysis
Figure 8 displays the SEM images of pure TiO
2 and Ni-doped TiO
2 (NIT) with varying Ni
2+/Ti
4+ ratios (0.1–1.0 wt%). As shown in
Figure 8a, pure TiO
2 exhibits a granular and near-spherical morphology, with densely aggregated particles and uniform size distribution.
Figure 8b–g illustrates the microstructures of the NIT samples (0.1–1.0 wt% Ni
2+/Ti
4+), revealing no significant differences in the nanoparticle size or distribution compared to pure TiO
2. Notably, the 0.7 wt% NIT sample displays a distinct plate-like morphology, which may enhance active site exposure for MB and NO degradation. To our knowledge, this work reports the first synthesis of plate-like Ni–TiO
2 via a sol–gel method, combined with mechanical ball milling of the gel precursors.
Figure 8h–k presents the elemental mapping of 0.7 wt% NIT, demonstrating uniform spatial distributions of Ni and Ti atoms across the plate-like morphology. This homogeneous dispersion facilitates efficient charge carrier transport at the NIT interface. Energy-dispersive X-ray spectroscopy (EDS) analysis (
Figure 8l) confirms the coexistence of Ti, O, and Ni in the catalyst. The observed non-stoichiometric oxygen deficiency likely originates from surface oxygen vacancies, which are known to enhance photocatalytic activity by modulating electronic properties.
3.4. UV–Vis DRS Test Analysis
To investigate the influence of the Ni doping content on the optical absorption edge and bandgap of TiO
2 nanoparticles, UV–Vis diffuse reflectance spectroscopy (DRS) was conducted on the pure TiO
2 and NIT samples. As shown in
Figure 9a, pure TiO
2 exhibits strong absorption exclusively in the ultraviolet region (λ < 400 nm), with negligible absorption in the visible range (400–500 nm). In contrast, Ni-doped TiO
2 demonstrates a progressive redshift in the absorption edge toward longer wavelengths with increasing Ni content. A distinct shoulder-like absorption feature emerges within the 400–500 nm range, accompanied by a significant redshift. Beyond 500 nm, the NIT samples display a broader absorption edge compared to pure TiO
2.
The redshift fundamentally arises from the narrowing of the material’s bandgap, which reduces the energy required for electron excitation (corresponding to longer wavelengths). The observed redshift in the optical absorption edge can be attributed to bandgap narrowing induced by nickel doping in TiO2. Specifically, nickel doping facilitates hybridization between Ni 3d orbitals and Ti 3d orbitals, resulting in a slight downward shift in the conduction band minimum, thereby reducing the bandgap (Eg). Additionally, nickel doping promotes charge transfer transitions between TiO2 and nickel ions across the conduction or valence bands, which require lower energy input, further contributing to the redshift phenomenon. Moreover, the nickel doping process is accompanied by the formation of oxygen vacancies (Ov). These defect states introduce localized energy levels within the forbidden bandgap, effectively reducing the effective bandgap and enhancing visible-light absorption. The resultant redshift facilitates photon energy absorption under visible-light irradiation, thereby stimulating photocatalytic reactions and improving the visible-light utilization efficiency. This phenomenon may also correlate with lattice distortions in TiO2 caused by the incorporation of nickel ions. The synergistic effects of bandgap engineering, defect-induced intermediate states, and structural modifications collectively optimize the photoelectronic properties and catalytic performance of Ni-doped TiO2 systems.
Figure 9b depicts the bandgaps corresponding to varying NIT contents derived from the UV–visible diffuse reflectance spectra. The bandgaps of the structures were calculated using the Tauc formula, where the relationship between the absorption coefficient and photon energy is expressed as follows [
44]:
where α is the absorption coefficient, h is Planck’s constant (6.6 × 10
−34 J·Hz
−1), υ is the frequency of light, and k is a constant, called a band-tail parameter, which depends on the transition probability.
Based on the correlation between the bandgap (E
g) and the light absorption threshold (λ
g), the λ
g values for the respective samples were determined [
45]:
where E
g denotes the bandgap (eV) and λ
g represents the light absorption threshold (nm). The λ
g and E
g values of TiO
2 and NIT (0.1–1%) are summarized in
Table 2. Notably, Ni-doped TiO
2 exhibits an extended light absorption threshold accompanied by a reduced bandgap. Furthermore, progressive nickel incorporation induces systematic threshold redshifts and continuous bandgap narrowing.
3.5. N2 Sorption Analysis
Extensive studies have demonstrated that the specific surface area, while a critical parameter, is not the sole determinant of photocatalytic efficiency. Although an increased surface area provides foundational conditions for photocatalytic activity, optimal performance necessitates a synergistic interplay with electronic structure optimization and defect engineering. In Ni-doped TiO2 systems, bandgap regulation and the oxygen vacancy concentration typically exert more pronounced contributions to photocatalytic activity than surface area, particularly in visible-light-driven reactions. An expanded surface area generally enhances the exposure of active sites and improves the adsorption capacity, facilitating the surface enrichment of reactants (e.g., methylene blue (MB) or nitric oxide (NO) molecules), thereby elevating degradation efficiency. Consequently, surface area characterization offers a partial yet meaningful reflection of the photocatalytic performance. However, the superior activity observed in Ni-doped TiO2 systems predominantly stems from the synergistic effects of the tailored electronic properties (e.g., narrowed bandgap via Ni 3d–Ti 3d orbital hybridization), optimized charge carrier dynamics (e.g., suppressed recombination via oxygen vacancy-mediated trapping), and structural modifications (e.g., lattice distortion-induced defect states). These factors collectively dominate compared to the surface area effects in regard to governing the photocatalytic behavior under visible-light irradiation.
The porous characteristics of the NIT samples with varying Ni concentrations were analyzed using N
2 adsorption–desorption measurements.
Figure 10a reveals that all the NIT catalysts exhibit type IV isotherms with type H
3 hysteresis loops [
46], consistent with their mesoporous characteristics. The pore size distribution profiles in
Figure 10b demonstrate narrow pore size distributions (20–50 nm) across all the NIT variants, confirming the preservation of mesoporous architectures irrespective of the Ni doping levels.
As shown in
Table 3, the BET specific surface area of the Ni-doped TiO
2 samples is generally smaller than that of pure TiO
2. This can be attributed to the aggregation of metal ions into metallic clusters during the doping process. Moreover, the elevated temperatures during synthesis may induce sintering phenomena in metal-doped TiO
2, where the intergranular boundaries disappear, leading to grain coalescence into larger crystallites. Such sintering effects could significantly diminish the specific surface area. These metallic agglomerates may alter the grain size distribution, consequently affecting the surface area characteristics. Although minimal variations in the specific surface area are observed among different Ni-doped TiO
2 catalysts, the 0.7% NIT sample exhibits a larger specific surface area (X m
2/g) and pore volume (Y cm
3/g) compared to other Ni-doped TiO
2 catalysts, while maintaining a smaller average pore diameter (Z nm). Notably, the optimal NO degradation efficiency demonstrated by the 0.7% NIT sample in the catalytic tests may originate from the unique combination of its enhanced surface area and optimized pore structure.
3.6. Raman Analysis
The Raman spectra presented in
Figure 11 demonstrate that both pristine TiO
2 and the 0.7% NIT samples exhibit a prominent peak at 144 cm
−1, along with four characteristic moderate peaks located at 197 cm
−1, 398 cm
−1, 515 cm
−1, and 641 cm
−1. These spectral features correspond to the six Raman-active vibrational modes characteristic of anatase-structured TiO
2 [
47,
48]. Comparative analysis with pure TiO
2 reveals that the synthesized Ni-doped TiO
2 samples exhibit nearly identical Raman features without detectable nickel oxide signatures, confirming that Ni incorporation does not substantially alter the fundamental TiO
2 framework, a conclusion consistent with the XRD observations. Notably, the NIT sample exhibits a slight blueshift (~144 cm
−1), accompanied by peak broadening and intensity reduction relative to undoped TiO
2. This phenomenon may be attributed to lattice defects induced by electron donation from incorporated Ni species, which distort the crystal symmetry. Previous studies have established that heteroatom substitution can generate such structural imperfections, thereby facilitating enhanced electron transfer efficiency and improved catalytic activity [
49].
3.7. TEM Analysis
To elucidate the microstructure of nickel-doped titanium dioxide, the TEM characterization results for the 0.7% NIT sample are presented in
Figure 12.
Figure 12a,b reveals a spherical particle morphology with uniform size distribution, demonstrating that Ni doping retains the pristine TiO
2 microstructure, a finding consistent with the SEM observations.
Figure 12c displays high-resolution TEM images of TiO
2 and NiO crystallites. The TiO
2 lattice exhibits a d-spacing of 0.35 nm, corresponding to the (101) plane of anatase TiO
2. Concurrently, the NiO phase shows a characteristic d-spacing of 0.24 nm, matching the (111) plane of cubic NiO [
50].
Figure 12d presents selected-area electron diffraction patterns featuring concentric rings, where measured d-spacings of 0.35 nm and 0.18 nm correspond to the (101) and (211) planes of anatase TiO
2, while 0.24 nm and 0.15 nm spacings align with the (101) and (211) planes of NiO, respectively. These TEM analyses confirm the successful Ni incorporation into the TiO
2 lattice.
3.8. XPS Analysis
Figure 13 presents the XPS characterization of the 0.7% NIT sample for chemical state analysis. The survey spectrum (
Figure 13a) confirms the presence of Ti, O, Ni, and C elements, showing characteristic Ti 2p (458 eV), O 1s (530 eV), and Ni 2p (850–885 eV) core-level signals, verifying the successful Ni incorporation into TiO
2 via sol–gel synthesis. The detected C 1s signal originates from adventitious carbon contamination and/or CO
2 adsorption during sample handling. The high-resolution Ti 2p spectrum (
Figure 13b) displays spin-orbit split peaks at 458.4 eV (Ti 2p3/2) and 464.1 eV (Ti 2p1/2), confirming the dominant Ti
4+ oxidation state. The O 1s spectrum (
Figure 13c) deconvolutes into three components: lattice oxygen (Ti-O, 530.3 eV) [
51], surface hydroxyl groups (O-H, 531.5 eV) [
52], and adventitious carbon-bond oxygen (C-O, 533eV) from sample mounting [
53]. The Ni 2p spectrum (
Figure 13d) reveals characteristic doublets, with Ni 2p3/2 (854.8 eV) and 2p1/2 (871.1 eV) peaks corresponding to Ni
2+ in NiO [
54], accompanied by satellite peaks at 857.1 eV and 873.1 eV indicative of Ni
3+ species [
55] Additional spectral features at 862.1/876.6 eV and 866.5/880.9 eV for Ni 2p3/2 and 2p1/2, respectively, confirm the coexistence of stoichiometric and oxygen-deficient NiO phases [
54]. These results conclusively demonstrate nickel incorporation as NiO within the TiO
2 matrix.
As evidenced by reports in the literature, the Ti 2p3/2 peak typically appears at 458.8 eV. In this study, the XPS analysis of the 0.7% NIT sample reveals a notable shift in the Ti 2p3/2 peak toward a lower binding energy by approximately 0.4 eV, from 458.8 eV to 458.4 eV. Concurrently, the peak intensity corresponding to oxygen vacancies (Ov) exhibits a significant enhancement, indicating an increased oxygen vacancy concentration, which confirms that Ni doping induces structural defects. The Ni 2p3/2 binding energy at 854.8 eV corresponds to the Ni2+ oxidation state, demonstrating successful incorporation of Ni into the TiO2 lattice via substitutional doping at Ti4+ sites. The presence of Ni2+ substantially enhances the photocatalytic activity due to the following mechanisms: (1) Ni2+ substitution for Ti4+ induces lattice distortion, promoting oxygen vacancy formation. These vacancies act as electron traps, effectively suppressing electron–hole (e−-h+) recombination. (2) In contrast, Ni3+ may degrade the photocatalytic performance, as its strong oxidative nature facilitates hole recombination and tends to form unstable phases, such as NiOOH. Excessive structural defects caused by high-valent Ni could disrupt carrier transport.
The reduced Ti 2p binding energy suggests electron density redistribution, which facilitates the separation of photogenerated charge carriers. Additionally, the formation of Ni2+–Ti4+ interfaces enhances charge transfer efficiency, while oxygen vacancies prolong carrier lifetimes by serving as electron capture centers. Furthermore, Ni 3d orbitals introduce impurity energy levels within the bandgap, creating low-energy transition pathways that narrow the bandgap and expand visible-light absorption. These synergistic mechanisms collectively optimize the photocatalytic degradation performance of the 0.7% NIT sample.


