Article

Analysis of the Influence of Alternating Stress in the Multi-Cycle Injection Production Process

1
Oil and Gas Technology Institute, PetroChina Qinghai Oilfield Company, Dunhuang 736202, China
2
Faculty of Petroleum Engineering, China University of Petroleum (Beijing), Beijing 102249, China
*
Author to whom correspondence should be addressed.
Processes 2025, 13(4), 1158; https://doi.org/10.3390/pr13041158
Submission received: 17 March 2025 / Revised: 3 April 2025 / Accepted: 9 April 2025 / Published: 11 April 2025
(This article belongs to the Section Energy Systems)

Abstract

:
In order to study the influence of multi-cycle stress sensitivity on the injection–production effect, it is necessary to conduct multi-cycle stress sensitivity experiments on reservoir permeability and fracture conductivity first and then calculate the impact on the injection–production effect after the occurrence of the stress sensitivity effect by using the CMG software. After stress sensitivity occurs and the production rate decreases, the constraints of the well should be adjusted. The results showed that the conductivity of the 30–50 mesh ceramsite decreased by 15.94% after 100 cycles, while the conductivity of the 20–40 mesh quartz sand decreased by 51.17%. Under alternating stress, the reservoir permeability decreased significantly during the first 50 cycles, with an average decrease of 20.8%, but remained relatively stable in the later stages. When stress sensitivity was disregarded, the gas production rate of the ceramic and quartz sand stabilized at approximately 3700 m3/h and 2600 m3/h, respectively. When stress sensitivity was considered, the secondary gas cushion for ceramsite had to reach at least 500,000 m3 to maintain a gas production rate of over 3700 m3/h within 40 cycles after the gas cushion. When stress sensitivity was considered, the secondary gas cushion for quartz sand had to exceed 800,000 cubic meters to maintain the gas production rate of over 2600 m3/h within the first 30 cycles after the gas cushion. To sustain the gas production rate over the long term, it was necessary to increase the injection pressure per cycle. The gas injection pressure for ceramsite should be adjusted to more than 17 MPa, and the gas injection pressure for quartz sand should be adjusted to more than 19.3 MPa.

1. Introduction

Compressed air energy storage (CAES) is an energy storage technology that leverages advancements in gas turbines to store energy in the form of compressed air [1]. In the energy storage stage, the compressed air energy storage system utilizes wind, solar, or off-peak electricity to drive a compressor, converting the electric energy into air pressure energy. Then, the high-pressure air is sealed and stored in abandoned mines, caves, abandoned oil wells, or artificial gas storage tanks. In the energy release stage, high-pressure air is released to push the expansion turbine. The stored air pressure energy is converted into mechanical energy or electrical energy again. This process not only facilitates the accumulation of electrical energy but also addresses the stability issues associated with renewable energy sources, such as solar power [2].
A substantial body of research has been conducted both domestically and internationally on the stress sensitivity of low-permeability reservoirs. However, most scholars have primarily focused on the stress sensitivity during single-cycle injection–production processes in reservoirs. The variation patterns of rock permeability during pressurization and depressurization are relatively well understood [3,4,5], and the models correlating rock permeability with net stress have been established [6,7,8,9]. It has been widely applied in reservoir productivity calculation and well test analysis [10,11,12]. Currently, there is extensive research on short-term and long-term fracture conductivity [13], and the temporal variation laws of fracture conductivity are relatively clear [14,15]. Furthermore, numerical simulation models for fracture conductivity have been developed [16]. Studies on conventional gas reservoirs indicate that fracture conductivity typically decreases by approximately half during the early stages of production. As production progresses, the adverse effects of fracture conductivity stress sensitivity on gas well production become increasingly significant [15]. While these studies predominantly emphasize laboratory experiments, they mainly focus on matrix deformation and the attenuation of fracture conductivity during the production of conventional gas reservoirs. They do not adequately address the variations in the reservoir matrix and fractures during multi-cycle injection–production processes and their implications for compressed air energy storage [15]. The research results mainly focus on the short-term variations of permeability and fracture conductivity. It is inappropriate to calculate the long-term injection–production effect of the reservoir by using such short-term variations. This phenomenon, where reservoir permeability diminishes as the cycle count increases, is referred to as “periodic stress sensitivity”. This paper mainly quantifies the periodic stress sensitivities of permeability and fracture conductivity through experiments and analyzes their effects on the injection–production performance.
Under multi-cycle injection–production conditions, the stress sensitivity of reservoir permeability and fracture conductivity was tested using downhole core samples. Subsequently, a fracturing well productivity prediction model was established based on geological parameters. The CMG2020.10 software was used to simulate the injection–production performance of different proppants. Three distinct numerical simulation schemes were designed for both ceramsite and quartz sand proppants.
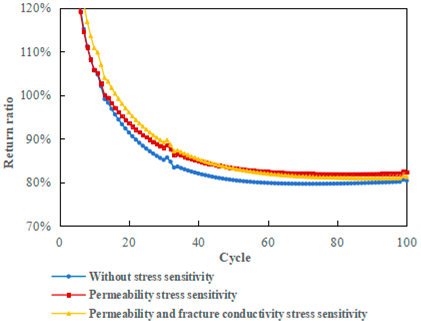
  • Stress sensitivity was not taken into account;
  • Only permeability stress sensitivity was considered;
  • Both permeability and fracture conductivity stress sensitivity were considered. Based on the simulation results, the appropriate proppant was selected. When the gas production rate declined, the secondary cushion gas process was simulated, and the gas injection pressure was increased to improve the gas production rate.

2. Stress Sensitivity Characteristics of Fracture Conductivity and Reservoir Permeability Under Multi-Cycle Injection–Production Conditions

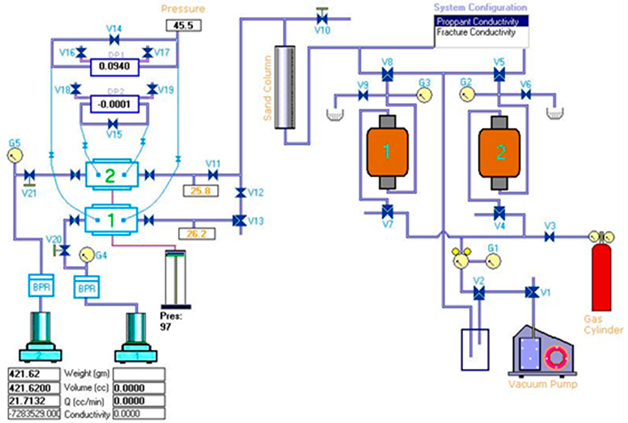
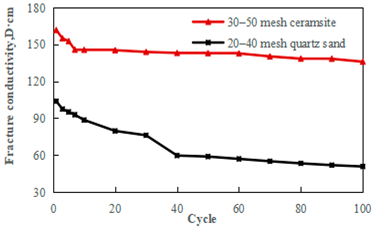
2.1. Testing of Fracture Conductivity Under Multi-Cycle Injection and Production Alternating Stress

The experiment used the FCES-100 fracture conductivity testing device manufactured by Core Lab in the United States. Figure 1 illustrates the working principle of the device, and Figure 2 shows the pre-laid ceramsite and quartz sand proppants.
The core of the target reservoir was selected and processed into rock slabs that conformed to the experimental size requirements, ensuring that the proppant could be effectively held within the rock slabs. The 20–40 mesh quartz sand and 30–50 mesh ceramsite proppant were chosen, with a proppant concentration of 10 kg/m2. During the experiment, the closing pressure on the proppant in each period varied within the range of 6–12 MPa. After the flow stabilized, the fracture conductivity at the high closure pressure in each period was tested.
As shown in Figure 3, the initial conductivity of the 30–50 mesh ceramsite proppant was relatively high. Under the influence of alternating closing pressure, its conductivity gradually decreased, resulting in a 15.94% reduction after 100 cycles. The conductivity dropped sharply during the first 0–40 cycles, slowed down afterward, and ultimately decreased by 51.17% after 100 cycles. These results indicated that alternating stress had a lesser impact on the conductivity of ceramsite proppants but a more significant effect on quartz sand. This difference can be attributed to the lower strength of quartz sand, which leads to breakage and embedding under alternating stress. Additionally, the generated debris entered the fracture, migrated with the fluid, and eventually blocked the fracture pores [14], thereby adversely affecting injection and production capacities.

2.2. Reservoir Permeability Evaluation Under Multi-Cycle Injection–Production Conditions

Three standard cores were drilled from the target reservoir and used as experimental rock samples. The core displacement experimental device and nitrogen gas were used. The confining pressure was adjusted within the range of 6 to 12 MPa, and the permeability of the core was measured after each cycle (Table 1).
As shown in Figure 4, the permeability gradually decreased with the increase in the number of injection–production cycles. Through comprehensive comparison, it was evident that lower permeability correlated with higher stress sensitivity. However, the most significant decrease in permeability occurred within the first 50–60 cycles, during which core deformation also became apparent. After 60 cycles, permeability stabilized, and the periodic plastic deformation of the rock sample diminished. The number of closed throats was reduced, and after 300 cycles, the permeability decreased by 20.8% on average. In the later stages, permeability remained relatively stable, satisfying the requirements for multi-cycle injection and production. Experimental results from several domestic scholars, utilizing both artificial rock samples and natural reservoir rock samples, indicate that rock permeability not only decreases with increasing net stress but also declines with the progression of injection–production cycles. Moreover, the amplitude of permeability reduction varied significantly between the early and late stages. In the early stages, the rate of decline was rapid, whereas in the later stages, the rate of decline slowed down [17,18,19,20,21,22].
By fitting the experimental data of core 3 using the power function on permeability under multi-period injection and production alternating stress, a quantitative relationship between formation permeability and cycles was established, providing essential data for evaluating the effectiveness of injection and production processes. This equation was applicable for describing the variation of permeability within the same reservoir.
k = k 0 C 0.041
In the formula, k represents the permeability of the formation (mD), and k 0 represents the initial permeability of the formation (mD). C represents the number of cycles.

3. Mathematical Models

(1) Equation of Motion:
υ l = K K r l μ l ( p l ρ l g D )
(2) Continuity equation:
( ρ l υ l ) + q l = ( ϕ ρ l S l ) t
(3) By Substituting the equation of motion into the continuity equation, the governing equations for gas–water two-phase flow in porous media can be derived as follows:
ρ l K K r l μ l ( p l ρ l g D ) + q l = ( ϕ ρ l S l ) t
q l represents the inflow and outflow terms of the gas phase and the liquid phase, with positive values for the inflow term and negative values for the outflow term. l represents gas or water.
(4) Auxiliary equation:
S g + S w = 1 P c g w ( x , y , z , S w ) = P c w g ( x , y , z , S w ) = P g P w ρ g = ρ g ( P g ) , ρ w = ρ w ( P w ) μ g = μ g ( P g ) , μ w = μ w ( P w ) , K rg = K rg ( x , y , z , S w ) , K rw = K rw ( x , y , z , S w ) ϕ = ϕ ( x , y , z , P ) K = K ( x , y , z ) q g = q g ( x , y , z , t ) , q w = q w ( x , y , z , t )
In the concrete solution process, reservoir numerical simulation software is essential for conducting productivity prediction and analysis.

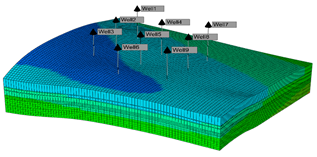
4. Establishment of the Capacity Prediction Model

According to the actual reservoir parameters of the study block, a productivity prediction model for fractured wells was established. The gas injection and production processes in low-porosity and low-permeability reservoirs were simulated using CMG software. The simulated well set comprised nine fractured vertical wells. Initially, cushion gas was injected to increase formation pressure, followed by the simulation of the injection and production process. As shown in Figure 5, the hydraulic fracture location was characterized through grid refinement, with a fracture half-length of 120 m.
The duration of the cycle and the pressure were set according to the on-site injection–production system, and the fractures were set according to the on-site fracturing. During the simulation, the nine wells collectively contained 10 million cubic meters of cushion gas in the early stage, and each well was injected at a rate of 2200 m3/h during the gas cushion period. After the gas cushion phase concluded, the injection–production cycle commenced, with each cycle consisting of 8 h of gas injection and 4 h of gas production. During gas injection, the injection bottomhole pressure was maintained at 16.5 MPa, while the production bottomhole pressure was set to 12.5 MPa during gas production (as shown in Table 2). The simulation used the CMG restart function, where the injection–production states prior to the onset of stress sensitivity were utilized as the initial conditions for late stress sensitivity calculations.

5. Influence of Stress Sensitivity on the Effect of Air Compression Energy Storage Injection and Production

5.1. Analysis of Injection and Production Effect of Ceramsite Proppant Considering Stress Sensitivity

As shown in Figure 6 and Figure 7, when ceramsite proppant was used, the following observations can be made: If only permeability change was considered, the gas accumulation effect of the reservoir was enhanced due to reduced permeability, leading to an increased return ratio. However, the cumulative gas production decreased by 2.06%. When both permeability changes and fracture conductivity changes were taken into account during the first 50 cycles, the gas accumulation effect remained strong due to decreased permeability. If the changes in permeability and fracture conductivity were considered at the same time in the first 50 cycles, the gas accumulation effect of the reservoir was enhanced due to the decrease in permeability. Subsequently, owing to the sufficient cushion gas energy, the reservoir pressure remained higher, resulting in a return ratio that exceeded the scenario where only permeability changes were considered. After 50 cycles, however, the combined effects of reduced permeability and reduced cushion gas energy led to a lower return ratio, compared to the case where only permeability change was considered. Additionally, the cumulative gas production was 12.41% lower than in the scenario without stress sensitivity.
As shown in Figure 8 and Figure 9, when only permeability change was considered, the gas production rate decreased by 2.00%, and the gas injection rate was reduced by 4.27%, compared to scenario without stress sensitivity. When both permeability reduction and fracture conductivity decline were factored in, the gas production rate and gas injection rate decreased by 13.94% and 14.84%, respectively, relative to the case without stress sensitivity. As shown in Table 3, after the stress sensitivity effect occurred, the range of pressure propagation became more limited. Generally, the stress sensitivity effect of the 30–50 mesh ceramsite had a minimal impact on injection and production performances. Therefore, the 30–50 mesh ceramsite is suitable for working conditions involving multi-cycle alternating stress.

5.2. Analysis of the Injection and Production Effect of Quartz Sand Considering Stress Sensitivity

As shown in Figure 10 and Figure 11, when only the stress sensitivity of permeability was considered, the gas accumulation effect in the reservoir was enhanced due to the reduction in permeability, which inhibited gas dispersion. Consequently, the return ratio increased while the cumulative gas production decreased by 0.40%. If both the changes in permeability and fracture conductivity were taken into account simultaneously, during the first 60 cycles, the decline in permeability enhanced the gas accumulation effect in the reservoir. This is attributed to the sufficient energy of cushion gas and the high reservoir pressure, leading to a higher return ratio, compared to considering only the change in permeability. However, after 60 cycles, the combined effects of reduced permeability and the depletion of cushion gas energy resulted in a return ratio that was 3.54% lower than in the scenario without stress sensitivity. Additionally, the cumulative gas production was 40.13% lower than in the case where stress sensitivity was not considered.
As shown in Figure 12 and Figure 13, when only permeability change was taken into account, the gas production rate exhibited minimal variation, compared to the scenario without stress sensitivity, while the gas injection rate decreased by 3.37% relative to the case without stress sensitivity. When both the stress sensitivity of the permeability and fracture conductivity were considered, the gas production rate and gas injection rate decreased significantly by 47.97% and 45.44%, respectively. As can be observed from Table 4, after the stress sensitivity effect occurred, the pressure distribution range decreased. In summary, the stress sensitivity effect on permeability alone had a negligible impact on both the gas injection rate and gas production rate. In general, the stress sensitivity effect of the permeability had little influence on the gas injection rate and gas production rate. However, when the stress sensitivity effects on both permeability and fracture conductivity were considered simultaneously, the gas injection rate and gas production rate decreased significantly. Therefore, the 20–40 mesh quartz sand is unsuitable for working conditions involving multi-cycle alternating stress.

6. Analysis of Injection and Production Parameter Adjustments

After stress sensitivity occurred, the gas production rate decreased significantly. To enhance the gas production rate and meet production demands, a secondary cushion gas was required. After 100 cycles, simulations were conducted to analyze the change in gas production rates and the short-term adjustment of injection pressure. These simulations utilized a secondary gas cushion composed of 30–50 mesh ceramsite (ranging from 100,000 to 800,000 m3) and 20–40 mesh quartz sand (ranging from 300,000 to 1,000,000 m3).

6.1. Analysis of the Working System for the Secondary Gas Cushion of the Ceramsite Proppant

As shown in Figure 8 and Figure 14, when stress sensitivity was disregarded, the gas production rate stabilized at approximately 3700 m3/h after 100 injection–production cycles. When stress sensitivity was considered, the secondary gas cushion for the 30–50 mesh ceramsite proppant had to reach at least 500,000 m3 to maintain a gas production rate of over 3700 m3/h within 40 cycles after the gas cushion. Given that proppant breakage and embedding were inevitable during the injection–production process, the loss of fracture conductivity was irreversible. Consequently, the secondary gas cushion could only temporarily maintain the gas production rate, which inevitably declined during subsequent injection–production cycles. As shown in Figure 15, the injection rate after the secondary gas cushion remained lower than that under conditions without stress sensitivity. To sustain the gas production rate in later stages, it was necessary to increase the injection pressure for each cycle.
As shown in Figure 16 and Table 5, following the simulation of the 500,000 cubic meter secondary gas cushion in a single well, the gas production rate varied under different injection pressures (ranging from 16.5 to 19 MPa). When stress sensitivity was disregarded, the gas production rate stabilized at approximately 3700 m3/h after 100 injection–production cycles. After the occurrence of the cyclic stress sensitivity effect, in order to achieve a production rate of 3700 m3/h, the gas injection pressure had to be increased to at least 17 MPa.

6.2. Analysis of the Working System for the Secondary Gas Cushion of Quartz Sand

As shown in Figure 12 and Figure 17, when stress sensitivity was neglected, the gas production rate stabilized at approximately 2600 m3/h after 100 cycles. When permeability and fracture conductivity stress sensitivity were considered, the secondary gas cushion had to exceed 800,000 cubic meters to maintain the gas production rate of over 2600 m3/h within the first 30 cycles after the gas cushion. In comparison with the ceramsite proppant, quartz sand exhibited greater susceptibility to alternating closure stress, leading to more severe crushing and embedment during the injection and production process. Consequently, given the same volume of secondary gas, the gas production rate of quartz sand did not surpass that of the ceramsite proppant, nor did it remain stable for as long a duration. The secondary gas cushion can only sustain the gas production rate for a limited time, after which the gas production rate will continue to decline during the subsequent injection and production process. As shown in Figure 18, the gas injection rate of quartz sand was consistently lower than that of the ceramsite proppant.
As shown in Figure 19 and Table 6, following the simulation of an 800,000 m3 secondary gas cushion in a single well, the gas production rate varied under different injection pressures (16.5–20 MPa). When stress sensitivity was neglected, the gas production rate stabilized at approximately 2600 m3/h after 100 cycles. After the occurrence of the cyclic stress sensitivity effect, in order to achieve a production rate of 2600 m3/h, the gas injection pressure had to be increased to at least 19.3 MPa, although the injection pressure of this gas was lower than the 35 MPa fracture pressure of the formation. However, when using the 20–40 mesh quartz sand, stress sensitivity impacts on permeability and fracture conductivity became significant. Consequently, higher gas injection pressures were required to sustain the desired production rate, which may compromise the overall efficiency and safety of system operations.

7. Conclusions

  • The multi-cycle stress sensitivity effect on reservoir permeability and fracture conductivity can result in a suboptimal injection–production performance, with the impact on permeability being relatively minor.
  • Under alternating stress conditions, the strength of the rock and the compressive strength of the proppant will decline, which will lead to a significant reduction in reservoir permeability and fracture conductivity, and consequently, the gas production rate tends to decrease. To maintain a high gas production rate, a secondary gas cushion is required. Specifically, for a single well using the 30–50 mesh ceramsite proppant, the secondary gas cushion should exceed 500,000 cubic meters, while for a single well using the 20–40 mesh quartz sand, it should exceed 800,000 cubic meters to ensure effective injection and production.
  • Compared to the quartz sand, the ceramsite proppant is less affected by the alternating stress, but the fracture conductivity can be maintained at a high level. Under the same secondary cushion gas, the gas production rate of the ceramsite proppant is significantly higher than the quartz sand proppant. Therefore, the 30–50 mesh ceramsite is recommended as the preferred choice.
  • The gas production rate will continue to decline in the later stage of injection and production. To maintain a long-term gas production rate, it is necessary to increase the gas injection pressure. For the ceramsite proppant, the gas injection pressure should be adjusted to over 17 MPa, whereas for quartz sand, it should be increased to over 19.3 MPa.
  • This paper can provide certain guidance for research on the periodic stress sensitivity and has reference value for the adjustment of the injection–production system of air compression energy storage.

Author Contributions

Conceptualization, S.L.; numerical modeling, E.Z.; investigation, B.M.; writing, H.L. and J.Y.; writing-review and editing G.S. and X.Y.; funding acquisition, X.M.; project administration L.W. All authors have read and agreed to the published version of the manuscript.

Funding

This study on the optimization of compressed air energy storage to improve injection and production effects was funded by the Institute of Drilling and Production Technology 2023 Technology 056.

Data Availability Statement

The original contributions presented in the study are include in the article; further inquiries can be directed to the corresponding author.

Conflicts of Interest

Authors Shiduo Liu, Endong Zhao, Bin Ma, Huan Liu, Jianxuan Yang, Guojie Sui were employed by the company PetroChina Qinghai Oilfield Company. The remaining authors declare that the research was conducted in the absence of any commercial or financial relationships that could be construed as a potential conflict of interest.

References

  1. Yang, Y.; Zhang, Y.; Mo, K. Development and Outlook of New Technologies for Energy Storage. China Heavy Equip. 2022, 4, 27–32. [Google Scholar]
  2. Yu, L.Z.; Hong, L.; Hui, L.Z.; Tao, H.J. The development status and application prospect of compressed air energy storage. Resour. Econ. Environ. Prot. 2023, 8, 5–8. [Google Scholar] [CrossRef]
  3. Shao, J.; You, L.; Kang, Y.; Gao, X.; Chen, M.; Meng, S.; Zhang, N. Experimental study on stress sensitivity of underground gas storage. J. Pet. Sci. Eng. 2020, 195, 107577. [Google Scholar] [CrossRef]
  4. Cao, N.; Lei, G. Stress sensitivity of tight reservoirs during pressure loading and unloading process. Pet. Explor. Dev. 2019, 46, 132–138. [Google Scholar] [CrossRef]
  5. Wang, Z.W.; Zhang, N.S.; Lu, H.B. Formation Damage Mechanisms of Low-permeability Gas Reservoir and Its Preventive Measures. Nat. Gas Ind. 2003, 23, 28–31. [Google Scholar]
  6. Lei, Q.; Xiong, W.; Yuan, J.; Cui, Y.; Wu, Y.S. Analysis of stress sensitivity and its influence on oil production from tight reservoirs. In Proceedings of the SPE Eastern Regional Meeting, Lexington, KY, USA, 17 October 2007. [Google Scholar]
  7. Tan, X.H.; Liu, C.Y.; Li, X.P.; Wang, H.Q.; Deng, H. A stress sensitivity model for the permeability of porous media based on bi-dispersed fractal theory. Int. J. Mod. Phys. C 2018, 29, 1850019. [Google Scholar] [CrossRef]
  8. Zhan, S.; Qi, L.; Zhang, Y.; Li, L.; Zhao, Z. Changes in porosity and permeability with net overburden pressure in tight sandstone reservoirs. Complex Hydrocarb. Reserv. 2015, 8, 52–56. [Google Scholar]
  9. Yang, B.; Hou, D.; Long, G.; Ren, C. Research and application of stress sensitive experiment on low permeable reservior. Reserv. Eval. Dev. 2012, 2, 41–45. [Google Scholar] [CrossRef]
  10. Yang, S.; Yang, Q.; Xiao, X.; Wang, X. Stress Sensitivity of Rock and Its Influence on Productivity for Gas Reservoirs with Abnormal High Pressure. Nat. Gas Ind. 2005, 25, 94–95. [Google Scholar]
  11. Ouyang, W.; Sun, H.; Zhang, M. Well test analysis for multistage fractured horizontal wells in tight gas reservoir considering stress sensitivity. Acta Pet. Sin. 2018, 39, 570–577. [Google Scholar]
  12. Weiming, W.E.; Shaopeng, Z.H.; Mao, L.I. Stress sensitivity features and productivity equations of offshore abnormal high-pressure gas reservoirs: A case study from the Yinggehai Basin. Nat. Gas Ind. 2014, 34, 59–63. [Google Scholar]
  13. Yuan, Z.; Hua, J.; Yuan, W.K.; Zhang, B.-B. Experimental study on long term conductivity decline of hydraulic fracturing fracture. Unconv. Oil Gas 2022, 9, 78–82. [Google Scholar]
  14. Yang, Z.; Chen, M.; Xu, Y.; Meng, C.; Xu, Z. An experimental study of long-term flow conductivity of volcanic rock core plate. Nat. Gas Ind. 2010, 30, 42–44. [Google Scholar]
  15. Luo, R.-L.; Lei, Q.; Fan, J.-W.; Liao, H.M.; Wang, Z. The influence of stress sensitivity on production of hydraulically-fractured tight gas wells. J. Chongqing Univ. (Nat. Sci. Ed.) 2011, 34, 95–99. [Google Scholar]
  16. Zhu, H.; Shen, J.; Zhou, H. Numerical simulation on propped fracture conductivity. Acta Pet. Sin. 2018, 39, 1410–1420. [Google Scholar]
  17. Daoyong, Z.H.; Ping, G.; Jianfen, D. Laboratory researches on stress sensibility of underground gas storage. Nat. Gas Ind. 2006, 26, 122–124. [Google Scholar]
  18. Wang, B.-H.; Yan, X.-Z.; Liu, X.-D.; Yang, X.-J. Study on the Migration Law of the Underground Gas Storage Reservoir in Aquifer in Fluid-solid Coupling. Sci. Technol. Eng. 2014, 14, 29–33. [Google Scholar]
  19. Shunli, H.; Chengquan, M.; Jiashen, Z. Study on Percolation Characteristics of Reservoirs’ Injection-Production in Dazhangtuo Underground Gas Storage. Nat. Gas Ind. 2006, 26, 90–92. [Google Scholar]
  20. Liu, C.J. Study on Injection-Production Seepage Mechanism of Wen 96 Underground Gas Storage. Master’s Thesis, Southwest Petroleum University, Chengdu, China, 2014. [Google Scholar]
  21. Kong, Q.; Wang, H.L.; Xu, W.Y. Experimental study on permeability and porosity evolution of sandstone under cyclic loading and unloading. Chin. J. Geotech. Eng. 2015, 37, 1893–1900. [Google Scholar]
  22. Li, J.; Zhao, G.; Qi, Z.; Yin, B.; Xu, X.; Fang, F.; Yang, S.; Qi, G. Stress sensitivity of formation during multi-cycle gas injection and production in an underground gas storage rebuilt from gas reservoirs. Pet. Explor. Dev. 2021, 48, 835–842. [Google Scholar] [CrossRef]
Figure 1. Principle diagram of FCES-100.
Processes 13 01158 g001
Figure 2. Ceramic and sand proppants.
Processes 13 01158 g002
Figure 3. The impact of multi-cycle injection–production on fracture conductivity.
Processes 13 01158 g003
Figure 4. The impact of multi-cycle injection–production on permeability.
Processes 13 01158 g004
Figure 5. Numerical model diagram of 9 injection–production wells.
Processes 13 01158 g005
Figure 6. Comparison of the return ratio under fixed injection and production pressure for the ceramic proppant.
Processes 13 01158 g006
Figure 7. Comparison of cumulative gas production under fixed injection and production pressure for the ceramic proppant.
Processes 13 01158 g007
Figure 8. Comparison of production rates under fixed injection and production pressure for the ceramic proppant.
Processes 13 01158 g008
Figure 9. Comparison of injection rates under fixed injection and production pressure for the ceramic proppant.
Processes 13 01158 g009
Figure 10. Comparison of return ratio under fixed injection and production pressure for Sand.
Processes 13 01158 g010
Figure 11. Comparison of cumulative gas production under fixed injection and production pressure for sand.
Processes 13 01158 g011
Figure 12. Comparison of production rates under fixed injection and production pressure for sand.
Processes 13 01158 g012
Figure 13. Comparison of injection rate under fixed injection and production pressure for sand.
Processes 13 01158 g013
Figure 14. Comparison of production rates under different secondary gas cushion volumes for the ceramic proppant.
Processes 13 01158 g014
Figure 15. Comparison of injection rates under different secondary gas cushion volumes for the ceramic proppant.
Processes 13 01158 g015
Figure 16. Comparison of production rates under different injection pressures for the ceramic proppant.
Processes 13 01158 g016
Figure 17. Comparison of production rates under different secondary gas cushion volumes for sand.
Processes 13 01158 g017
Figure 18. Comparison of injection rates under different secondary gas cushion volumes for sand.
Processes 13 01158 g018
Figure 19. Comparison of production rates under different injection pressures for sand.
Processes 13 01158 g019
Table 1. The change in permeability.
Core NumberInitial Value of Permeability (mD)Final Value of Permeability (mD)
Core10.000770.00070
Core20.000610.00057
Core30.000640.00034
Table 2. Property of the reservoir.
ParameterValue
Top depth of reservoir (m)1317
Porosity (%)0.07
Formation permeability (mD)0.0067
Original formation pressure (MPa)11
Table 3. Summary of production data for the ceramic proppant.
Stress Sensitivity Is Not ConsideredPermeability Stress SensitivityPermeability and Fracture Conductivity Stress Sensitivity
Accumulated gas production of 9 wells/104m31437.561407.891259.15
Accumulated gas injection of 9 wells/104m31645.221573.901394.10
Cushion gas/104m3100010001000
Bottom hole pressure after gas cushion/MPa18.7718.7718.77
Final gas injection rate/m3/h2330.832231.321984.89
Final gas production rate/(m3/h)3746.363671.323224.12
Return ratio80.36%82.26%81.21%
Pressure spread range/km20.4220.4010.394
Table 4. Summary of production data for sand.
Stress Sensitivity Is Not ConsideredPermeability Stress SensitivityPermeability and Fracture Conductivity Stress Sensitivity
Accumulated gas production of 9 wells/104m31054.551050.38631.32
Accumulated gas injection of 9 wells/104m31180.461139.88629.88
Cushion gas/104m3100010001000
Bottom hole pressure after gas cushion/MPa20.2920.2920.29
Final gas injection rate/(m3/h)1692.491635.38923.44
Final gas production rate/(m3/h)2592.092594.461348.65
Return ratio76.57%79.32%73.03%
Pressure spread range/km20.4000.3830.360
Table 5. Summary of production data under different secondary gas cushion volumes.
Secondary gas cushion volume/104m31020304050607080
Accumulated gas production of 9 wells/104m32477.352523.812568.472613.322656.522699.992741.802783.97
Accumulated gas injection of 9 wells/104m31404.031383.961369.141347.471330.431310.211295.741279.40
Bottom hole pressure after gas cushion/MPa18.5819.1019.5019.8520.1720.4820.7621.04
Final gas injection rate/m3/h1970.211963.611955.301952.171947.411943.081934.071928.22
Final gas production rate/m3/h3309.483328.573368.753376.453399.033405.153439.093461.99
Return ratio84.00%84.79%86.18%86.35%87.32%87.58%88.80%89.64%
Pressure spread range/km20.5360.5510.5640.5760.5890.6020.6160.628
Table 6. Summary of production data under different secondary gas cushion volumes for sand.
Secondary gas cushion volume/104m330405060708090100
Accumulated gas production of 9 wells/104m31256.981303.151348.081392.431435.991478.931521.161562.72
Accumulated gas injection of 9 wells/104m3628.49616.41604.92593.68582.75572.14561.77551.81
Bottom hole pressure after gas cushion/MPa24.6424.9225.2625.5725.8726.1526.4926.68
Final gas injection rate/(m3/h)911.91907.38902.68898.07893.44889.18884.58880.95
Final gas production rate/(m3/h)1430.771460.771491.971523.171554.681577.871609.651660.00
Return ratio78.45%80.49%82.64%84.80%87.01%88.73%90.98%94.22%
Pressure spread range/km20.5030.5240.5410.5590.5750.5910.6070.622
Disclaimer/Publisher’s Note: The statements, opinions and data contained in all publications are solely those of the individual author(s) and contributor(s) and not of MDPI and/or the editor(s). MDPI and/or the editor(s) disclaim responsibility for any injury to people or property resulting from any ideas, methods, instructions or products referred to in the content.

