Article

Optimizing Energy Storage Participation in Primary Frequency Regulation: A Novel Analytical Approach for Virtual Inertia and Damping Control in Low-Carbon Power Systems

1
School of Mechanical and Electrical Engineering, Guangzhou University, Guangzhou 510006, China
2
Law School, Shantou University, Shantou 515063, China
*
Authors to whom correspondence should be addressed.
Processes 2025, 13(4), 1146; https://doi.org/10.3390/pr13041146
Submission received: 14 March 2025 / Revised: 3 April 2025 / Accepted: 9 April 2025 / Published: 10 April 2025
(This article belongs to the Special Issue Process Systems Engineering for Environmental Protection)

Abstract

:
As renewable energy penetration increases, maintaining grid frequency stability becomes more challenging due to reduced system inertia. This paper proposes an analytical control strategy that enables distributed energy resources (DERs) to provide inertial and primary frequency support. A reduced second-order model is developed based on aggregation theory to simplify the multi-machine system and facilitate time-domain frequency analysis. Building on this model, we design virtual inertia and damping coefficients for the frequency response, ensuring that it meets acceptable limits for both overshoot and steady-state deviation. To address energy storage constraints, an adaptive strategy is introduced to adjust control parameters dynamically based on the state of charge (SOC). Simulation results validate the accuracy of the aggregation model, showing that it closely approximates the full multi-machine system with minimal error. The proposed method significantly enhances frequency stability under varying load conditions while maintaining efficient SOC utilization. This study provides a practical framework for integrating DERs into grid frequency regulation by combining analytical control design with SOC-aware adaptation. The approach offers a computationally efficient alternative to detailed models, supporting more responsive and stable low-inertia power systems.

1. Introduction

Renewable energy has made remarkable progress during the last decade. From 2013 to 2023, the total installed wind power expanded nearly fivefold [1]. As the advances of the commercialization process of offshore wind power, this upward momentum is projected to persist over the coming decades. Nevertheless, as renewable sources like wind and photovoltaic energy become more prevalent [2], many units utilizing maximum power point tracking (MPPT) techniques lack intrinsic frequency response functions, resulting in a significant reduction in system inertia [3]. To address these challenges, energy storage systems can be controlled to emulate the inertial response of synchronous generators by providing virtual inertia, thereby enhancing the frequency stability of power systems [4]. This approach has been widely recognized and adopted in modern low-inertia power systems. In China, an estimated 138 GW of electrochemical energy storage may be required by 2030 to mitigate the challenges posed by the increasing penetration of renewable energy sources [5]. Therefore, many power system operators are trying to find ways to enhance the auxiliary role of new energy sources, such as wind, photovoltaics and storage, in frequency control, while safeguarding power quality [6,7,8].
Numerous studies have investigated control strategies that enable distributed energy resources (DERs), such as wind turbines, photovoltaic systems, and energy storage, to contribute to primary frequency regulation. These studies encompass various methods including virtual inertia control, MPPT deviation, and coordinated virtual synchronous generator (VSG) strategies. In Ref. [9], wind turbines are typically configured to operate under the MPPT algorithm in standard conditions, but frequency regulation can be improved by temporarily deviating from the MPPT operation. Specifically, by discharging rotor kinetic energy and employing virtual inertia control, wind turbines can actively contribute to frequency regulation. VSG control is a more comprehensive control strategy, and it has been proposed to further enhance frequency regulation. It integrates virtual inertia, virtual damping, and frequency droop control to simulate the behavior of conventional synchronous generators. This enables DERs to not only respond quickly to frequency disturbances (via virtual inertia) but also maintain long-term grid stability (via virtual damping and droop control). By mimicking the dynamic behavior of synchronous generators, VSG control allows DERs to provide effective frequency support in systems with high renewable energy penetration. In Ref. [10], a flexible control approach targeting virtual parameters within a virtual synchronous generator (VSG) system incorporating energy storage is proposed to improve wind power’s responsiveness to primary frequency regulation. In Ref. [11], the integrated inertia control parameters are optimized, showing that increasing virtual inertia control can worsen the system’s frequency response when frequency modulation resources are inadequate. In Ref. [12], an advanced wind turbine control strategy is presented, utilizing a real-time reduced-order model of the power grid. This strategy takes into account transient grid dynamics and enables accurate coordination among multiple wind farms for synchronized frequency regulation.
Current research on energy storage control strategies primarily focuses on whether energy storage systems participate in frequency regulation independently or in coordination with wind farms and photovoltaic power plants [13]. Integrated inertia control strategies [14,15,16,17] include the following: (i) direct setting of the proportional and differential coefficients and (ii) dynamically adjusting the integrated inertia control parameters using adaptive methods. However, the necessity and optimality of adopting this strategy for energy storage have yet to be fully explored. Regarding the first approach, Ref. [18] presents a refined control scheme tailored for battery-based energy storage systems (BESSs), aimed at mitigating wind power fluctuations and their impact on grid frequency. Ref. [19] proposes a coordinated VSG control method for photovoltaic (PV) systems and BESSs, which not only optimize PV output but also enhance grid frequency stability. Ref. [20] proposes an integrated planning approach that accounts for frequency-related limitations, optimizing the configuration of generation as well as storage systems to ensure stable grid frequency performance under conditions of high renewable energy penetration. Using the latter approach, Ref. [21] proposes a flexible VSG (FVSG) control strategy with adaptive inertia. Unlike conventional fixed-parameter designs, the proposed method dynamically adjusts the inertia coefficient based on a nonlinear function of the system’s rate of change of frequency (RoCoF). This approach allows the system to provide faster and smoother inertial response during frequency disturbances, as validated through Matlab/Simulink simulations. However, the specific method for selecting coefficients is not discussed. Ref. [22] proposes a virtual inertia regulation method incorporating a fuzzy-based secondary controller to enhance microgrids’ voltage/frequency dynamic response. However, no theoretical analysis is provided on the fuzzy decision table, which is somewhat complex. Refs. [23,24] propose a BESS planning approach constrained by operational conditions, aimed at ensuring adequate primary frequency support. Nevertheless, these models overlook critical stability metrics, including frequency nadir, rate-of-change-of-frequency (ROCOF), and quasi-steady-state frequency deviation, thereby failing to fully address system frequency stability assurance.
Based on the principle of aggregation and compensation, this study introduces an innovative analytical control approach for the coordinated integration of wind and photovoltaic energy storage systems into inertial and primary frequency modulation, fully leveraging the fast, flexible, and adaptable nature of power electronic components. Firstly, a simplified aggregated second-order model is established, in which the system frequency and combined governor dynamics are treated as state variables, while load variations serve as external inputs. This formulation preserves the core characteristics of traditional synchronous generators. Subsequently, by utilizing the analytical tractability of the reduced-order model, the transfer function for the integrated frequency regulation process is developed to match the desired dynamic frequency profile. The participation of wind photovoltaic storage-assisted primary frequency modulation optimization is optimally quantified by incorporating the known parameters of the conventional generator unit. The contributions of this paper to the research field are as follows:
  • Establishing the second-order model of load frequency control based on aggregation theory to replace the original complex multi-unit model and enabling analysis of the time-domain frequency trajectory.
  • Developing a fast analytical method based on the compensation principle to calculate DERs’ virtual inertia and damping coefficients and guaranteeing a desired frequency overshoot and steady-state offset.
  • Proposing a flexible regulation scheme for energy storage systems involved in frequency control, and dynamically adjusting synthetic inertia and damping coefficients according to state of charge (SOC) levels.
The structure of this paper is arranged as follows: Section 2 introduces the dynamic modeling framework for individual components, including generators, wind power, and energy storage systems, and establishes a simplified second-order representation for the entire system. This model facilitates the determination of overall inertia and damping parameters, as elaborated in Section 3. Section 4 demonstrates the effectiveness of the proposed approach through simulation-based case studies. Finally, Section 5 concludes this paper with key findings and suggestions for future research.

2. System Dynamical Models

This section presents the relevant mathematical formulations used to model the behavior of generators and DERs. In this study, we used MATLAB R2023b software for the simulation research, with the software version number 23.2.0.2365128 (64-bit), released on 23 August 2023. MATLAB is developed and distributed by MathWorks, located in Natick, MA, USA.

2.1. Design Ideas

As shown in Figure 1, the power network comprises two traditional synchronous generators alongside two distributed energy resources (DERs). In general, three-phase grid-connected inverters are equipped with power controllers that receive predefined commands for active and reactive power and incorporate phase-locked loops (PLLs) to track grid frequency variations [25]. By tracking the condition of grid frequency, DER calculates and regulates the active power in response to the variation in frequency offset relative to the synchronous frequency ω s after the current load Δ P l o a d to match the dynamic process of grid demand.
In this study, a simplified second-order model is developed, where the system frequency and integrated governor dynamics are treated as state variables, with load disturbances serving as the input. This model’s analytical simplicity is leveraged to derive closed-form expressions for the time-domain frequency trajectories. These trajectories are parameterized in terms of the equivalent damping and inertia parameters, which are characterized as the combined contributions of the damping and inertia terms from both the generator and the photovoltaic-storage-based DERs. Finally, the total damping and inertia contributions from the DER are decomposed to isolate the specific contribution of the DER alone.

2.2. Synchronous-Generator Dynamics

Frequency is a critical parameter in synchronous generator (SG)-based power systems, ensuring the synchronization of power equipment with the grid [26]. As such, requirements related to frequency performance are fundamental to grid regulations and must be carefully considered when designing frequency support strategies for DERs. Traditionally, the regulation of grid frequency is achieved via the rotor dynamics of synchronous generators, with mechanical inertia and damping properties influencing the system’s dynamic frequency behavior, following the swing equation.
As illustrated in Figure 2, the inertia parameter H and damping factor D are the key factors determining the dynamics of active power and frequency. Specifically, the inertia constant primarily influences the ROCOF, while the damping gain has a more significant effect on the deviation in steady-state frequency. In large-scale power systems, ROCOF is primarily governed by the system’s total inertia, while the steady-state frequency deviation is more closely associated with the system’s total damping. Therefore, to design effective virtual inertia regulation (VIR) and frequency attenuation control (FAC) strategies for DERs, it is essential to first study the dynamics of synchronous generators. Typically, the dynamics of power system stabilizers (PSSs) are neglected when analyzing phenomena related to primary frequency response, and the dynamics of the automatic voltage regulator (AVR) are assumed to be stable. Under these assumptions, the set G is defined as the collection of synchronous generator units participating in the DER aggregation model. Specifically, G = { 1 , 2 , , G } , where G represents the total number of synchronous generators included in the aggregated dispatch. Consequently, the behavior of each individual synchronous generator is described as follows:
θ ˙ g = ω g ω s
J g ω ˙ g = P g m D g ( ω g ω s ) P g e
τ g P ˙ g m = P g m R g ( ω g ω s )  
Equations (1a) and (1b) together describe the rotor dynamics of the synchronous generator. Specifically, (1a) represents the evolution of the rotor electrical angular position, and (1b) is the swing equation that models the generator’s frequency response under the influence of mechanical input power, load damping, and electrical output. (1c) describes the governor dynamics, where the mechanical power output is adjusted in response to the frequency deviation between the generator and the nominal grid. These three equations form a coupled dynamic model for conventional synchronous generators under primary frequency control. θ g , ω g , and ω s are the rotor electrical angular position, machine operating frequency, and synchronous frequency, respectively; J g denotes the moment of inertia, while D g represents the damping factor associated with load variations; R g corresponds to the reciprocal of the speed-droop coefficient used in frequency-power regulation, and τ g is the turbine time constant; P g m is turbine mechanical power, and P g e denotes the total electrical power at bus g given by P g e = P g , load + l N g P g , l , where P g , load denotes the power demand at bus g, and P g , l indicates the active power transmitted from bus g to l .

2.3. Frequency-Responsive DER Model

Due to the flexible and adaptable nature of the power output of energy storage, distributed energy resources, in conjunction with energy storage, can output an arbitrarily shaped power curve when interfaced with the grid via a power electronic unit [27]. Consider the following dynamic model for DER d D :
θ ˙ d = ω d ω s
J d ω ˙ d = D d ( ω d ω s ) P d e
The dynamic frequency behavior of the DER located at bus d is described as the droop coefficient D d , and the inertial response is determined by the synthetic-inertia constant J d ; P d e denotes the total electrical power at bus d given by P d e = P d , load + l N d P d , l , where P d , load is the load at bus d, and P d , l represents the active power transferred from bus d to l .

2.4. Reduced Second-Order Model

In this section, we aggregate the inertia coefficients, damping coefficients, and time constants to derive a simplified second-order model that effectively captures the dynamics of system frequency.
(1) Aggregation of inertia and damping coefficients:
Assume the system initially operates at the steady-state equilibrium point with ω g = ω d = ω s , g G , d D . Defining Δ ω = ω g ω s = ω d ω s , (1b) and (3) can be reformed as
J g Δ ω ˙ = P g m D g Δ ω P g e
J d Δ ω ˙ = D d Δ ω P d e
The frequency deviation Δ ω is assumed to be uniform across all nodes, which is a standard simplification in synchronous systems. While small local variations may exist in practice, they are typically negligible for primary frequency response analysis. Aggregating Equation (4) across g G and Equation (5) over all d D , we can obtain the following:
J net Δ ω ˙ = D net Δ ω + g G P g m g G P g e d D P d e
where J net denotes the equivalent system inertia, and D net represents the overall damping coefficient
J net = g G J g + d D J d
D net = g G D g + d D D d
Analyze the total electrical power, we have the following:
g G P g e + d D P d e = g G P g , load + d D P d , load + g G l N g P g , l + d D l N d P d , l
Notice that the right-hand term in (9) is equal to the total electrical load of the whole network, i.e.,
P load = g G P g , load + d D P d , load + g G l N g P g , l + d D l N d P d , l
Then, the rotor equation dynamic expression (6) can be integrated as follows:
J net Δ ω ˙ = D net Δ ω + g G P g m P load
The order of the rotor motion equation in (11) is 1, which achieves the reduction from | G | in (4) for multi-synchronous generators.
(2) Derivation of the aggregated model:
Suppose that thermal power stations comprise multiple synchronous generators with varying characteristics, all of which are involved in grid frequency regulation. The aggregated frequency response model for the FPP system is illustrated in Figure 3.
As illustrated in the dashed box of Figure 3, the transfer function corresponding to a single SG is capable of approximating the behavior of multiple SGs. Observing the dynamic characteristics (1c) of the generator, τ red is not obtained by a simple summation of the aggregated precursor group τ g . Ref. [28] proposes an efficient and accurate calculation method to integrate τ g of multiple SGs as follows:
For notational convenience, we define
P G m = [ P 1 m , , P | G | m ] , R G = [ R 1 , , R | G | ] , τ = [ τ 1 , , τ | G | ]
Now, we can list copies of (1c) g G as
d i a g ( τ ) P ˙ G m = P G m R G Δ ω
Combining (11) and (13) yields the state-space model:
x ˙ = A x + B u
where the state vector x | G | + 1 , the input vector u 1 and system matrices, A , B ( | G | + 1 ) × ( | G | + 1 ) are given by
x = Δ ω , P G m , u = P load A = D net J net 1 J net 1 1 G T d i a g ( τ ) 1 R G d i a g ( τ ) 1 B = J net 1 , 0 G
The original model described in (14) has an order of | G | + 1 . Next, to enable an analysis of the time-domain frequency trajectory, we need to aggregate the original governor model (13) to reduce its order from | G | to 1. Define the aggregated governor time coefficient as τ red , and introduce a reduced second-order representation to describe the system’s frequency dynamics:
x ˙ red = A red x red + B red u red
where the state vector x red 2 , the input vector u red , and system matrices, A red , B red 2 × 2 are given by
x red = Δ ω red , P red m ,   u red = P load A red = D net J net 1 J net 1 τ red 1 R red τ red 1 B red = J net 1 , 0 R red = g G R g
Since the time constants of the turbines differ from one another, a deviation arises between Δ ω red ( t ) and Δ ω ( t ) , and this error has an upper bound. To quantify the error generated in the simplification of the model dimensions, we define the matrix Γ as
Γ = d i a g { 1 , τ red 1 d i a g ( τ ) }
According to Equation (12), τ denotes the collection of time constants corresponding to all synchronous generators involved in the aggregated model, characterizing the differences in the dynamic response speeds of individual generators within the aggregation framework. Then, an auxiliary dynamic model can be constructed with the state vector x ¯ | G | + 1 and system matrix A ¯ , B ¯ ( | G | + 1 ) × ( | G | + 1 ) .
x ¯ ˙ = A ¯ x ¯ + B ¯ u
x ¯ = Δ ω ¯ , ( P ¯ G m ) T , u = P load A ¯ = Γ A = D net J eff 1 J aff 1 1 | G | T τ red 1 R G I | G | τ red 1 I | G | B ¯ = Γ B = J eff 1 ,   0 | G | T
Combining Equations (14) and (19) and considering the dynamics of Δ x ( t ) = x ¯ ( t ) x ( t ) , the following can be deduced:
Δ x ˙ = x ¯ ˙ x ˙ = Γ A x ¯ A x + Γ B u B u = Γ A x ¯ A x + ( Γ I | G | + 1 ) B u = Γ A x ¯ A x + ( Γ I | G | + 1 ) ( x ˙ A x ) = Γ A ( x ¯ x ) + ( Γ I | G | + 1 ) x ˙ = Γ A Δ x + ( Γ I | G | + 1 ) x ˙
By considering x ˙ as an external input to the system defined in (21), its solution can be expressed as follows:
Δ x ( t ) = s = 0 t e Γ A ( t s ) ( Γ I | G | + 1 ) x ˙ ( s ) d s
There exist k , λ > 0 such that we can bound | | e Γ A ( t t ¯ ) | | 2 k e λ ( t t ¯ ) , 0 t ¯ t . Based on this relationship, Equation (22) yields
| | Δ x ( t ) | | 2 s = 0 t k e λ ( t s ) | | ( Γ I | G | + 1 ) ( A x ( s ) + B u ( s ) | | 2 d s k λ | | ( Γ I | G | + 1 ) A | | 2 sup 0 s t ( | | x ( s ) | | 2 + | | A 1 B u ( s ) | | 2
We require that the dynamic characteristics of the system before and after aggregation are as consistent as possible, i.e., we require that Δ ω ( t ) and Δ ω ¯ ( t ) are as equal as possible at any time t. For this purpose, the error function is established as follows:
f Δ ( t ) = | Δ ω ¯ ( t ) Δ ω ( t ) |
Recognizing that
Δ ω ¯ ( t ) Δ ω ( t ) = Δ ω red ( t ) Δ ω ( t ) Δ x ( t ) 2
Combining Equations (23) and (25), in order to keep the error before and after aggregation as small as possible, τ red should be chosen so that ( Γ I | G | + 1 ) A 2 is as small as possible, which can be obtained as
τ red = arg min τ ¯ 0 ( Γ ( τ ¯ ) I G + 1 ) A 2
where Γ ( τ ¯ ) = X d i a g { X 1 , d i a g ( τ ) } , X = τ ¯ 1 . This is because the first row of the matrix ( Γ ( τ ¯ ) I G + 1 ) A has all zero entries. Therefore, it follows from (26) that
τ red = arg min X 0 ( X d i a g ( τ ) I G ) A ˜ 2
where A ˜ = d i a g ( τ ) 1 R red d i a g ( τ ) 1 . For any matrix A , A 2 A F [29]. We solve
τ red = arg min X 0 ( X d i a g ( τ ) I G ) A ˜ F
Next, using
min X 0 ( X d i a g ( τ ) I G ) A ˜ F 2 = min X 0 T r ( ( X d i a g ( τ ) A ˜ A ˜ ) ( X d i a g ( τ ) A ˜ A ˜ ) T ) = min X 0 T r ( X 2 d i a g ( τ ) A ˜ A ˜ T d i a g ( τ ) 2 X d i a g ( τ ) A ˜ A ˜ T + A ˜ A ˜ T ) = min X 0 X 2 T r ( d i a g ( τ ) A ˜ A ˜ T d i a g ( τ ) ) 2 X T r ( d i a g ( τ ) A ˜ A ˜ T ) + T r ( A ˜ A ˜ T )
By invoking the first-order optimality criterion, the optimal X can be determined, and, consequently, the solution minimizing Equation (26) is given by
τ red = T r ( d i a g ( τ ) A ˜ A ˜ T d i a g ( τ ) ) T r ( d i a g ( τ ) A ˜ A ˜ T )
In this chapter, the dynamic models of a single conventional generating unit and a single Distributed Energy Resource (DER) are first developed. Based on these models, the corresponding state-space equations are formulated. A comprehensive derivation of the aggregation process is then conducted for key parameters that influence the system’s dynamic behavior, including inertia coefficients, damping coefficients and unit time constants. The final result is the dynamic model of the system after aggregation. Through careful aggregation of key parameters, the complexity of the original detailed power system model is significantly reduced. Consequently, this aggregation strategy preserves key dynamic characteristics, ensuring clarity and computational efficiency in subsequent time-domain analyses.

3. Designing Inertia and Damping Coefficients

In this section, we first outline the development of a transfer function that maps net load disturbances to frequency deviations. Then, we introduce the configuration of damping parameters and inertia constants to achieve specified steady-state frequency performance and limit peak overshoot.

3.1. Transfer Function from Load Disturbance to Frequency Response

By applying the reduced second-order Model (17), one can derive the Laplace-domain transfer function that characterizes the system’s response from load fluctuations to frequency variation.
Δ ω ( s ) P load ( s ) = k ( s + ζ ) s 2 + 2 ξ ω n s + ω n 2
and the expressions for the parameters k , ζ , ω n and ξ are specified as follows
k = 1 J net , ζ = 1 τ net ω n = D eff τ net J net , ξ = 1 2 J net + τ net D net J net τ net D eff
where for notational compactness, we introduce the following definitions:
D eff = D net + R net ,   R net = g G R g
Under the assumption of an underdamped system, the inverse Laplace transform yields the following result:
Δ ω ( t ) = Δ ω ss 1 e ξ ω n t 1 ξ 2 sin ( ω d t + φ ) ω n ζ sin ( ω d t )
where Δ ω ss denotes the steady-state frequency deviation after equilibrium under step perturbation, and we have
Δ ω ss = Δ P load D eff
ω d = ω n 1 ζ 2
φ = tan 1 ζ 1 1 ζ 2

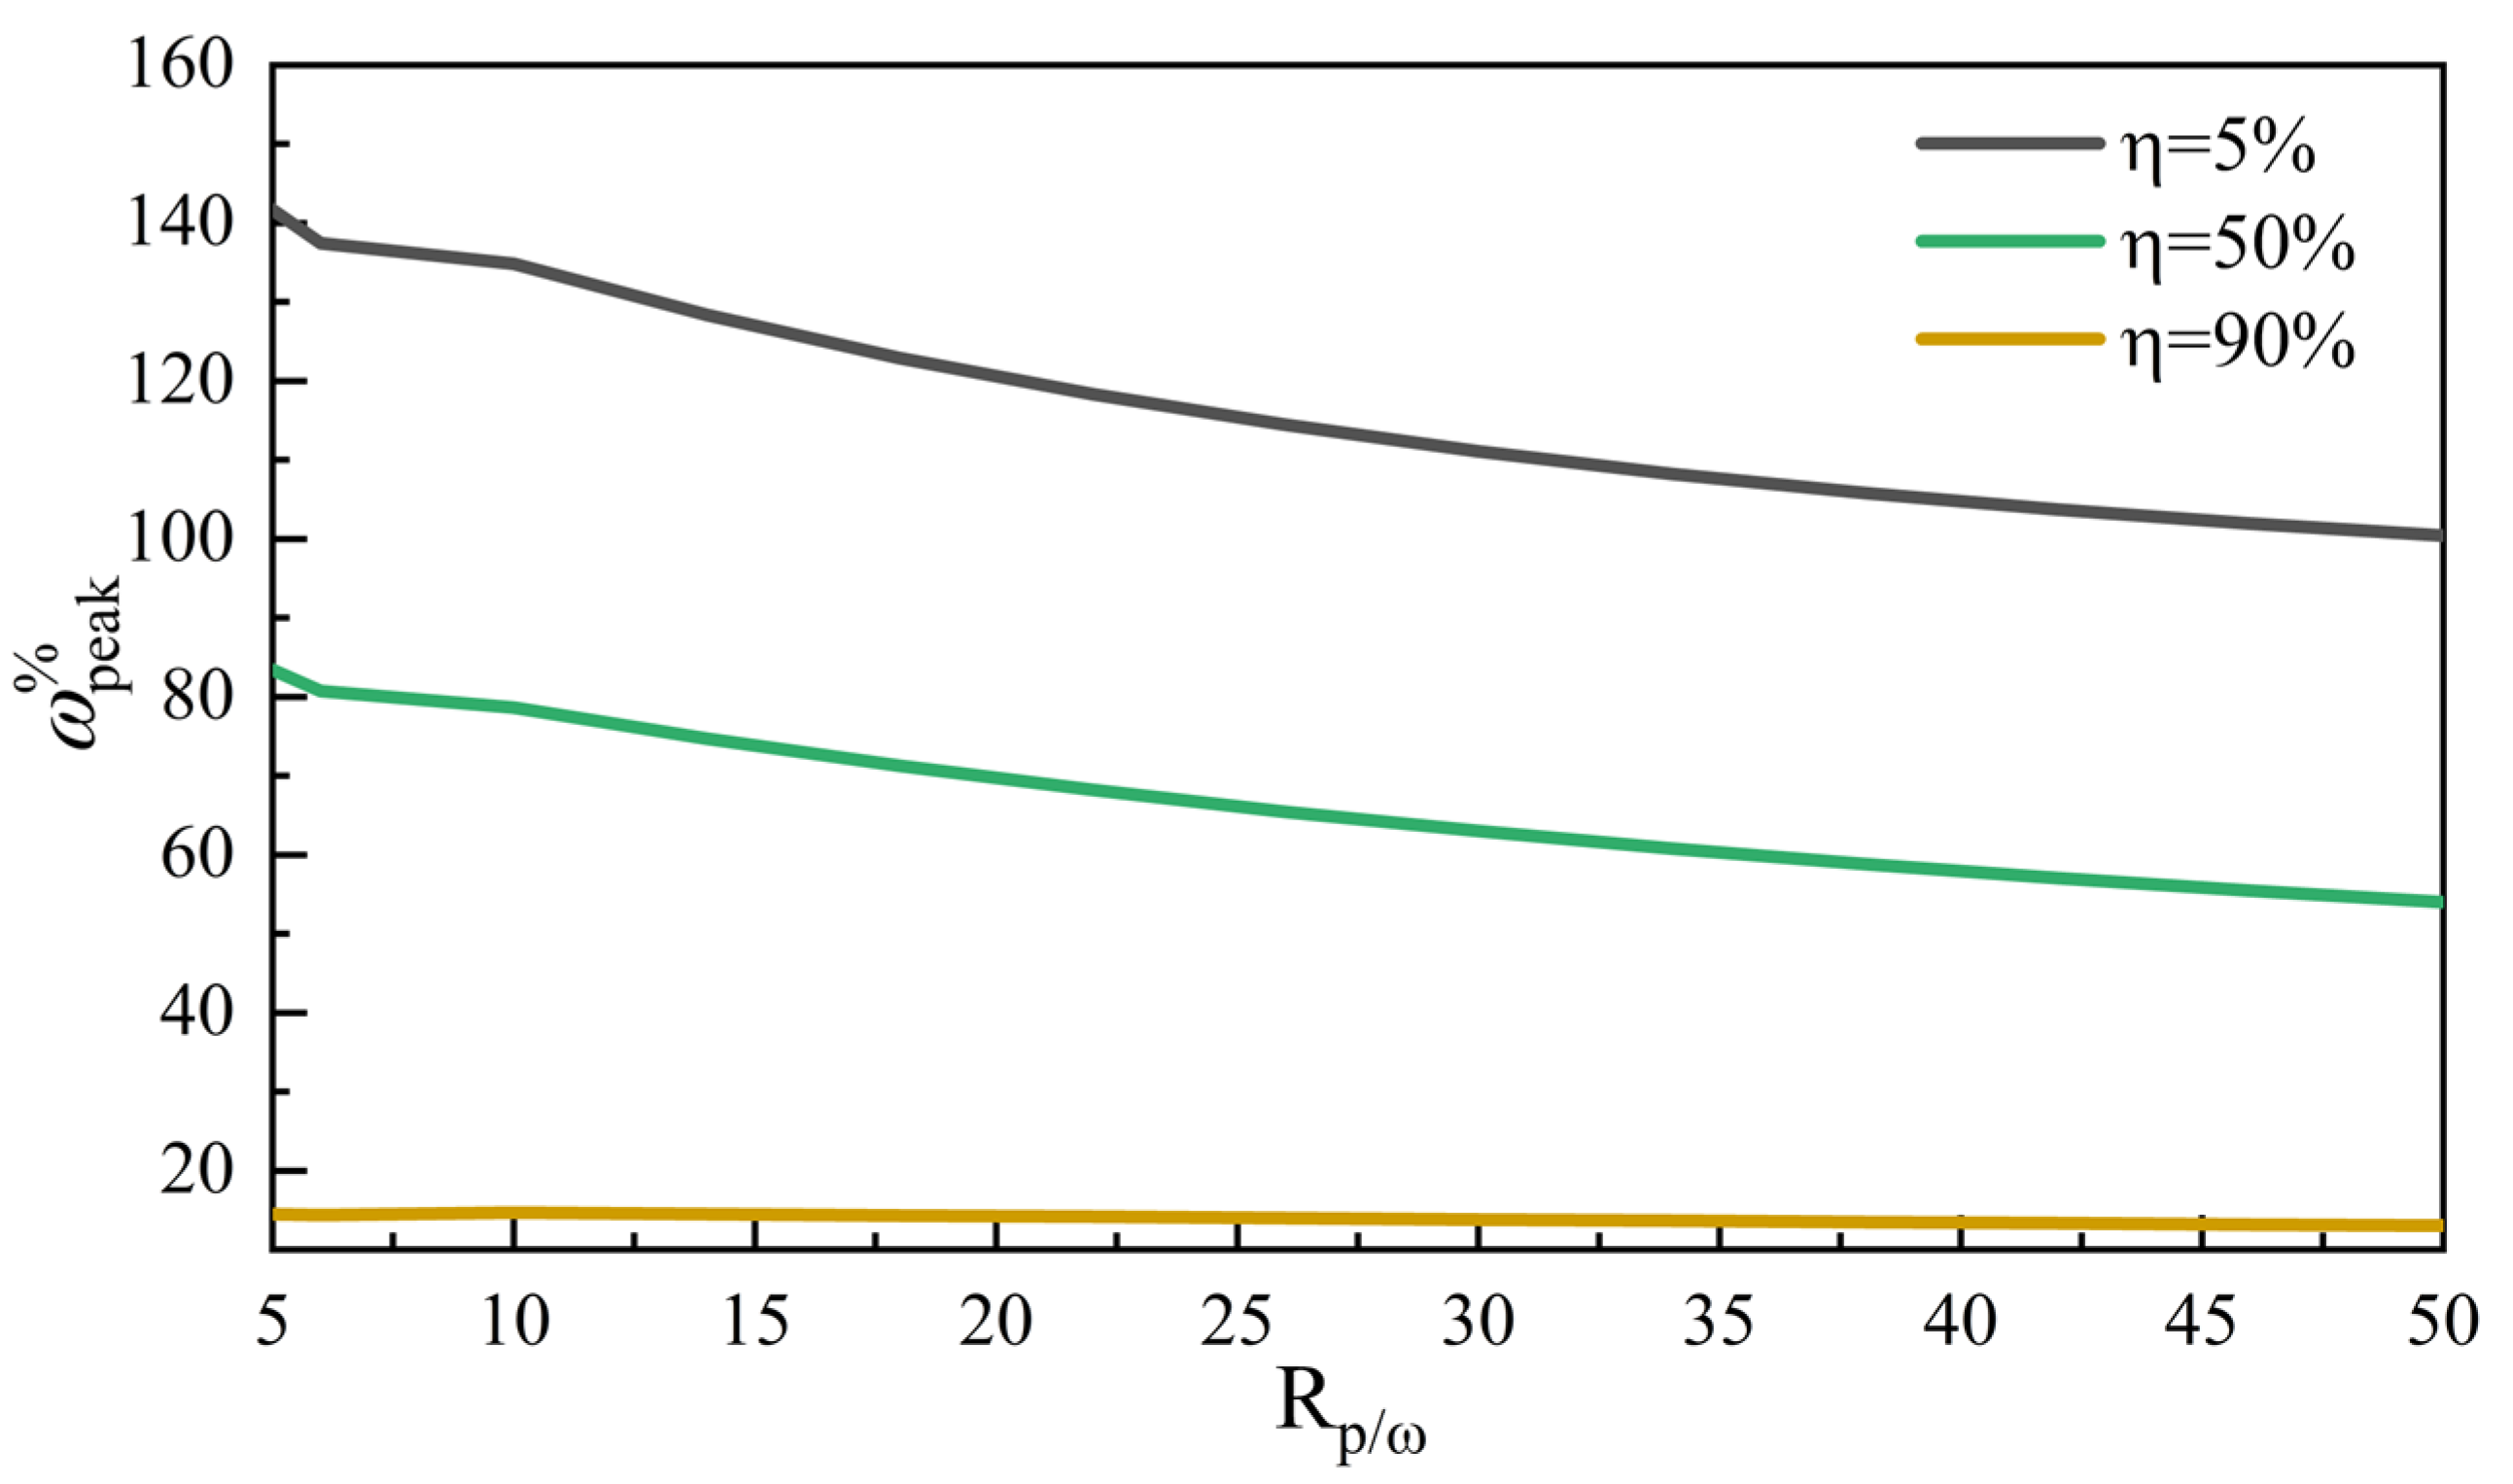
3.2. Determine Damping and Inertia Coefficients

The above-formed inverse Laplace transform derived in (33) describes the time-domain evolution of frequency as determined by the system’s damping and inertia parameters. As shown in Figure 4, the time-domain evolution exhibits two feature points: frequency nadir Δ ω nadir at the first time t nadir , and equilibrium Δ ω ss .
The steady-state frequency response is defined as the proportion between the net active load variation and the steady-state frequency change, which is used to express the specified value of the frequency regulation, and the unit is usually MW/0.1 Hz, as listed in (35).
R P / ω = Δ P load Δ ω ss [ MW / 0 . 1 Hz ]
Observe from (34a) and (35) that we can determine D eff to ensure this frequency regulation specification is met. Given a specified D eff , we can calculate the net damping coefficient D net according to (32), and the damping coefficients of individual DERs should subsequently be modified to comply with Equation (8).
The peak overshoot criterion is defined as follows:
ω peak % = Δ ω nadir Δ ω ss × 100
Typically, it is difficult to correlate the rotational inertia and damping parameters with the peak overshoot due to the complexity and variety of the dynamic models of the generator and DER, whereas it can be solved through the time-domain relation (33), which is transformed from the second-order simplified model provided in this paper.
e ξ ω n t nadir ( ω n ξ sin ( ω d t nadir + φ ) ω d cos ( ω d t nadir + φ ) ζ 1 ω n 2 ξ sin ( ω d t nadir ) + ζ 1 ω n ω d cos ( ω d t nadir ) = 0
The preceding expression can be reduced through trigonometric transformation to
tan ( ω d t nadir ) = ω d ξ ω n ζ
from this, we obtain t n a d i r by substituting ω d , ω n , ζ , ξ from (31) and (34b) as
t nadir = ω d 1 tan 1 ω d ξ ω n ζ = 2 ρ 1 τ net 1 J net tan 1 ρ J net + τ net 1 D net 2 J net τ net 2
where ρ = 4 τ net 1 J net D eff ( J net + τ net 1 D net ) 2 .
Then, we can obtain Δ ω ( t nadir ) by substituting t nadir from (39) in (33) as
Δ ω nadir = Δ ω ( t nadir ) = Δ ω s s e ξ ω n t nadir ω n 2 + ζ 2 2 ζ ξ ω n
ω peak % = Δ ω nadir Δ ω ss × 100 = e 2 J net τ net 2 J net τ net 1 D net 2 J net τ net 1 t nadir R net τ net J net × 100
Substituting t nadir from (39) in (41), the peak overshoot can expressed as a function of the two aggregated parameters J net and D net .
When given D eff to satisfy specification (32) and given specification ω peak % , (41) will be a nonlinear expression involving J net . Determining J net from this equation, individual DER inertia coefficients are subsequently modified to meet (7).
The above design strategy was made for DER total damping d D D d and inertia coefficient d D J d . In fact, this sum can be decomposed into individual values D d , J d according to the actual requirements of the grid. In this paper, we adopt the optimization-based perspective provided by Ref. [30], i.e., decompose the DER total effective inertia and damping in proportion to their power ratings:
J d = J net g G J g d D P ¯ d P ¯ d
D d = D net g G D g d D P ¯ d P ¯ d
where P ¯ d is the base rating of the DER located at buses d .

4. SOC-Based Adaptive Optimization

In this section, we propose an adaptive optimization framework considering the energy storage SOC to dynamically optimize the synthetic inertia and droop control parameters of the storage device. This approach leverages the real-time SOC to enable the energy storage device to provide stable and sustained auxiliary support for grid frequency modulation over extended periods.

4.1. Response Mode Incorporating SOC

Energy storage devices are capable of significantly improving the system’s equivalent inertia and damping via virtual inertia and droop control, thereby improving grid frequency response performance. However, in real-world scenarios, the capacity of energy storage systems is subject to inherent limitations. Using the maximum droop coefficient in both charge and discharge modes during the initial frequency control phase can easily cause the SOC of the energy storage device to exceed its operational limits.
This study introduces a strategy for dynamically adjusting virtual inertia and droop parameters based on SOC levels. When the SOC becomes excessively high (during charging) or drops too low (during discharging), the virtual parameters are accordingly tuned to limit the output power of the energy storage unit, thereby alleviating negative impacts on grid frequency resulting from SOC limit violations. In addition, the proposed method dynamically regulates the proportion of virtual inertia and droop control synergistically. During the inertia response phase, virtual inertia serves as the primary control mechanism, with droop control playing a supplementary role. Conversely, in the primary frequency modulation phase, droop control becomes the dominant mechanism, while virtual inertia provides secondary support. This adaptive control strategy ensures the efficient management of energy storage output, minimizing stress on the storage device and maintaining system stability.
Δ P E = c 1 J net d Δ ω d t + c 2 D net Δ ω
where c 1 and c 2 are the scaling factors of virtual inertia mode and virtual droop mode, and J net , D net are the virtual inertia parameter and droop parameter of the energy storage device calculated based on the aggregation principle described in Section 3.2.

4.2. Design of Scaling Factors

(1). The inertial response stage: By taking into account both the frequency deviation and its rate of change, the proportional scaling factor for this stage can be formulated as follows:
c 1 = e n Δ f c 2 = 1 e n Δ f 0 Δ f ln ( 1 2 ) / n Δ f = Δ ω / 2 π
where n represents the scaling factor. It is used to adjust the alignment between the asymptotic curves of the scaling factors c 1 , c 2 and the frequency change characteristics during the inertia response stage. If n is too small, the changes in c 1 and c 2 remain minimal, even when the rate of frequency change increases significantly, or the frequency deviation decreases considerably. In such cases, the benefits of inertial response and damping response cannot be fully leveraged, leading to an excessively large maximum frequency deviation Δ f max . Conversely, if n is too large, c 1 and c 2 may fluctuate drastically in response to frequency variations, making it difficult to effectively suppress the rate of change of frequency deviation. Based on the above analysis, we selected n = 100 as a compromise for the optimal performance of frequency dynamic response.
(2). The primary frequency regulation stage: When d Δ f d t = 0 , control switches to virtual droop as the dominant mechanism, with virtual inertia providing supplementary control. The scaling factor equation for this phase is given as follows:
c 1 = 1 2 Δ f Δ f max n c 2 = 1 Δ f Δ f max n
where Δ f max is the maximum frequency deviation value in one frequency modulation.

4.3. Parameter Optimization Involving SOC

While the previous section addressed the dynamic adjustment of the scaling factors c 1 and c 2 , this section focuses on dynamically adjusting the virtual inertia and droop parameters based on the SOC to effectively regulate the energy storage device’s output.
The state of charge (SOC) of the battery represents the ratio of the remaining energy to the rated energy capacity, indicating the battery’s ability to continue operating. In this study, the SOC is computed by integrating the output power of the energy storage system over time and subtracting the accumulated energy from the initial SOC value. This approach allows real-time tracking of the energy state and reflects the dynamic charging and discharging behavior of the system. All SOC values are expressed in per-unit (p.u.) relative to the rated capacity, and system-specific SOC bounds (e.g., 0.2–0.6) are defined according to the operational characteristics of the energy storage device.
As shown in Figure 5, D net represents the maximum adjustable virtual droop coefficient of the energy storage system, which corresponds to the total virtual droop of the DER, calculated based on the method described in the previous section. Q SOC denotes the state of charge (SOC) of the energy storage system, expressed as a per-unit (p.u.) value, defined as the ratio of current energy content to its rated capacity. Specifically, Q SOC _ min and Q SOC _ max represent the lower and upper SOC thresholds for adaptive control activation, which are adjustable according to device specifications. For illustration purposes, the minimum and maximum SOC values are set to 0.2 and 0.6, respectively, but these can be tuned based on operational constraints.
The virtual inertia parameters and virtual droop parameter for energy storage, considering SOC, are defined as follows:
J net ( Q SOC ) = α K c d Δ f / d t > 0 α K d d Δ f / d t < 0
D net ( Q SOC ) = K c Δ f 0.03 Hz K d Δ f < 0.03 Hz
α = J net / D net
where α represents the scaling factor that defines the linkage between the synthetic inertia parameter and the corresponding droop setting. K c and K d are the charging and discharging coefficients in the droop regulation process of the energy storage system, respectively. To prevent issues arising from SOC limits, as shown in Figure 5, a piecewise linear function is employed to define the charging and discharging curves. This approach not only ensures smooth output but also avoids the control difficulties associated with more complex functions, making it more suitable for practical engineering applications [31]. The values of K c and K d are as follows:
K c = D net Q SOC [ 0 , 0.45 ]   0.6 Q SOC 0.15 D net Q SOC [ 0.45 , 0.6 ] 0 Q SOC [ 0.6 , 1.0 ]
K d = 0 Q SOC [ 0 , 0.2 ]   Q SOC 0.2 0.15 D net Q SOC [ 0.2 , 0.35 ]   D net Q SOC [ 0.35 , 1.0 ]  
The energy storage-assisted frequency modulation output under adaptive control, which accounts for SOC, is expressed as follows:
Δ P E ( Q SOC ) = c 1 J net ( Q SOC ) d Δ f d t + c 2 D net ( Q SOC ) Δ f

5. Simulation Results and Analysis

In this section, the effectiveness of the proposed aggregation model is evaluated by comparison with the original multi-machine configuration. Then, the influence of DER units’ inertia and damping characteristics on the system’s primary frequency regulation is investigated. Lastly, a model of the integrated energy system incorporating wind and storage is constructed to examine how distributed energy sources contribute to primary frequency control.

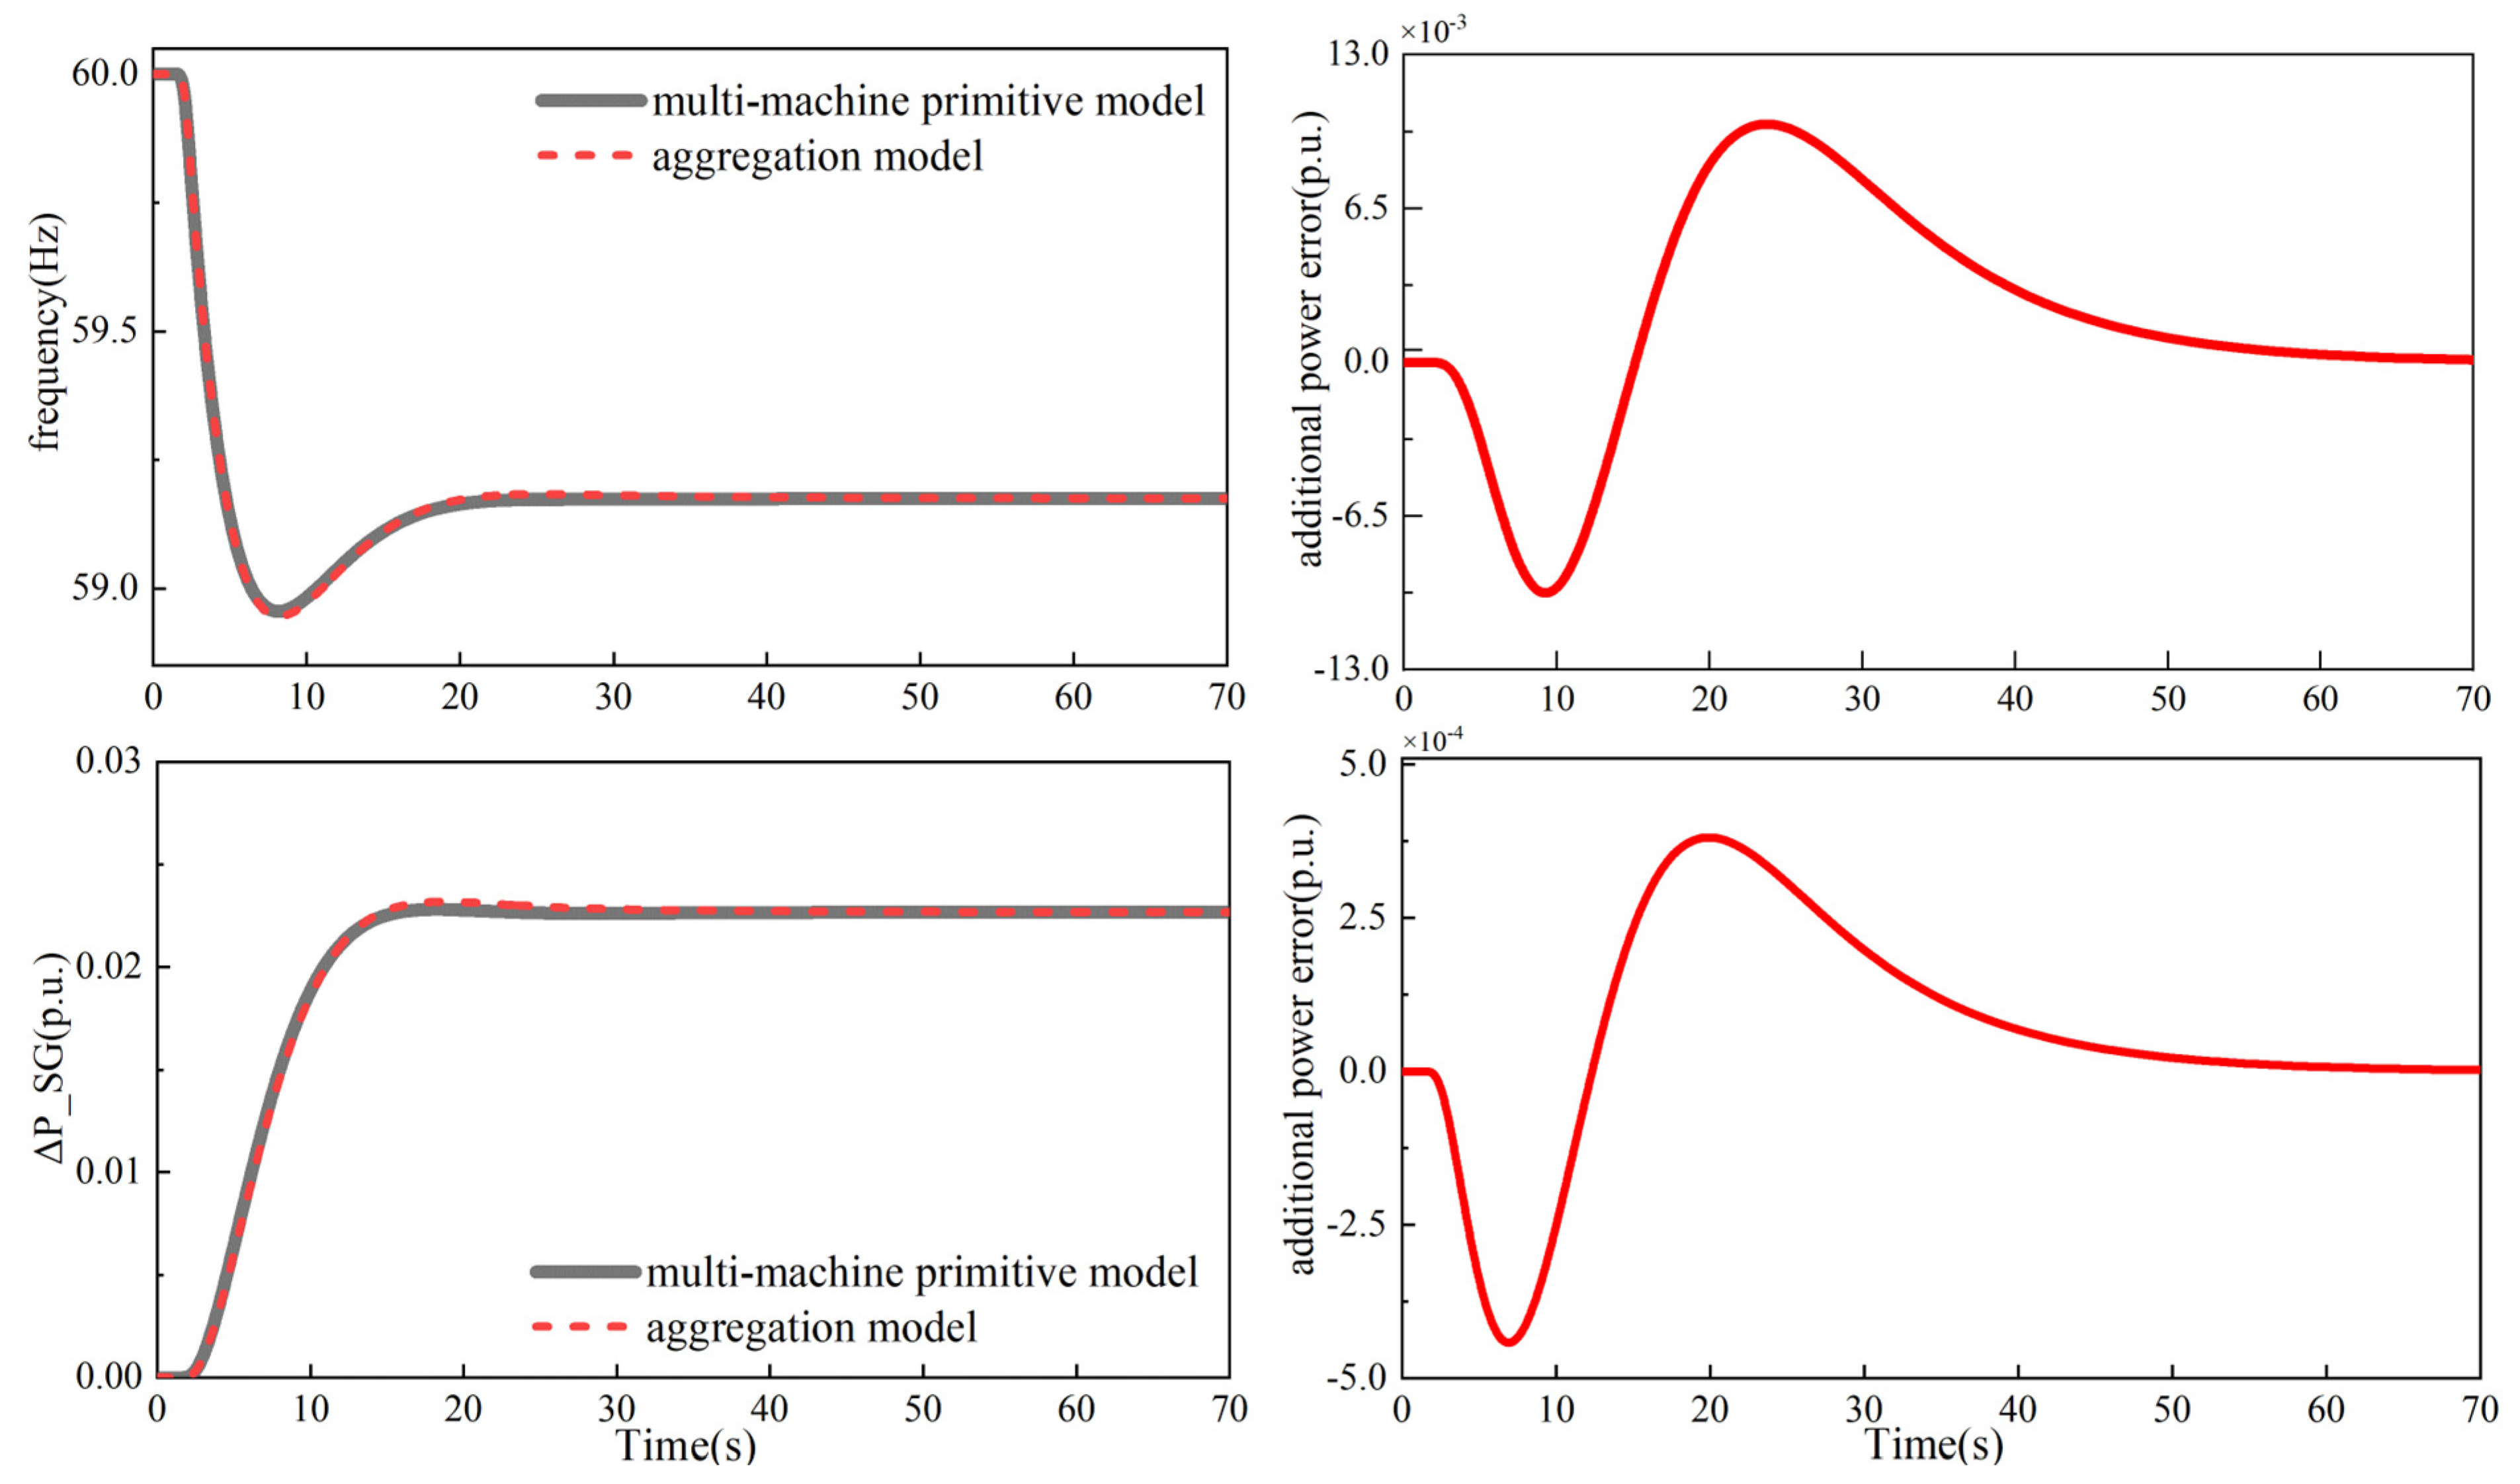
5.1. Aggregation Model Validation

We conduct simulations on the 10-unit, 39-bus New England test system, where generators are located on buses G = { 1 , 2 , , 10 } [32], as shown in Figure 6. The example is implemented in the MATLAB/SIMULINK environment and is run on a computer equipped with an Intel Core i5-8300H CPU and 16 GB of RAM. The total simulation time spans 70 s. A step change in load is introduced at 2 s. The synchronous generator (SG) parameters are provided in Table 1. The dynamic characteristics of the single synchronous generator set in this system are modeled in Section 2. We selected the synchronous generator model parameters for a set of cases exhibiting the largest deviations within the normal stability range to validate the accuracy of the aggregation model.
According to Equations (7), (8) and (27), we calculate the equivalent parameters of the aggregation model { τ net , R net , J net , D net } = { 5.8683 ,   1.6492 ,   1.2624 ,   0.3976 } . Next, we build simulation models both before and after aggregation in Simulink, using the same load fluctuation. Figure 7 presents a comparison between the frequency and output power responses, along with the corresponding response errors, considering both the introduced aggregation framework and the conventional multi-machine model. The frequency and power response trajectories of the aggregation model are very close to those of the multi-machine primitive model, with the maximum deviations observed in frequency and power outputs remaining under 0.01. These results imply that the aggregation model can effectively substitute the multi-machine primitive model with high accuracy.

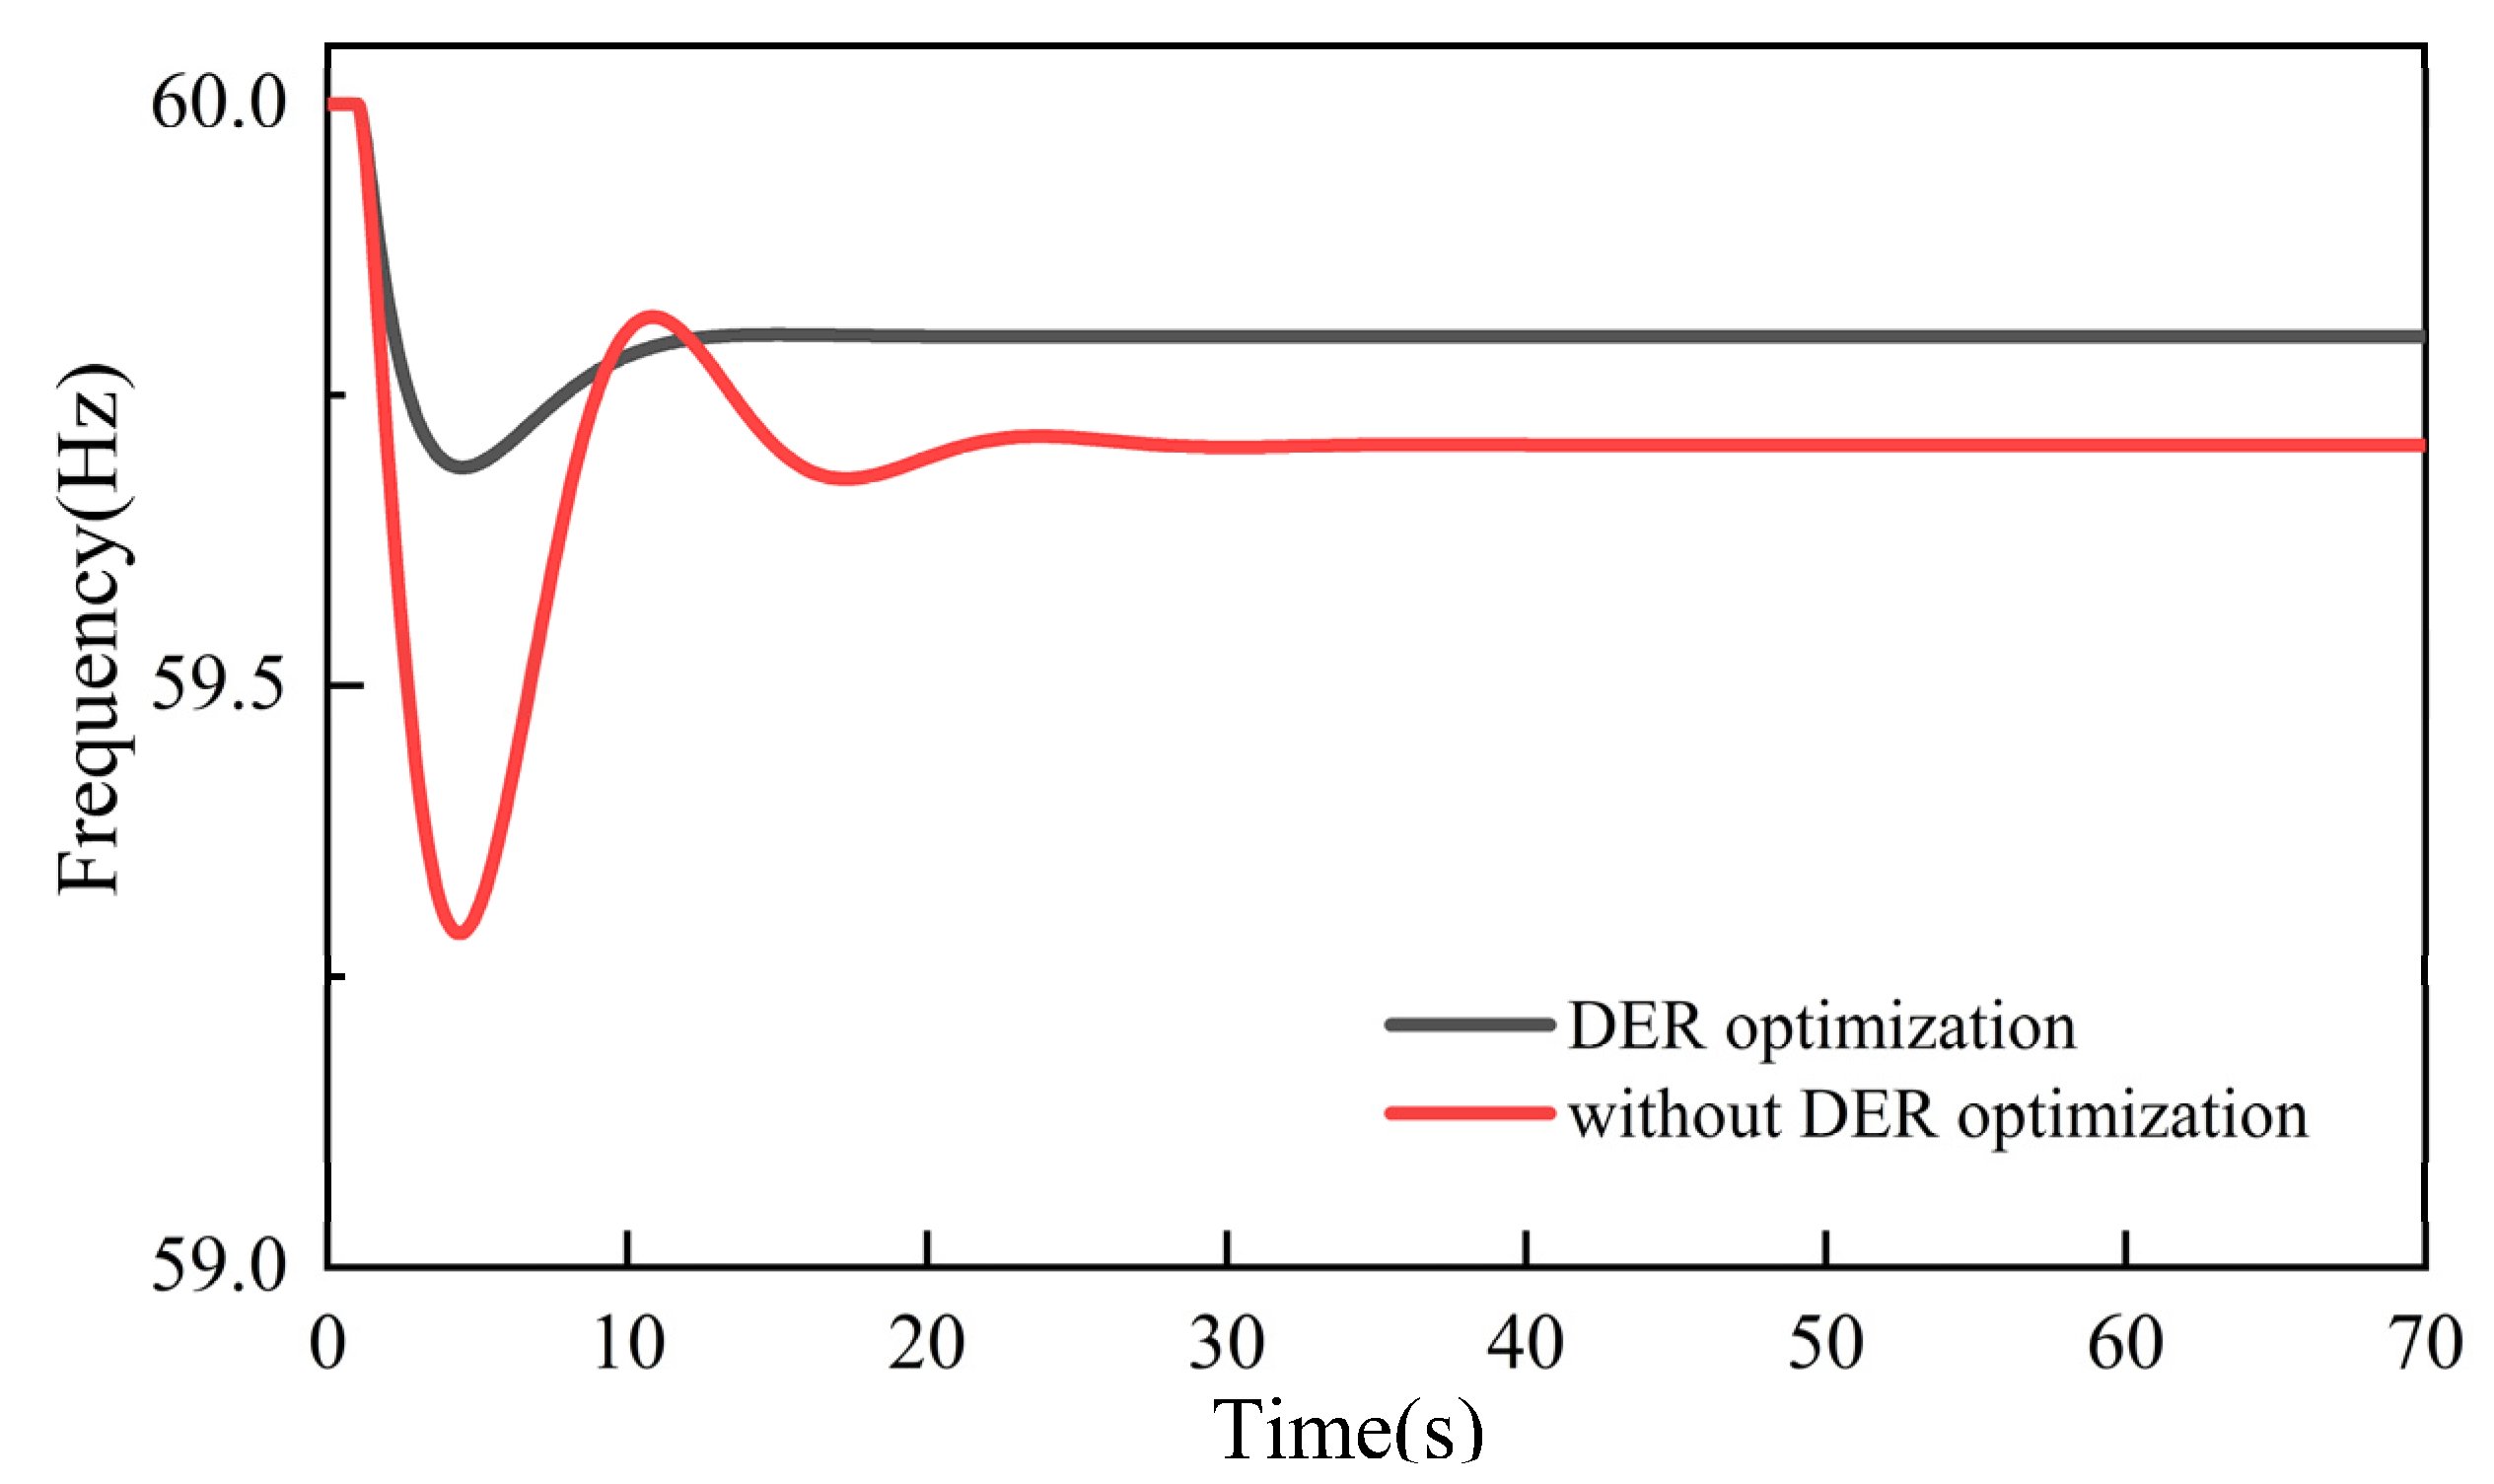
5.2. Impact of DER in Inertial and Primary Frequency Response

We add five frequency response DERs to the IEEE 39-bus system on the buses D = 13 , 17 , 19 , 20 , 22 , to evaluate the effectiveness of DERs involved in inertial and primary frequency regulation. The test platform is PSAT [33]. A load step perturbation of Δ P l o a d = 0.01 is set at time t = 0 at bus 17. The test results are illustrated in Figure 8. The red curves represent the scenario where the DERs do not participate in inertial and primary frequency regulation. In comparison, we employed an analytical approach to calculate the DERs’ inertial and dynamic coefficients outlined in Section 3 ( d D D d = 64.7 and d D J d = 59.38 ) and depict the trajectories of the frequency response in black line. It can be found that the frequency response with DER support shows a reduced frequency nadir and decreased steady-state frequency deviation, which verifies the effectiveness and practicality of the DERs in inertial and primary frequency regulation.
In order to analyze the effect of the DER participation level (measured by the proportion of total system inertia attributed to DERs) on the system’s frequency behavior, three cases with the permeability η = { 5 , 50 , 90 } are simulated. As shown in Figure 9, increasing the permeability level can significantly suppress frequency overshoot and enhance system stability; however, when DER permeability arrives high, e.g., 90%, increasing the damping cannot further reduce the amount of frequency response overshoot.

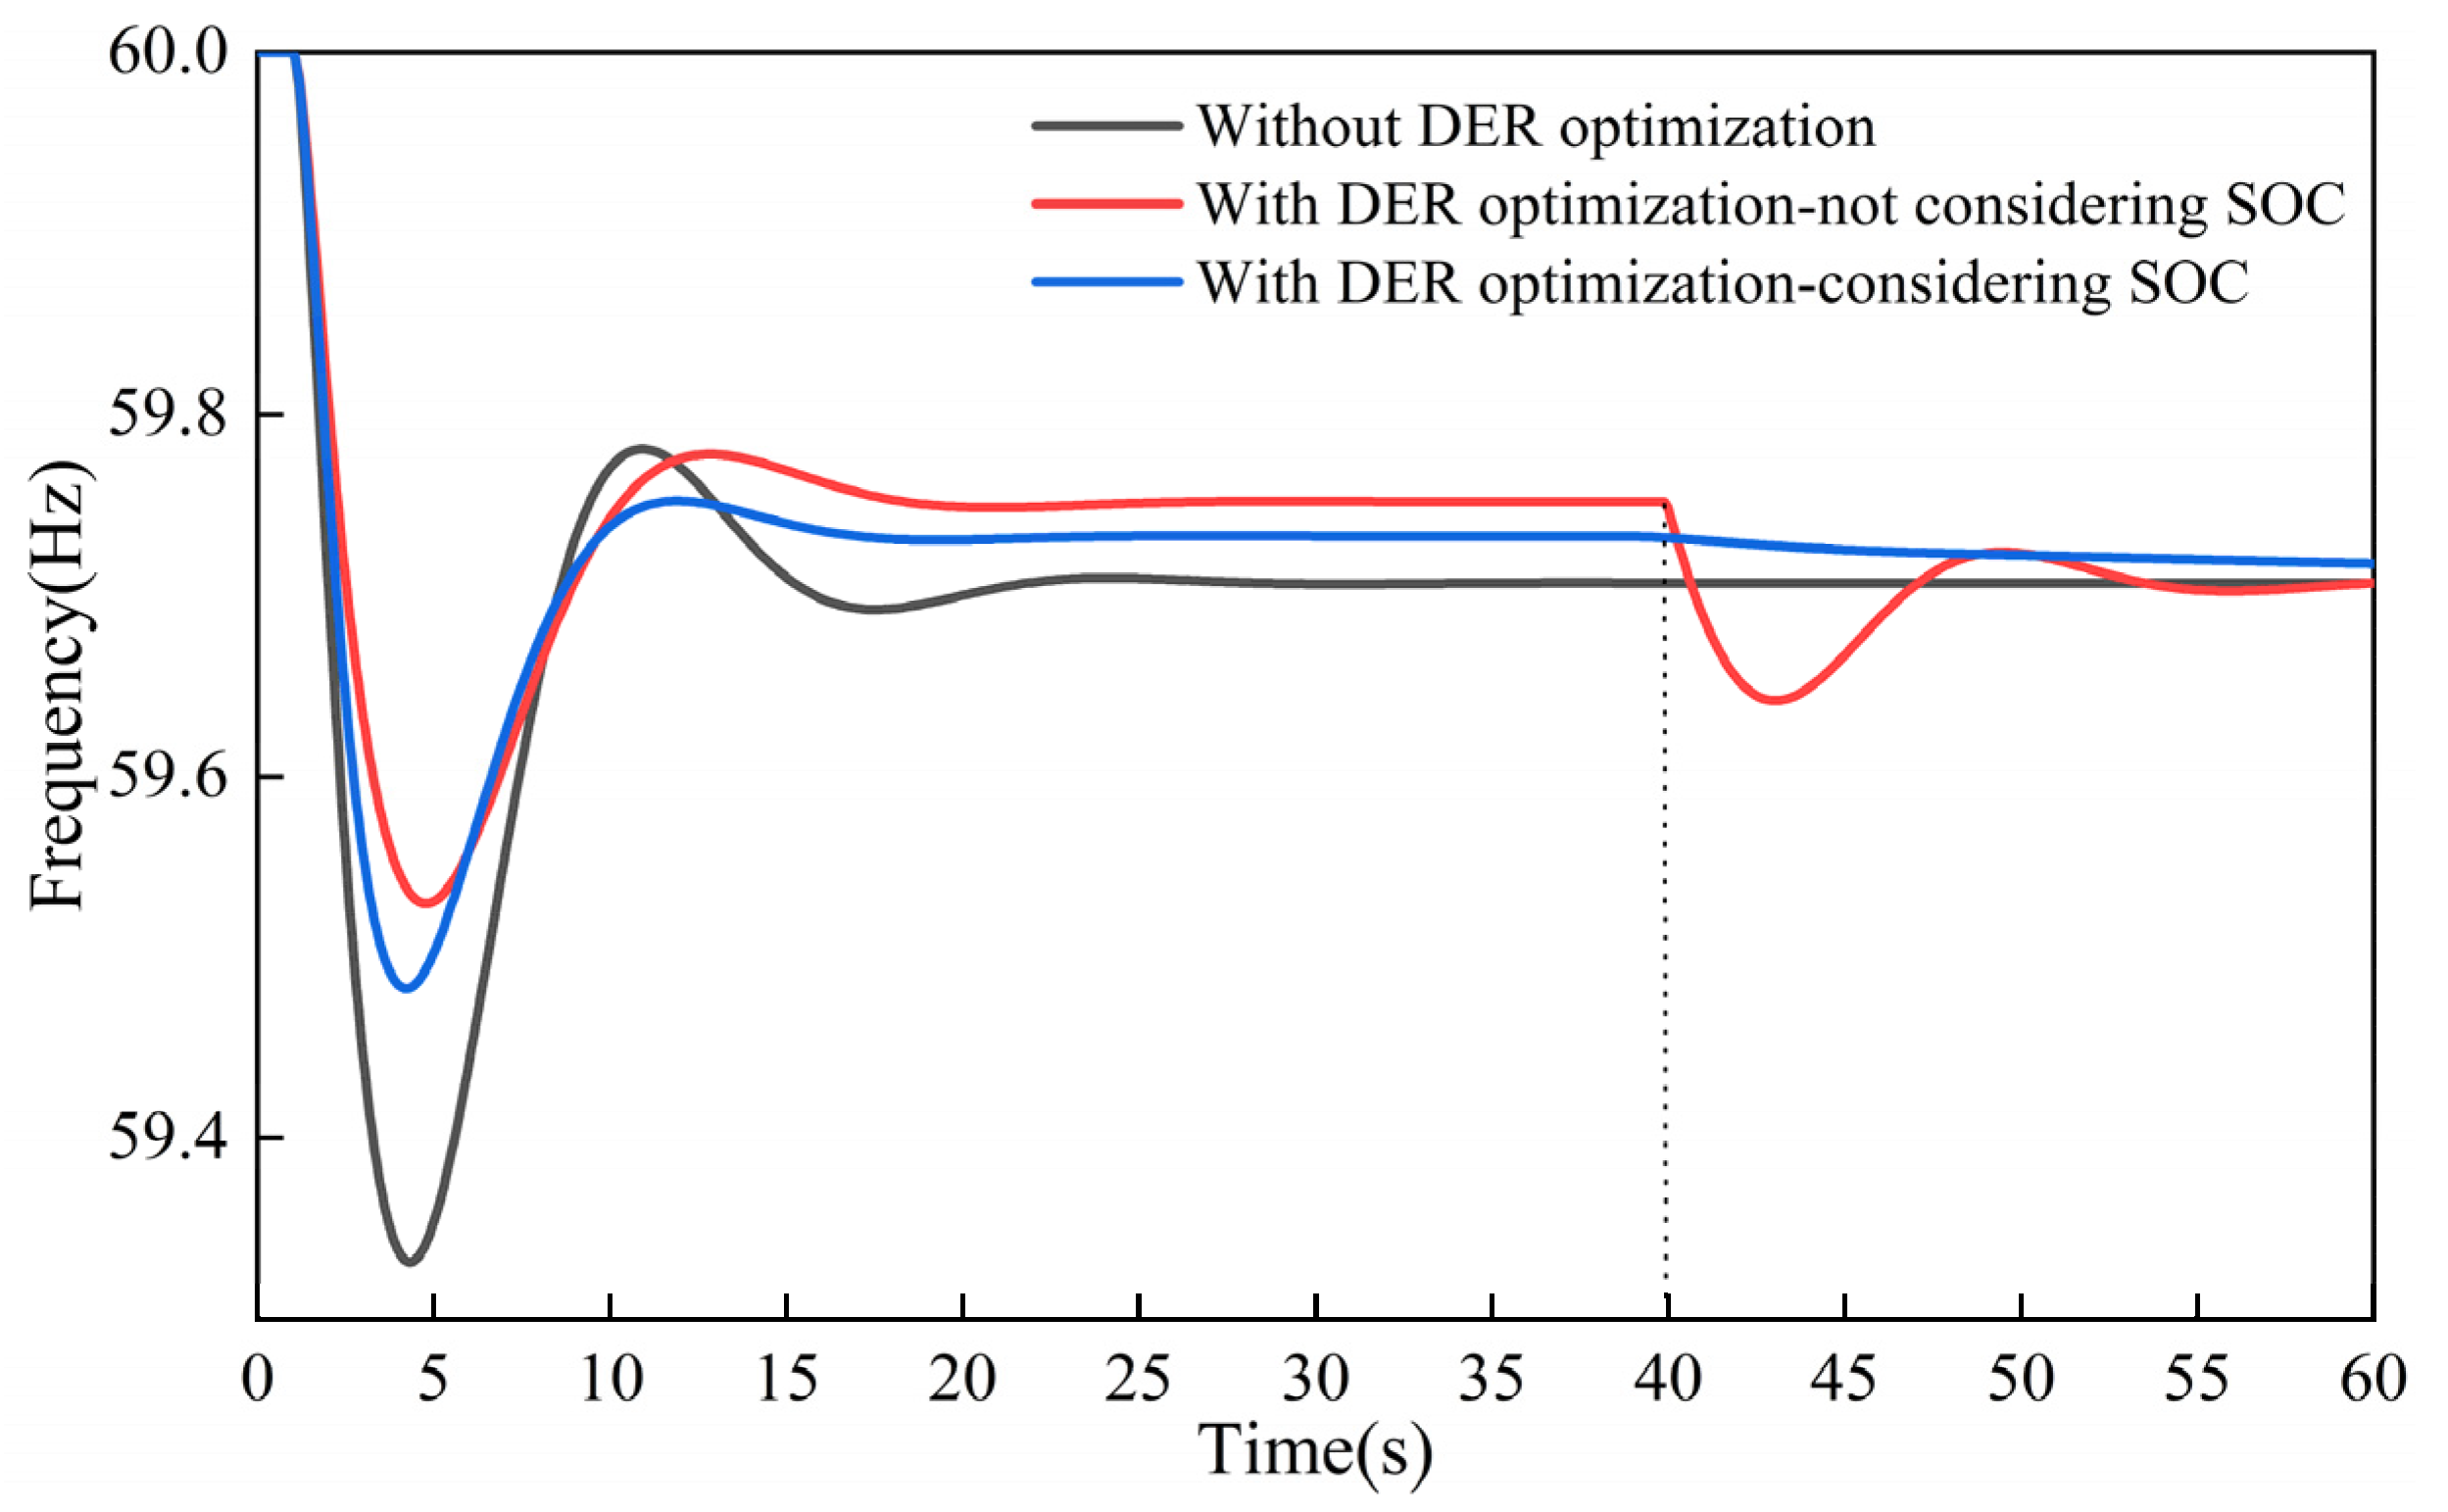
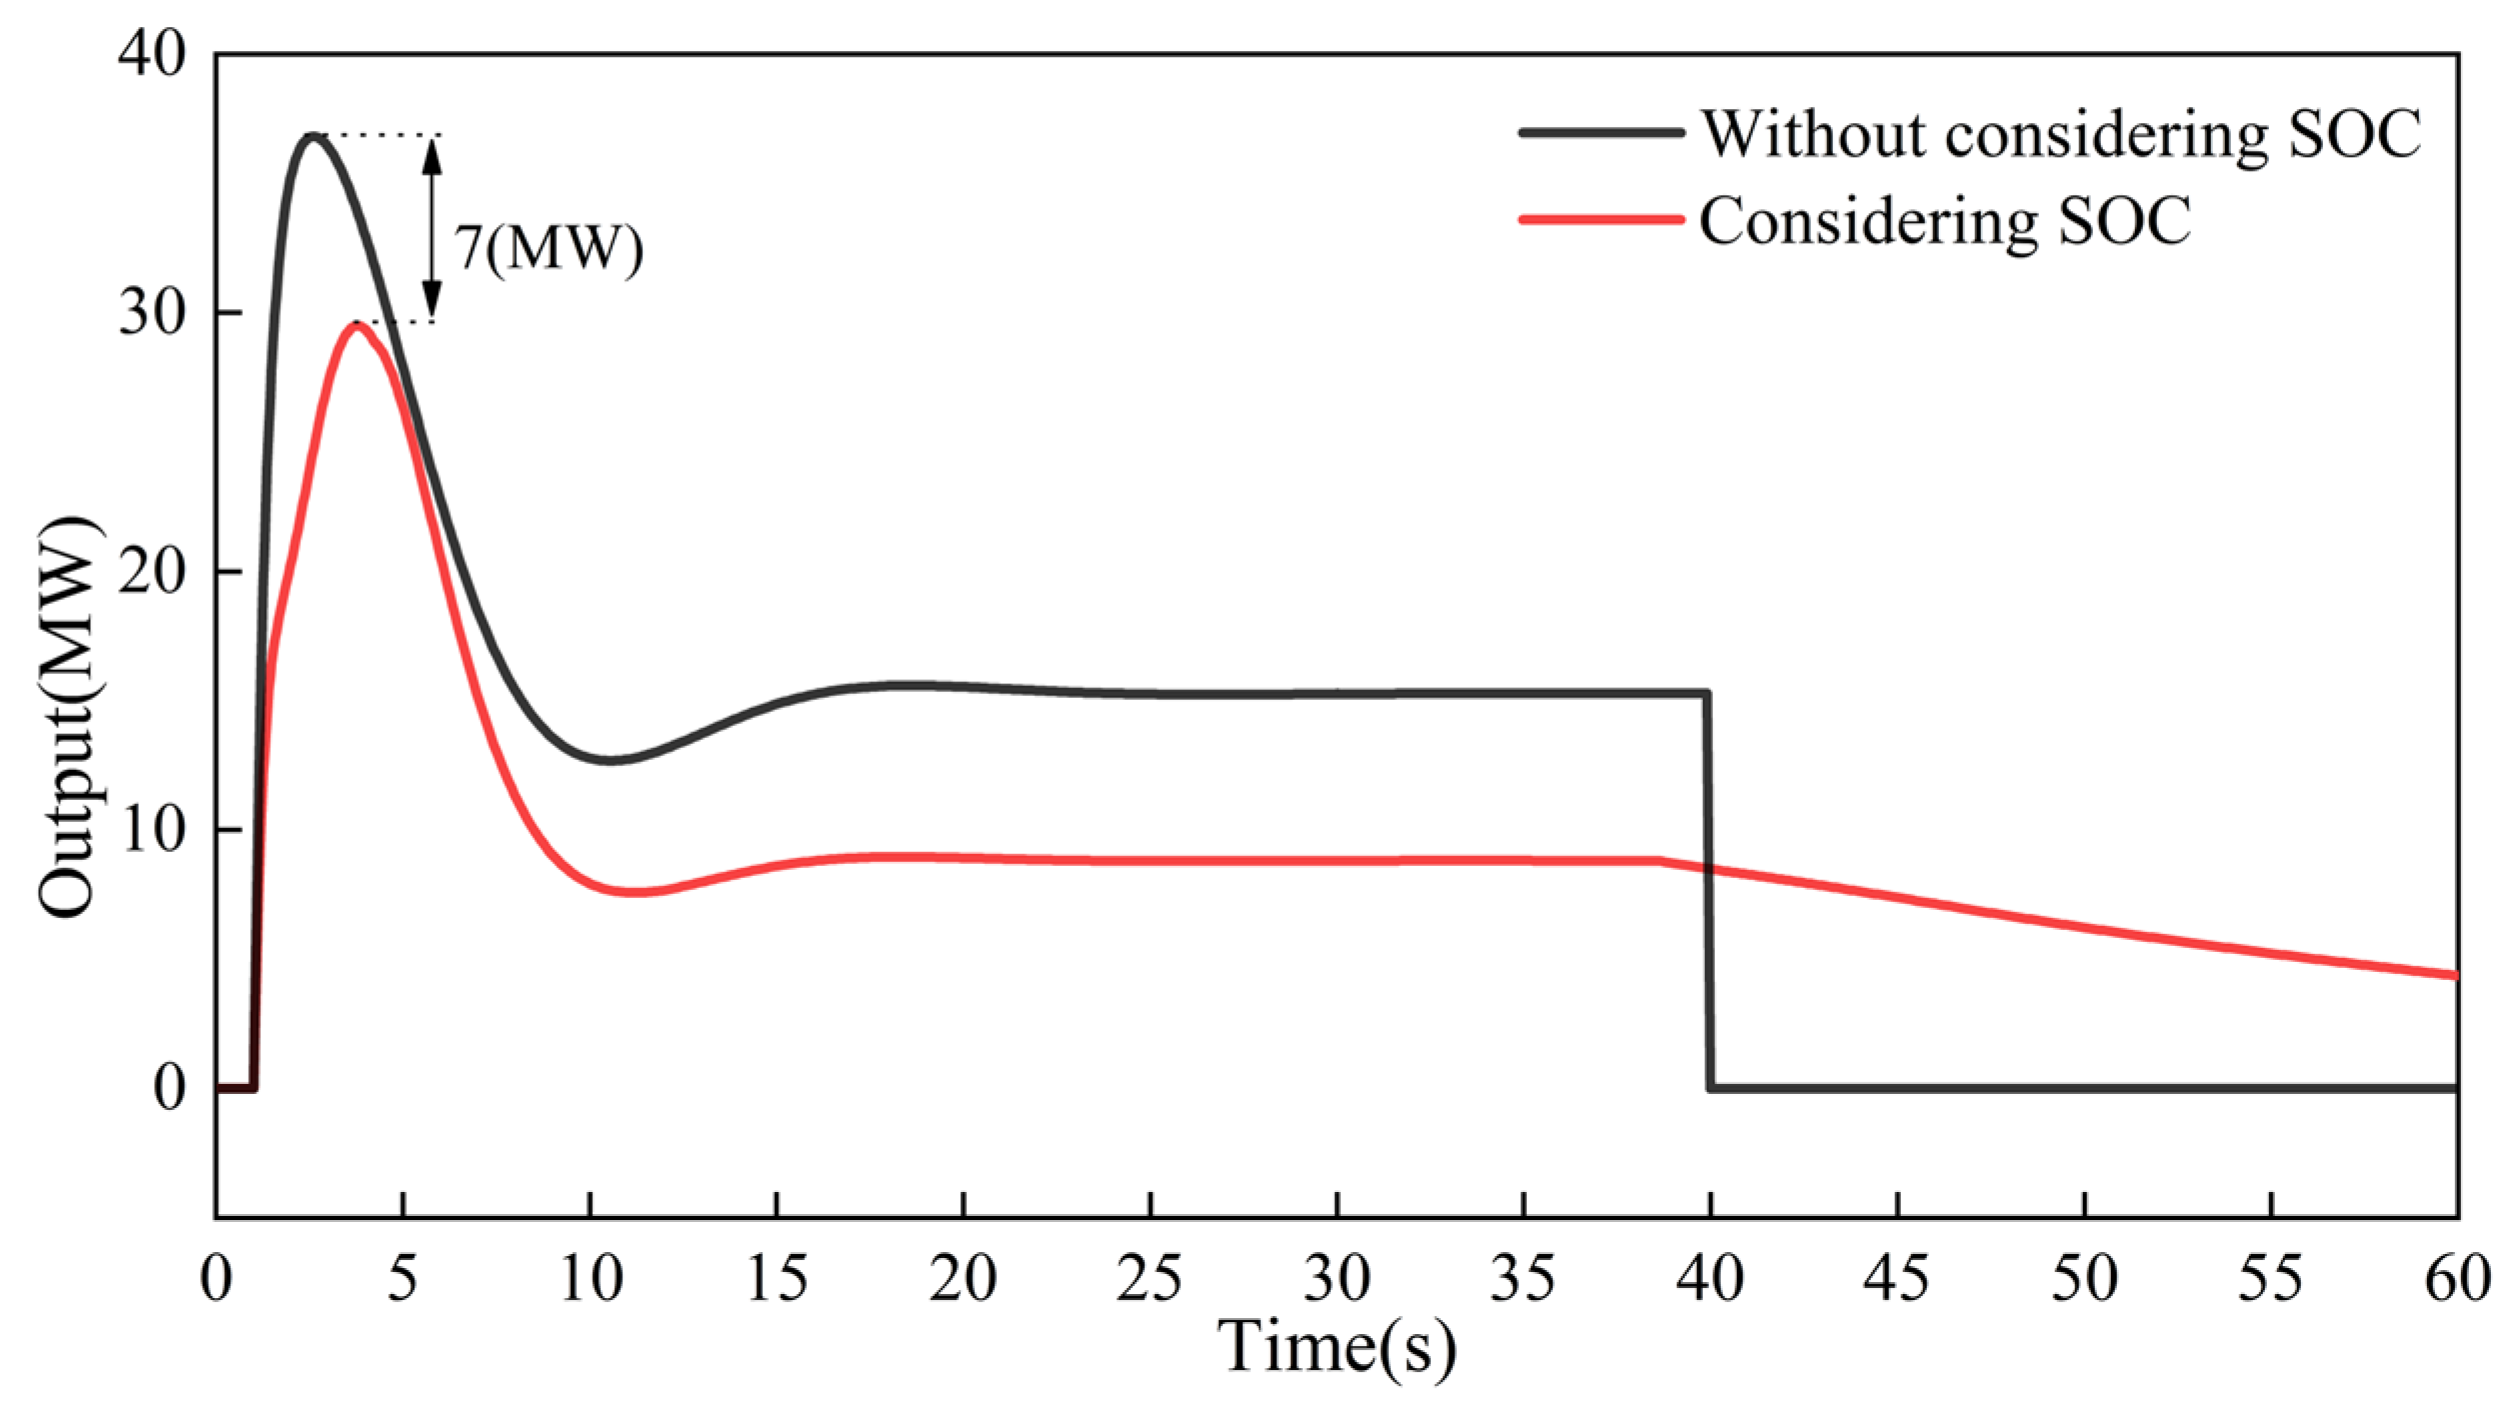
5.3. Adaptive Auxiliary Frequency Modulation with Energy Storage Considering SOC

To assess the performance of the proposed adaptive control scheme under SOC considerations for auxiliary frequency regulation, we modify the model outlined in Section 5.2 by replacing all five DERs with energy storage units. For analytical purposes, the initial SOC of the energy storage system is initialized at 60%, with a minimum SOC threshold set to 20%. When the SOC reaches this lower threshold, the operating voltage will drop to the minimum discharge voltage and no further discharge operations will be conducted. This section compares the frequency response, output power and SOC changes under the three control methods: (1) the original control without DER integration, (2) the optimized control with DER-based auxiliary frequency support and (3) the virtual inertia and droop adaptive control method considering the SOC. In the middle case, the calculated inertia and droop parameters D , J without considering the SOC remain constant. The proportionality coefficients, c 1 and c 2 , are both set to 0.5.
Figure 10 depicts the curves of frequency deviation corresponding to the three examined control schemes. The black curve represents the no-storage participation frequency modulation strategy, the red curve corresponds to the storage-assisted frequency modulation strategy without considering the SOC, and the blue curve depicts the adaptive storage-assisted optimization strategy that accounts for the SOC. After the energy storage system engages in supporting auxiliary frequency control, all performance indicators of the frequency response demonstrate improvement. However, at 40 s, the system frequency experiences a further drop of 0.1094 Hz due to the SOC of the energy storage exceeding its limit and halting discharge. The control strategy introduced in this work significantly improves the dynamic performance of the frequency response while maintaining system stability. Moreover, it avoids sudden frequency changes caused by the storage SOC exceeding its limits.
As illustrated in Figure 11, the SOC-based adaptive control strategy lowers the rated power demand of the energy storage system by 14.3% in comparison to the method that does not account for the SOC while also yielding a smoother discharge profile. Due to the limited capacity of the energy storage device, the SOC reaches its lower limit at 40 s, causing the device to stop discharging and thereby ceasing its auxiliary regulation role. This results in an instantaneous load deficit and triggers a frequency drop. The SOC-based adaptive control method proposed in this paper takes into account the dynamic changes in the SOC of the energy storage device. By adjusting its virtual inertia and droop parameter in real time according to Equations (47)–(52), the method adaptively regulates the power output. This ensures that, while providing auxiliary support for grid frequency modulation, it also prevents over-charging and over-discharging, thereby mitigating the risk of sudden frequency fluctuations.
For the purpose of analysis, the initial SOC is set to 60% in this study. As shown in Figure 12, under a sudden load disturbance in the grid, the energy storage device discharges continuously and promptly to fulfill its role in auxiliary frequency modulation. In contrast, under the control method, which does not account for the SOC state, the SOC reaches its lower limit of 20% at 40 s, limiting further discharge. The adaptive control method proposed in this paper demonstrates superior SOC maintenance performance, improving SOC utilization by 13.5% compared to the method without considering the SOC.

6. Conclusions

This paper proposes an analytical method targeting energy storage systems involved in inertial and primary frequency regulation. Initially, a second-order equivalent model is developed using aggregation theory, which reduces the multi-machine system into a single generator representation. Based on the concept of compensation, a fast-response strategy for DERs to participate in primary frequency regulation is proposed, which derives the virtual inertia and damping coefficients that DERs must provide to achieve acceptable levels of frequency overshoot and steady-state deviation. Finally, the virtual inertia and damping coefficients within the energy storage module are adaptively tuned using a control framework that incorporates SOC considerations. The case study demonstrates that the proposed analytical approach for DER participation in primary frequency regulation exhibits high accuracy. Additionally, the inclusion of SOC considerations enhances the efficiency of energy storage resource utilization, improves the performance of DERs in primary frequency regulation, and significantly boosts the overall frequency stability of the power system.
Currently, the analytical method is applied on the assumption of a common frequency and does not take into account multiple equilibrium regions and settings. Future work should expand the optimization settings to consider power flow settings, reserves of inertia, and the primary frequency response, as well as distribution network-level power flow, enabling more comprehensive participation of DERs in the frequency regulation loop and enhancing the overall control performance.

Author Contributions

Conceptualization, W.L. (Wentian Lu), E.T. and L.C.; methodology, W.L. (Wentian Lu), E.T. and L.C.; formal analysis, W.L. (Wentian Lu), E.T. and L.C.; investigation, W.L. (Wentian Lu), E.T., L.C., K.Z. and W.L. (Wenjie Liu); resources, W.L. (Wentian Lu), E.T., L.C. and K.Z.; data curation, W.L. (Wentian Lu), E.T., L.C. and K.Z.; writing—original draft preparation, W.L. (Wentian Lu), E.T., L.C., K.Z. and W.L. (Wenjie Liu); writing—review and editing, W.L. (Wentian Lu), E.T., L.C. and K.Z.; visualization, W.L. (Wentian Lu), E.T., L.C. and K.Z.; supervision, W.L. (Wentian Lu), L.C. and K.Z.; project administration, W.L. (Wentian Lu), L.C. and K.Z.; funding acquisition, W.L. (Wentian Lu), L.C. and K.Z. All authors have read and agreed to the published version of the manuscript.

Funding

This research was funded in part by the National Natural Science Foundation of China, grant number 52107093 (funder: W.L.), in part by the Guangdong Basic and Applied Basic Research Foundation, grant number 2022A1515240038 (funder: W.L.), in part by the Guangzhou Education Bureau University Research Project - Graduate Research Project, grant number 2024312278 (funder: L.C.), and in part by the STU Scientific Research Initiation Grant (SRIG), grant number STF23021 (funder: K.Z.).

Data Availability Statement

The original contributions presented in this study are included in this article. Further inquiries can be directed to the corresponding authors.

Conflicts of Interest

The authors declare no conflicts of interest.

References

  1. Sadorsky, P. Wind energy for sustainable development: Driving factors and future outlook. J. Clean. Prod. 2021, 289, 125779. [Google Scholar] [CrossRef]
  2. Cheng, L.; Yu, T. A new generation of AI: A review and perspective on machine learning technologies applied to smart energy and electric power systems. Int. J. Energy Res. 2019, 43, 1928–1973. [Google Scholar] [CrossRef]
  3. Shabestari, P.M.; Mehrizi-Sani, A. Frequency response improvement of PMSG wind turbines using a washout filter. Energies 2020, 13, 4797. [Google Scholar] [CrossRef]
  4. Li, M.; Huang, W.; Tai, N.; Yang, L.; Duan, D.; Ma, Z. A dual-adaptivity inertia control strategy for virtual synchronous generator. IEEE Trans. Power Syst. 2019, 35, 594–604. [Google Scholar] [CrossRef]
  5. Zhang, Y.; Weng, Y.; Li, H.; Zhou, Z.; Li, X. Research on China’s Electricity Market and Photovoltaic and Electrochemical Energy Storage Industry. In Proceedings of the 2023 8th Asia Conference on Power and Electrical Engineering (ACPEE), Tianjin, China, 14–16 April 2023; pp. 949–953. [Google Scholar]
  6. Ranjan, M.; Shankar, R. A literature survey on load frequency control considering renewable energy integration in power system: Recent trends and future prospects. J. Energy Storage 2022, 45, 103717. [Google Scholar] [CrossRef]
  7. Cheng, L.; Huang, P.; Zou, T.; Zhang, M.; Peng, P.; Lu, W. Evolutionary game-theoretical approaches for long-term strategic bidding among diverse stakeholders in large-scale and local power markets: Basic concept, modelling review and future vision. Int. J. Electr. Power Energy Syst. 2025, 166, 110589. [Google Scholar] [CrossRef]
  8. Cheng, L.; Peng, P.; Lu, W.; Sun, J.; Wu, F.; Shi, M.; Yuan, X.; Chen, Y. The evolutionary game equilibrium theory on power market bidding involving renewable energy companies. Int. J. Electr. Power Energy Syst. 2025, 167, 110588. [Google Scholar] [CrossRef]
  9. Hamid, B.; Hussain, I.; Iqbal, S.J.; Singh, B.; Das, S.; Kumar, N. Optimal MPPT and BES control for grid-tied DFIG-based wind energy conversion system. IEEE Trans. Ind. Appl. 2022, 58, 7966–7977. [Google Scholar] [CrossRef]
  10. Xu, B.; Gao, X.; Jing, S.; Yang, Z.; Guo, R. A Coordinated Control Strategy for the Wind Turbine Generator-Energy Storage Device Integrated System. In Proceedings of the 2023 International Conference on Power System Technology (PowerCon), Jinan, China, 21–22 September 2023; pp. 1–6. [Google Scholar]
  11. Sun, M.; Min, Y.; Chen, L.; Hou, K.; Xia, D.; Mao, H. Optimal auxiliary Frequency control of wind turbine generator and coordination with synchronous generator. CSEE J. Power Energy Syst. 2021, 7, 78–85. [Google Scholar]
  12. Thakallapelli, A.; Nair, A.R.; Biswas, B.D.; Kamalasadan, S. Frequency regulation and control of grid-connected wind farms based on online reduced-order modeling and adaptive control. IEEE Trans. Ind. Appl. 2020, 56, 1980–1989. [Google Scholar] [CrossRef]
  13. Li, X.; Huang, Y.; Huang, J.; Tan, S.; Wang, M.; Xu, T.; Cheng, X. Modeling and control strategy of battery energy storage system for primary frequency regulation. In Proceedings of the 2014 International Conference on Power System Technology, Chengdu, China, 20–22 October 2014; pp. 543–549. [Google Scholar]
  14. Engels, J.; Claessens, B.; Deconinck, G. Combined stochastic optimization of frequency control and self-consumption with a battery. IEEE Trans. Smart Grid 2017, 10, 1971–1981. [Google Scholar] [CrossRef]
  15. Rajan, R.; Fernandez, F.M.; Yang, Y. Primary frequency control techniques for large-scale PV-integrated power systems: A review. Renew. Sustain. Energy Rev. 2021, 144, 110998. [Google Scholar] [CrossRef]
  16. Rajan, R.; Fernandez, F.M. Power control strategy of photovoltaic plants for frequency regulation in a hybrid power system. Int. J. Electr. Power Energy Syst. 2019, 110, 171–183. [Google Scholar] [CrossRef]
  17. Li, J.; Wen, B.; Wang, H. Adaptive virtual inertia control strategy of VSG for micro-grid based on Iimproved bang-bang control strategy. IEEE Access 2019, 7, 39509–39514. [Google Scholar] [CrossRef]
  18. De Siqueira, L.M.S.; Peng, W. Control strategy to smooth wind power output using battery energy storage system: A review. J. Energy Storage 2021, 35, 102252. [Google Scholar] [CrossRef]
  19. Liu, Y.; Wang, Y.; Wang, M.; Xu, Z.; Peng, Y.; Li, M. Coordinated VSG control of photovoltaic/battery system for maximum power output and grid supporting. IEEE J. Emerg. Sel. Top. Circuits Syst. 2022, 12, 301–309. [Google Scholar] [CrossRef]
  20. Zhang, C.; Liu, L.; Cheng, H.; Liu, D.; Zhang, J.; Li, G. Frequency-constrained co-planning of generation and energy storage with high-penetration renewable energy. J. Mod. Power Syst. Clean Energy 2021, 9, 760–775. [Google Scholar] [CrossRef]
  21. Meng, J.; Wang, Y.; Fu, C.; Wang, H. Adaptive virtual inertia control of distributed generator for dynamic frequency support in microgrid. In Proceedings of the 2016 IEEE Energy Conversion Congress and Exposition (ECCE), Milwaukee, WI, USA, 18–22 September 2016; pp. 1–5. [Google Scholar]
  22. Andalib-Bin-Karim, C.; Liang, X.; Zhang, H. Fuzzy-secondary-controller-based virtual synchronous generator control scheme for interfacing inverters of renewable distributed generation in microgrids. IEEE Trans. Ind. Appl. 2018, 54, 1047–1061. [Google Scholar] [CrossRef]
  23. Zhang, Y.J.; Zhao, C.; Tang, W.; Low, S.H. Profit-maximizing planning and control of battery energy storage systems for primary frequency control. IEEE Trans. Smart Grid 2018, 9, 712–723. [Google Scholar] [CrossRef]
  24. Carrion, M.; Dvorkin, Y.; Pandzic, H. Primary frequency response in capacity expansion with energy storage. IEEE Trans. Power Syst. 2018, 33, 1824–1835. [Google Scholar] [CrossRef]
  25. Purba, V.; Dhople, S.V.; Jafarpour, S.; Bullo, F.; Johnson, B.B. Reduced-order structure-preserving model for parallel-connected three-phase grid-tied inverters. In Proceedings of the 2017 IEEE 18th Workshop on Control and Modeling for Power Electronics (COMPEL), Stanford, CA, USA, 9–12 July 2017; pp. 1–7. [Google Scholar]
  26. Cheng, L.; Yu, T. Smart dispatching for energy internet with complex cyber-physical-social systems: A parallel dispatch perspective. Int. J. Energy Res. 2019, 43, 3080–3133. [Google Scholar] [CrossRef]
  27. Blaabjerg, F.; Yang, Y.; Kim, K.A.; Rodriguez, J. Power electronics technology for large-scale renewable energy generation. Proc. IEEE 2023, 111, 335–355. [Google Scholar] [CrossRef]
  28. Guggilam, S.S.; Zhao, C.; Dall, E.; Chen, Y.C.; Dhople, S.V. Engineering inertial and primary-frequency response for distributed energy resources. In Proceedings of the 2017 IEEE 56th Annual Conference on Decision and Control (CDC), Melbourne, Australia, 12–15 December 2017; pp. 5112–5118. [Google Scholar]
  29. Horn, R.A.; Johnson, C.R. Matrix Analysis; Cambridge University Press: Cambridge, UK, 2012. [Google Scholar]
  30. Guggilam, S.S.; Zhao, C.; Dall’Anese, E.; Chen, Y.C.; Dhople, S.V. Optimizing DER participation in inertial and primary-frequency response. IEEE Trans. Power Syst. 2018, 33, 5194–5205. [Google Scholar] [CrossRef]
  31. Zhao, C.; Sun, D.; Nian, H.; Wang, M.; Yang, L. Analysis on the contribution of virtual synchronous generator controlled energy storage system to primary frequency modulation. In Proceedings of the 2021 4th International Conference on Energy, Electrical and Power Engineering (CEEPE), Chongqing, China, 23–25 April 2021; pp. 869–874. [Google Scholar]
  32. Pai, A. Energy Function Analysis for Power System Stability; Springer Science & Business Media: Berlin/Heidelberg, Germany, 1989. [Google Scholar]
  33. Milano, F.; Vanfretti, L.; Morataya, J.C. An open source power system virtual laboratory: The PSAT Case and Experience. IEEE Trans. Educ. 2008, 51, 17–23. [Google Scholar] [CrossRef]
Figure 1. Schematic diagram of power system components.
Processes 13 01146 g001
Figure 2. Schematic diagram of the oscillation equation.
Processes 13 01146 g002
Figure 3. Aggregation of the synchronous generator frequency response model. (a) A multi-machine primitive model; (b) An aggregated equivalent model.
Processes 13 01146 g003
Figure 4. Frequency response time domain evolution.
Processes 13 01146 g004
Figure 5. Relationship between unit regulation power of energy storage and SOC. The blue line represents the discharge power curve, indicating the reduction in power as the state of charge (SOC) decreases. The red line represents the charge power curve, showing the increase in power as SOC rises. The dashed lines correspond to the adjustable virtual droop coefficient (Dnet) for different SOC thresholds (QSOC_min and QSOC_max), with the power regulation behavior illustrated between these limits.
Processes 13 01146 g005
Figure 6. Single-line diagram of IEEE 39-bus.
Processes 13 01146 g006
Figure 7. Comparison of the aggregation model with the multi-machine primitive model.
Processes 13 01146 g007
Figure 8. Comparison of frequency response before and after DER involvement in optimization.
Processes 13 01146 g008
Figure 9. Comparison of frequency response overshoot for different renewable energy penetration rates.
Processes 13 01146 g009
Figure 10. A comparison of system frequency deviations under various control strategies.
Processes 13 01146 g010
Figure 11. The curves of output power of energy storage devices under load surging.
Processes 13 01146 g011
Figure 12. The value of the SOC of energy storage devices under load surging.
Processes 13 01146 g012
Table 1. Parameters of 10 synchronous generator units in IEEE39 system.
TypeNumber τ ( s ) R g J g ( s ) D g
SGG140.2170.13020.0434
G240.2170.13020.0434
G350.19840.12030.0343
G460.17980.12030.0343
G1040.2170.13020.0434
G570.16120.12030.0343
G680.14260.12030.0343
G790.12400.13020.0434
G8100.10540.13020.0434
G9100.08680.13020.0434
Disclaimer/Publisher’s Note: The statements, opinions and data contained in all publications are solely those of the individual author(s) and contributor(s) and not of MDPI and/or the editor(s). MDPI and/or the editor(s) disclaim responsibility for any injury to people or property resulting from any ideas, methods, instructions or products referred to in the content.

