Article

Comparison of Thermochemical Conversion Processes for Antibiotic Residues: Insights from Life Cycle Assessment

1
College of Chemistry and Environmental Engineering, Shenzhen University, Shenzhen 518060, China
2
Guangdong Provincial Key Laboratory of Durability for Marine Civil Engineering, Shenzhen Durability Centre for Civil Engineering, College of Civil and Transportation Engineering, Shenzhen University, Shenzhen 518060, China
3
Beijing Key Laboratory of Resource-oriented Treatment of Industrial Pollutants, Department of Environmental Science and Engineering, University of Science and Technology Beijing, Beijing 100083, China
4
National-Regional Joint Engineering Research Center for Soil Pollution Control and Remediation in South China, Guangdong Key Laboratory of Integrated Agro-Environmental Pollution Control and Management, Institute of Eco-Environmental and Soil Sciences, Guangdong Academy of Sciences, Guangzhou 510650, China
*
Author to whom correspondence should be addressed.
Processes 2025, 13(4), 1139; https://doi.org/10.3390/pr13041139
Submission received: 10 March 2025 / Revised: 28 March 2025 / Accepted: 3 April 2025 / Published: 10 April 2025
(This article belongs to the Special Issue Research on Biomass Energy and Resource Utilization Technology)

Abstract

:
Life cycle assessment (LCA) was conducted to evaluate the environmental impacts and health risks associated with four thermochemical conversion technologies: incineration, gasification, pyrolytic liquefaction, and hydrothermal liquefaction. Results revealed that all processes yielded positive net environmental benefits (3.8–8.2 kg CO2-eq/kg AR reduction), with hydrothermal liquefaction exhibiting the lowest emissions (GWP-5.71 kg CO2-eq/kg). However, its widespread application has been hindered by process limitations, and enhancing catalytic efficiency has been identified as a critical area for future research. Incineration ranked second in terms of environmental benefits and remains the most favorable method according to existing studies. In contrast, gasification and pyrolytic liquefaction did not demonstrate significant environmental advantages, primarily due to the high energy consumption required for drying. Consequently, optimizing the drying process has been highlighted as a key focus for future research efforts. This study provided valuable insights for the safe disposal and resource recovery of antibiotic residue.

1. Introduction

Since the 1990s, China has become the world’s largest producer and consumer of antibiotic raw materials [1]. According to statistics, China’s antibiotic production reached 248,000 tons in 2023, accounting for over 70% of the global market. Along with this, over 2 million tons of antibiotic residue are generated annually [2]. Antibiotic residues were classified as hazardous waste and primarily originated from the extraction and filtration processes in antibiotic production. Their main components included mycelium, metabolites produced during fermentation, degradation products of the culture medium, and residual antibiotics [3]. Given the large volume and variety of antibiotic residue, pharmaceutical companies face the urgent challenge of how to safely, efficiently, and effectively treat and recycle it [4]. One approach, residue composting technology, involves using microorganisms, such as fungi and bacteria, to ferment the residue, converting the organic matter into a harmless, mineralized, and humified product that can be used as organic fertilizer. While this method is cost-effective, existing LCA studies predominantly focus on carbon footprint reduction while systematically neglecting antibiotic resistance gene transmission risks in soil ecosystems; if the residual antibiotics are not fully eliminated, the antibiotics in the resulting fertilizer could enter the soil, accumulate in microorganisms and plants, and potentially lead to bioaccumulation in the food chain, posing significant risks [5]. Anaerobic digestion of antibiotic residue can neutralize its biological toxicity, allowing it to be used as a raw material for organic fertilizer, thus achieving resource recovery. However, current assessments oversimplify the environmental trade-offs. By omitting spatial-temporal variations in dig estate management, anaerobic digestion also generates large amounts of wastewater and solid waste, creating additional pollution management challenges [6]. Currently, thermochemical treatment methods are considered the most reliable approach for managing antibiotic residue, as they not only treat the waste but also allow for energy recovery. However, prior LCAs exhibit three critical limitations. Over 80% of studies focus solely on incineration, lacking comparative analysis of alternative pathways; system boundaries rarely incorporate upstream antibiotic production phases; few quantify the synergistic effects of heavy metal immobilization during biochar formation. Based on the composition and properties of antibiotic residue, the main thermochemical conversion processes suitable for its treatment include incineration [7], gasification [8], pyrolysis [9], and hydrothermal liquefaction [3].
Incineration was a treatment technology that oxidized and burned antibiotic residues in a furnace, reducing their volume to less than 5% of the original, eliminating harmful substances, and recovering heat. However, the initial high moisture content required dehydration pretreatment, increasing costs and potentially generating secondary pollutants [10]. Gasification, conducted at temperatures between 700 and 1200 °C, converted biomass with gasifying agents into gaseous products. The high moisture content of the residues enhanced H2 content, but tar accumulation affected equipment performance [11]. Pyrolytic liquefaction aimed to achieve the highest liquid yield by controlling reaction conditions but required reducing moisture content, further raising costs [9]. Industrial drying processes (e.g., rotary kilns) may generate secondary pollutants through fossil fuel combustion, whereas open-air solar drying leverages natural energy flows without direct emissions. Hydrothermal liquefaction used water as a solvent, applying pressure and heat to decompose biomass into high-energy liquid products [1]. However, the complex water-phase products generated were difficult to recycle, limiting market promotion. For the treatment of antibiotic residues, each of the four processes has its advantages, making the selection of an appropriate thermochemical conversion method challenging; thus, life cycle assessment (LCA) should be considered [12].
LCA originated in the late 1960s when Coca-Cola in the United States tracked and quantitatively analyzed the entire life cycle of beverage bottles, from raw material extraction to final waste disposal [13]. LCA has since gained widespread recognition for its comprehensive evaluation of products or technologies across their entire life span, following a “cradle-to-gate” or “cradle-to-grave” approach [14,15,16,17]. Numerous LCA studies on biomass thermochemical conversion technologies have been published. For instance, Usmani conducted an LCA study comparing the incineration and pyrolysis of straw, concluding that pyrolysis liquefaction was the superior treatment method [18]. Huang examined the LCA of microalgae through gasification and pyrolysis liquefaction, finding that gasification improved environmental benefits by 15% compared to liquefaction [19]. Similarly, Arias compared hydrothermal liquefaction, hydrothermal carbonization, and pyrolysis liquefaction of food waste, determining that hydrothermal carbonization was the optimal solution in terms of both disposal costs and environmental benefits [20]. These studies offer valuable insights into the selection of thermochemical conversion methods for the treatment of antibiotic residue. However, there is a significant lack of LCA research specifically focused on antibiotic residue thermochemical conversion, particularly regarding comparative analyses of multiple treatment methods and the identification of optimal solutions. More research is needed to fill this gap and provide a solid basis for selecting the most efficient and environmentally friendly treatment strategies for antibiotic residues.
This study conducted an LCA of four thermochemical conversion methods for the resource recovery of antibiotic residues. By constructing an LCA model, it comprehensively analyzed the potential environmental impacts and burdens at each stage of the four processes, aiming to identify the optimal thermochemical conversion method for treating antibiotic residues.

2. Materials and Methods

LCA was a process for assessing the environmental impacts of a product or process throughout its entire life cycle, from raw material extraction to final disposal [21]. According to the ISO-14040 standard (Principles and Framework for Environmental Management), LCA was divided into four basic steps: goal and scope definition, inventory analysis, impact assessment, and interpretation of results (ISO, 2006) [21].

2.1. Goal and Scope Definition

The aim of this study was to evaluate the environmental impacts of four thermochemical conversion methods for the resource recovery of antibiotic residue, including incineration, gasification, pyrolytic liquefaction, and hydrothermal liquefaction, in order to determine the optimal thermochemical conversion approach for antibiotic residue. The system boundary encompassed the entire thermochemical conversion process, including the collection and transportation of antibiotic residue, thermochemical reactions, exhaust gas treatment, product upgrading, product recovery, and wastewater treatment. In this study, the penicillin fermentation residue showed an initial moisture content of 80% (±1%) as determined by the 105 °C oven-drying method. System boundaries cover North China’s pharmaceutical clusters (2015–2020), with temporal allocation using 2022 IPCC emission factors. Regional specificity was addressed through local grid mix (63% coal-based); transportation radii ≤ 200 km; and humidity-adjusted drying models.

2.2. Life Cycle Inventory

2.2.1. Composition of Antibiotic Residue

Penicillin residue, which is the most widely used and produced antibiotic residue, was selected as a typical representative. It was sourced from a pharmaceutical factory in Hebei Province, China. The specific composition is shown in Table S1. Biogenic CO2 from biomass degradation is considered carbon-neutral within the biogenic cycle, distinct from fossil-derived emissions [20]. In this study, the carbon produced from antibiotic residue is considered biocarbon, and the CO2 generated during its conversion is not accounted for in carbon emissions.

2.2.2. Technology Configuration

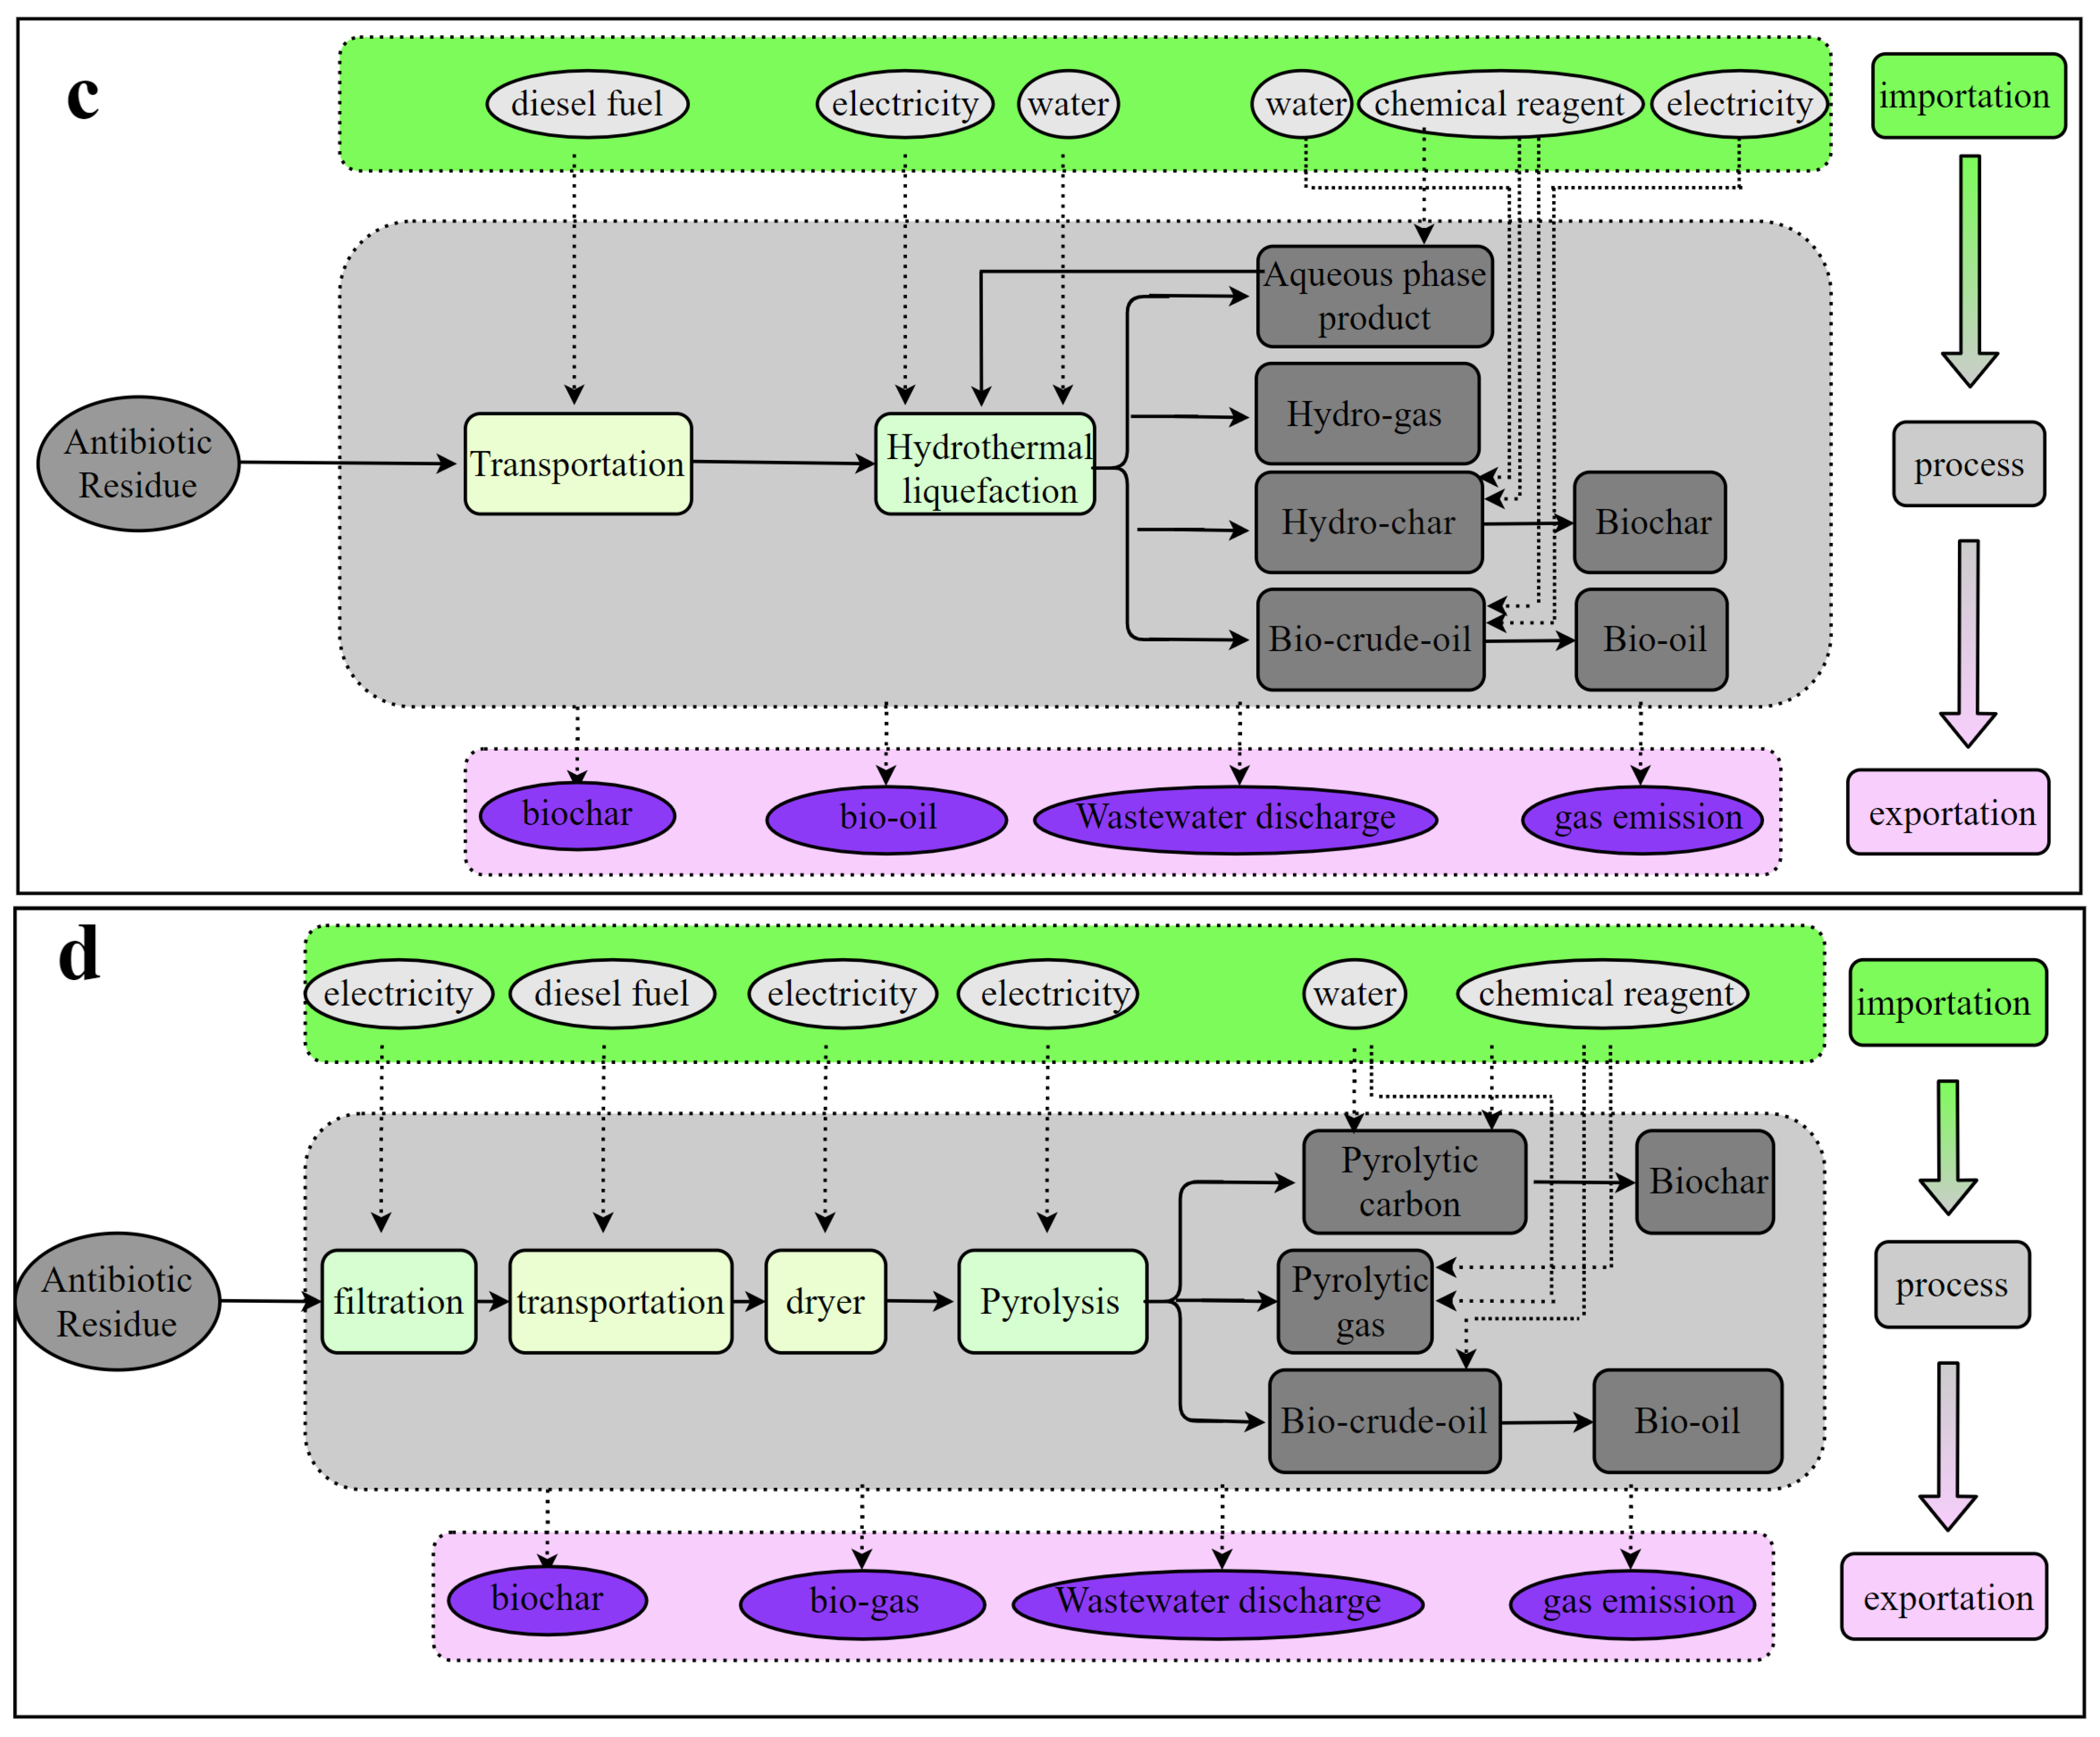
This study identified four technological configurations for the thermochemical conversion of antibiotic residues. All four processes utilized 1000 kg of antibiotic residues as the initial feedstocks, with the specific LCA system boundaries illustrated in Figure 1. TC1: Incineration of antibiotic residues; TC2: gasification of antibiotic residues; TC3: hydrothermal liquefaction of antibiotic residues; TC4: hydrothermal carbonization of antibiotic residues.
The lifecycle boundaries and process flows of the four technologies are shown in Figure 1. The incineration process includes antibiotic residue dewatering, transportation, thermal drying, high-temperature combustion (850–1200 °C), waste heat power generation, flue gas purification, and ash handling [22,23,24], with the lifecycle inventory provided in Table S2. For pyrolysis, the process is carried out under an inert atmosphere (N2) through sequential steps: dewatering, transportation, thermal drying, slow pyrolysis at 600 °C for 15 min [9,25], followed by condensation systems for bio-oil recovery and biochar collection, as outlined in Table S4. This configuration primarily generates biochar (35–45 wt%), bio-oil (25–35 wt%) and non-condensable gases. The gasification process differs fundamentally by introducing oxidative agents (H2O/CO2) at higher temperatures (1000 °C for 15 min) [11,24]. Its workflow includes dewatering, transportation, thermal drying, syngas production through partial oxidation, and gas cleaning systems, with detailed inventory in Table S3. The main products are syngas (CO + H2 > 60 vol%) with trace CH4 (<5 vol%). Hydrothermal liquefaction employs subcritical water (280–370 °C, 10–25 MPa) [3,26] for conversion, comprising transportation, aqueous-phase reaction, off-gas treatment, and sequential separation of bio-crude, hydrochar, and aqueous-phase products, as detailed in Table S5.

2.3. Sensitivity Ratios of LCA

Sensitivity analysis was crucial for evaluating the robustness of the LCA models and identifying key contributors to the outcomes, allowing for targeted improvements for each technology. The sensitivity analysis in the LCA was calculated using Equation (1), as described by Liao et al. [27]. According to Edwards et al. [28], a one-at-a-time approach was employed, where each environmental factor (i.e., input materials) was adjusted by 10% to assess its impact on the LCA results. This method provided sensitivity ratios that highlighted the responsiveness of LCA outcomes to changes in input variables.
S e n s i t i v i t y   r a t i o = Δ r e s u l t / r e s u l t Δ f a c t o r / f a c t o r
Δresult is the absolute change in LCA output, result is the baseline value; Δfactor represents parameter adjustment (±10% baseline), and factor is the original parameter value.

2.4. Impact Assessment and Interpretation of Results

In this study, the GaBi Software for Education (9.2.1 68) and its database were chosen to track the environmental impacts throughout the life cycles of the four processing methods [21]. The LCA data were analyzed using the Recipe 2016 method; ReCiPe was typically chosen to analyze midpoint indicators, including 12 commonly assessed metrics: global warming potential (GWP), ozone depletion potential (ODP), acidification potential (AP), eutrophication potential (EP), human toxicity potential (HTP), ecotoxicity potential (ETP), abiotic depletion potential (ADP), land use, freshwater consumption (FC), freshwater ecotoxicity (FE), terrestrial ecotoxicity (TE), and PM2.5. Positive values in the results indicated environmental impacts, while negative values represented ecological benefits [16].

3. Results and Discussion

3.1. Analysis of All Midpoint Indicators for the Life Cycle Assessment of Four Processes

In order to compare the environmental impacts of the different processes, the midpoints of the four thermochemical conversion processes were counted using the methodology described in Section 2.4, and the relevant results are shown in Figure 2.
In this study, the absolute values of 12 midpoint indicators across four processes—incineration, gasification, pyrolysis oil production, and hydrothermal liquefaction—were compared. The highest value for each indicator was set to 100%, and the values for the other three processes were expressed as percentages relative to this maximum. As illustrated in Figure 2, the differences in FC, FE, TE, and PM2.5 were less than 20% across all four thermochemical treatment processes. According to Ludin’s study, the impact of systematic error on midpoint indicator data becomes more significant when the difference is below 30% [16]. Therefore, it is essential to analyze indicators with smaller differences to eliminate the influence of systematic errors.

3.1.1. Effect of Low Differences Middle-Points

As shown in Figure 2, the difference in FC was less than 10%. Regarding freshwater consumption, the incineration process utilized recycled water within the energy system, reducing the need for freshwater and resulting in a moderate level of consumption [29]. Gasification had similar freshwater usage due to high energy efficiency and optimized cooling systems [30]. In the pyrolysis process, water was mainly used to control reaction temperatures and for product cooling, and efficient water recycling systems led to minimal freshwater usage [31]. Although hydrothermal liquefaction required water as a reaction medium, the high moisture content of the antibiotic residue reduced the need for additional water, and cooling water was recycled, further lowering the freshwater demand [32]. This also explains the small difference in freshwater consumption in thermochemical transformations.
Antibiotic residue had contaminated freshwater, leading to concerns about freshwater toxicity, which has been the subject of extensive study. The incineration process generated flue gases containing sulfur dioxide, nitrogen oxides, and heavy metals, which were treated via advanced flue gas treatment systems. These systems effectively removed toxic pollutants, preventing them from entering wastewater. Gasification produced tars and liquid waste containing organic pollutants, but these were treated and not discharged into freshwater ecosystems [33]. In pyrolysis oil production, harmful substances such as polycyclic aromatic hydrocarbons (PAHs) and trace heavy metals were treated through tar recovery, wastewater treatment, and pollutant separation, ensuring minimal impact on freshwater ecotoxicity [34]. In hydrothermal liquefaction, the aqueous phase byproducts, which might contain organic pollutants and trace metals, were treated and recycled back into the process, minimizing wastewater discharge [35]. All of the above account for the small differences in FE.
The thermochemical transformation of antibiotic residue inevitably produced a large amount of toxic substances, which, along with wastewater, solid waste, and other discharges, enter terrestrial ecosystems. For terrestrial ecotoxicity, incineration’s contribution mainly stemmed from residual harmful substances in flue gases and bottom ash. These emissions were mitigated through electrostatic precipitators, baghouse filters, flue gas desulfurization systems, and stabilization of bottom ash and hazardous waste fly ash [29]. Gasification released lower quantities of harmful gases such as sulfur dioxide and nitrogen oxides, and these were captured by gas purification systems, reducing their toxicity impact on terrestrial ecosystems [33]. Solid residues like biochar were treated to minimize potential hazards. In pyrolysis oil production, solid residues and gaseous byproducts containing toxic organics were stabilized through solid waste management practices [34]. Hydrothermal liquefaction’s solid residues containing trace heavy metals were treated through stabilization processes, which effectively minimized their contribution to terrestrial ecotoxicity [3]. In summary, thermochemical conversion had a low toxicity impact on terrestrial ecosystems under regulated operations.
For PM2.5 emissions, incineration processes used electrostatic precipitators and baghouse filters to capture fine particulate matter, keeping PM2.5 emissions low. Gasification, performed under oxygen-limited conditions, reduced the direct formation of particulates [18]. However, volatile organic compounds (VOCs) in the off-gas could lead to secondary PM2.5 formations in the atmosphere, though this was controlled by gas purification equipment. In pyrolysis oil production and hydrothermal liquefaction, volatile organic compounds and fine particles were filtered and captured, significantly reducing PM2.5 emissions [27]. Hydrothermal liquefaction, conducted in a liquid environment, inherently produced fewer particulates due to the absence of direct combustion, and further reduction was achieved through the condensation and separation of particles via the liquid medium [18]. Therefore, the thermochemical conversion of antibiotic residue had minimal impact on PM2.5 emissions.
As shown in Figure 2, significant differences were observed among the eight midpoint indicators—GWP, land use, ADP, EP, HTP, ETP, OD, and AP—with differences exceeding 40%. In subsequent research, the eight indicators with large differences, such as GWP, were analyzed individually.

3.1.2. Analysis of Resource Consumption and Environmental Effects of Thermochemical Transformation of Antibiotic Residues

To reveal the potential differences and environmental impacts of the four thermochemical conversion processes in terms of resource consumption, environmental effects, and ecological consequences, GWP, land use, ADP, and EP were analyzed. Results are presented in Figure 3.
GWP was a key indicator used to assess the impact of greenhouse gas emissions on climate change. This metric measured the emissions of various greenhouse gases and compared them to the effects of carbon dioxide, typically expressed in terms of carbon dioxide equivalent (CO2-eq), encompassing significant greenhouse gases such as carbon dioxide, methane (CH4), and nitrous oxide (N2O) [27]. As illustrated in Figure 3a, the GWP values for the four processes were all negative, indicating that they were all carbon reduction technologies. The incineration process exhibited the best GWP, at only 99.14 kg CO2 equivalent/t, primarily due to its simple operation and the self-heating value of the residue being sufficient for combustion without the need for additional carbon sources. Gasification showed the lowest net GWP at −5.71 kgCO2e/t, reflecting actual carbon sequestration potential rather than absolute magnitude; although the hydrogen produced could offset some carbon emissions, the high energy consumption of the process resulted in a lower net emission value [10]. The GWP for pyrolysis was lower than that for gasification, and its net emission value surpassed that of incineration, mainly because of its lower energy consumption and the effective offset of carbon emissions through the production of bio-oil and biochar [9]. The net GWP for hydrothermal liquefaction reached −68.20 kg CO2 equivalent/t, despite its longer reaction time leading to the highest GWP emissions (133.15 kg CO2 equivalent/t); however, the near-complete recycling of organic matter allowed for better carbon reduction effects [35]. In summary, gasification had the best GWP indicator.
The land use indicator assessed the impact of land transformation or utilization on ecosystems, including biodiversity loss, soil erosion, and the degradation of ecosystem services. As shown in Figure 3b, the net land use emission values for the four processes ranked as follows: incineration (TC1) < gasification (TC2) < hydrothermal liquefaction (TC4) < pyrolysis (TC3). The incineration process had the highest land use emission value, reaching 13.2 CO2 equivalent·m2·year, primarily due to the substantial carbon released during combustion. However, the net land use emission value for incineration was the lowest, at −0.72 CO2 equivalent·m2·year, indicating its relatively minimal impact on ecosystems, which was closely related to the implemented carbon compensation measures and sound land management practices [8]. Gasification had higher land use emissions compared to pyrolytic liquefaction, but its net emission value was lower than that of pyrolytic liquefaction, mainly due to the higher carbon offset provided by the hydrogen and carbon monoxide produced during gasification [36]. Therefore, gasification had the best land use.
In terms of resource consumption, ADP evaluated the environmental impact of consuming non-renewable resources such as fossil fuels. ADP was typically expressed in terms of oil equivalent, encompassing the consumption of energy resources such as oil, natural gas, and coal. As shown in Figure 3c, the incineration process exhibited the lowest fossil resource consumption, at only 82 kg oil equivalent/t, primarily because it required oil spraying during the initial ignition phase and subsequently needed minimal additional energy input, resulting in relatively low outputs of only 116 kg oil equivalent/t [37]. In contrast, the gasification process had the highest resource consumption, reaching 153 kg oil equivalent/t, but also produced the highest output at 229 kg oil equivalent/t. This was mainly attributed to the high temperatures (exceeding 1000 °C) required during gasification, leading to maximum power consumption, while the hydrogen and carbon monoxide produced effectively offset fossil energy consumption [38]. The fossil resource consumption and output for pyrolysis ranked second, with consumption at 145 kg oil equivalent/t, slightly lower than that of gasification; the bio-oil and biochar produced under high-temperature conditions (approximately 700 °C) offered less offsetting effectiveness compared to gaseous fuels [34]. The fossil resource consumption for hydrothermal liquefaction was relatively low, at only 93 kg oil equivalent/t, while its output was commendable, reaching 160 kg oil equivalent/t, primarily due to the lower temperature requirements of the hydrothermal liquefaction process. Despite the longer reaction time, the bio-oil and biochar produced by hydrothermal liquefaction also contributed to partially offsetting fossil energy consumption [39]. Overall, incineration had the lowest fossil energy consumption.
EP measured the impacts of excessive nutrient release (such as nitrogen and phosphorus) on water bodies and soil, particularly in terms of inducing eutrophication in aquatic environments, typically expressed in terms of phosphorus equivalent. As illustrated in Figure 3d, the EP values for the four processes revealed that the incineration process involved the lowest concentration of organic matter in water, resulting in the lowest EP, reflecting the advantages of incineration in controlling eutrophication. In contrast, the gasification and pyrolysis processes produced higher levels of water-soluble organic matter, leading to a significant increase in EP. Among them, pyrolysis exhibited the highest net EP emissions (0.013 kg N equivalent/t) due to its poor recycling and internal circulation effectiveness, indicating a notable eutrophication impact on the environment [9]. Although hydrothermal liquefaction produced higher organic matter content in its aqueous phase products, it achieved complete recycling of the aqueous phase products without external discharge, resulting in the lowest EP and optimal net emissions (−0.11 kg N equivalent/t).

3.1.3. Integrated Assessment of Human Health and Ecological Impact Potentials

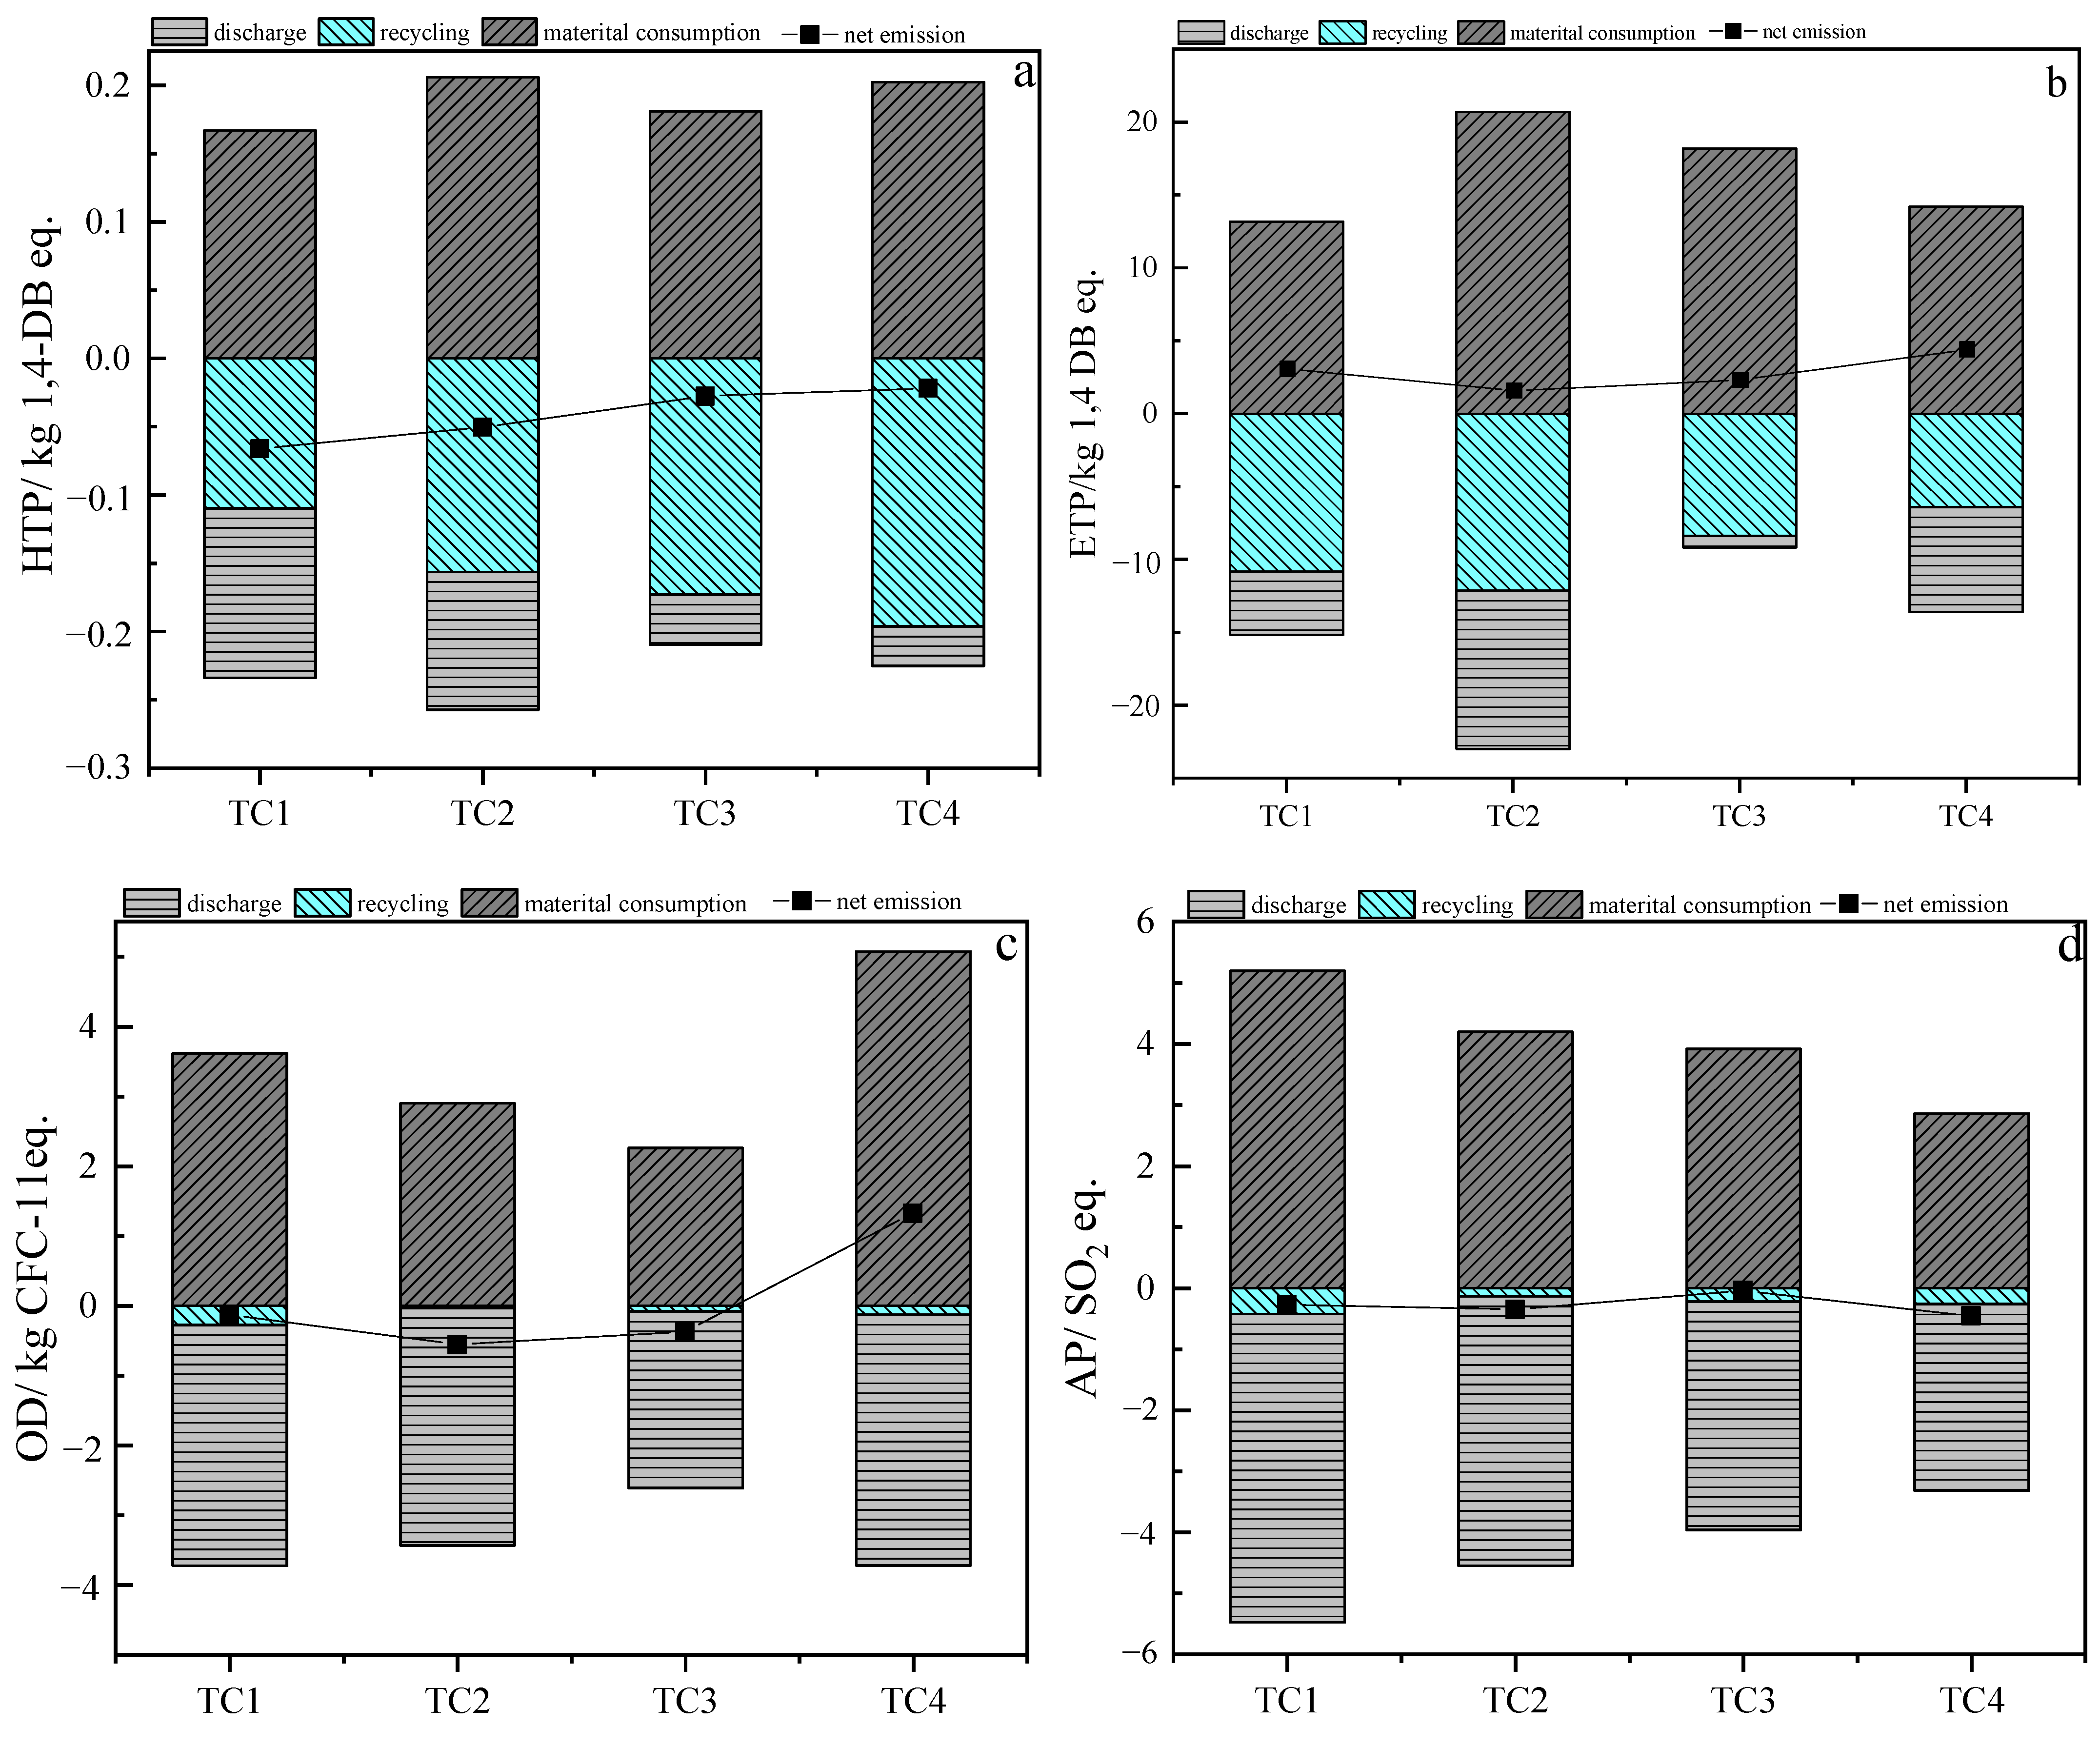
In order to further assess the environmental impacts of thermochemical conversion processes on human health, ecosystems, and atmospheric conditions, four additional widely varying mid-point indicators—HTP, ETP, OD, and AP—were also analyzed. The results are presented in Figure 4.
HTP was an important indicator for assessing the potential impacts of harmful substances on human health, particularly focusing on the accumulation of dioxins, heavy metals, and particulate matter in the food chain during processing and emissions. As shown in Figure 4a, the net HTP emissions for the incineration process were the highest, reaching 10.68 kg 1,4-DB equivalent/t, primarily due to the significant generation of dioxins during incineration. In contrast, the net HTP emission value for gasification was −5.32 kg 1,4-DB equivalent/t, lower than that of pyrolysis at 3.94 kg 1,4-DB equivalent/t, attributed to the higher temperatures and faster heating rates during gasification, which effectively reduced dioxin generation. The HTP emissions from hydrothermal liquefaction were relatively high, mainly due to the increased particulate content in its solid products [1]. However, the net HTP emission value for hydrothermal liquefaction was the lowest at −22.31 kg 1,4-DB equivalent/t, indicating that during the process, some heavy metals and particulates dissolved into the aqueous products and entered the closed-loop system, significantly reducing external emissions. In summary, gasification was the most suitable thermochemical conversion means in terms of HTP.
ETP assessed the potential hazards of chemicals to terrestrial ecosystems, usually expressed in terms of 1,4-dichlorobenzene equivalents. Figure 4b indicates that all four processes had positive impacts on terrestrial ecotoxicity. Among them, the incineration process exhibited the lowest ETP emissions, at only 0.173 kg 1,4-DB equivalent/t, with a net emission value of −0.62 kg 1,4-DB equivalent/t, demonstrating its effectiveness in reducing heavy metal emissions and mitigating environmental impacts. Gasification had the highest ETP emissions; its net emission value was −0.05 kg 1,4-DB equivalent/t, indicating that despite higher emissions, effective pollution control measures ensured good management of net emissions [40]. The ETP net emissions for pyrolysis were slightly higher than those for gasification, suggesting that controlling the heating rate and reaction temperature was critical for enhancing its ecological friendliness. Among the four thermochemical transformations, hydrothermal liquefaction exhibits the lowest ETP emissions at 0.19 kg 1,4-DB eq/ton, with a net emission value close to zero, indicating that its impact on terrestrial ecosystems was relatively minimal.
OD measured the potential of specific substances to harm the atmospheric ozone layer, typically expressed in terms of trichlorofluoromethane (CFC-11) equivalents [35]. Figure 4c illustrates that hydrothermal liquefaction had the highest OD value (4.98 × 10⁻⁴ kg CFC-11 eq./t), primarily due to the presence of nitrogen oxides (NOx) in its gaseous products, which effectively promote ozone layer depletion. The incineration process ranked second in OD value, due to the release of volatile organic compounds (VOCs) during combustion, which also contributed to ozone decomposition. In contrast, the pyrolysis process exhibited the lowest OD emissions (−2.83 × 10⁻⁴ kg CFC-11 eq./t). This also aligned with Wang’s research, which showed that during the pyrolysis process, a significant portion of nitrogen-containing organic compounds was converted into bio-oil, thereby reducing their content in the gaseous products [27]. Notably, the high reaction temperatures in gasification led to the decomposition of nitrogen-containing organic compounds in the gaseous products, resulting in the lowest net OD emissions.
AP reflected the potential environmental impacts of acidic substance emissions, particularly on soils and water bodies. Substances like sulfur dioxide (SO2) and nitrogen oxides (NOx) influenced the natural environment and buildings by forming acidic precipitation. This indicator was typically expressed in terms of sulfur dioxide equivalents to evaluate the potential threats of acid rain to ecosystems (such as forest and lake acidification) and human health. As shown in Figure 4d, the acidification potential for the incineration process was 5.1 kg SO2 equivalent/t, indicating its significant contribution to the generation of acidic substances, along with strong recycling capabilities and effective mitigation of acidification. This was similar to the Ghimpeteanu’s study, which conducted incineration tests on sludge, indicating that a well-designed incineration process did not lead to an increase in acidification potential [40]. The acidification potential for gasification ranked second; while it performed worse than incineration, it still demonstrated reasonable treatment capacity. The acidification potential for pyrolysis ranked third, with overall positive net emissions, indicating some release of acidic substances during processing. In contrast, the hydrothermal liquefaction process exhibited the lowest acidification potential (−0.48 kg SO2 equivalent/t), demonstrating the best control over acidification potential among the four processes [32].

3.2. Sensitivity Analysis

To identify the variables that had the greatest impact on the results among the eight midpoint indicators in TC1 to TC4, a sensitivity analysis was conducted on the uncertainty of the LCA model inputs [27]. Figure 5 presents the results of the sensitivity analysis of the life cycle assessment (LCA) for four thermochemical conversion processes of antibiotic residues.
As shown in Figure 5, the most sensitive factors for the four processes were electricity, diesel transportation, chemical reagents, and water resource consumption. For the incineration process, the use of water resources significantly impacted the ecological toxicity potential (ETP) at 70.66%, highlighting the need to improve the efficiency of water recycling in the reaction system. Additionally, the electricity consumption of the incineration process accounted for 78.62% and 91.2% of the global warming potential (GWP) and resource depletion potential (ADP), respectively. This indicated that optimizing combustion efficiency and extending the incineration residence time were necessary improvement directions to reduce electricity consumption [33]. In the gasification process, the ETP for chemical reagents reached 151.2%, suggesting that strict control over the use of chemical reagents was needed to prevent waste leakage from adversely affecting the environment. Furthermore, electricity consumption had the highest values for GWP (175.15%) and ADP (172.94%) in the gasification process, indicating that enhancing process efficiency and improving equipment energy consumption would help reduce electricity usage [24]. For the pyrolysis process, the contribution of water use to ETP was 105.80%, necessitating strengthened wastewater management to prevent toxicity impacts on the ecosystem. Although the electricity consumption’s share in ADP was relatively high (105.36%), the GWP value was only 86.32%, indicating that the CO2 emissions during pyrolysis were lower compared to gasification [18]. In the hydrothermal liquefaction process, the impact of electricity consumption on GWP (367.36%) and ADP (315.98%) was significantly higher than that of the other three processes, suggesting that measures such as reducing reaction time were necessary to improve efficiency and lower electricity consumption [35]. Additionally, the recycling of water phase products during hydrothermal liquefaction had a substantial impact on land use, primarily due to the large area occupied by the water storage tanks, underscoring the need to enhance water recycling efficiency to minimize land occupation. Overall, electricity consumption emerged as the primary sensitive factor limiting the thermal chemical conversion of antibiotic residues. High electricity consumption, fossil fuel consumption for power generation, and diesel consumption during transportation were identified as key areas for future optimization. Reducing the energy consumption of thermal chemical conversion equipment and advancing the upgrading of the power generation industry would contribute to improving overall environmental benefits [20]. Furthermore, solar drying could reduce energy demand by 40–60% in sun-rich regions (e.g., Northwest China). Transitioning to photovoltaic-powered pyrolysis and electric transport vehicles may further lower emissions—these scenarios will be explored in future techno-economic analyses.

3.3. Normalized Results

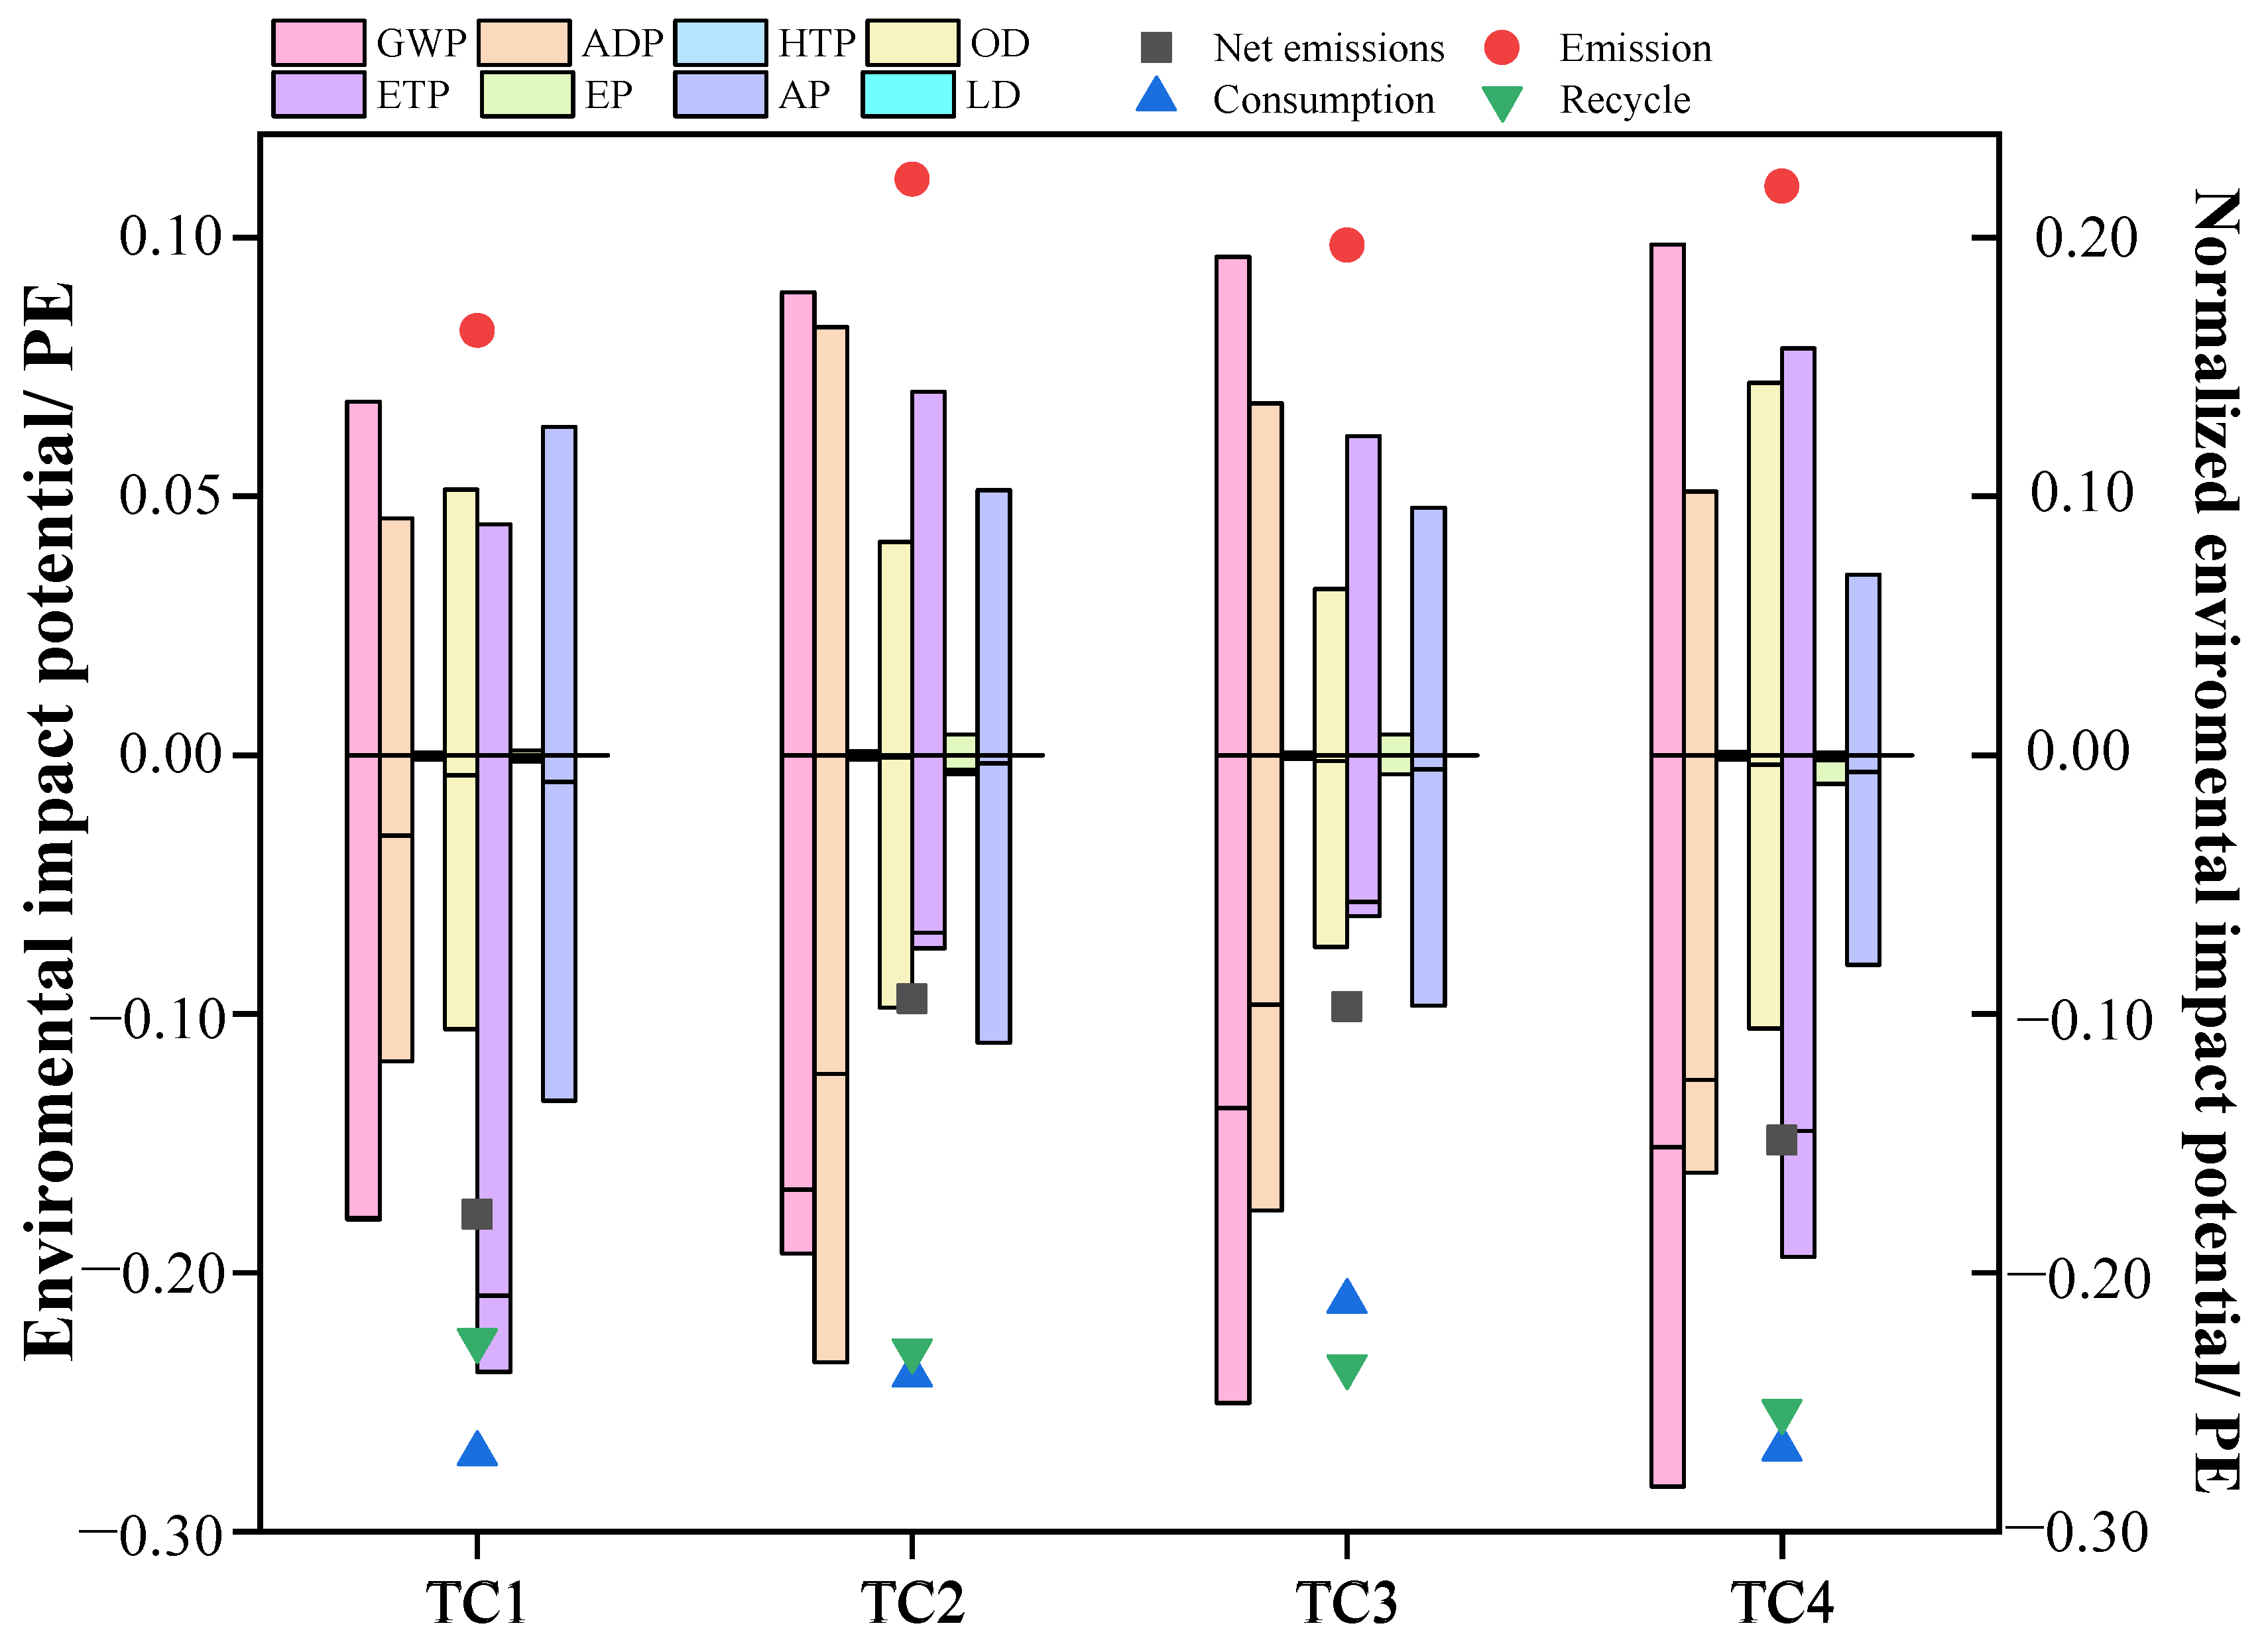
In Section 3.1, Section 3.2 and Section 3.3, it was evident that TC1 to TC4 each had their strengths among the eight midpoint indicators. In this section, normalization analysis was utilized to adjust the results of the eight midpoint indicators to a common scale, allowing for direct comparisons of different environmental impacts [21]. This study conducted a normalization analysis of four thermochemical conversion methods for antibiotic residue, allowing for a comparative assessment of eight intermediate indicators on the same scale. As shown in Figure 6, among the four thermochemical conversion processes, the global warming potential (GWP) had the greatest impact on the environment. This was because the thermochemical conversion of antibiotic residue aimed to safely dispose of hazardous waste while maximizing resource recovery and minimizing carbon emissions [8]. In terms of environmental impact, the depletion of fossil resources potential (ADP) and terrestrial ecotoxicity (ETP) ranked second and third, respectively, primarily due to the inherent environmental pollution factors of the antibiotic residue, as well as the consumption of fossil energy in the four processes while producing biomass energy. The ozone layer depletion potential (OD) and acidification potential (AP) ranked fourth and fifth, closely related to the nitrogen content of the antibiotic residue. Human toxicity potential (HTP), eutrophication potential (EP), and land use had relatively small contributions in the four thermochemical conversion processes. The normalization results indicated that all four thermochemical conversion processes had positive net environmental benefits, with hydrothermal liquefaction showing the best net environmental benefit. This was attributed to the simplicity of the hydrothermal liquefaction operation, where the aqueous products could be fully recycled with minimal external emissions of pollutants [3]. Additionally, hydrothermal liquefaction was the only process among the four that did not require dehydration pretreatment of the feedstock. However, hydrothermal liquefaction remained largely at the pilot testing stage with limited practical applications, primarily due to its low yield of bio-oil, necessitating further research into more efficient catalysts to enhance yield. It was hoped that LCA could identify potential impacts during the early stages of promoting hydrothermal liquefaction and provide opportunities for decision making and sustainability improvements. The incineration process ranked second in net environmental benefits, but the dehydration drying pretreatment before entering the incineration furnace was a direct cause of significant CO2 emissions. According to existing studies, incineration would still be the optimal thermochemical conversion disposal method in the future [17,18]. The net environmental benefits of gasification and pyrolysis processes ranked third and fourth, respectively, mainly due to the high moisture content of the antibiotic residue, which led to substantial fossil energy consumption in the initial dehydration drying phase. However, both processes had considerable practical applications due to their high yields of gaseous products and bio-oil, as well as mature catalytic processes [38]. Existing research indicated that finding more suitable dehydration methods was key to improving the net environmental benefits of gasification and pyrolysis processes, and focusing on more efficient catalytic methods [9] and superior thermal insulation performance of pyrolysis equipment would be important areas for future research.

4. Conclusions

In this study, the potential of four thermochemical conversion technologies—incineration, gasification, pyrolytic liquefaction, and hydrothermal liquefaction—was assessed for the resource recovery of antibiotic residue using a life cycle assessment (LCA) approach. The results indicated that hydrothermal liquefaction was the most theoretically desirable. However, the substantial electricity demand of hydrothermal liquefaction (8.2–12.6 kWh/kg dry residue) diminishes its practical viability under current energy infrastructure conditions, thermochemical conversion method at the time, with expectations for its transition from laboratory-scale to industrial applications as catalytic technologies advanced. The high-power energy consumption during the feedstock drying stage of gasification and pyrolysis was noted, and optimization of the drying feedstock technology was deemed necessary to enhance environmental benefits. Given the current technological maturity, incineration remained the dominant thermochemical conversion method for the foreseeable future due to its established technology. This study provided a foundation for decision-makers to select a thermochemical conversion technology for antibiotic residue and offered guidance for future research directions.

Supplementary Materials

The following supporting information can be downloaded at: https://www.mdpi.com/article/10.3390/pr13041139/s1, Table S1: Composition of Antibiotic Residue; Table S2: Life cycle system boundaries and life cycle inventory for the antibiotic residue incineration process [10,41,42,43,44]; Table S3: Life cycle system boundaries and life cycle gasification for the antibiotic residue gasification process [41,43,44,45,46,47,48]; Table S4: Life cycle system boundaries and life cycle pyrolysis for the antibiotic residue pyrolysis n process [44,49,50,51,52]; Table S5: Life cycle system boundaries and life cycle hydrothermal liquefaction for the antibiotic residue hydrothermal liquefaction process [44,53,54,55,56].

Author Contributions

J.Y.: conceptualization, methodology, software (Priya Singh). Y.W. (Yulian Wei): data curation, writing—original draft preparation; R.M.: visualization, investigation, supervision; H.M.: writing—reviewing and editing; B.D.: software. Y.W. (Ying Wang): validation. All authors have read and agreed to the published version of the manuscript.

Funding

This work was supported by the National Key R&D Program of China (2022YFE0105700), Project of Science and Technology Development (Grant NO. 2019GDASYL-0102005), and the Guangdong Foundation for Program of Science and Technology Research (Grant NO. 2023B1212060044).

Data Availability Statement

All relevant data are within the manuscript and its Additional files.

Conflicts of Interest

The authors declare that they have no known competing financial interests or personal relationships that could have appeared to influence the work reported in this paper.

Abbreviations

LCALife cycle assessment
GWPGlobal warming potential
ODPOzone depletion potential
APAcidification potential
EPEutrophication potential
HTPHuman toxicity potential
ETPEcotoxicity potential
ADPAbiotic depletion potential
FCFreshwater consumption
FEFreshwater ecotoxicity
TETerrestrial ecotoxicity

References

  1. Yang, J.; Ma, R.; Xing, Y.; Ma, H.Z.; Dong, B.Q.; Li, H.X.; Hong, C.; Xia, C. Study on the prepared bio-oil by catalytic hydrothermal liquefaction of antibiotic residues in ethanol-water reaction system with transition metal modified hzsm-5. Fuel 2023, 331, 125413. [Google Scholar] [CrossRef]
  2. Yang, W.Q.; Li, J.; Yao, Z.L.; Li, M. A review on the alternatives to antibiotics and the treatment of antibiotic pollution: Current development and future prospects. Sci. Total Environ. 2024, 926, 171757. [Google Scholar] [CrossRef] [PubMed]
  3. Yang, J.; Hong, C.; Li, Z.X.; Xing, Y.; Zhao, X.M. Study on hydrothermal liquefaction of antibiotic residues for bio-oil in ethanol-water system. Waste Manag. 2021, 120, 164–174. [Google Scholar] [CrossRef] [PubMed]
  4. Chen, J.; Ying, G.G.; Deng, W.J. Antibiotic residues in food: Extraction, analysis, and human health concerns. J. Agric. Food Chem. 2019, 67, 7569–7586. [Google Scholar] [CrossRef]
  5. Ben, Y.J.; Fu, C.X.; Hu, M.; Liu, L.; Wong, M.H.; Zheng, C.M. Human health risk assessment of antibiotic resistance associated with antibiotic residues in the environment: A review. Environ. Res. 2019, 169, 483–493. [Google Scholar] [CrossRef]
  6. Robles-Jimenez, L.E.; Aranda-Aguirre, E.; Castelan-Ortega, O.A.; Shettino-Bermudez, B.S.; Ortiz-Salinas, R.; Miranda, M.; Li, X.; Angeles-Hernandez, J.C.; Vargas-Bello-Pérez, E.; Gonzalez-Ronquillo, M. Worldwide traceability of antibiotic residues from livestock in wastewater and soil: A systematic review. Animals 2022, 12, 60. [Google Scholar] [CrossRef]
  7. Ohno, A.; Ano, T.; Shoda, M. Use of soybean curd residue, okara, for the solid state substrate in the production of a lipopeptide antibiotic, iturin A, by bacillus subtilis nb22. Process. Biochem. 1996, 31, 801–806. [Google Scholar] [CrossRef]
  8. Wei, W.W.; Liu, S.; Li, X.Y.; Li, L.H.; Cao, W. Thermodynamic and environmental analysis of self-thermal antibiotic residues supercritical water gasification system for hydrogen and power production. Process. Saf. Environ. Prot. 2023, 179, 168–179. [Google Scholar] [CrossRef]
  9. Li, Y.F.; Hong, C.; Wang, Y.J.; Xing, Y.; Chang, X.N.; Zheng, Z.X.; Li, Z.; Zhao, X. Nitrogen migration mechanism during pyrolysis of penicillin fermentation residue based on product characteristics and quantum chemical analysis. ACS Sustain. Chem. Eng. 2020, 8, 7721–7740. [Google Scholar] [CrossRef]
  10. Zheng, Q.Y.; Zhu, Z.H.; Guo, Y.Y.; Jiang, X.P.; Xing, X.; Chen, W.B.; Zhao, Y.C.; Zhu, Y.; Zhou, T.; Xu, B. Highly collaborative of wasted activated sludge deconstruction and incineration gas utilization in the presence of nitrogen oxides. J. Clean. Prod. 2025, 493, 144927. [Google Scholar] [CrossRef]
  11. Umemoto, S.; Kajitani, S.; Hara, S. Modeling of coal char gasification in coexistence of CO2 and H2O considering sharing of active sites. Fuel 2013, 103, 14–21. [Google Scholar] [CrossRef]
  12. Rahman, M.M.; Oni, A.O.; Gemechu, E.; Kumar, A. Assessment of energy storage technologies: A review. Energy Convers. Manag. 2020, 223, 113295. [Google Scholar] [CrossRef]
  13. Riek, R.F. Studies on reactions of animals to infestation with ticks. 6. Resistance of cattle to infestation with tick boophilus microplus (canestrini). Aust. J. Agric. Res. 1962, 13, 532. [Google Scholar] [CrossRef]
  14. Hoogmartens, R.; Van Passel, S.; Van Acker, K.; Dubois, M. Bridging the gap between LCA, LCC and CBA as sustainability assessment tools. Environ. Impact Assess. Rev. 2014, 48, 27–33. [Google Scholar] [CrossRef]
  15. Han, Y.L.; Yang, Z.H.; Ding, T.; Xiao, J.Z. Environmental and economic assessment on 3d printed buildings with recycled concrete. J. Clean. Prod. 2021, 278, 123884. [Google Scholar] [CrossRef]
  16. Ludin, N.A.; Mustafa, N.I.; Hanafiah, M.M.; Ibrahim, M.A.; Teridi, M.; Sepeai, S.; Zaharim, A.; Sopian, K. Prospects of life cycle assessment of renewable energy from solar photovoltaic technologies: A review. Renew. Sustain. Energy Rev. 2018, 96, 11–28. [Google Scholar] [CrossRef]
  17. Spierling, S.; Knüpffer, E.; Behnsen, H.; Mudersbach, M.; Krieg, H.; Springer, S.; Albrecht, S.; Herrmann, C.; Endres, H.-J. Bio-based plastics—A review of environmental, social and economic impact assessments. J. Clean. Prod. 2018, 185, 476–491. [Google Scholar] [CrossRef]
  18. Usmani, Z.; Sharma, M.; Awasthi, A.K.; Sivakumar, N.; Lukk, T.; Pecoraro, L.; Thakur, V.K.; Roberts, D.; Newbold, J.; Gupta, V.K. Bioprocessing of waste biomass for sustainable product development and minimizing environmental impact. Bioresour. Technol. 2021, 322, 124548. [Google Scholar] [CrossRef]
  19. Huang, J.S.; Wang, J.Q.; Huang, Z.C.; Liu, T.Y.; Li, H. Photothermal technique-enabled ambient production of microalgae biodiesel: Mechanism and life cycle assessment. Bioresour. Technol. 2023, 369, 128390. [Google Scholar] [CrossRef]
  20. Arias, A.; Nika, C.E.; Feijoo, G.; Moreira, M.T.; Katsou, E. Sustainability and circularity assessment of the potential of a biofuel produced from black liquor as a substitute for conventional fuels. Chem. Eng. J. 2024, 498, 155335. [Google Scholar] [CrossRef]
  21. Ma, H.Z.; Wei, Y.L.; Fei, F.; Gao, M.; Wang, Q.H. Whether biorefinery is a promising way to support waste source separation? From the life cycle perspective. Sci. Total Environ. 2024, 912, 168731. [Google Scholar] [CrossRef] [PubMed]
  22. Liao, Y.H.; Koelewijn, S.F.; Van den Bossche, G.; Van Aelst, J.; Van den Bosch, S.; Renders, T.; Navare, K.; Nicolaï, T.; Van Aelst, K.; Maesen, M.; et al. A sustainable wood biorefinery for low-carbon footprint chemicals production. Science 2020, 367, 1385. [Google Scholar] [CrossRef] [PubMed]
  23. Edwards, J.; Burn, S.; Crossin, E.; Othman, M. Life cycle costing of municipal food waste management systems: The effect of environmental externalities and transfer costs using local government case studies. Resour. Conserv. Recycl. 2018, 138, 118–129. [Google Scholar] [CrossRef]
  24. Astrup, T.F.; Tonini, D.; Turconi, R.; Boldrin, A. Life cycle assessment of thermal waste-to-energy technologies: Review and recommendations. Waste Manag. 2015, 37, 104–115. [Google Scholar] [CrossRef]
  25. Chan, F.L.; Tanksale, A. Review of recent developments in ni-based catalysts for biomass gasification. Renew. Sustain. Energy Rev. 2014, 38, 428–438. [Google Scholar] [CrossRef]
  26. Xue, Y.; Zhou, S.; Brown, R.C.; Kelkar, A.; Bai, X.L. Fast pyrolysis of biomass and waste plastic in a fluidized bed reactor. Fuel 2015, 156, 40–46. [Google Scholar] [CrossRef]
  27. Tian, C.Y.; Li, B.M.; Liu, Z.D.; Zhang, Y.H.; Lu, H.F. Hydrothermal liquefaction for algal biorefinery: A critical review. Renew. Sustain. Energy Rev. 2014, 38, 933–950. [Google Scholar] [CrossRef]
  28. Heidenreich, S.; Foscolo, P.U. New concepts in biomass gasification. Prog. Energy Combust. Sci. 2015, 46, 72–95. [Google Scholar] [CrossRef]
  29. Kan, T.; Strezov, V.; Evans, T.J. Lignocellulosic biomass pyrolysis: A review of product properties and effects of pyrolysis parameters. Renew. Sustain. Energy Rev. 2016, 57, 1126–1140. [Google Scholar] [CrossRef]
  30. Gai, C.; Zhang, Y.H.; Chen, W.T.; Zhang, P.; Dong, Y.P. An investigation of reaction pathways of hydrothermal liquefaction using chlorella pyrenoidosa and spirulina platensis. Energy Convers. Manag. 2015, 96, 330–339. [Google Scholar] [CrossRef]
  31. Hu, Q.; Shen, Y.; Chew, J.W.; Ge, T.S.; Wang, C.H. Chemical looping gasification of biomass with Fe2O3/Cao as the oxygen carrier for hydrogen-enriched syngas production. Chem. Eng. J. 2020, 379, 122346. [Google Scholar] [CrossRef]
  32. Cabeza, L.F.; Rincón, L.; Vilariño, V.; Pérez, G.; Castell, A. Life cycle assessment (LCA) and life cycle energy analysis (LCEA) of buildings and the building sector: A review. Renew. Sustain. Energy Rev. 2014, 29, 394–416. [Google Scholar] [CrossRef]
  33. Molino, A.; Chianese, S.; Musmarra, D. Biomass gasification technology: The state of the art overview. J. Energy Chem. 2016, 25, 10–25. [Google Scholar] [CrossRef]
  34. Guo, Y.; Yeh, T.; Song, W.H.; Xu, D.H.; Wang, S.Z. A review of bio-oil production from hydrothermal liquefaction of algae. Renew. Sustain. Energy Rev. 2015, 48, 776–790. [Google Scholar] [CrossRef]
  35. Ma, W.C.; Wenga, T.; Frandsen, F.J.; Yan, B.B.; Chen, G.Y. The fate of chlorine during MSW incineration: Vaporization, transformation, deposition, corrosion and remedies. Prog. Energy Combust. Sci. 2020, 76, 100789. [Google Scholar] [CrossRef]
  36. Wang, Y.; Akbarzadeh, A.; Chong, L.; Du, J.Y.; Tahir, N.; Awasthi, M.K. Catalytic pyrolysis of lignocellulosic biomass for bio-oil production: A review. Chemosphere 2022, 297, 134181. [Google Scholar] [CrossRef]
  37. Ghimpeteanu, O.M.; Pogurschi, E.N.; Popa, D.C.; Dragomir, N.; Dragotoiu, T.; Mihai, O.D.; Petcu, C.D. Antibiotic use in livestock and residues in food-a public health threat: A review. Foods 2022, 11, 1430. [Google Scholar] [CrossRef]
  38. Xue, Y.; Liu, X.M. Detoxification, solidification and recycling of municipal solid waste incineration fly ash: A review. Chem. Eng. J. 2021, 420, 130349. [Google Scholar] [CrossRef]
  39. Li, J.; Xiao, F.P.; Zhang, L.F.; Amirkhanian, S.N. Life cycle assessment and life cycle cost analysis of recycled solid waste materials in highway pavement: A review. J. Clean. Prod. 2019, 233, 1182–1206. [Google Scholar] [CrossRef]
  40. Quinn, J.C.; Davis, R. The potentials and challenges of algae based biofuels: A review of the techno-economic, life cycle, and resource assessment modeling. Bioresour. Technol. 2015, 184, 444–452. [Google Scholar] [CrossRef]
  41. Chang, H.; Yuan, J.; Zhao, Y.; Bisinella, V.; Damgaard, A.; Christensen, T.H. Carbon footprints of incineration, pyrolysis, and gasification for sewage sludge treatment. Resour. Conserv. Recycl. 2025, 212, 107939. [Google Scholar] [CrossRef]
  42. Wang, Z.; Liu, H.; Zhu, X.; Zhou, S.; Zhang, X.; Li, J.; Yan, B.; Chen, G. Comparative analysis of microwave wet torrefaction and anaerobic digestion for energy recovery from antibiotic mycelial residue. Fuel 2024, 357, 129776. [Google Scholar] [CrossRef]
  43. Mayer, F.; Bhandari, R.; Gäth, S.A. Life cycle assessment on the treatment of organic waste streams by anaerobic digestion, hydrothermal carbonization and incineration. Waste Manag. 2021, 130, 93–106. [Google Scholar] [CrossRef] [PubMed]
  44. Chen, W.; Geng, Y.; Hong, J.; Kua, H.W.; Xu, C.; Yu, N. Life cycle assessment of antibiotic mycelial residues management in China. Renew. Sustain. Energy Rev. 2017, 79, 830–838. [Google Scholar] [CrossRef]
  45. Haque, A.; Rogerson, L.; Nath, N.D.; Haruna, S.; Ahn, J.; Johnston, T.V.; Lin, C.S.K.; Chong, L.; Na, L.; Jang, M.J.; et al. Sustainable management and valorization of antibiotic waste. Chem. Eng. J. 2024, 498, 155372. [Google Scholar] [CrossRef]
  46. Paudel, P.P.; Kafle, S.; Park, S.; Kim, S.J.; Cho, L.; Kim, D.H. Advancements in sustainable thermochemical conversion of agricultural crop residues: A systematic review of technical progress, applications, perspectives, and challenges. Renew. Sustain. Energy Rev. 2024, 202, 114723. [Google Scholar] [CrossRef]
  47. Cormos, C.-C.; Dragan, M.; Petrescu, L.; Cormos, A.-M.; Dragan, S.; Bathori, A.-M.; Galusnyak, S.-C. Synthetic natural gas (SNG) production by biomass gasification with CO2 capture: Techno-economic and life cycle analysis (LCA). Energy 2024, 312, 133507. [Google Scholar] [CrossRef]
  48. Nkuna, S.G.; Olwal, T.O.; Chowdhury, S.P.D.; Ndambuki, J.M. A review of wastewater sludge-to-energy generation focused on thermochemical technologies: An improved technological, economical and socio-environmental aspect. Clean. Waste Syst. 2024, 7, 100130. [Google Scholar] [CrossRef]
  49. Poornima, S.; Manikandan, S.; Prakash, R.; Deena, S.R.; Subbaiya, R.; Karmegam, N.; Kim, W.; Govarthanan, M. Biofuel and biochemical production through biomass transformation using advanced thermochemical and biochemical processes—A review. Fuel 2024, 372, 132204. [Google Scholar] [CrossRef]
  50. Sapkota, B.; Pariatamby, A. Pharmaceutical waste management system–Are the current techniques sustainable, eco-friendly and circular? A review. Waste Manag. 2023, 168, 83–97. [Google Scholar] [CrossRef]
  51. Andooz, A.; Eqbalpour, M.; Kowsari, E.; Ramakrishna, S.; Cheshmeh, Z.A. A comprehensive review on pyrolysis from the circular economy point of view and its environmental and social effects. J. Clean. Prod. 2023, 388, 136021. [Google Scholar] [CrossRef]
  52. Wang, Z.; Hong, C.; Xing, Y.; Li, Z.; Li, Y.; Yang, J.; Feng, L.; Hu, J.; Sun, H. Thermal characteristics and product formation mechanism during pyrolysis of penicillin fermentation residue. Bioresour. Technol. 2019, 277, 46–54. [Google Scholar] [CrossRef] [PubMed]
  53. Mazzanti, G.; Demichelis, F.; Fino, D.; Tommasi, T. A closed-loop valorization of the waste biomass through two-stage anaerobic digestion and digestate exploitation. Renew. Sustain. Energy Rev. 2025, 207, 114938. [Google Scholar] [CrossRef]
  54. Dutta, S.; Kataki, S.; Banerjee, I.; Pohrmen, C.B.; Jaiswal, K.K.; Jaiswal, A.K. Microalgal biorefineries in sustainable biofuel production and other high-value products. New Biotechnol. 2025, 87, 39–59. [Google Scholar] [CrossRef]
  55. Mazhkoo, S.; Soltanian, S.; Odebiyi, H.O.; Norouzi, O.; Ubene, M.; Hayder, A.; Pourali, O.; Santos, R.M.; Brown, R.C.; Dutta, A. Process intensification in hydrothermal liquefaction of biomass: A review. J. Environ. Chem. Eng. 2025, 13, 115722. [Google Scholar] [CrossRef]
  56. Alsaeedi, S.; Yan, B.; Wang, Z.; Chen, G.; Song, Y.; Al-Hakeem, B. Current utilization technologies and products of antibiotic fermentation residues: A review. J. Environ. Chem. Eng. 2025, 13, 116182. [Google Scholar] [CrossRef]
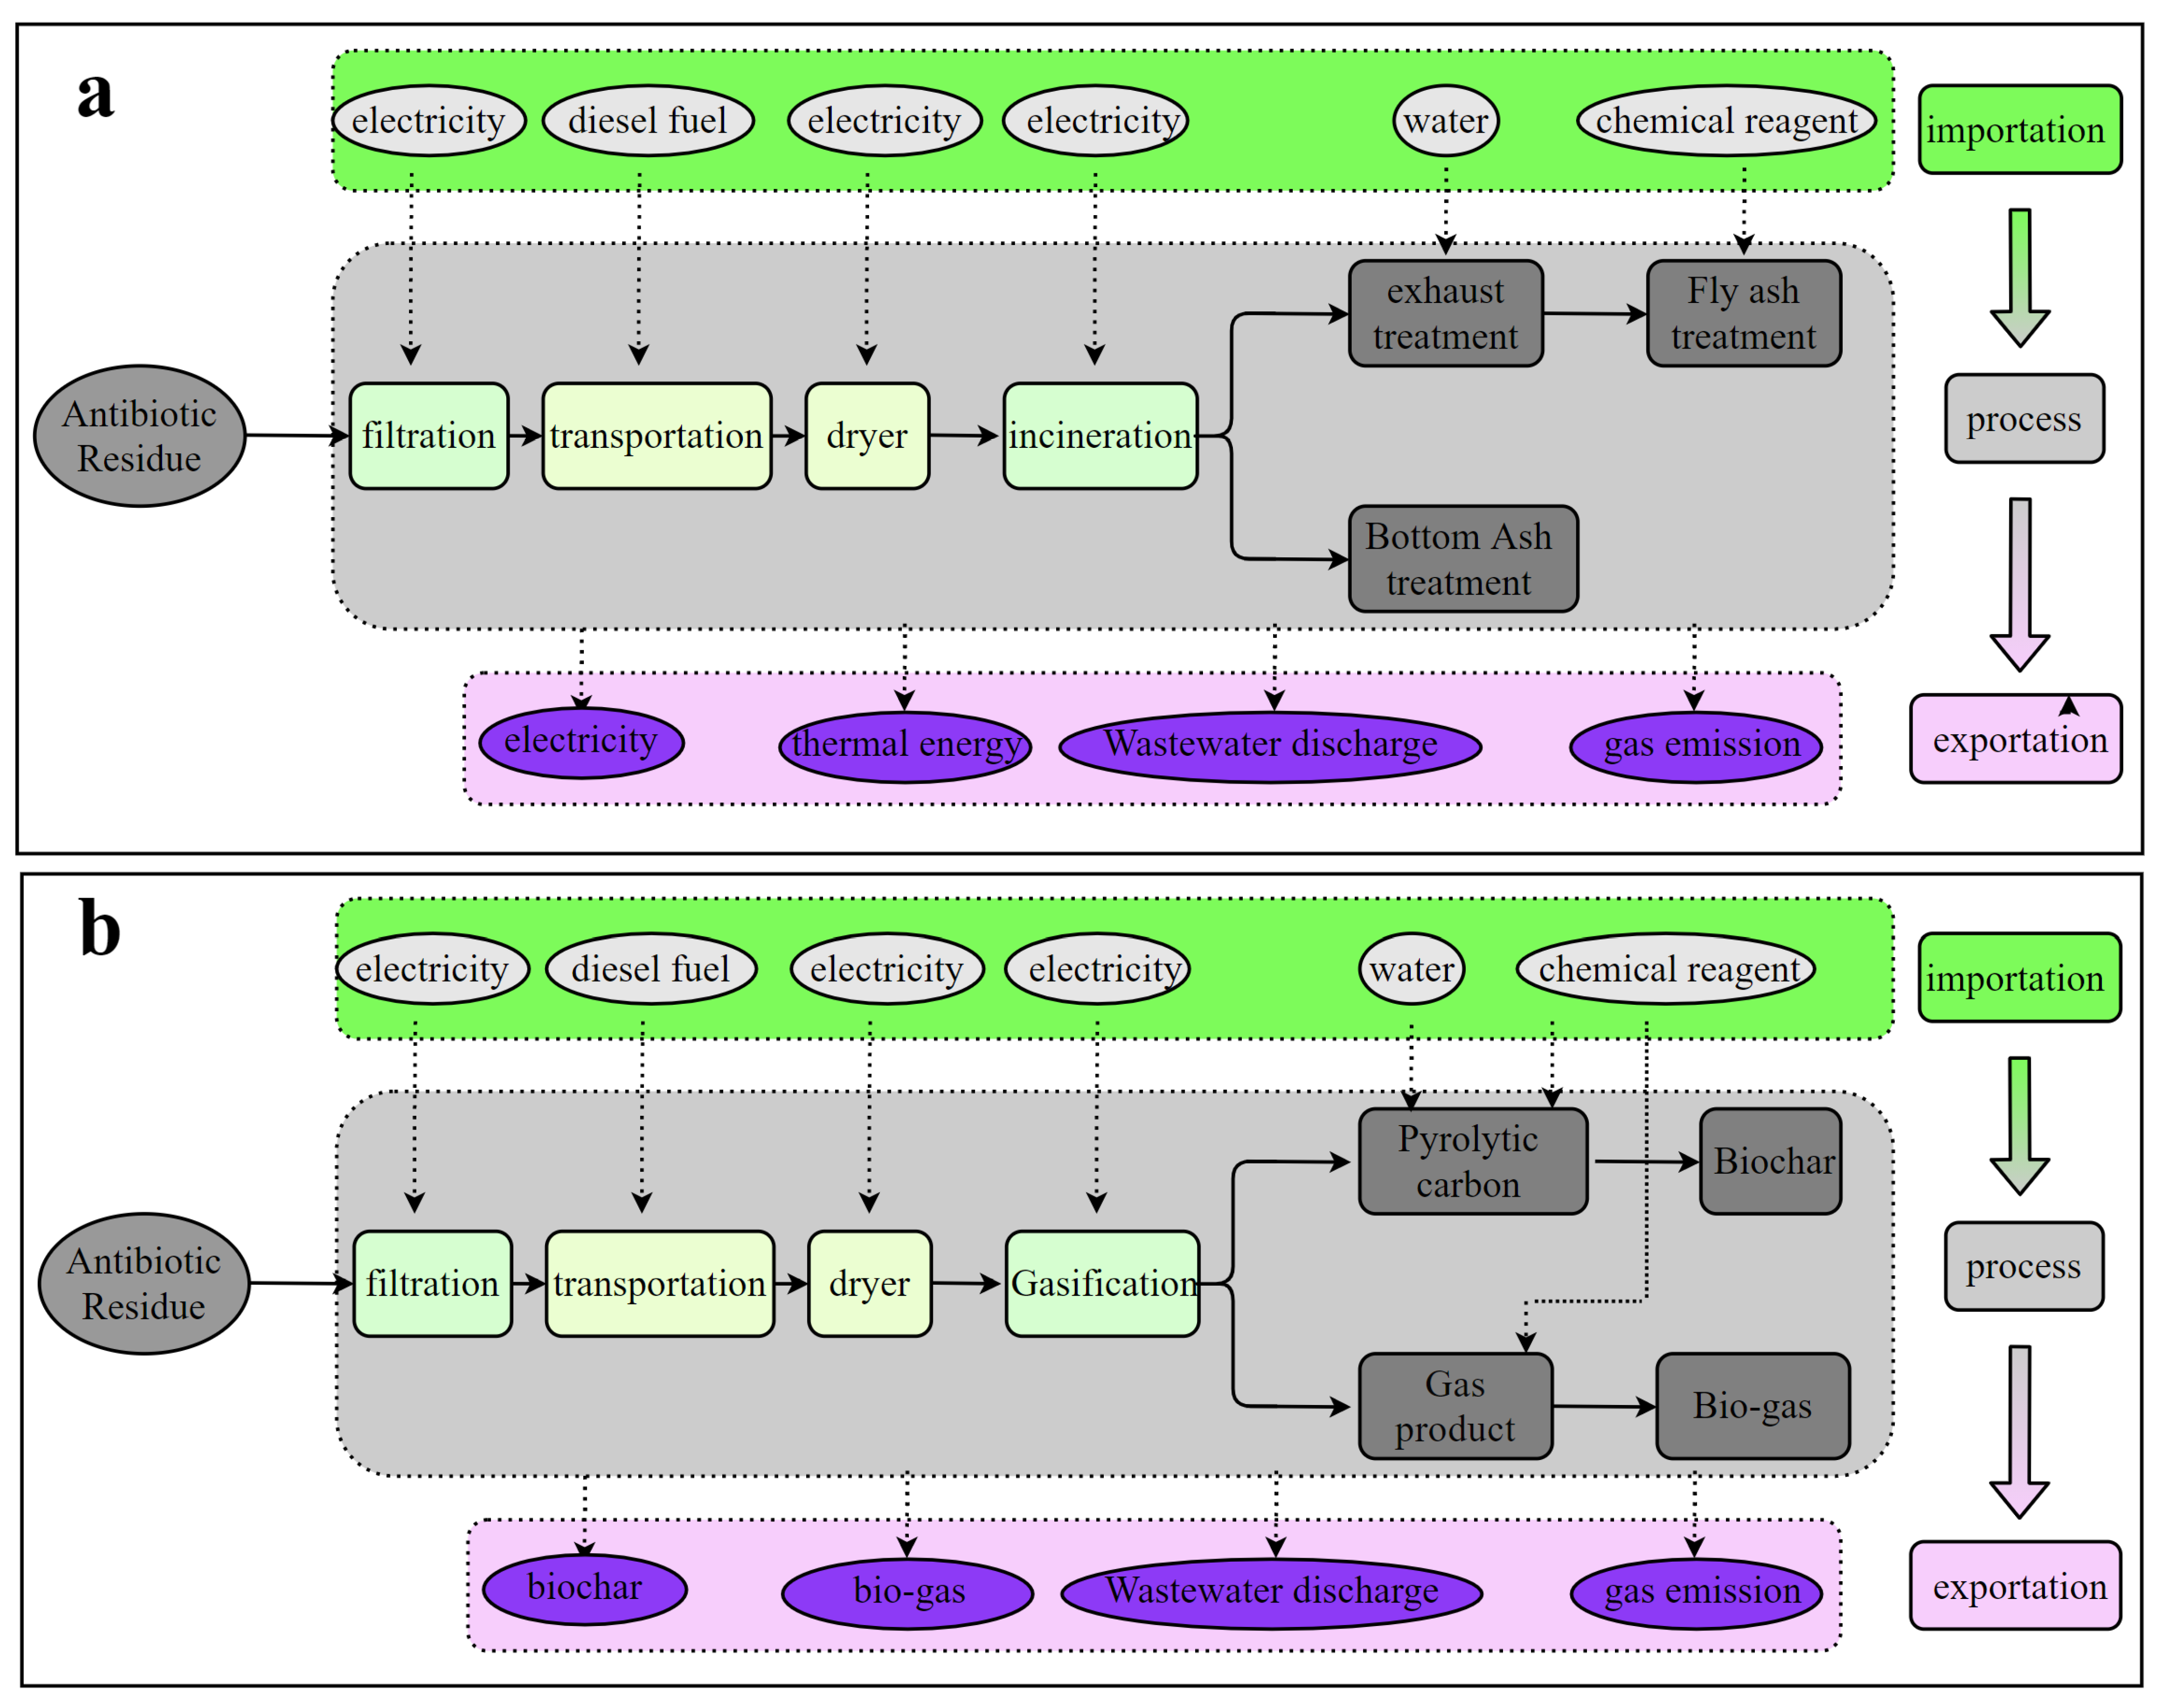
Figure 1. System boundary of LCA of four thermochemical transformations ((a) TC1, (b) TC2, (c) TC3, (d) TC4).
Processes 13 01139 g001aProcesses 13 01139 g001b
Figure 2. Comparison between each type of highest indicator under analysis.
Processes 13 01139 g002
Figure 3. Characterization results of GWP, land use, ADP, and EP of TC1–TC4.
Processes 13 01139 g003aProcesses 13 01139 g003b
Figure 4. Characterization results of HTP, ETP, AP, and OD of TC1–TC4.
Processes 13 01139 g004
Figure 5. Sensitivity analysis of LCA results for the four thermochemical conversion of antibiotic.
Processes 13 01139 g005
Figure 6. The normalization results of TC1–TC4.
Processes 13 01139 g006
Disclaimer/Publisher’s Note: The statements, opinions and data contained in all publications are solely those of the individual author(s) and contributor(s) and not of MDPI and/or the editor(s). MDPI and/or the editor(s) disclaim responsibility for any injury to people or property resulting from any ideas, methods, instructions or products referred to in the content.