Article

Analysis of Enhanced Geothermal System Reservoir Parameters and Fractures on Heat Recovery Efficiency Based on a Single-Phase Conduction Model

Hubei Provincial Key Laboratory of Oil and Gas Drilling Engineering, Yangtze University, Wuhan 430100, China
*
Author to whom correspondence should be addressed.
Processes 2025, 13(4), 1135; https://doi.org/10.3390/pr13041135
Submission received: 20 February 2025 / Revised: 24 March 2025 / Accepted: 8 April 2025 / Published: 9 April 2025
(This article belongs to the Special Issue Advances in Oil and Gas Reservoir Modeling and Simulation)

Abstract

:
Geothermal energy has the advantages of being green, stable, abundant, and renewable. The thermal energy extraction efficiency of an enhanced geothermal system (EGS) is significantly regulated by Thermo–Hydraulic (TH) processes. To accurately evaluate the long-term heat recovery performance of an EGS, the dynamic influence mechanisms under multi-field TH coupling effects must be considered comprehensively. Therefore, in this study, based on the local thermal equilibrium theory, a temperature–seepage coupling model is established using the COMSOL software. The influences of reservoir parameters and fractures on the geothermal energy mining effect are studied, and the distribution law of temperature and pressure in the thermal reservoir is analyzed. The research results provide a reference for EGS reservoir reconstruction and heat recovery efficiency optimization. It is shown that the temperature difference near the injection–production well in the early stage of development leads to the slow recovery of thermal reservoir pressure. When the matrix permeability is greater than 455 mD, the temperature of the production fluid drops too quickly, and the development life of the thermal reservoir is short. The matrix porosity has little effect on the development of thermal reservoirs. When the porosity increases from 0.05 to 0.3, after 40 years of production, the mass flow rate of the produced fluid increases by 3.08%, the temperature of the produced fluid increases by 2.14%, and the heat recovery rate increases by 7.04%. The number of fractures has a significant influence on the development of thermal reservoirs. When the number of fractures increases from 0 to 3, the mass flow rate of production fluid increases by 55.9%, the thermal breakthrough is rapid, and the development life of the thermal reservoir is shortened. Notably, the unreasonable use of cracks will hinder the outward spread of the injected fluid.

1. Introduction

Deep geothermal resources have many advantages, such as abundant resources, no pollution emissions, high safety, continuous and stable thermal energy, good utilization efficiency, and low power generation cost [1]. In this context, the Enhanced Geothermal System (EGS) has attracted extensive attention as a key technology for deep geothermal resource exploitation. Niyazi Aksoy [2], Russo S. L. [3], and other researchers have combined theoretical analyses with field experiments to explore the influence of different groundwater pumping and injection patterns on the thermal breakthrough of aquifers. Freedman V. L. [4] established a coupled model of groundwater seepage and heat transfer to analyze the impact of geothermal utilization on the thermal environment of geothermal reservoirs. Yujin Nam [5] analyzed water migration and heat transfer processes in geothermal reservoirs through numerical simulation methods. Xu [6] proposed a simplified method to simulate the hydrothermal coupling system of an EGS and made detailed predictions of fluid flow and heat transfer in geothermal reservoirs based on an equivalent pipe network model. Haizhen Zhai [7] constructed a parallel multi-fracture geothermal reservoir model using the Fluent software to simulate the heat extraction process, taking into account the thermal compensation effect of surrounding rocks on the geothermal reservoir based on measurement data obtained from the Desert Peak Geothermal Field in the United States. Liang Luo [8] analyzed the influence of geothermal reservoir fractures on heat extraction by establishing a fractal bifurcation network model and obtained a formula for the relationship affecting the heat extraction rate. Dandan Shan [9] established a single-fracture geothermal reservoir model using the COMSOL software to achieve the solution of heat–flow coupling and explored the factors influencing the operational efficiency of the enhanced geothermal system. Hongwu Lei [10] established a geothermal reservoir model using the TOUGH2 software based on the deep geological parameters obtained from the Songliao Basin to carry out numerical simulation research and analyze the influence of burial depth on geothermal energy exploitation. AbuAisha [11] explored the influences of injection and production rates on the operating life of geothermal systems through the establishment of a numerical model of a temperature two-phase medium. Bujakowski [12] evaluated the heat extraction of specific strata in central Poland using the TOUGH2 numerical simulation software. Jian Hu [13] established a single-fracture conceptual model to evaluate the influence of fracture parameters on the temperature evolution of granite geothermal reservoirs and the temperature of produced fluids. Biguang Chen [14] used numerical methods to study the early thermal breakthrough and long-tail effect of geothermal systems and analyzed the roles of different matrix permeabilities and thermal conductivities in the development of geothermal reservoirs. Zhanqing Qu [15] regarded the geothermal reservoir as a dual-porosity medium structure and established a fully coupled thermo-hydro (TH) model. Peng Xiao [16] established a three-dimensional parallel multi-fracture model for horizontal wells in the enhanced geothermal system and analyzed the operating performance of the system under different water injection flow rate conditions.
Haitao Wang et al. [17] used the COMSOL software to simulate the thermal extraction performance of an EGS reservoir over 40 years, analyzing the influence of six factors—thermal conductivity, matrix permeability, fracture width, injection temperature, injection flow rate, and number of wells—on reservoir heat recovery. It was found that matrix permeability and injection flow rate were the main control factors, while the influence of fracture number on reservoir heat recovery was not considered in this model. Zhang J. et al. [18] studied the influences of injection temperature, injection–production well spacing, and injection–production well pattern on the heat recovery rate and found that when the injection temperature increased from 293.15 K to 323.15 K, the output temperature increased from 340.04 K to 354.21 K, the injection–production well spacing increased from 210 m to 325 m, and the heat extraction rate increased from 41.9% to 56.4%. Again, this study did not consider the influence of cracks in the well group on the heat recovery rate. Yu G. et al. [19] studied the influence of reservoir volume permeability, fracture spacing, fracture aperture, injection flow, and other key parameters on the thermal recovery performance of an exchange fracture-enhanced geothermal system. It was found that when the fracture thermal conductivity increased from 2 W/(m·K) to 20 W/(m·K), the heat production power increased by 53%. In this study, the effect of matrix-specific heat capacity on heat production power was not considered. Liu S. et al. [20] proposed an enhanced closed-loop system (ECLGS) to improve heat extraction efficiency using high thermal conductivity cracks. It was found that when the thermal conductivity of cracks increased from 2 W/m·K to 20 W/m·K, the heat production power increased by 53%. Liu S. et al. [21] proposed an advanced closed-loop geothermal system (ACGS) based on the ECLGS to study the effects of fracture size, structure, and fluid heat capacity. It was found that the wing fracture increased the cumulative heat production by 162.94% over 20 years. Yao J. et al. [22] established a three-dimensional THM coupling model to analyze the distributions of pressure, temperature, stress, and deformation in geothermal reservoirs. It was found that, under the appropriate reservoir and operating parameters, the heat production time, heat production, and power generation can meet commercial standards; however, energy efficiency and total heat recovery rate remained at a low level. Cai X. et al. [23] studied the effect of a double fracture layout on heat extraction in low permeability reservoirs and found that when the spacing of parallel fractures was 100 m, the heat extraction efficiency was the highest. Suo Y. et al. [24] analyzed the influence of the number, length, and direction of cracks on the heat extraction of EGS. When the number of cracks increased from 0 to 400, the production temperature reduced from 450 K to 415 K, while the heat production increased. Song X. et al. [25] proposed a new type of multi-well enhanced geothermal system, analyzed the temperature field and velocity field of multi-well EGS, and compared the heat recovery performance of four different well types. It was found that, compared with conventional double vertical well EGS, the output heat power, production temperature, heat extraction rate, and cumulative heat energy of the multi-well EGS were higher. Chen Z. et al. [26] established a multi-fracture model of a mine reservoir to reveal the mechanical response of the reservoir and the evolution law of thermal recovery performance under the action of thermal–hydraulic–mechanical coupling. It was found that the variation range of reservoir thermal stress and pore pressure was directly related to the distribution of the multiple fractures, where the effect on thermal stress was less than that on the pore pressure.
While many achievements have been made regarding the numerical simulation of TH coupling processes in fractured rock masses, it is still a challenge to accurately estimate the heat extraction process of EGSs, and further theoretical research and numerical simulation work are needed. To date, the existing literature has focused on the influence of reservoir physical parameters such as reservoir permeability, porosity, and thermal conductivity on heat recovery, ignoring the influence of fracture parameters (e.g., fracture number) on reservoir heat recovery. The innovation of this study is that, through constructing a TH coupling model and fully considering changes in the physical parameters of the working medium with temperature, the influences of thermal reservoir parameters (i.e., matrix permeability, matrix porosity, matrix thermal conductivity, matrix atmospheric heat capacity) and cracks in thermal reservoirs (including the presence and number of cracks) on the geothermal energy development effect could be systematically studied. In this study, the reservoir is assumed to be homogeneous, isotropic, and continuous porous media.

2. Brief Description of the TH Coupling Model

2.1. Model Assumptions

To investigate TH coupling during the operation of an Enhanced Geothermal System (EGS), it is essential to establish the governing equations and mathematical models for TH coupling. Given the complexity of multi-physics coupling in EGS operations, introducing some reasonable assumptions is advantageous. For the establishment of models, the following basic assumptions were considered:
  • The reservoir fractured rock mass is a uniform, isotropic, and continuous porous medium [27].
  • Due to the action of high pressure, the heat recovery fluid is in a saturated state underground with no phase change (i.e., it is a single-phase flow).
  • We ignore the chemical reactions between the fluid and the reservoir rock and the stress movement inside the reservoir during heat exchange.
  • We ignore the effects of gravity and capillary forces on the seepage of fluids in porous media.
  • In the process of heat transfer in the reservoir rock mass, only the heat conduction and heat convection modes are considered.
  • The fracture surface of the reservoir and the injection (production) wellbore in the thermal reservoir are regarded as porous media.
  • When heat compensation is ignored, the contact surface between the surrounding rock and the heat storage is set as an adiabatic boundary. When heat compensation is taken into account, the interface between the surrounding rock and the heat reservoir is set as an open boundary.

2.2. EGS Heat Storage Heat and Mass Transfer Model

The governing equation for the bedrock temperature field is Equation (1),which can be find in Ref. [28]
c r T r t + ( λ r T r ) + c w ( K r μ p ) T r = 0
where cr is the specific heat capacity of the bedrock, J/(kg·K); λr is the thermal conductivity of the bedrock, W/(m·K); cw is the specific heat capacity of water, J/(kg·K); and Tr is the temperature of the bedrock, K.
The governing equation of the bedrock seepage field is Equation (2)
t ( ε r ρ l ) + ( ρ l u ) = Q m
The seepage in the reservoir satisfies Darcy’s law Equation (3):
u = K r μ p
where εr is the bedrock porosity; ρ l is the density of the rock, kg/m3; Qm is the source–sink term of seepage, kg/(m3·s); and Kr is the permeability of the bedrock, m2.
The governing equation of the seepage field at the fracture surface is Equations (4)–(6)
t ( ρ w ε l ) + T ( ρ w u w ) = Q l
u w = K l μ T p
Q l = K l μ p n
where ρ w is the density of water, kg/m3; ε l is the porosity of the fracture; Ql is the flow exchange between the fracture surface and the bedrock, m2/s; Kl is the permeability of the fracture surface, mD; and μ is the dynamic viscosity of water, pa·s.
The governing equation of the fracture temperature field is Equations (7)–(9):
d l ρ w c w T l t + d l ρ w c w u l T T l d l T ( λ w T T l ) = W l
u l = K l μ T p
W l = h ( T r T l )
where dl is the fracture width, m; Tl is the temperature of the water on the fracture surface, K; λ w is the thermal conductivity of water, W/(m·K); Wl is the heat absorbed by the fracture surface water from the bedrock, W/m2; and h is the convective heat transfer coefficient between fracture water and bedrock, W/(m·K).

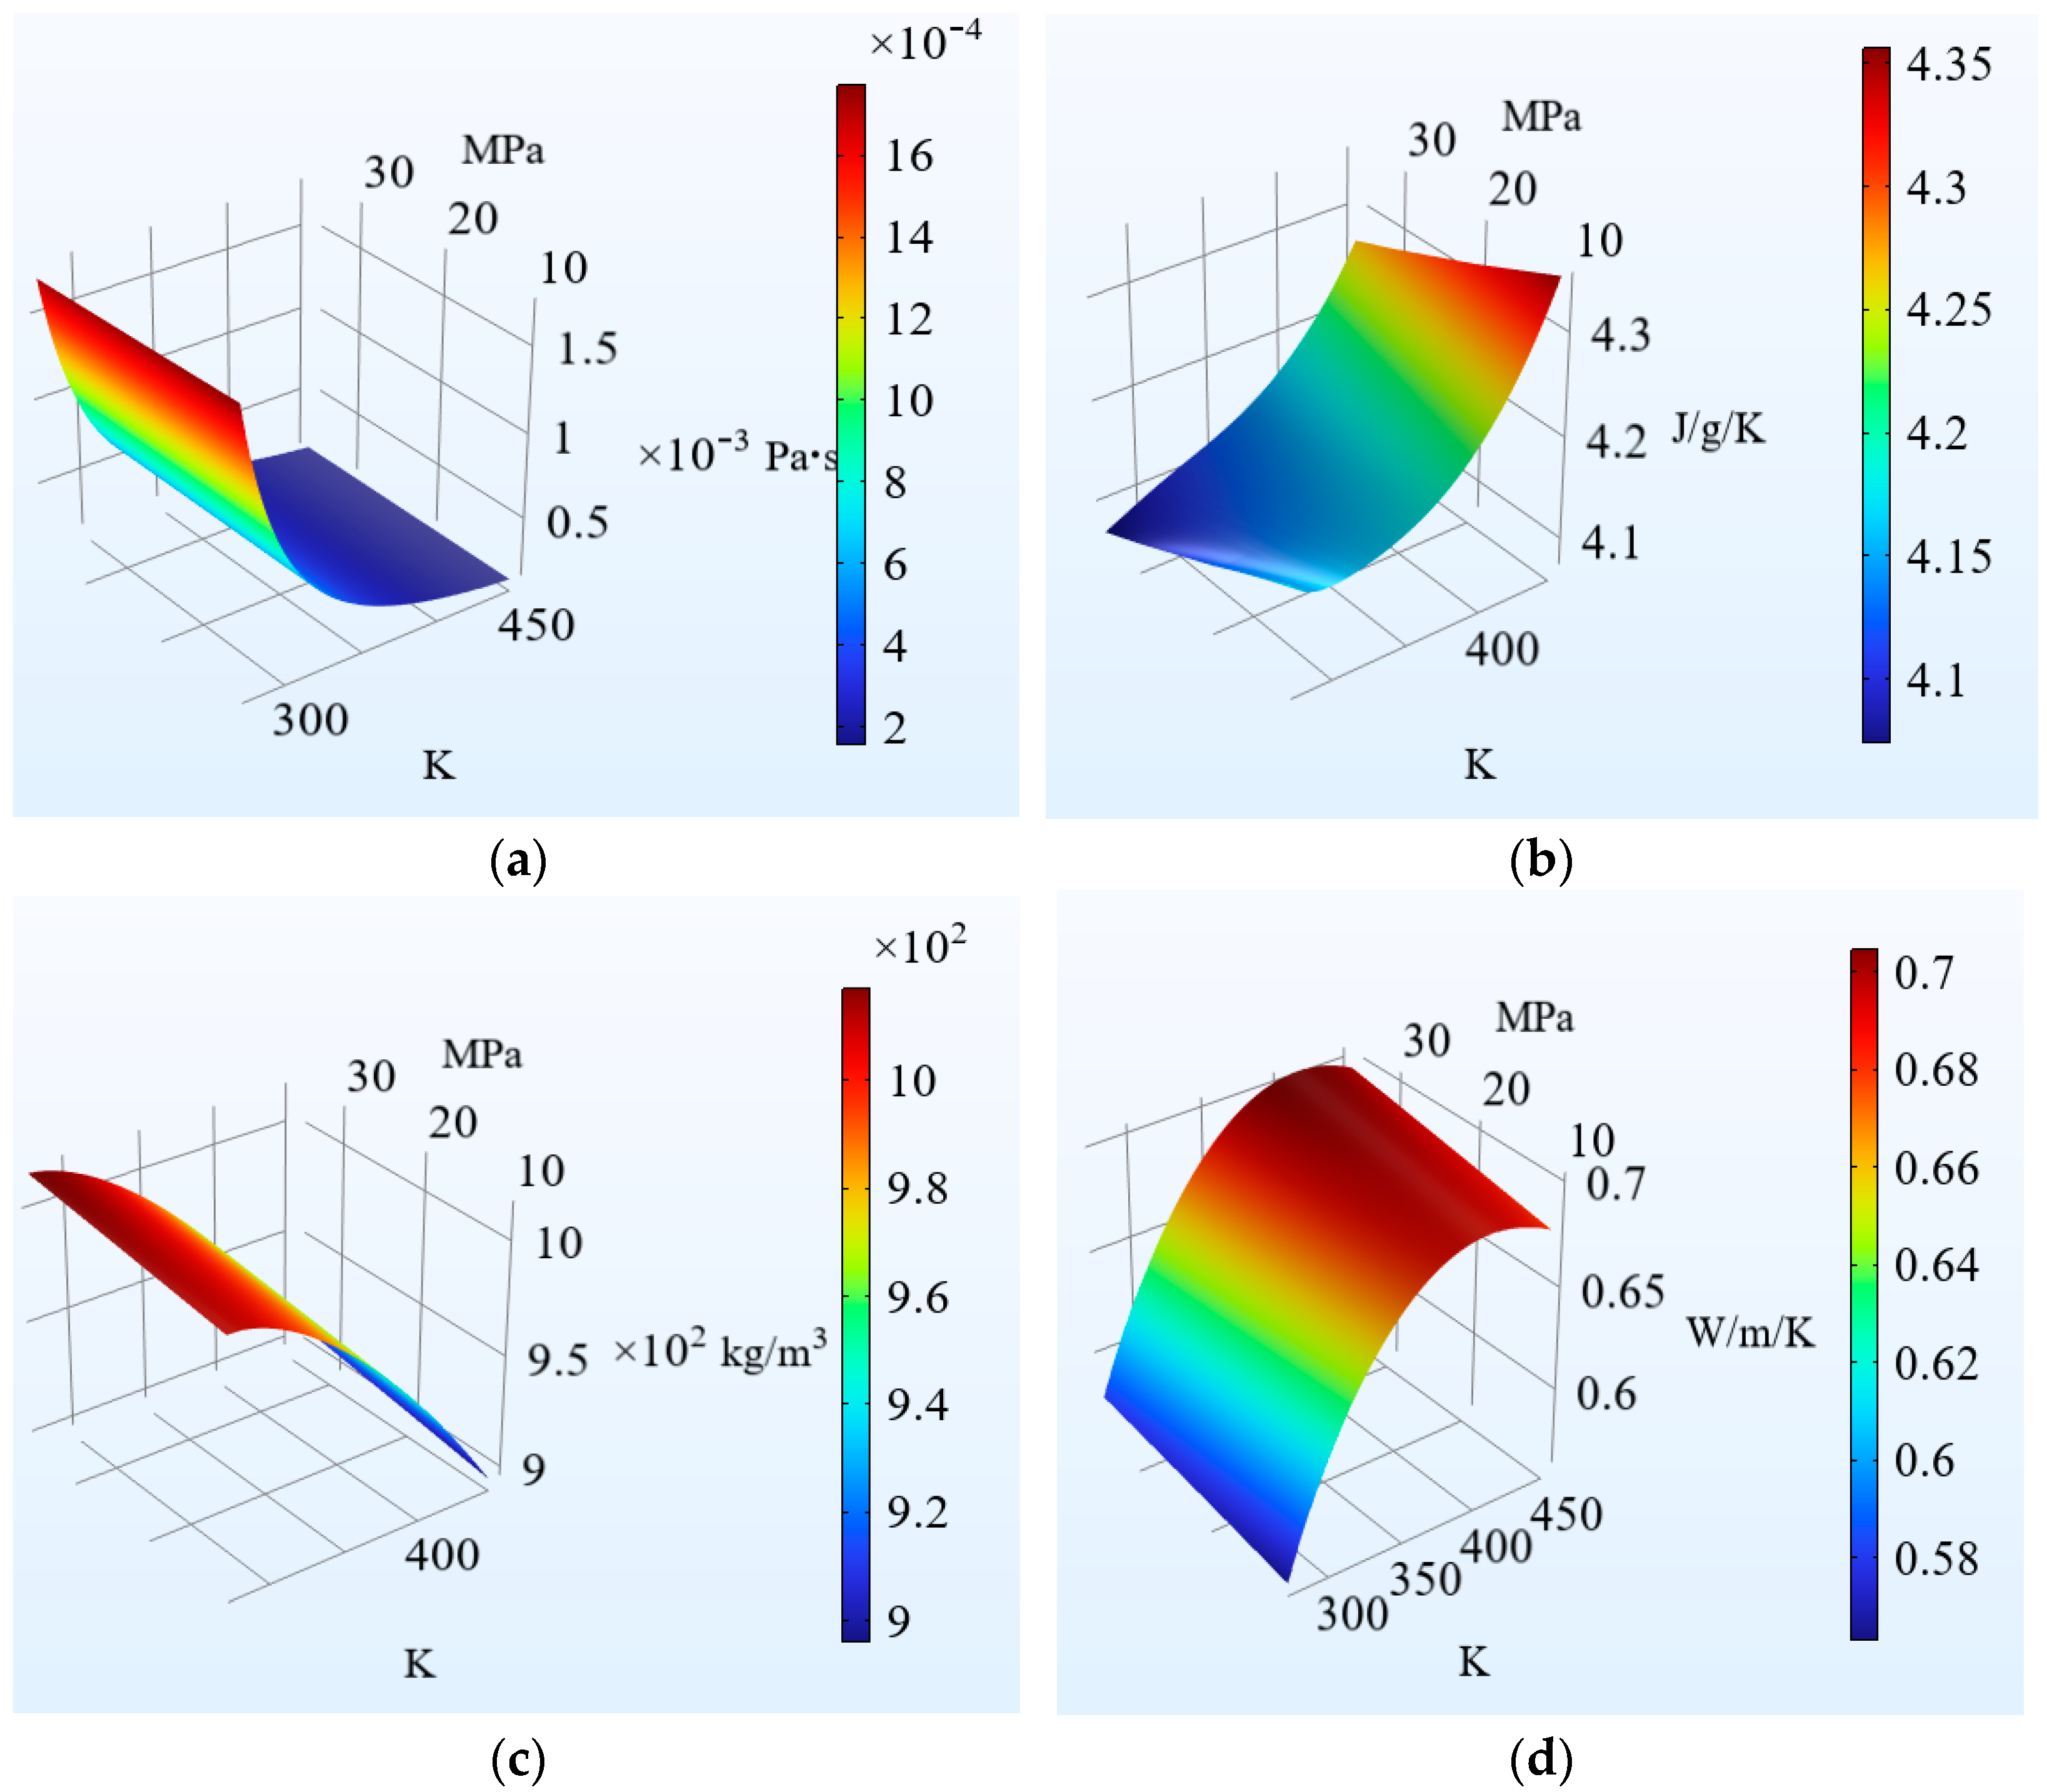
2.3. Relationship Between Temperature and Seepage

The effect of the temperature field on the seepage field is mainly reflected by the changes in the physical property parameters of the fluid, as shown in Figure 1. The relationship between the dynamic viscosity of water and temperature and pressure is shown in Figure 1a. The dynamic viscosity of water decreases with the increase in temperature. When the temperature increases from 300 K to 450 K, the dynamic viscosity decreases from 1.5 × 10⁻³ Pa·s to 0.1 × 10⁻³ Pa·s. At the same temperature, the viscosity of water increases slightly with the increase in pressure. In general, temperature is the dominant factor of hydrodynamic viscosity. The relationship between the atmospheric heat capacity of water and the temperature and pressure is shown in Figure 1b. The atmospheric heat capacity of water increases gradually with the increase in temperature. When the temperature rises from 300 K to 400 K, the atmospheric heat capacity of water increases from 4.1 J/(g·K) to 4.3 J/(g·K). At the same temperature, the pressure increases the heat capacity slightly. In general, temperature is the dominant factor of the atmospheric heat capacity coefficient of water. The relationship between the density of water and temperature and pressure is shown in Figure 1c. The density of water decreases with the increase in temperature. When the temperature increases from 300 K to 400 K, the density of water decreases from 9.8 × 10² kg/m3 to 9.4 × 10² kg/m3. At the same temperature, the increase in pressure increases the density. In general, temperature and pressure have little effect on water density. The relationship between the thermal conductivity of water and the temperature and pressure is shown in Figure 1d. The thermal conductivity of water increases slightly with the increase in temperature. When the temperature increases from 300 K to 450 K, the thermal conductivity of water increases from 0.3 W/(m·K) to 0.67 W/(m·K). At the same temperature, the increase in pressure increases the thermal conductivity. In general, temperature is the dominant factor in the thermal conductivity of water.

3. Geological Model and Geothermal Capacity Evaluation Index

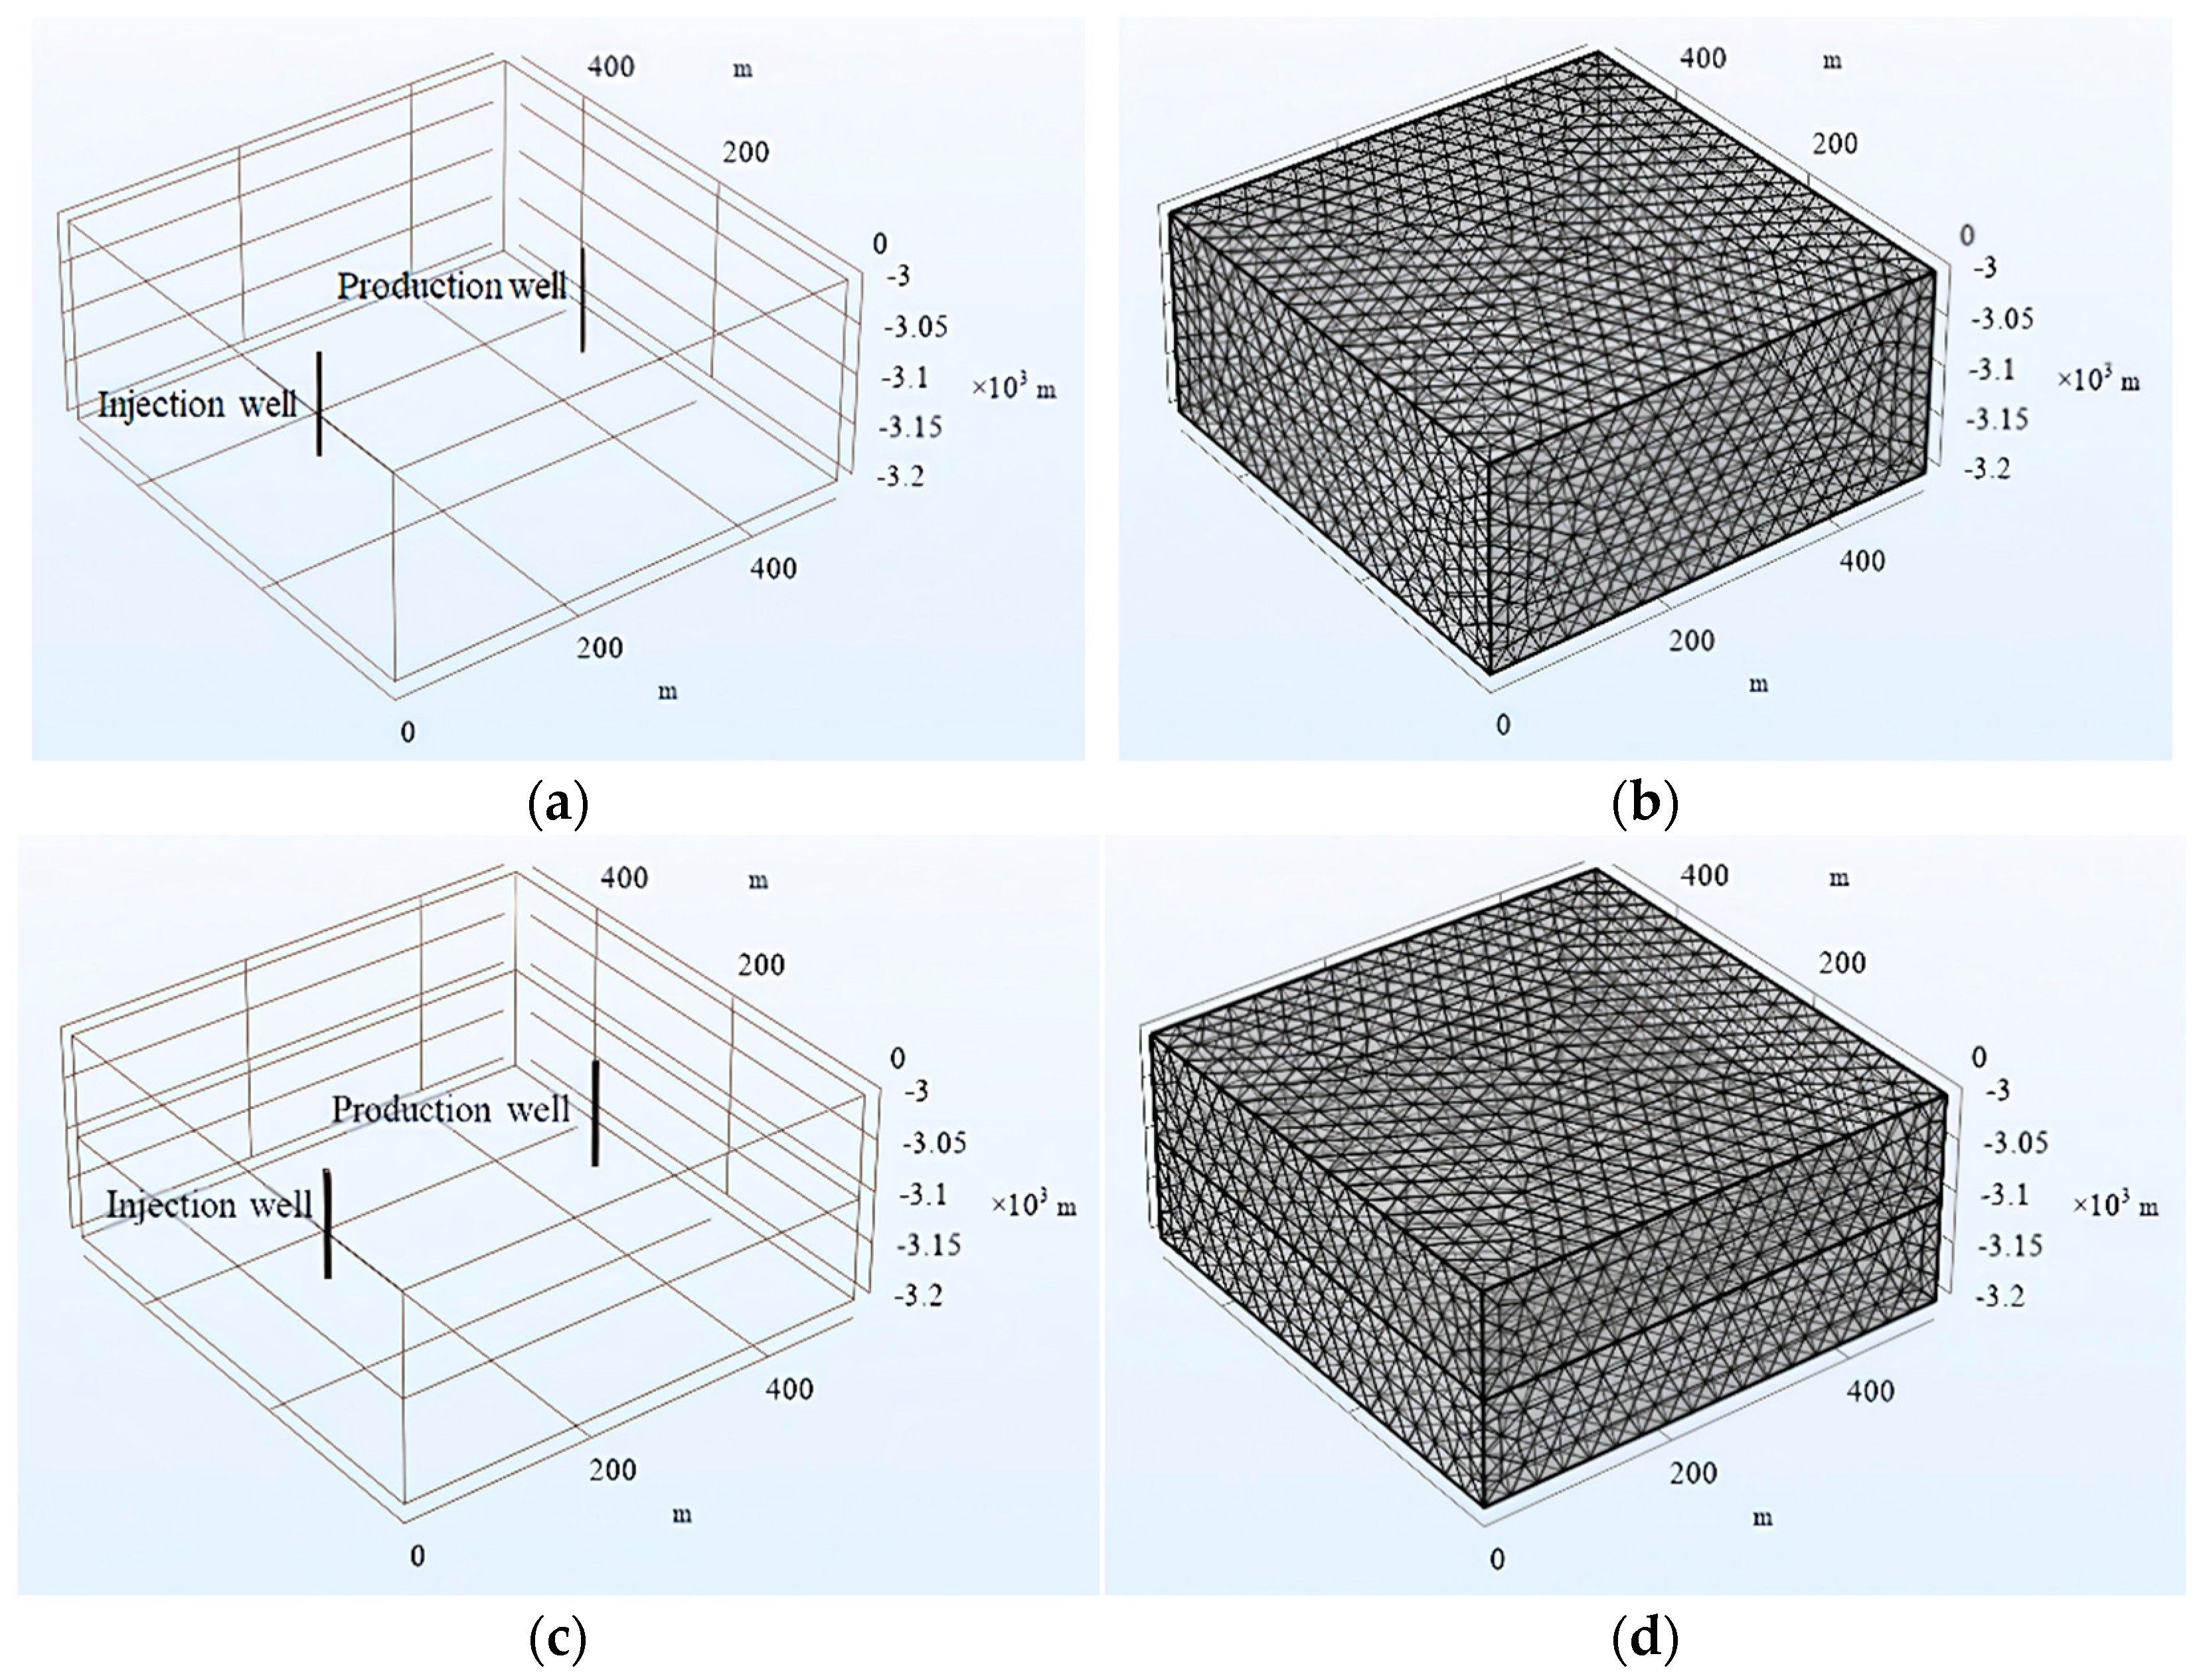
3.1. Geological Model

The COMSOL multi-physics coupling numerical simulation software (COMSOL Multiphysics® 6.2 (COMSOL AB, Stockholm, Sweden) was used to establish a geological model of the high-temperature thermal reservoir with a depth of 3000 m, a model length of 500 m, a width of 500 m, a height of 200 m, and a geothermal gradient of 0.0398 K/m. The simulation time of the whole enhanced geothermal system was 45 a, each time step was 0.5 a, the maximum number of iterations was 10, the iteration space dimension was 5, and the tolerance factor was 1. As shown in Figure 2b, the free-splitting tetrahedron was used to mesh the size of the elements, and the complete mesh contained 41,701 domain elements, 2940 boundary elements, and 196 edge elements. As shown in Figure 2d, the fracture model used a free-splitting tetrahedron to mesh the size of the elements, and the complete mesh contains 39,430 domain elements, 3678 boundary elements, and 268 edge elements. Table 1 lists the model parameters.

3.2. Evaluation Index of Geothermal Production

For evaluation of the heat recovery performance of an EGS coupled with heat flux, the mass flow rate of the production fluid, the temperature of the production fluid, and the cumulative produced energy were used as evaluation indicators for the development of heat storage.
The heat recovery rate represents the heat extraction rate of the geothermal system, and its calculation expression is
q = m ˙ ( h p r o h i n j )
where q is the heat recovery rate, W; m ˙ is the mass flow rate of the heat−taking working fluid, kg/s; hpro is the enthalpy value of the production fluid, J/kg; and hinj is the enthalpy value of the injected fluid, J/kg.

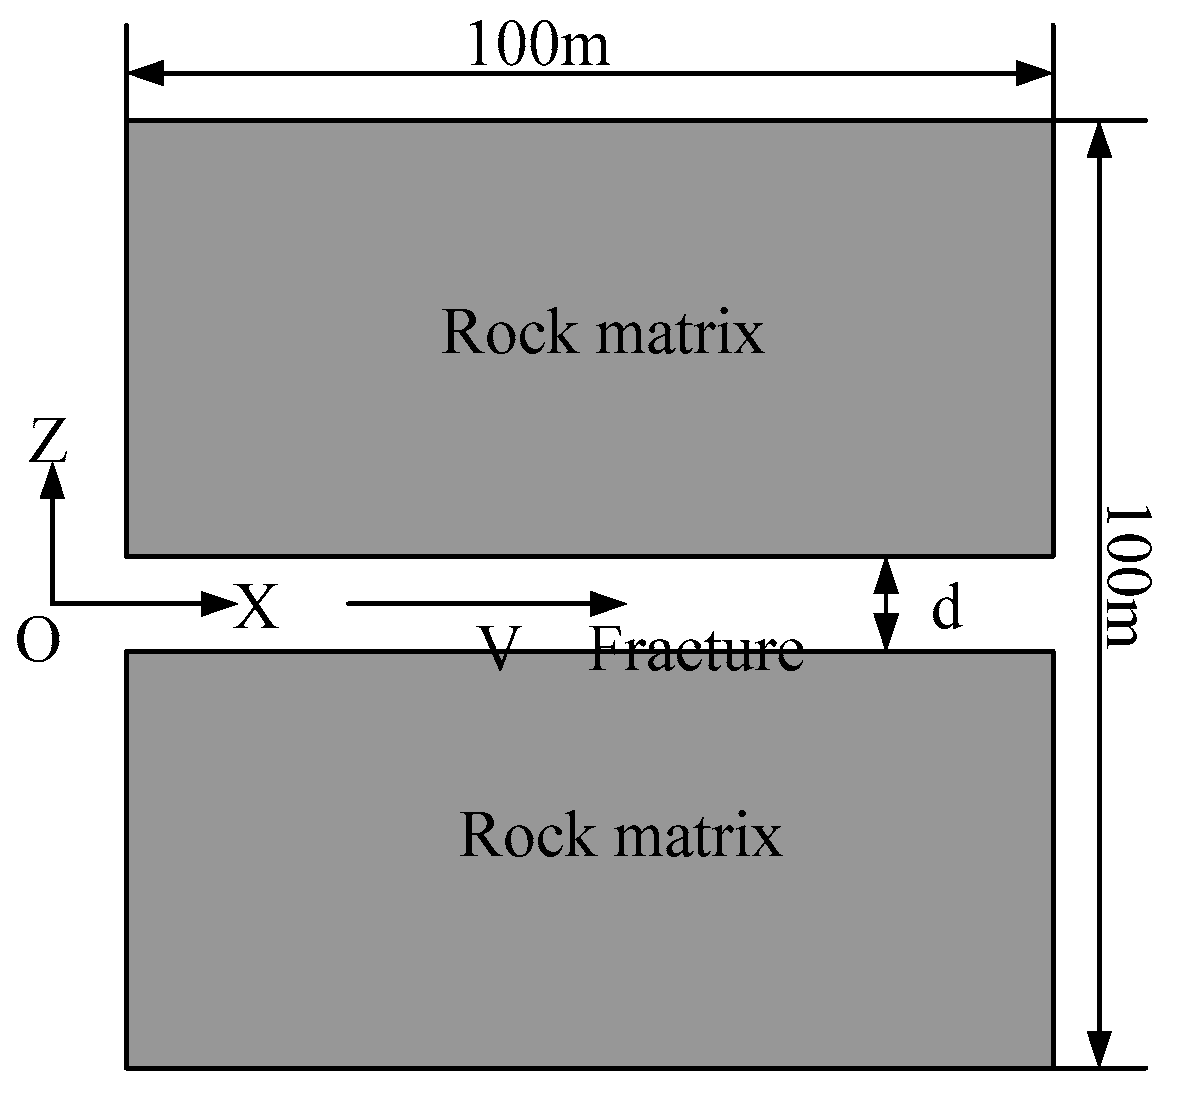
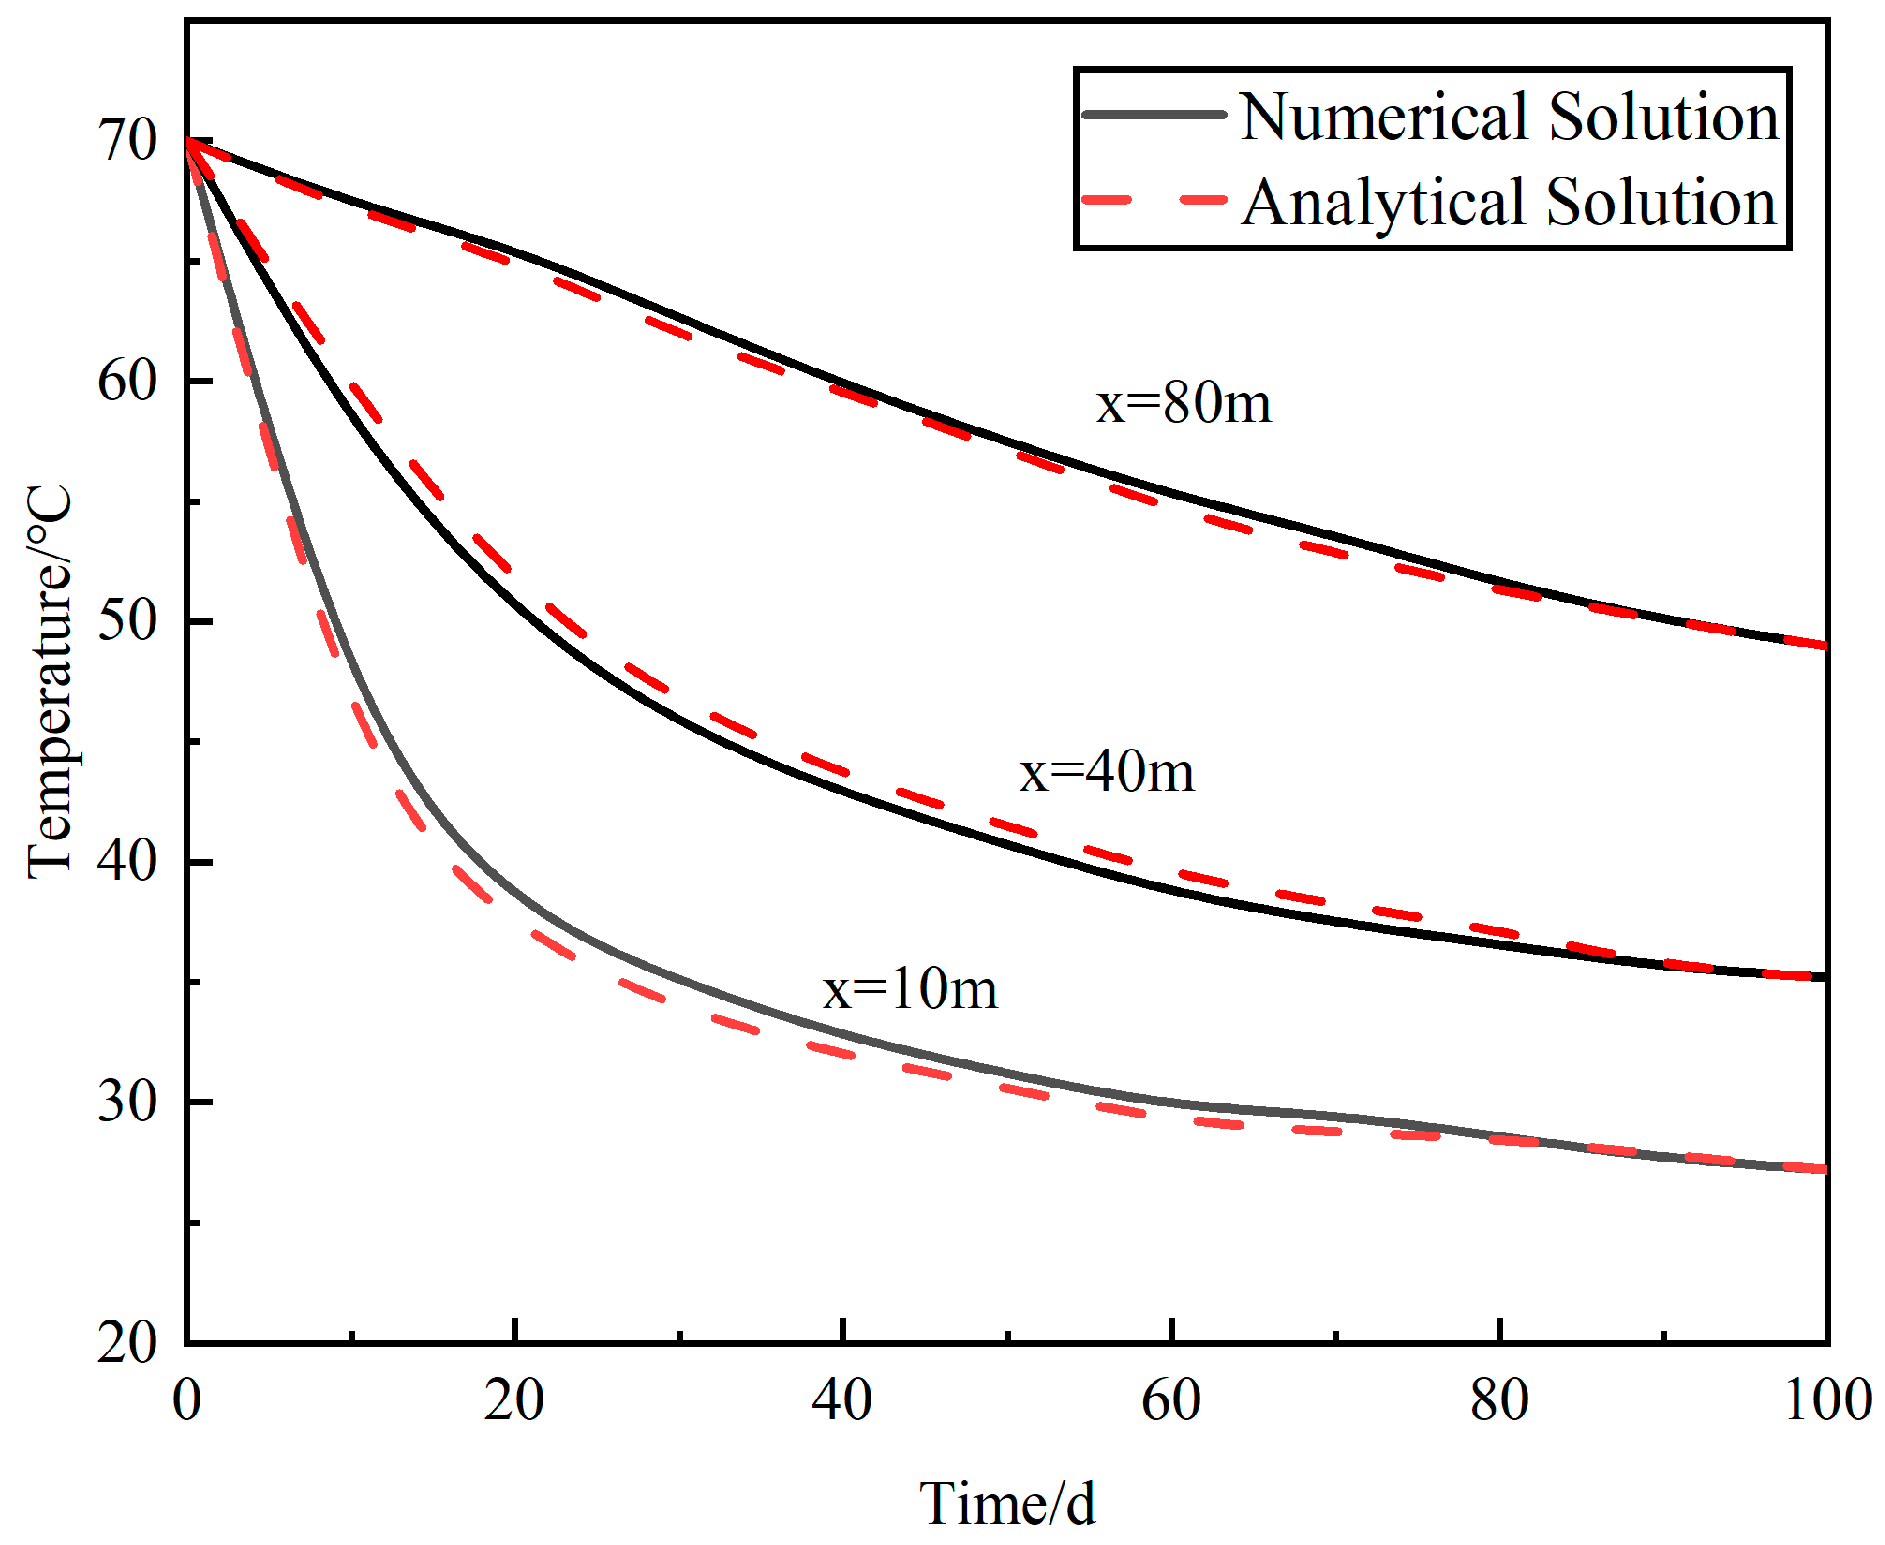
4. Validation of Numerical Model

In order to test the reliability of the numerical simulation method used for the single−fracture heat storage model in this study, the coupling relationship between convective heat transfer in fractures and heat conduction in the matrix was verified. Although the real reservoir fracture network is complex, it is mathematically identical and can be verified through a single fracture. The verification method in this paper was based on the heat flux coupling obtained using the two−dimensional single−fracture matrix model. As shown in Figure 3, thermal extraction was carried out in a limited area of 100 m × 100 m, the initial temperature of the matrix was 70 °C, the water injection temperature was 20 °C, the matrix is an isotropic, impermeable rock mass, and the middle of the two substrates is a rectangular fluid domain with a fracture width of d [29]. The parameters used in model validation are shown in Table 2.
In the two−dimensional single fracture model, it is assumed that the matrix and fracture tend to be infinitely large in the X and Z directions, and the initial temperature of the system is Ti. The water flow at room temperature Te is injected into the fracture at a constant velocity for heat transfer. In this case, the temperature distribution in the fracture can be resolved using Lauwerier’s classical fracture heat transfer analysis [30].
T f = T i + ( T e T i ) e r f λ s x / ( ρ f c f d f ) u e ( u e t x ) λ s / ( ρ s c s ) U t x u e
Comparing the numerical and analytical solutions, Figure 4 shows the temperature change along the fracture at three different locations (x = 10 m, 40 m, 80 m), while Figure 5 shows the temperature along the fracture at different times (t = 10 d, 50 d, 100 d). It can be seen that the analytical solution and the numerical solution curves are almost in agreement, except for minor deviations. Therefore, the accuracy and rationality of the numerical method adopted in this study were validated.

5. Results and Analysis

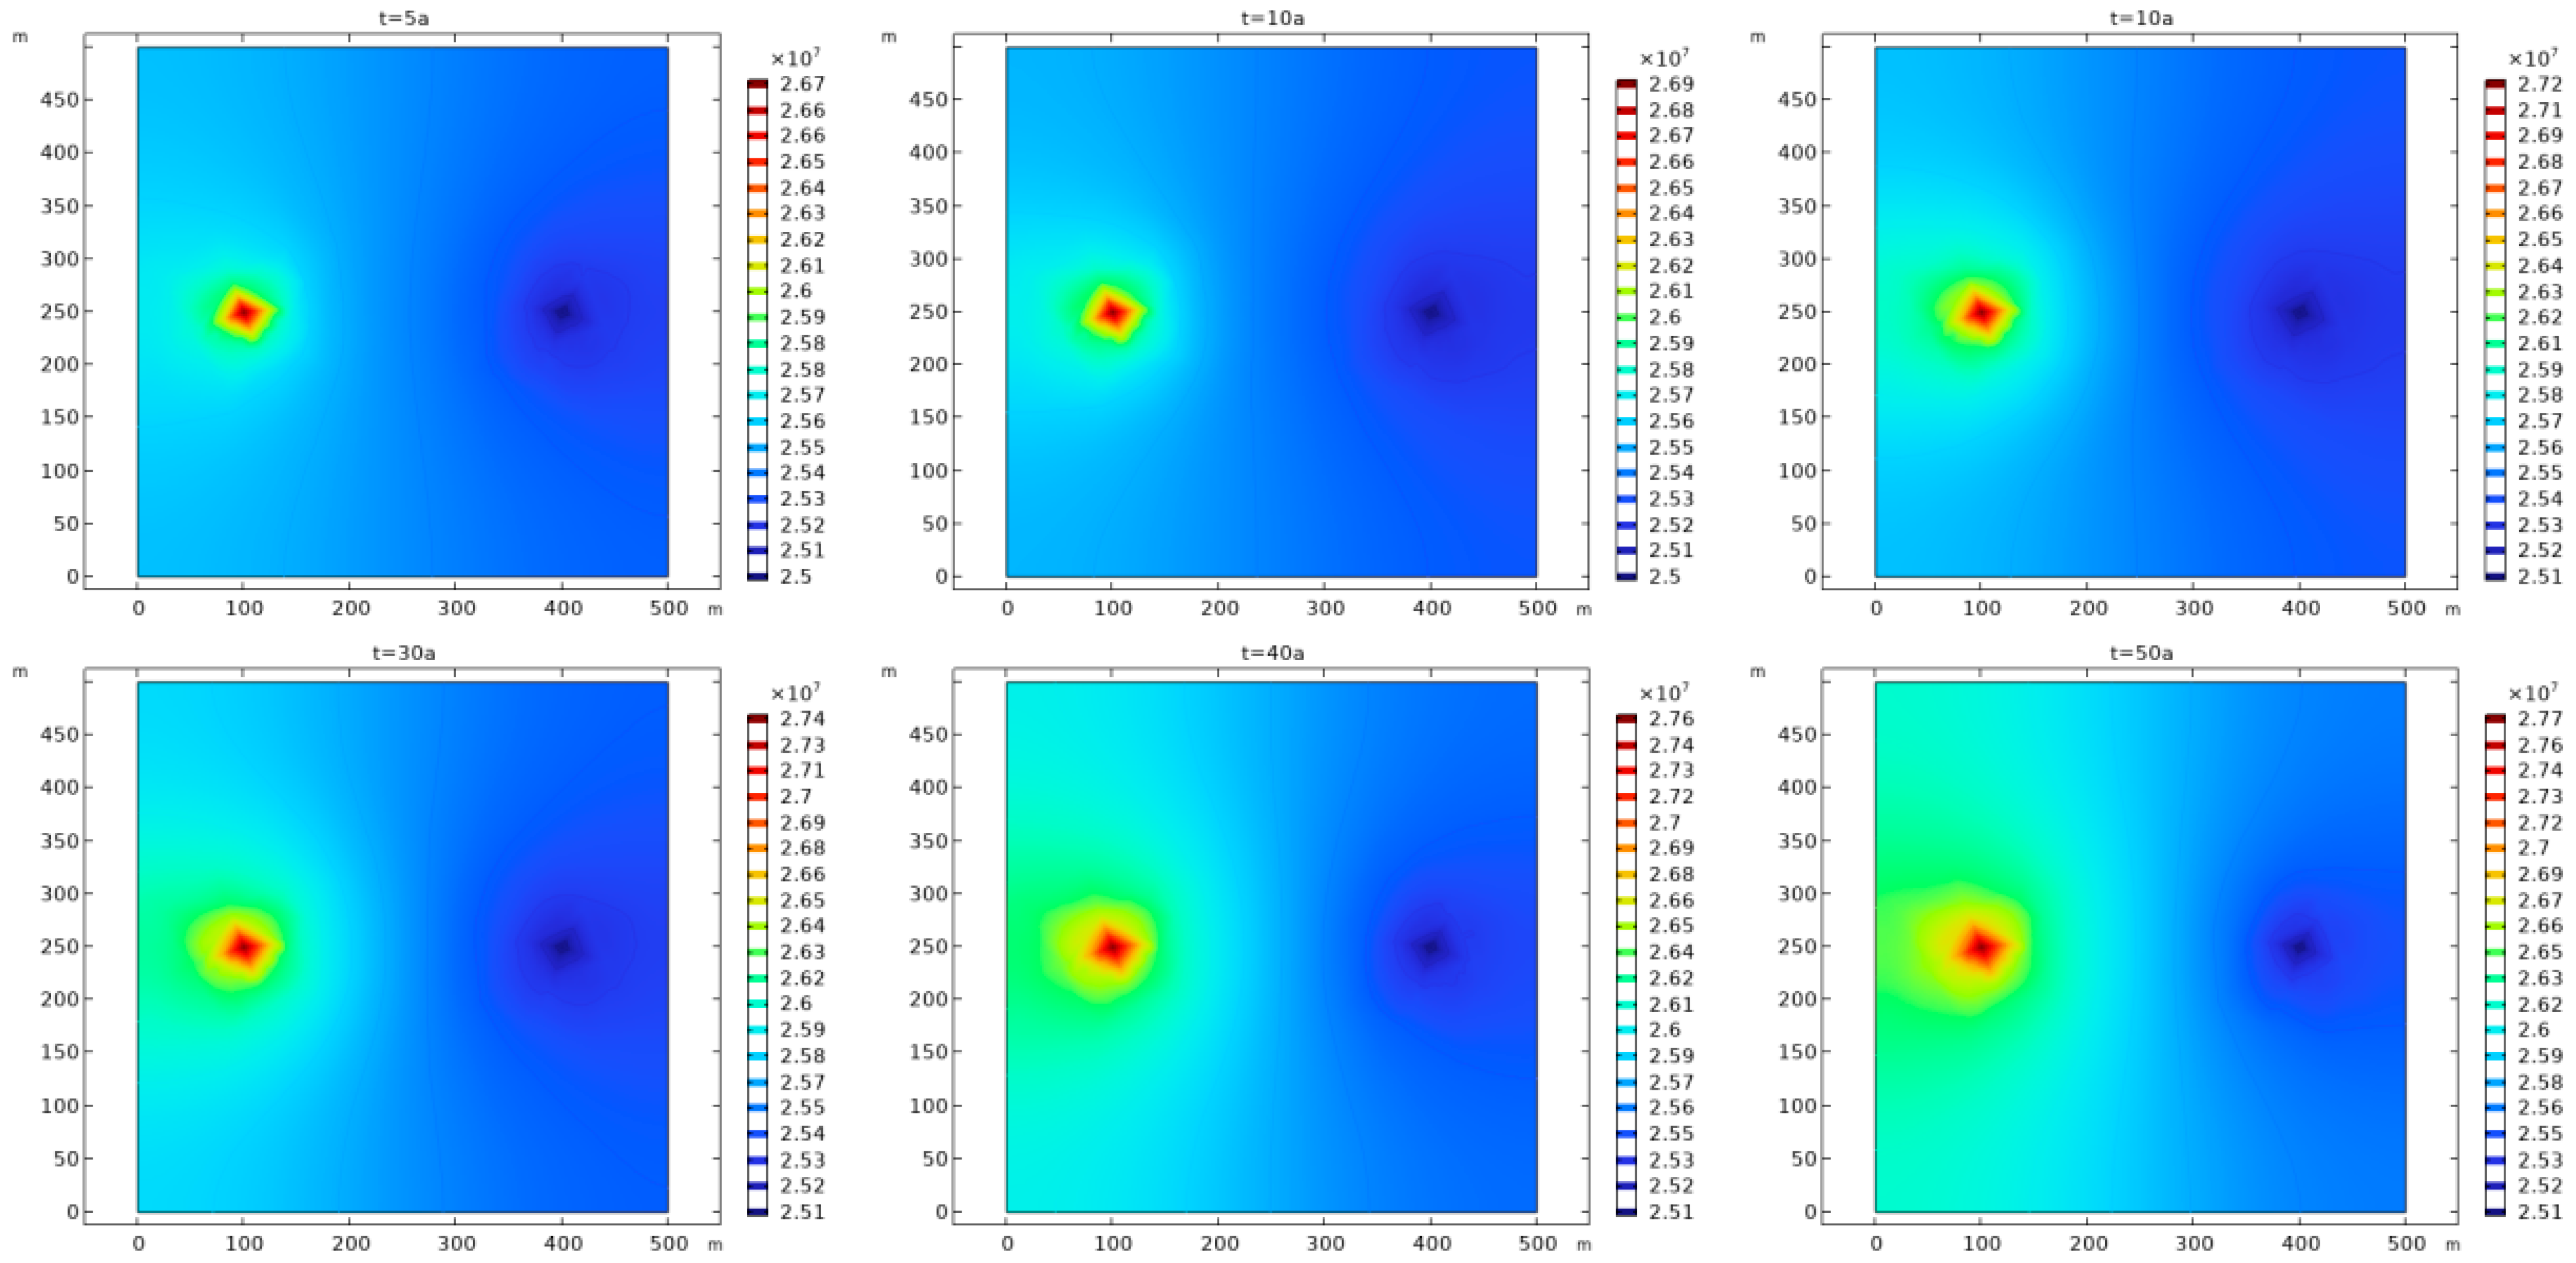
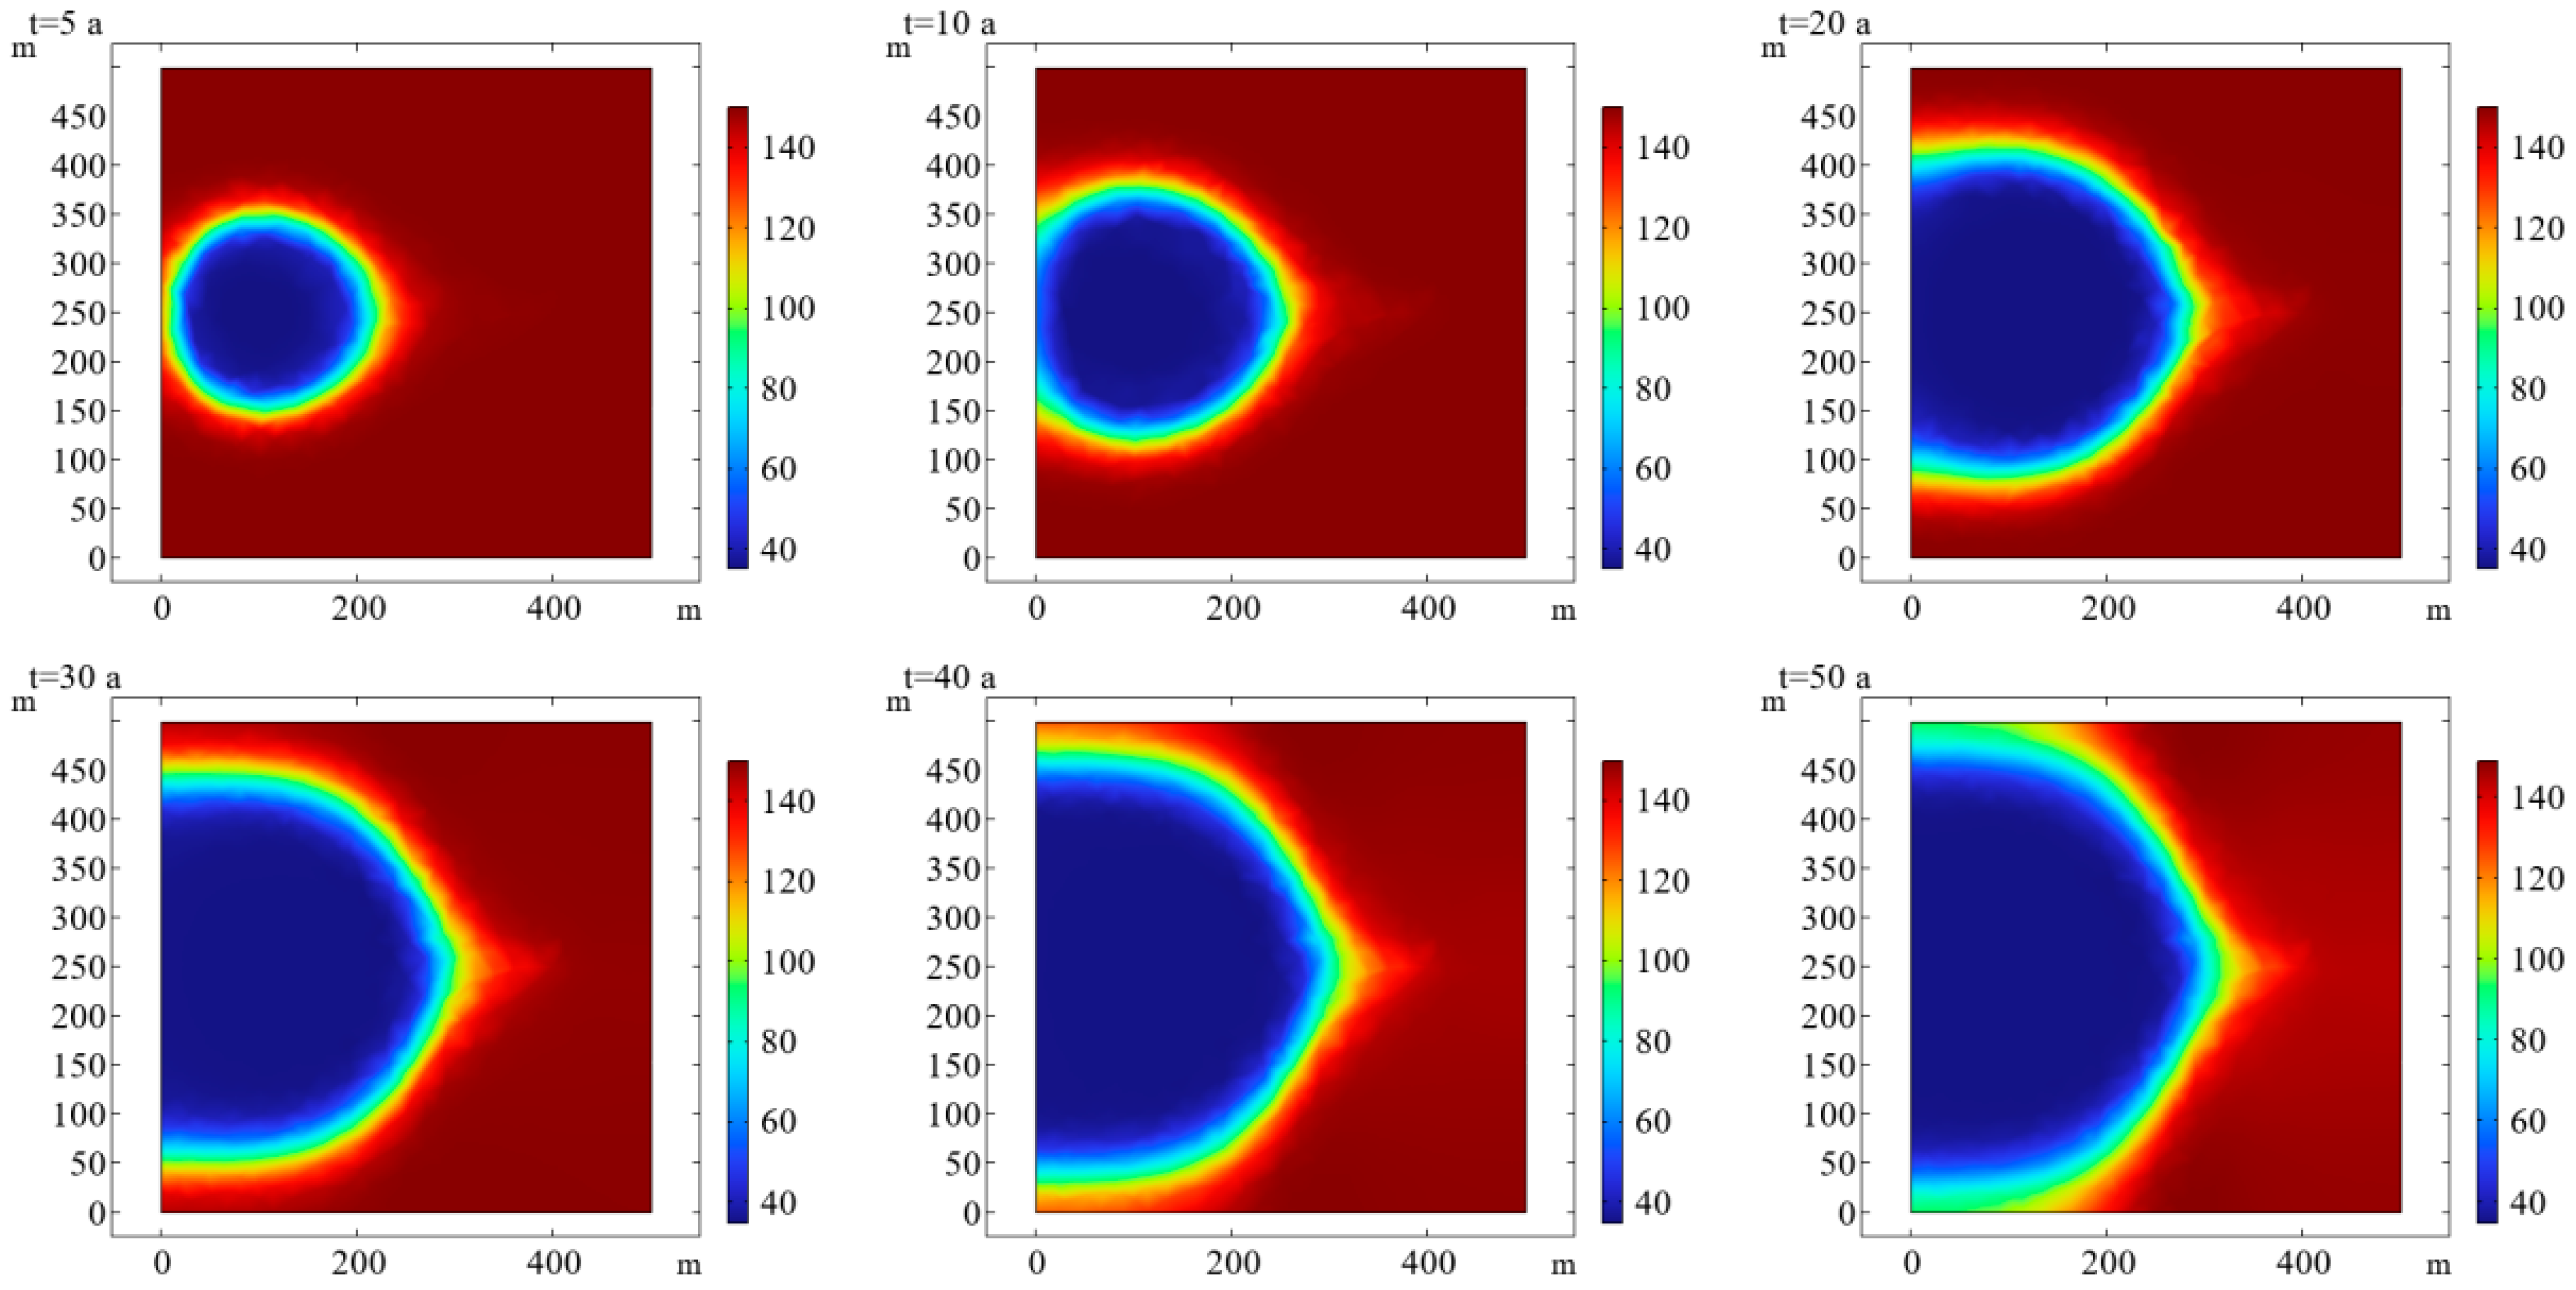
5.1. Spatiotemporal Evolution Characteristics of Pressure and Temperature Fields

For geothermal development, constant pressure production is used in production wells. It can be seen, from Figure 6, that the rapid decline of heat storage pressure caused by production activities is particularly prominent in the vicinity of production wells. In the process of geothermal exploitation, the thermal reservoir pressure around the production well decreases. Due to the continuous injection of fluid, the thermal reservoir pressure near the injection well is supplemented, to a certain extent, such that the pressure drop near the injection well occurs relatively slowly. During the period from 0 to 30 years, the recovery effect of heat storage pressure caused by injection was not significant. However, after 40 years of geothermal development, the pressure in the thermal reservoir effectively recovered under the same injection pressure conditions. The slow recovery of thermal storage pressure in the early stage of development is closely related to the temperature difference in the vicinity of the injection–production well in the early stage of development. As shown in Figure 7, the temperature in this area is relatively low due to the continuous injection of cryogenic fluids into the area near the injection well, creating a large temperature difference in the area near the production well. Combined with Figure 1a, it can be seen that the dynamic viscosity of water is greatly affected by temperature. In this case, the fluid flow velocity near the production well is much greater than that in the vicinity of the injection area; therefore, in the early stages of development, the pressure drop caused by production significantly exceeds the pressure recovery due to injection [31].
In addition, as geothermal development progresses, the low−temperature area near the injection well gradually expands. After 40 years of thermal development, the temperature difference in the vicinity of the injection and production wells gradually decreases. The variability of fluid flow also decreases, at which point the heat storage pressure begins to be effectively restored. As can be seen from Figure 7, the cold front near the injection well between 0 and 5 years uniformly expands, while the cold front is no longer uniform between 5 and 50 years. The cold front tip appears, which is connected to the open hole part of the production well. It can be seen from Figure 7 that between 0 and 5 years, the low−temperature region is small, and there is no cold front tip. The heat transfer temperature of the cryogenic fluid flows out of the low−temperature region and quickly rises to the heat storage temperature through the pores. It is considered that there is no thermal breakthrough at this stage. The high−pressure gradient near the production open hole causes a large amount of cryogenic fluid to collect and flow to the production open hole, such that the heat in the area near the open hole is extracted first, causing the cold front tip to appear [31].

5.2. Optimization of Thermal Reservoir Parameters

Thermal reservoir parameters directly affect the mass flow, mining time, and heat recovery rate of geothermal production. In this study, the porosity and permeability of the heat storage matrix, the thermal conductivity and heat capacity of the heat storage matrix, the existence of fractures in the heat storage matrix, and the influence of the number of fractures on the development indices are studied.

5.2.1. Porosity and Permeability of Heat Storage Matrix

In the context of thermal storage, matrix permeability refers to the ability of a fluid to flow through rock, being a parameter that characterizes the ability of a rock to conduct liquids. In order to study the influence of matrix permeability on system heat recovery and heat loss of the production wellbore, the COMSOL numerical simulation software was used to simulate and calculate five different heat storage matrix permeability models (with permeability of 0.455 mD, 4.55 mD, 45.5 mD, 91 mD, and 455 mD, respectively). In the simulation process, only the permeability of the heat reservoir was changed, and the relationships between the initial temperature of the heat reservoir and the fluid temperature, the mass flow rate of the production fluid, and the heat recovery rate were obtained.
As shown in Figure 8a, with an increase in the permeability of the thermal reservoir matrix, the mass flow rate of the production fluid increases to varying degrees; therefore, an increase in permeability of the thermal reservoir matrix will increase the mass flow rate of the production fluid. When the system reaches a steady state, the mass flow rate of the thermal reservoir fluid with a permeability of 0.455 mD is 1 kg/s. Meanwhile, the mass flow rate of the thermal reservoir with a permeability of 455 mD reached 55 kg/s. From Figure 8b, it can be seen that the higher the permeability of the thermal storage matrix, the faster the temperature of the production fluid decreases, thereby shortening the service life of the thermal storage system. Within 40 years of development, the system with a matrix permeability of 91 mD decreased from 150 °C to 138 °C, while the system with a permeability of 455 mD only took 17 years to achieve the same temperature drop. From Figure 8c, it can be seen that, when the matrix permeability is 455 mD, the heat recovery rate decreases the fastest. However, as the system continues to operate, the gap between the heat extraction rates corresponding to different permeability gradually narrows; that is, the influence of permeability on the heat extraction rate gradually weakens. This is because, although the production well flow increases with the increase in permeability, the heat loss of the reservoir will also increase at the same time, resulting in the enthalpy difference between the production well flow and the injection well flow becoming smaller. Therefore, at the same time, the production mass flow will increase with an increase in permeability while the enthalpy difference will decrease. Therefore, with the continued operation of the system, the influence of permeability change on the heat extraction rate becomes smaller and smaller; the sensitivity of the heat extraction rate to permeability increases with an increase in permeability and decreases with a decrease in permeability, where this change is very significant.
In order to analyze the influence of matrix porosity on the heat extraction performance of the system, the porosity was set to 0.05, 0.1, 0.2, and 0.3. It can be seen from Figure 9 that when the porosity increased from 0.05 to 0.3, after 40 years of production, the mass flow rate of the produced fluid increased by 3.08%, the temperature of the produced fluid increased by 2.14%, and the heat recovery rate increased by 7.04%. This is because a higher porosity leads to lower flow resistance of the fluid in the thermal reservoir, better permeability of the thermal reservoir, a greater system production fluid flow rate, and faster thermal mining. In addition, the lower the porosity of the system, the faster the temperature of the production fluid decreases within the same mining time, the lower the temperature of the production fluid, and the shorter the development life of the thermal reservoir.

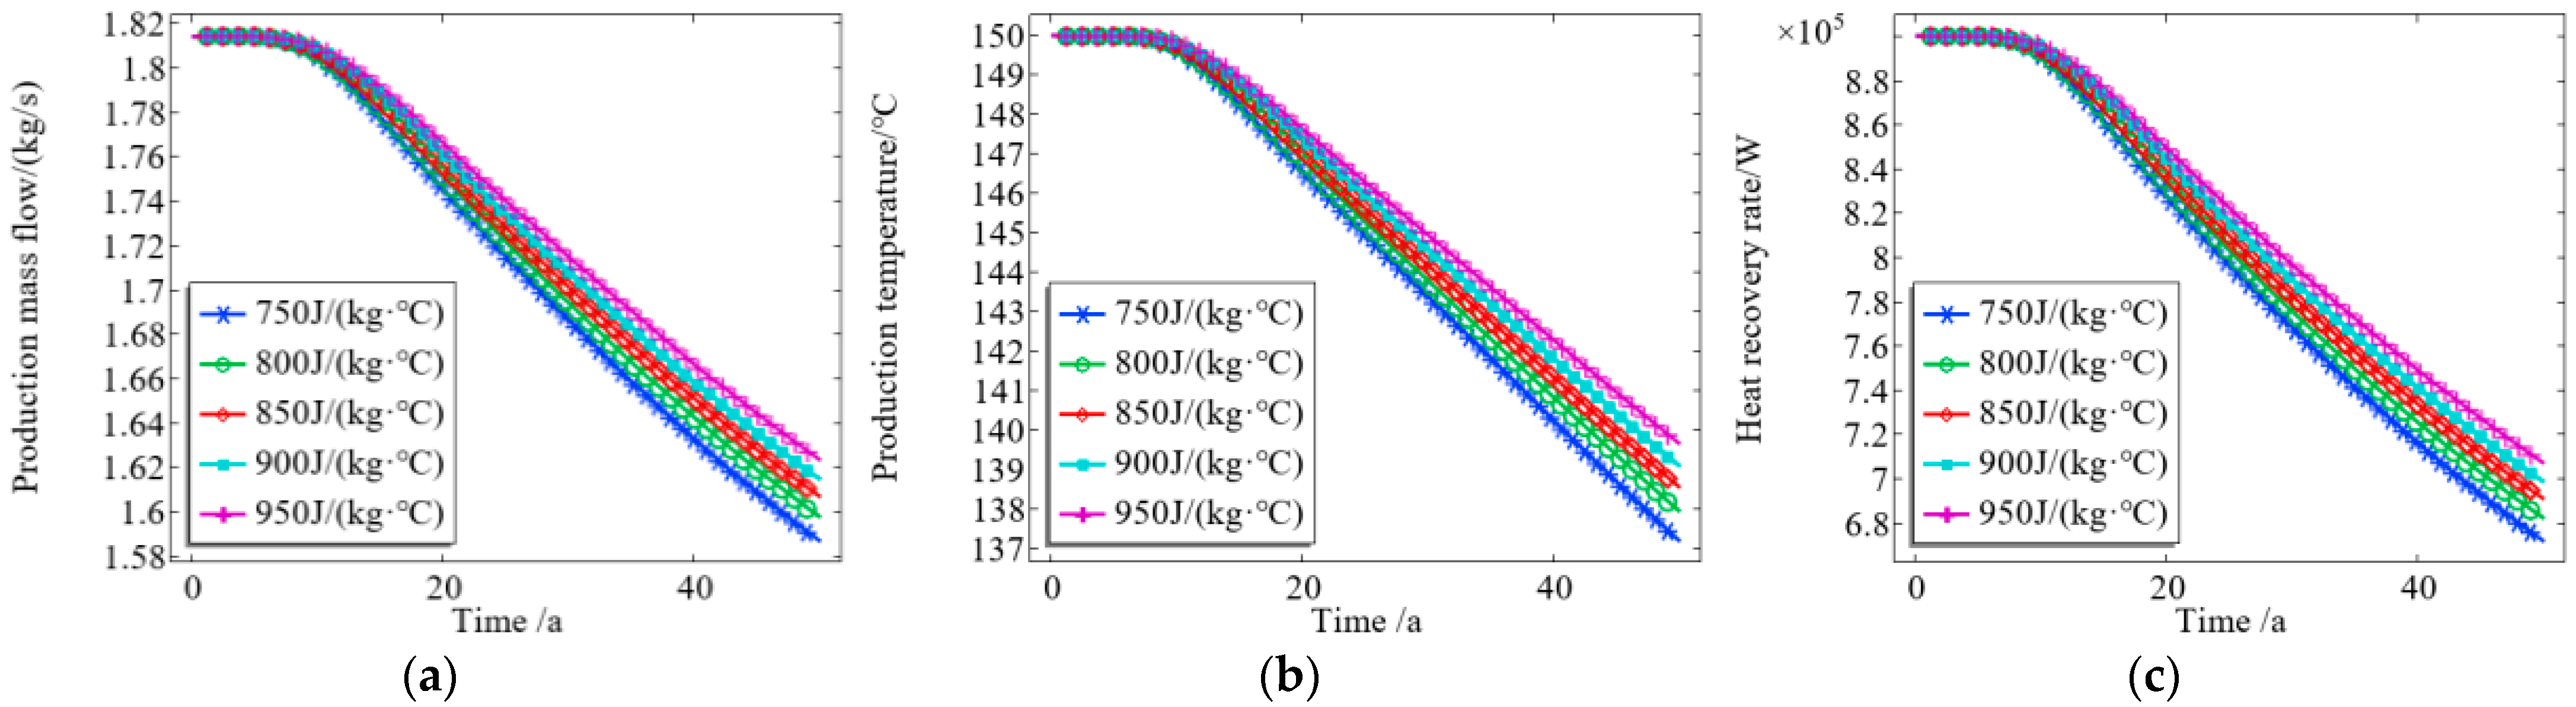
5.2.2. Thermal Conductivity and Specific Heat Capacity of Heat Storage Matrix

The thermal conductivity of heat storage indicates the thermal conductivity of heat storage rock; that is, the heat passing through the unit area per unit time when the temperature decreases by one degree along the direction of heat transfer per unit length. The thermal conductivity of a rock depends on its composition, structure, water content, and temperature, among other factors. In order to analyze the influence of the thermal conductivity of the heat storage matrix on the heat recovery performance of the system, four cases were set up to simulate heat storage of 2 W/(m·°C), 2.5 W/(m·°C), 3 W/(m·°C), and 3.5 W/(m·°C). During the simulation process, only the thermal conductivity of the heat storage matrix was changed, and the relationships between the thermal conductivity of the heat storage matrix and the fluid temperature, the mass flow rate of the production fluid, and the heat recovery rate were obtained.
As shown in Figure 10, the thermal conductivity of the thermal storage matrix has little effect on the thermal storage development effect. When the thermal conductivity of the thermal reservoir increased from 2 W/(m·°C) to 3.5 W/(m·°C), the mass flow rate, temperature, and heat recovery rate of the production fluid of the system did not differ much in the first 20 years of production and development, and only slightly differed from 20 to 40 years. As the thermal conductivity of the matrix increases, the heat in the matrix is more easily transmitted to the injected fluid, and the temperature of the thermal reservoir and the temperature of the produced liquid decrease faster. However, the difference in the thermal conductivity of the matrix is very small, indicating that it has little effect on the development effect.
In order to analyze the effect of the specific heat capacity of the heat storage matrix on the heat recovery performance of the system, five scenarios—setting the heat capacity as 750 J/(kg·K), 800 J/(kg·K), 850 J/(kg·K), 900 J/(kg·K), and 950 J/(kg·K)—were simulated. In the simulation process, only the specific heat capacity of the heat storage matrix was changed. The relationships between the thermal conductivity of the heat storage matrix and the production fluid temperature, the mass flow rate of the production fluid, and the heat recovery rate were obtained.
As shown in Figure 11, when the specific heat capacity of the heat storage matrix increased from 750 J/(kg·°C) to 950 J/(kg·°C), the mass flow rate of the production fluid of the system increased by 2.5%, the temperature of the production fluid increased by 2.14%, and the heat recovery rate increased by 5.5%. This is because a greater specific heat capacity of the reservoir matrix leads to more heat being released by the reservoir to reduce the unit temperature, with a higher increase in the fluid temperature. The higher the temperature of the fluid in the thermal reservoir, the stronger the fluidity, the greater the mass flow rate of the production fluid, the higher the temperature of the production fluid, the longer the development life of the thermal reservoir, and the greater the heat recovery rate.

5.3. Effect of the Number of Fractures on the Development Effect of Heat Storage

In oil and gas development projects, based on core observations, combined with the analysis of thin sections, logs, and oil test data, it can be concluded that the development of high−quality reservoirs is closely related to fractures [32]. These fractures extend along the bedding plane at a low angle or horizontally, which is not only a good reservoir space, but also increases the connectivity of the pores and provides a channel for fluid migration. Coarse−grained, well−sorted sandstone layers are prone to the formation of fractures, especially in tight sandstone reservoirs [33,34]. Fractures in the bedrock of the geothermal system will form an important water diversion channel for heat storage fluid; therefore, the influence of fractures in the bedrock on the heat storage development effect should be studied. The established geological model is shown in Figure 2.
As shown in Figure 12, the existence and number of cracks in bedrock have a great influence on the development effect of thermal reservoirs. When there is no natural fracture in the bedrock, the flow and heat transfer of the fluid occur in the pores, and the heat transfer mode is mainly heat conduction. As shown in Figure 12, due to the existence of no dominant path, the mass flow rate of the production fluid is slow, the thermal breakthrough of the thermal reservoir is slow, the temperature of the production fluid decreases more slowly, and the development life is long. However, without the existence of natural fractures, only relying on pore seepage will lead to slower fluid flows, such that the production mass flow rate and heat recovery rate are low.
It can be seen from Figure 12a that when the number of cracks in the bedrock increases from 0 to 3, the mass flow rate of the production fluid jumps from the initial 9.3 kg/s to 14.5 kg/s (an increase of 55.9%), and the flow rate is maintained at 14.1 kg/s after 40 years of production, which is 66.3% higher than that for the non−crack system. It can be seen from Figure 12b that when the system is developed for 40 years, the production temperature of the system with three cracks decreases from 150 °C to 139 °C, while that of the crack−free system only decreases from 150 °C to 140 °C, with a decrease of 6%. It can be seen from Figure 12c that, when there are three cracks in the system, the initial heat recovery rate reaches 7 × 10⁶ W, and remains at 6.76 × 10⁶ W after 40 years. For the crack−free system, after 40 years of development, the heat recovery rate will decrease from 4.55 × 10⁶ W to 4.12 × 10⁶ W, and the heat recovery rate of the system with three cracks is higher than that of the crack−free system.
Therefore, increasing the number of fractures will greatly increase the mass flow rate of the production fluid, while the temperature of the production fluid and the development life of the thermal reservoir will decrease with an increase in the number of fractures. As the heat recovery rate is affected by the mass flow rate of the production fluid and the temperature of the production fluid, although the increase in the number of cracks causes the mass flow rate of the production fluid to increase significantly, it also leads to a significant decrease in the temperature of the production fluid. Therefore, when there are three cracks, the heat recovery rate of the system is the highest; however, the temperature of the production fluid decreases significantly after the thermal breakthrough.
The fracture provides a dominant channel with less resistance to the fluid in the thermal reservoir, which affects the sweep range of the fluid. As shown in Figure 13, when there is no crack in the thermal reservoir, there is no dominant path in the bedrock at this time, fluid seepage resistance is significant, the flow rate is slow, and the fluid is uniformly and slowly swept around the thermal reservoir, resulting in low heat recovery rate. When there is a crack in the thermal reservoir, the crack provides a vital channel for the fluid. The seepage resistance of the fluid along the direction of the crack is small, and the heat recovery rate is accelerated. However, the existence of cracks reduces the sweep range of the fluid along the direction perpendicular to the crack which, to some extent, lowers the heat recovery efficiency. When there are multiple cracks in the thermal reservoir, the cracks provide more water channels for the fluid, resulting in more fluid moving along the direction of the cracks; however, too many cracks further block the spread of the fluid, such that a large area of heat in the thermal reservoir is not affected, thereby reducing the heat extraction efficiency. At the same time, the seepage resistance in the fracture is small, and more fluid accumulates along the fracture direction to the production well per unit time, such that the mass flow rate of the production fluid increases. This leads to the conclusion that, when there are cracks, the temperature of the production fluid decreases significantly, the heat around the cracks is quickly extracted, and the heat breakthrough is fast. At the same time, due to the substantial increase in the mass flow of the production fluid, the heat recovery rate increases significantly. It can be seen that the rational use of fractures is conducive to the development of thermal reservoirs, while their unreasonable use leads to adverse effects regarding the development of thermal reservoirs.

6. Conclusions

A three–dimensional numerical model based on finite elements was established to effectively simulate the TH coupling process in a fracturing reservoir. The heat recovery performance of the enhanced geothermal system in the HDR was studied. The proposed model and numerical method were verified through comparison with analytical solutions. An ideal 3D–EGS model was proposed to study the heat transfer and hydrological characteristics in EGS reservoirs.
  • The slow recovery of geothermal reservoir pressure in the early stage of development is related to the temperature difference near the injection and production wells during this period. Therefore, the rate of pressure loss caused by production is greater than the rate of pressure recovery caused by injection in the early stage of development.
  • At the same time, the production mass flow rate will increase with an increase in permeability, while the enthalpy difference will decrease with increasing permeability. Therefore, during the operation of the system, the influence of permeability change on the heat extraction rate becomes smaller and smaller. The sensitivity of the heat extraction rate to permeability increases (decreases) with increasing (decreasing) permeability, and this change is very significant. The thermal conductivity of the matrix has almost no effect on the development of thermal reservoirs. The larger the specific heat capacity of the matrix, the more favorable it is for the development of thermal reservoirs.
  • While cracks provide a dominant channel with less resistance to fluid flow in the reservoir, too many cracks further obscure the spread range of the fluid, such that a large area of heat in the heat reservoir may not be reached, thereby reducing the efficiency of heat extraction. Therefore, the rational utilization of fractures will be beneficial to the development of thermal reservoirs, while their unreasonable utilization will have negative impacts.

Author Contributions

Methodology, M.F.; software, J.W.; investigation, X.L.; data curation, L.F.; writing—original draft, Y.L. All authors have read and agreed to the published version of the manuscript.

Funding

The study was financially supported by the National Natural Science Foundation of China (Youth) under the project titled “Mechanism of Fracture Network Formation Induced by Trans–scale Damage Evolution of Natural Fractures in Hot Dry Rock under Multiple Cyclic Hydraulic Injection” (Grant No. 42302286).

Data Availability Statement

The data presented in this study are openly available in Journal of Rock Mechanics and Engineering, Article name is “Numerical calculation method of discrete fracture network model for seepage heat transfer in two−dimensional fractured rock”, which was published in 2014. The DOI is 10.13722/j.cnki.jrme.2014.01.005 [14].

Conflicts of Interest

The authors declare no conflict of interest.

References

  1. Wang, S.; Shi, Y.; Fang, C.; Cao, Q.; Ren, L. Current situation and development direction of geothermal development and utilization in Chinese oilfields. Rocky Oil Gas Reserv. 2024, 36, 23–32. [Google Scholar]
  2. Aksoy, N.; Şimşek, C.; Gunduz, O. Groundwater contamination mechanism in a geothermal field: A case study of Balcova, Turkey. J. Contam. Hydrol. 2009, 103, 13–28. [Google Scholar] [CrossRef] [PubMed]
  3. Russo, S.; Civita, M. Open-loop groundwater heat pumps development for large buildings: A case study. Geothermics 2009, 38, 335–345. [Google Scholar] [CrossRef]
  4. Freedman, V.; Waichler, S.; Mackley, R.; Horner, J.A. Assessing the thermal environmental impacts of an groundwater heat pump in southeastern Washington State. Geothermics 2012, 42, 65–77. [Google Scholar] [CrossRef]
  5. Nam, Y.; Ooka, R. Numerical simulation of ground heat and water transfer for groundwater heat pump system based on real-scale experiment. Energy Build. 2010, 42, 69–75. [Google Scholar] [CrossRef]
  6. Xu, C.; Dowd, P.; Tian, Z. A simplified coupled hydro-thermal model for enhanced geothermal systems. Appl. Energy 2015, 140, 135–145. [Google Scholar] [CrossRef]
  7. Zhai, H.; Su, Z.; Ling, L.; Wu, N. Numerical simulation study of EGS development in the Desert Peak geothermal field in the United States based on the parallel multi-fracture model. Adv. Geophys. 2017, 32, 546–552. [Google Scholar]
  8. Luo, L.; Cao, W.L.; Jiang, F.M. Enhanced fractal bifurcation network model for heat extraction in geothermal systems. J. Eng. Thermophys. 2015, 36, 388–392. [Google Scholar]
  9. Shan, D.D.; Yan, T.; Li, W.; Zhao, H.; Lu, G. Numerical Simulation and Analysis of Thermal-Hydraulic Coupling in A Single-Fracture Thermal Reservoir. Contemp. Chem. Ind. 2020, 49, 716–719+723. [Google Scholar]
  10. Lei, H.; Jin, G.; Li, J.; Shi, Y.; Feng, B. Coupled Thermal-Hydrodynamic Processes for Geothermal Energy Exploitation in Enhanced Geothermal System at Songliao Basin, China. J. Jilin Univ. (Earth Sci. Ed.) 2014, 44, 1633–1646. [Google Scholar]
  11. AbuAisha, M.; Loret, B. Influence of hydraulic fracturing on impedance and efficiency of thermal recovery from HDR reservoirs. Geomech. Energy Environ. 2016, 7, 10–25. [Google Scholar] [CrossRef]
  12. Bujakowski, W.; Barbacki, A.; Miecznik, M.; Pająk, L.; Skrzypczak, R.; Sowiżdżał, A. Modelling geothermal and operating parameters of EGS installations in the lower triassic sedimentary formations of the central Poland area. Renew. Energy 2015, 80, 441–453. [Google Scholar] [CrossRef]
  13. Hu, J.; Su, Z.; Wu, N.Y.; Zhai, H.Z.; Zeng, Y.C. Analysis of the temperature field of water-rock coupled with heat flow in an enhanced geothermal system. Adv. Geophys. 2014, 29, 1391–1398. [Google Scholar]
  14. Chen, B.; Song, E.; Cheng, X. Numerical calculation method of discrete fracture network model for seepage heat transfer in two-dimensional fractured rock. J. Rock Mech. Eng. 2014, 33, 43–51. [Google Scholar]
  15. Qu, Z.; Zhang, W.; Guo, T.; Sun, J. Numerical simulation of heat mining performance of hot dry rocks with fracture network based on a local thermal non-equilibrium model. J. China Univ. Pet. (Nat. Sci. Ed.) 2019, 43, 90–98. [Google Scholar]
  16. Xiao, P.; Yan, F.F.; Du, B.; Tian, H.; Liu, H.W.; Zhu, Z.N. Numerical simulation of parallel multi-fracture heat transfer process in horizontal wells for enhanced geothermal systems. Renew. Energy 2019, 37, 1091–1099. [Google Scholar]
  17. Wang, H.; Wang, L.; Cheng, Z. Influence Factors on EGS Geothermal Reservoir Extraction Performance. Geofluids 2022, 2022, 5174456. [Google Scholar] [CrossRef]
  18. Zhang, J.; Zhao, M.; Wang, G.; Ma, P. Evaluation of heat extraction performance of multi-well injection enhanced geothermal system. Appl. Therm. Eng. 2022, 201, 117808. [Google Scholar] [CrossRef]
  19. Yu, G.; Liu, C.; Zhang, L.; Fang, L. Parameter sensitivity and economic analyses of an interchange-fracture enhanced geothermal system. Adv. Geo-Energy Res. 2021, 5, 166–180. [Google Scholar] [CrossRef]
  20. Liu, S.; Taleghani, A.D. Analysis of an enhanced closed-loop geothermal system. Geoenergy Sci. Eng. 2023, 231, 212296. [Google Scholar] [CrossRef]
  21. Liu, S.; Taleghani, A.D.; Ji, K. An advanced closed-loop geothermal system to substantially enhance heat production. Energy Convers. Manag. 2024, 322, 119168. [Google Scholar] [CrossRef]
  22. Yao, J.; Zhang, X.; Sun, Z.; Huang, Z.; Liu, J.; Li, Y.; Xin, Y.; Yan, X.; Liu, W. Numerical simulation of the heat extraction in 3D-EGS with thermal-hydraulic-mechanical coupling method based on discrete fractures model. Geothermics 2018, 74, 19–34. [Google Scholar] [CrossRef]
  23. Cai, X.; Deng, Q.; Xu, K.; Zhong, X.; Yang, M. Impact of dual-fracture location on heat extraction from Enhanced geothermal system in low-permeability reservoirs. Appl. Therm. Eng. 2025, 259, 124754. [Google Scholar] [CrossRef]
  24. Suo, Y.; Guan, W.; Dong, M.; Zhang, R.; Wang, K.; He, W.; Fu, X.; Pan, Z.; Guo, B. Study on the heat extraction patterns of fractured hot dry rock reservoirs. Appl. Therm. Eng. 2025, 262, 125286. [Google Scholar] [CrossRef]
  25. Song, X.; Shi, Y.; Li, G.; Yang, R.; Wang, G.; Zheng, R.; Li, J.; Lyu, Z. Numerical simulation of heat extraction performance in enhanced geothermal system with multilateral wells. Appl. Energy 2018, 218, 325–337. [Google Scholar] [CrossRef]
  26. Chen, Z.; Huang, L.; Li, X.; Liu, Z.; Chen, J. Numerical investigations of mechanical behavior and permeability evolution in mine geothermal reservoir with blasting fractures using fully coupled thermal–hydraulic-mechanical modeling. Appl. Therm. Eng. 2024, 252, 123596. [Google Scholar] [CrossRef]
  27. Li, J. Numerical Simulation Study of Geothermal Mining Characteristics of CO2 Plume Geothermal System. Master’s Thesis, Beijing University of Technology, Beijing, China, 2018. [Google Scholar]
  28. Yuan, A. Study on Heat Transfer Characteristics of Enhanced Geothermal System Based on Heat Flow Coupling. Master’s Thesis, Anhui University of Architecture, Hefei, China, 2022. [Google Scholar]
  29. Wang, L. Numerical Simulation and Optimization of Wellbore-Multi-Fractured Reservoir Heat Flow Coupling. Master’s Thesis, Anhui University of Architecture, Hefei, China, 2023. [Google Scholar]
  30. Aliyu, M.D.; Chen, H.P. Sensitivity analysis of deep geothermal reservoir: Effect of reservoir parameters on production temperature. Energy 2017, 129, 101–113. [Google Scholar] [CrossRef]
  31. Qu, Z.Q.; Zhang, W.; Guo, T.K.; Sun, J.; Gong, F.C.; Tian, Y.; Li, X.L. Research on the influence law of reservoir parameters and laminar joints on geothermal production capacity based on COMSOL. Adv. Geophys. 2017, 32, 2374–2382. [Google Scholar]
  32. Gong, L.; Qin, X.; Lu, J.; Gao, Y.; Meng, L.; Yuan, H.; Lu, Q.; Yin, X. Fracture development characteristics and distribution prediction of carbonate buried hill reservoirs in Nanpu Sag, Bohai Bay Basin. Nat. Gas Geosci. 2024, 35, 925–937. [Google Scholar]
  33. Wu, Z.; Tang, H.; An, F. Discussion on the genesis of stratigraphic joints in tight sandstone gas reservoirs in Xinchang, West Sichuan. Pet. Explor. Dev. 2003, 2, 109–111. [Google Scholar]
  34. He, Z.; Liu, B.; Wang, P. Genesis of Jurassic laminar joints and their influence on reservoirs in Yongjin area, Junggar Basin. Oil Gas Geol. Recovery 2011, 18, 15–17+112. [Google Scholar]
Figure 1. Schematic diagrams of the changes in the physical parameters of water as a function of temperature and pressure. (a) The dynamic viscosity of water as a function of temperature and pressure. (b) The atmospheric heat capacity of water as a function of temperature and pressure. (c) The density of water as a function of temperature and pressure. (d) The thermal conductivity of water as a function of temperature and pressure.
Processes 13 01135 g001
Figure 2. Geological models for high-temperature thermal storage simulation at a depth of 3000 m. (a) Fracture−free geological model. (b) Fracture−free geological model grid. (c) Fracture−bearing geological model. (d) Fracture−bearing geological model grid.
Processes 13 01135 g002
Figure 3. Fracture heat transfer model.
Processes 13 01135 g003
Figure 4. Temperature variation at three locations in the fracture over time.
Processes 13 01135 g004
Figure 5. Temperature changes in a fracture at different times.
Processes 13 01135 g005
Figure 6. Temporal and spatial distribution of lateral section pressure evolution in thermal reservoir at 3100 m depth.
Processes 13 01135 g006
Figure 7. Temporal and spatial distribution of temperature evolution in transverse section of thermal reservoir at 3100 m depth.
Processes 13 01135 g007
Figure 8. Influence of reservoir matrix permeability on (a) mass flow of production fluid, (b) temperature of production fluid, and (c) heat recovery rate.
Processes 13 01135 g008
Figure 9. Influence of reservoir matrix porosity on (a) mass flow of production fluid, (b) temperature of production fluid, and (c) heat recovery rate.
Processes 13 01135 g009
Figure 10. Effect of thermal conductivity of the reservoir matrix on (a) mass flow of production fluid, (b) temperature of production fluid, and (c) heat recovery rate.
Processes 13 01135 g010
Figure 11. Effect of the specific heat capacity of reservoir matrix on (a) mass flow of production fluid, (b) temperature of production fluid, and (c) heat recovery rate.
Processes 13 01135 g011
Figure 12. The effect of the number of fractures in the bedrock on (a) the mass flow rate of the production fluid, (b) the temperature of the production fluid, and (c) the heat recovery rate.
Processes 13 01135 g012
Figure 13. Spatiotemporal distribution of temperature evolution during geothermal development. (a) No fractures; (b) one fracture; (c) three fractures; (d) five fractures.
Processes 13 01135 g013
Table 1. Model parameters.
TypeNumeric ValueTypeNumeric Value
Thickness of heat storage200 mInjection–production well spacing300 m
Thermal storage density2600 kg/m3Thermal storage permeability45.5 mD
Porosity, heat storage, thermal conductivity2.5 W/(m·K)Heat storage−specific heat capacity800 J/(kg·K)
porosity0.155Geothermal gradient0.0398 K/m
Formation primitive pressure30 MPaSurface temperature25 °C
Injection temperature35 °CFracture permeability1 × 10−12 m2
Thermal conductivity of fractures1.5 W/(m·K)Fracture−specific heat capacity800 J/(kg·K)
Fracture porosity0.6Fracture roughness coefficient1.6
Production well pressure25 MPa
Table 2. Parameters used for verification.
SymbolReference SignificanceNumeric Value
TiInitial temperature70 °C
TeInfuse water temperature20 °C
ueInjection flow rate0.01 m/s
dFracture width3 mm
λsBedrock thermal conductivity3 W/(m·K)
ρfFracture water density1000 kg/m3
cfSpecific heat capacity of fracture water4200 J/(kg·K)
ρsBedrock density2700 kg/m3
CsSpecific heat capacity of bedrock1000 J/(kg·K)
Disclaimer/Publisher’s Note: The statements, opinions and data contained in all publications are solely those of the individual author(s) and contributor(s) and not of MDPI and/or the editor(s). MDPI and/or the editor(s) disclaim responsibility for any injury to people or property resulting from any ideas, methods, instructions or products referred to in the content.

