Abstract
Currently, most crude oil viscosity correlations rely only on API gravity and temperature, resulting in significant limitations in accurately predicting crude oil viscosity. To address this issue, this paper systematically explores the effect of API gravity, and crude oil components (saturates, aromatics, resins, and asphaltenes content), on viscosity based on 251 crude oil samples through sensitivity analysis. To overcome the shortcoming of traditional models, this paper proposes an innovative generalized viscosity model that combines the Levenberg–Marquardt (LM) and universal global optimization (UGO) methods to fully consider the effects of API gravity and various crude oil components. To verify the effectiveness of the model, this paper divides the 251 crude oil samples into a training set (202 samples) and a test set (49 samples) and compares the prediction results of the new model with the traditional. The results show that the prediction accuracy of the new model on the training set and test set is significantly better than that of the traditional model, with the minimum average absolute relative deviation reaching 10.13% and 12.4%, respectively. This study not only improves the accuracy of crude oil viscosity prediction but also provides early warning of increased pipeline friction caused by abnormal viscosity, avoids suspension accidents, and ensures the safe operation of long-distance pipelines.
1. Introduction
Crude oil viscosity indicates a fluid’s internal resistance to flow, which is crucial for designing the production process, transporting oil, and planning spill remediation measures [1,2]. Crude oil viscosity is primarily influenced by API gravity, temperature, pressure, and composition. As expected, viscosity decreases with increasing API gravity and temperature. While viscosity is typically measured experimentally at reservoir temperature, these methods are costly and time-consuming. As a result, various correlations have been developed to predict viscosity under reservoir temperature and pressure conditions [3,4,5,6].
Numerous correlations obtained from a literature search have been used to predict fluid viscosity based on measured fluid properties. These common correlations include Beggs and Robinson [7], Standing [8], Glaso, Emmanuel and Jack [9], Ghassan [10], Kartoamodjo and Schmidt [11], Petrosky and Farshad [12], Bennison [13], Elsharkawy and Gharbi [14], Hossain et al. [15], Alomair et al. [16], Felipe [17], Mansour [18], and Abdulrahim [19]. The correlations are shown in Table 1. It can be seen that the first 12 crude oil viscosity models are mainly determined by density (reflected by API gravity) and temperature. The functional relationship between viscosity and API and T is obtained by polynomial or exponential regression of the viscosity test data of a large number of crude oil samples at different temperatures. The advantages are simple form and fast calculation speed; the disadvantage is that the error is large when it exceeds the calibration range. The last two models, based on API and temperature, introduce crude oil component fractionation parameters to reflect the influence of heavy components. However, for asphaltene crude oil, saturated hydrocarbons, aromatic hydrogen, and resin content are also important influencing factors, which will be considered in the subsequent model establishment process.

Table 1.
Correlations to predict the viscosity of crude oil.
Both academia and oil companies are still actively researching the asphaltene deposition problem, and some studies have established a link between crude oil viscosity and asphaltene content [20]. Several experimental studies show that heavy oil viscosity is strongly influenced by the volume fractions, chemical structures, and physicochemical properties of its asphaltenes because asphaltenes are considered the heaviest and most polar components in crude oil [21,22]. As expected, viscosity increases significantly with asphaltene content due to strong attractions and aggregation between asphaltene particles at higher concentrations [23]. The conclusions are consistent with the conclusions of Mansour, especially for the extra-heavy or heavy crude oil.
Recently, a rheological study by Argillier et al. [24] found a strong correlation between asphaltene content and viscosity, with viscosity sharply increasing once asphaltene content surpassed a certain threshold. In addition, increased resin content decreased viscosity. Amy [25] estimated the effect of asphaltene and resin concentrations on the viscosity of heavy oil using seven heavy oil samples from various locations around the world. The results indicated that it was confirmed that asphaltene plus resin had a better correlation with viscosity, while there was no better correlation between viscosity and API gravity, asphaltene.
Experimental studies were conducted by Mahdi [26] to examine the impact of asphaltene characteristics on the rheological properties of crude oil, model viscosity behavior for heavy oil samples with asphaltene contents ranging from 0 to 12.22% at temperatures between 25 °C and 85 °C. The results indicated that viscosity increased exponentially with higher asphaltene content at a constant temperature. Lilian et al. [27] investigated the influence of asphaltene additives on the viscosity of crude oil by taking advantage of combining microscopic and macroscopic methodologies. It was confirmed that asphaltene removal caused a significant viscosity reduction. Experimental and modeling studies also indicated that asphaltene flocculation and aggregation played a key role in increasing crude oil viscosity.
An empirical viscosity correlation, which was a function of asphaltene content, oil density at operating temperature, oil gravity, oil molecular weight, and operating temperature, has been developed by Mansour by using nonlinear regression. Their proposed empirical correlation was based on measuring the viscosity of the 500 Egyptian moderate and light dead crude oil samples (12.36–22.79° API gravity). A 98.92% coefficient of determination has been recorded for the newly developed correlation, and the value revealed a perfect agreement between the measured and calculated viscosity from the new model. The literature also indicated a correlation between crude oil viscosity and the relative levels of compounds like saturates, aromatics, and resins [28]. Viscosity increases as the proportion of high-molecular-weight resins and asphaltenes rises [29,30,31].
Hernández [32] analyzed the relationship between viscosity and temperature, as well as the content of saturates, aromatics, resins, and asphaltenes, using 44 crudes from the Eastern Venezuela Basin. Analysis showed that crude oil viscosity increased as saturates decreased and aromatics, resins, and asphaltenes increased. Viscosity was more strongly dependent on saturates and asphaltenes than on aromatics and resins. Rashid [33] proposed a correlating parameter (CAPI) based on the compositional fractions (saturates, aromatics, resins, and asphaltenes) of heavy crude oil. The results indicated that this new parameter could predict viscosity more accurately. Malkin [34] carried out data analyses to estimate two correlations between viscosity and density, viscosity and saturates, aromatics, resins, and asphaltenes based on 21 crude oil samples, adopted from Fan [35]. The conclusion indicated that higher asphaltenes, resins, and aromatics increase viscosity, while higher saturates cause a sharp viscosity drop. However, the findings mentioned above did not form a uniform viscosity model between viscosity and chemical composition.
The aim of this paper is to establish a unified correlation to predict viscosity, making the results more reliable. Specifically speaking, 251 crude oil viscosity samples were collected from different fields, and the effect of API gravity, saturates, aromatics, resins, and asphaltenes on viscosity have been separately investigated by performing sensitivity analysis. With the help of the Levenberg–Marquardt (LM) algorithm and the universal global optimization (UGO) method, this paper proposes a new crude oil viscosity correlation that comprehensively considers API gravity and various crude oil components (such as saturates, aromatics, resins, and asphaltenes). Through the prediction and verification of the collected data and comparison with the existing correlations in the literature, the superiority of the new model in prediction accuracy and applicability is verified, demonstrating its potential in practical applications.
2. Experimental Data
2.1. Data Sources
In this work, 251 samples of heavy, moderate, and light dead crude oil samples were collected from the open literature for different fields around the world, such as Alaska (USA), Alberta (Canada), and Saudi Arabia. These crude oil properties include viscosity, API gravity, and the weights of saturates, aromatics, resins, and asphaltenes. It should be noted that the viscosity and API gravity of crude oil were measured at 288.15 K. The range of main parameters that were used to establish a general correlation of viscosity and the rest of the others are listed in Table 2.
Table 2.
Statistical data ranges collected for 251 crude oil samples.
2.2. Sensitivity Analyses
Sensitivity analyses were conducted to clearly understand the relationship between crude oil viscosity and key input parameters, such as API gravity, and the contents of saturates, aromatics, resins, and asphaltenes. It turned out that all the input variables were related to the viscosity, which was the output variable of the model (see Figure 1, Figure 2, Figure 3, Figure 4 and Figure 5).
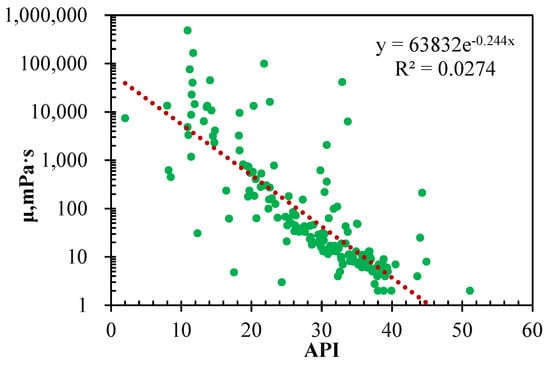
Figure 1.
Dependence of viscosity of crude oils on their API gravity.
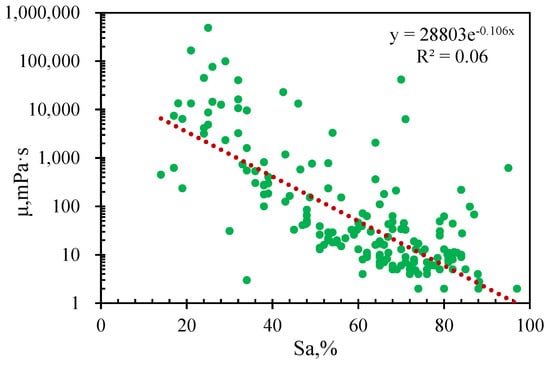
Figure 2.
Viscosity versus the content of saturates.
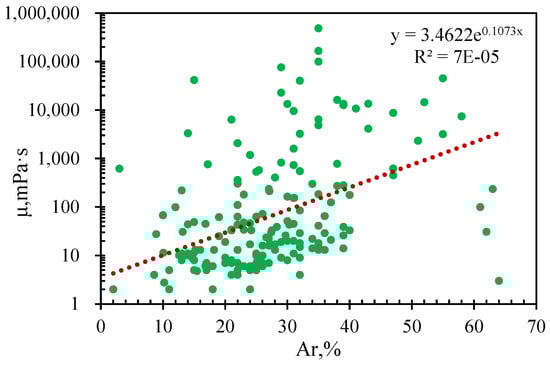
Figure 3.
Viscosity versus the content of aromatics.
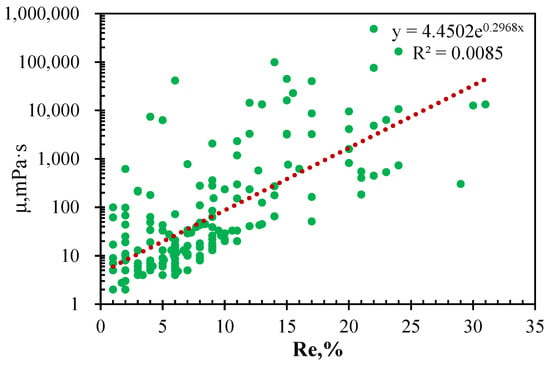
Figure 4.
Viscosity versus the content of resins.
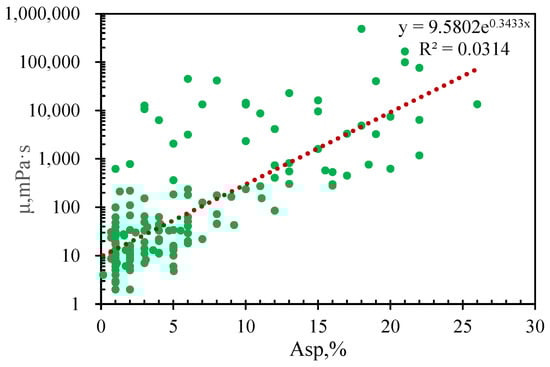
Figure 5.
Viscosity versus the content of asphaltenes.
Figure 1 illustrates the relationship between viscosity and API gravity for different crude oils at a constant temperature, showing that viscosity decreases as API gravity increases. It could be seen from the picture that there was a wide range of viscosity values when the API gravity was below 20°. At any given API gravity, viscosity can vary by 3–4 orders of magnitude. The empirical correlation suggests that heavy oil viscosity depends solely on API gravity and may not accurately predict crude oil viscosity. Thus, the next logical step is to link viscosity values to their chemical composition.
Published literature suggests that the chemical components influencing viscosity include saturates, aromatics, resins, and asphaltenes [36]. Figure 2 shows that viscosity decreases exponentially as saturate content increases. This is because saturates are nonpolar and consist of normal alkanes, branched alkanes, and cyclo-alkanes, which have a solvent effect on other components, leading to reduced viscosity. Furthermore, the analysis clearly showed that there was the same trend, and the viscosity, with the increment of API gravity, decreased faster than that caused by the increase of saturate content in Figure 2.
Figure 3 shows that crude oil viscosity increases exponentially with aromatic concentration; the same trend is also seen in Figure 4. This was due to the strong dipole-dipole interactions between aromatics and resins, which reduced the dispersion of aromatics on asphaltenes and increased heavy oil viscosity. Additionally, as resin content rises, internal friction among fluid molecules increases, further raising viscosity. Figure 5 illustrates that viscosity also increases exponentially with asphaltene content, as stronger attraction and aggregation of asphaltene particles at higher concentrations lead to a significant rise in viscosity.
From Figure 1, Figure 2, Figure 3, Figure 4 and Figure 5, we could conclude that the parameters of API gravity, saturate, aromatics, resins, and asphaltenes had a significant impact on viscosity. Specifically, as the API gravity and saturates content increased, the viscosity decreased exponentially, while as the content of aromatics, resins, and asphaltenes increased, the viscosity increased exponentially. Therefore, all key parameters should be considered when developing a new viscosity correlation. The fitting relationships and correlation coefficients for various input parameters are summarized in Table 3.
Table 3.
The fitting relationship and correlation coefficient of crude oil samples.
3. Results and Discussion
3.1. Description and Analysis of Existing Viscosity Empirical Models
As mentioned above, most of the empirical correlations proposed from several published literature have certain limitations. These empirical correlations use dead oil API gravity and absolute temperature as the sole parameters to predict dead oil viscosity. One of our objectives was to predict the value of crude oil viscosity utilizing the commonly empirical correlation. In doing so, several crude oil correlations, such as the correlations of Glaso, Emmanuel, Ghassan, Kartoatmodjo, and Petrosky, were selected to estimate the crude oil viscosity using the data in Table 2. The accuracy and performance of the above correlation were compared with experimental viscosity, and both graphical and statistical error analyses were conducted.
3.2. Graphical and Statistical Error Analysis
The performance of the correlations was compared by comparing measured and calculated viscosities. A detailed graphical and statistical error analysis was conducted to assess the viscosity results in Table 1. The viscosity prediction accuracy was evaluated using average absolute deviation (AAD), average absolute relative deviation (AARD), and relative mean square error (RMSE), calculated using the following equation [37].
where N means the total number of viscosity points, μcal and μexp indicate the viscosity for predicted and experiment data, cp, respectively.
To further evaluate the performance of existing empirical correlations, detailed graphical comparisons were made between viscosity values from various published correlations and experimental data. Cross plots of experimental versus calculated crude oil viscosity are shown in Figure 6, Figure 7, Figure 8, Figure 9 and Figure 10 to illustrate the graphical accuracy analysis. A zero-error line, which made a perfect match between measured and calculated data, was drawn on these plots so as to better evaluate the performance of various empirical correlations in a visual form.
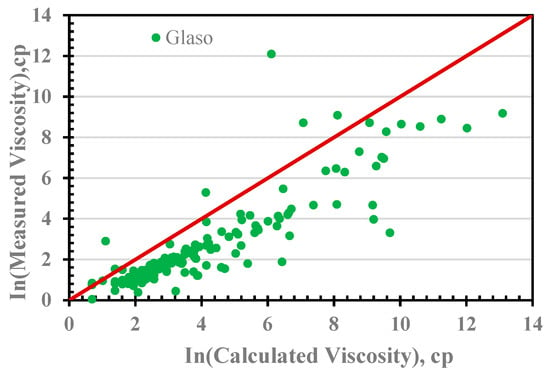
Figure 6.
Cross plot of ln(viscosity) with Glaso correlation.
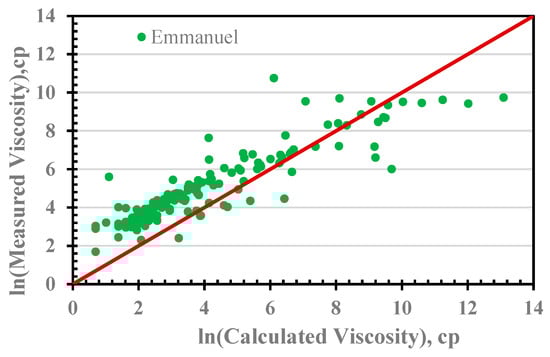
Figure 7.
Cross plot of ln(viscosity) with Emmanuel correlation.
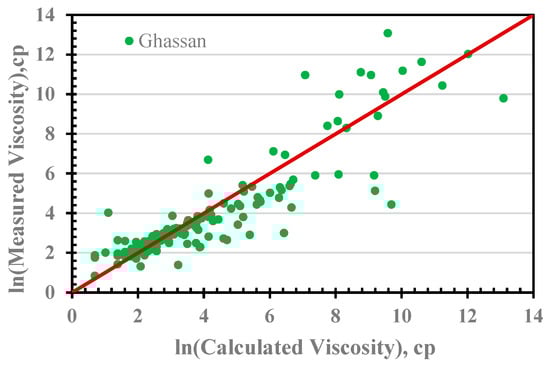
Figure 8.
Cross plot of ln(viscosity) with Ghassan correlation.
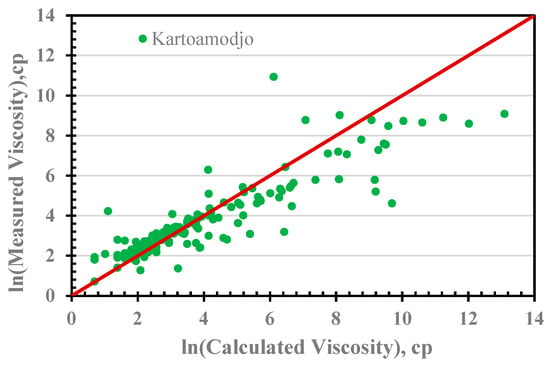
Figure 9.
Cross plot of ln(viscosity) with Kartoatmodjo correlation.
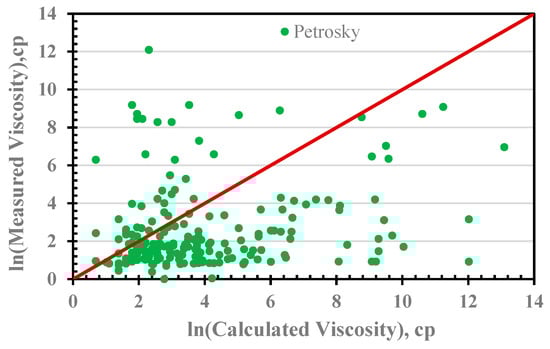
Figure 10.
Cross plot of ln(viscosity) with Petrosky correlation.
As can be seen from Figure 6, Figure 7, Figure 8, Figure 9 and Figure 10, the calculated viscosity values of these five crude oils had a poor fit to the experimental values within the given data range. Although the Ghassan correlation had the smallest prediction error and the calculated values were close to the experimental values, the overall prediction accuracy was still not ideal.
In order to more accurately quantify the difference between the predicted viscosity and the measured crude oil viscosity, the average absolute deviation, average absolute relative deviation, and the relative mean square error were estimated, respectively, and the calculation results were summarized in Figure 11. Analyzing the resulting errors reveals that the Ghassan correlation outperforms with the least average absolute deviation of 68.74%, average absolute relative deviation of 18.32%, and relative mean square error of 1.108 as compared with others. The Kartoamodjo correlation closely followed, with an average absolute relative deviation of 19.6%. Analyzing the reason, this is mainly because these viscosity expressions mainly depend on temperature and API gravity and do not fully consider the significant impact of crude oil components (such as saturated hydrocarbons, aromatic hydrocarbons, gum, and asphaltene content) on viscosity. Therefore, it is necessary to develop a viscosity prediction model that comprehensively considers API gravity, saturated hydrocarbons, aromatic hydrocarbons, gum, and asphaltene content to improve the accuracy of crude oil viscosity prediction.
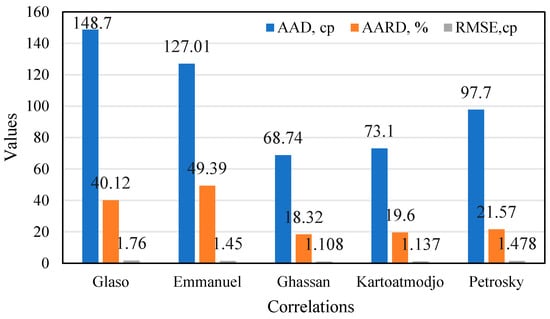
Figure 11.
The AAD, AARD and RMSE of five models.
3.3. Establishing a New Unified Crude Oil Viscosity Model
In this study, crude oil viscosity is modeled as a function of API gravity, saturates, aromatics, resins, and asphaltenes content. The LM and UGO methods [38,39] are used as a hybrid approach, combining local optimization with global search to predict the viscosity model. This method can avoid local optimal solutions while ensuring fast convergence and finding more suitable model parameters through global search. The specific steps are as follows:
Step 1: Development of a preliminary viscosity model.
Assume that crude oil viscosity μ was a nonlinear function of input parameters. The common form is as follows:
where μ is the crude oil viscosity, cp; API gravity is crude oil API gravity, °; Sa means the content of saturates, %; Ar means the content of aromatics, %; Re represents the content of resins, %; Asp means the content of asphaltenes, %; θ = [A,B,C,D,E,F,J,H,I,J,K] represents the parameter vector to be optimized.
Step 2: Optimization using the LM algorithm.
After the model was established, we optimized the nonlinear least squares problem using the Levenberg–Marquardt (LM) algorithm to fit the model parameters accurately. The LM algorithm achieves a dynamic balance between the Gauss–Newton method and the gradient descent method by adaptively adjusting the damping factor λ. Its core iterative formula is as follows:
where J is the Jacobian matrix of the residual vector r to the parameter θ, and λ is the dynamically adjusted parameter according to the trust region radius. The objective function at this stage is weighted least squares:
The weights wi are set according to the measurement error distribution to ensure the unbiasedness of parameter estimation.
Step 3: Introducing UGO algorithm.
Considering that LM is a local optimization method and may be trapped in a local optimal solution, we introduce the UGO algorithm (such as particle swarm optimization (PSO), genetic algorithm (GA), or simulated annealing (SA)) to develop a global search. The goal of UGO is to search the entire solution space and identify the global optimal solution. Its position update formula is as follows:
where c1 and c2 mean the acceleration constant; r1 and r2 are the random factors; Pbest,k is the best position; gbest,k is the particle table; and v represents the velocity of the particle. Adaptive inertia weight and constraint processing mechanisms are introduced. The objective function of this stage is expanded to the following:
The regularization term α controls the complexity of parameters and improves the generalization ability of the model; and LUGO and Lm are the objective functions of the UGO and LM algorithms, respectively.
Step 4: Optimization strategy of hybrid LM and UGO.
The strategy is essentially a two-stage optimization: UGO obtains the global approximate solution θ0, and LM performs local refinement. Specifically, a hybrid optimization process is used in this work. On the one hand, using the UGO algorithm (such as PSO or GA) is to find a suitable initial solution from a wider parameter space. On the other hand, the best solution obtained from UGO is used as the starting point, and the LM algorithm is used for local optimization to refine parameters and improve prediction accuracy.
The best regression expression was obtained using LM and UGO methods.
where
| A = 17.93 | B = −0.06 | C = −185,096 |
| D = −0.73 | E = −0.018 | F = 0.702 |
| G = 1.77 | H = 0.13 | I = −1.48 |
| J = 0.13 | K = −0.03 |
3.4. Evaluation of New Model
During the model validation process, the total data set was randomly divided into 202 crude oil viscosity training data and 49 measured data as test data. It should be noted that the data selection was random, and the 49 test data sets were not considered when establishing the viscosity correlation. Subsequently, the newly established model was used to predict the viscosity of crude oil and compared with the prediction results of the empirical correlation formula in the literature. Figure 12 shows a comparison between the predicted crude oil viscosity based on the training data and the measured viscosity.
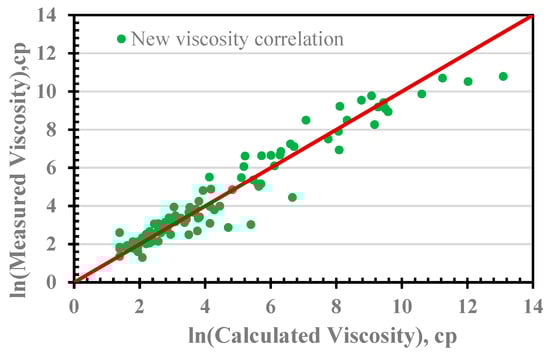
Figure 12.
Cross plot of ln(viscosity) with new viscosity correlation (Training).
Additionally, the AAD, AARD, and RMSE of empirical correlations from various studies were compared with the proposed model, as shown in Figure 13. The comparison results showed that the proposed model was superior to the empirical correlation of crude oil viscosity in the literature in terms of prediction accuracy.
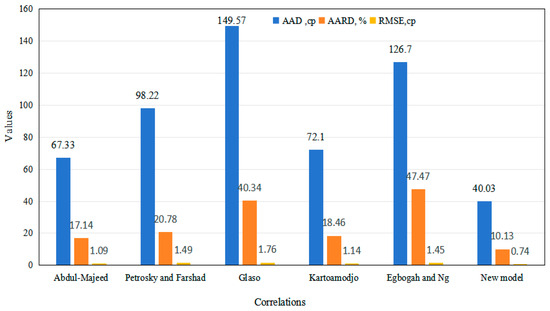
Figure 13.
The AAD, AARD and RMSE of six models (training).
The new model demonstrated the lowest AAD, AARD, and RMSE, with values of 40.03, 10.13%, and 0.74, respectively.
3.5. Model Validation
To assess the effectiveness and accuracy of the new model, the remaining 49 experimental crude oil viscosity data were compared with the prediction results of the existing crude oil viscosity correlation formula in the literature, and the result was shown in Figure 14. The figure shows that there is good consistency between the crude oil viscosity predicted by the test data and the measured values. In addition, the statistical results of the test data (validation set) were summarized in Figure 15, showing that the new model had the lowest AAD, AARD, and RMSE, which were 41.6, 12.4%, and 0.6, respectively. A thorough comparison of the prediction results for both the training and test data demonstrated that the new crude oil viscosity model accurately predicts viscosity.
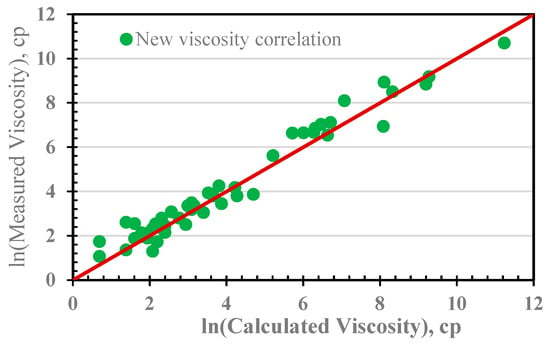
Figure 14.
Cross plot of ln(viscosity) with new viscosity correlation (Validation).
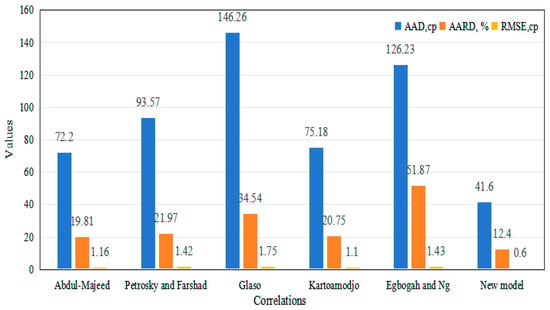
Figure 15.
The AAD, AARD and RMSE of six models (testing).
4. Conclusions
In this paper, the effects of API gravity, saturates, aromatics, resins, and asphaltene on crude oil viscosity were comprehensively considered, and a multivariate nonlinear regression model was established by using a mixed LM and UGO algorithm. In addition, 202 samples were used as training data sets, and 49 samples were used as independent test sets to systematically evaluate the model performance. The results show that the AAD, AARD, and RMSE predicted by the training set are 40.03, 10.13%, and 0.74, respectively. The error indexes corresponding to the test set were 41.6, 12.4%, and 0.6. Compared with the traditional empirical model, the new model shows significant advantages in the viscosity prediction of asphaltene crude oil. It is worth noting that the new model for waxy crude oil still needs to be improved, which may be due to the special rheological behavior of the wax-colloidal composite structure. The next step is to combine molecular simulation techniques to build a more general theoretical model for viscosity prediction.
Author Contributions
Methodology, T.J.; validation, X.G.; investigation, X.G. and Y.L.; data curation, Y.L.; writing—original draft, X.G.; writing—review and editing, X.G. All authors have read and agreed to the published version of the manuscript.
Funding
This research received no external funding.
Data Availability Statement
The figures and tables used to support the findings of this study are included in the article.
Conflicts of Interest
Authors Xiaodong Gao, Tianwen Jiang and Yang Li were employed by the SINOPEC Research Institute of Petroleum Engineering, Co., Ltd. The remaining authors declare that the research was conducted in the absence of any commercial or financial relationships that could be construed as a potential conflict of interest.
Nomenclature
| API gravity | American Petroleum Institute |
| Sa | Saturated, wt% |
| Ar | Aromatics, wt% |
| T | Temperature, °F |
| Re | Resins, wt% |
| Asp | Asphaltene, wt% |
| AAD | Average absolute deviation, cp |
| AARD | Average absolute relative deviation, % |
| RMSE | Root Mean Square Error, cp |
| μexp,i | Experimental value of dynamic viscosity, cp |
| μpre,i | Predicted value of dynamic viscosity, cp |
| LM | Levenberg–Marquardt |
| UGO | Universal global optimization |
| PSO | Particle swarm optimization |
| GA | Genetic algorithm |
| SA | Simulated annealing |
| ρOpertemp. | Oil density at operating temperature, gm/cc |
| SGc7+ | Specific gravity of C7+ components |
| MWci | Molecular weight of component Ci |
| μod | Dead oil viscosity, cp |
| C4, C5, C6, A, B...I | Empirical parameters |
| c1, c2 | Acceleration constant |
| r1, r2 | Random factor |
| Pbest | Best position |
| gbest | Particle table |
| v | Particle velocity |
| LUGO | UGO objective functions |
| Lm | LM objective functions |
| α | Regularization term |
References
- Abedini, R.; Abedini, A.; Eslami, Y.N. A new correlation for prediction of under saturated oil viscosity. Pet. Coal 2010, 52, 50–55. [Google Scholar]
- Daniyar, B.; Gaukhar, R.; Dinara, T. Comparison of measured and calculated high-viscosity crude oil temperature values in a pipeline during continuous pumping and shutdown modes. Int. J. Thermofluids 2024, 24, 100950. [Google Scholar]
- Osamah, A.; Mohammad, J.; Abullhaq, A.M.H. Heavy oil viscosity and density prediction at normal and elevated temperatures. J. Pet. Explor. Prod. Technol. 2016, 6, 253–263. [Google Scholar] [CrossRef]
- Alhamd, S.J.; Rashid, F.L.; Al-Obaidi, M.A.; Aldami, A.K. Unveiling crude oil viscosity and rheological Properties: An experimental comparison of Nano silica and Nano Molybdenum disulfide in Bazargan Oilfield. Fuel 2024, 381, 133698. [Google Scholar] [CrossRef]
- Nabeel, A.R.; Gholamreza, V.N.; Ibrahim, A.; Amin, F. A new correlation for prediction of viscosities of Omani Fahud-field crude oils. Adv. Model. Fluid Dyn. 2012, 293–300. [Google Scholar] [CrossRef]
- Zhao, Q.; Shi, Q.; AlHammadi, A.A. Viscosity Modeling of Heavy Crude Oil Using the Friction TheoryCombined with PC-SAFT. Energy Fuels 2023, 37, 10248–10256. [Google Scholar] [CrossRef]
- Beggs, H.D.; Robinson, J.R. Estimating the Viscosity of Crude Oil Systems. J. Pet. Technol. 1975, 27, 1140–1141. [Google Scholar] [CrossRef]
- Standing, M.B. Volumetric and Phase Behavior of Oil Filed Hydrocarbon Systems; Society of Petroleum Engineers: Richardson, TX, USA, 1977. [Google Scholar]
- Emmanuel, O.E.; Jack, T.N. An improved temperature-viscosity correlation for crude oil systems. J. Pet. Sci. Eng. 1990, 4, 197–200. [Google Scholar]
- Ghassan, H.A.M.; Riadh, R.K.; Naeema, H.S. New correlation for estimating the viscosity of undersaturated crude oils. J. Can. Pet. Technol. 1990, 29, 80–85. [Google Scholar] [CrossRef]
- Kartoatmodjo, T.; Schmidt, Z. Large data bank improves crude physical property correlations. Oil Gas J. 1994, 92, 51–55. [Google Scholar]
- Petrosky, G.E.; Farshad, F.F. Viscosity correlation for Gulf of Mexico crude oil. In Proceedings of the SPE Production Operations Symposium Oklahoma, Oklahoma City, OK, USA, 2–4 April 1995; pp. 249–258. [Google Scholar]
- Bennison, T. Prediction of Heavy Oil Viscosity. Presented at the 1998 IBC Heavy Oil Field Development Conference, London, UK, 2–4 December 1998. [Google Scholar]
- Elsharkawy, A.M.; Gharbi, R.B.C. Compressing classical and neural regression techniques in modeling crude oil. Adv. Eng. Softw. 2001, 32, 215–224. [Google Scholar] [CrossRef]
- Hossain, M.S.; Sarica, C.; Zhang, H.Q.; Rhyne, L.; Greenhill, K.L. Assessment and development of heavy-oil viscosity correlations. In Proceedings of the SPE International Thermal Operations and Heavy Oil Symposium, Calgary, AB, Canada, 1–3 November 2005; pp. 1–9. [Google Scholar]
- Alomair, O.; Elsharkawy, A.; Alkandari, H. Viscosity predictions of Kuwaiti heavy crudes at elevated temperatures. In Proceedings of the SPE Heavy Oil Conference and Exhibition, Kuwait city, Kuwait, 12–14 December 2011; pp. 1–18. [Google Scholar] [CrossRef]
- Felipe, S.M.; Gabriela, S.R.; Jorge, A.; Gustavo, M. Comparison of correlations based on API gravity for predicting viscosity of crude oils. Fuel 2014, 138, 193–199. [Google Scholar]
- Mansour, E.M.; Desouky, S.M.; Aily, M.E.; Helmi, M.E. The effect of asphaltene content on predicting heavy dead oils viscosity: Experimental and modeling study. Fuel 2018, 212, 405–411. [Google Scholar] [CrossRef]
- Abdulrahim, K.; Osamah, A.; Adel, E. Measurements and predictions of Middle Eastern heavy crude oil viscosity using compositional data. J. Pet. Sci. Eng. 2019, 173, 990–1004. [Google Scholar]
- Hénaut, I.; Barré, L.; Argillier, J.F.; Brucy, F.; Bouchard, R. Rheological and structural properties of heavy crude oils in relation with their asphaltenes content. In Proceedings of the SPE International Symposium on Oilfield Chemistry, Houston, TX, USA, 13–16 February 2001. [Google Scholar] [CrossRef]
- Sunil, L.K.; Selim, G.S. Asphaltenes: The cholesterol of petroleum. In Proceedings of the Middle East Oil Show, Manama, Bahrain, 11–14 March 1995. [Google Scholar] [CrossRef]
- Mohammad, T.; Sai, R.P.; Vahid, T.; Mahmoud, R.P.; Walter, G.C. Understanding the polydisperse behavior of asphaltenes during precipitation. Fuel 2014, 117, 206–217. [Google Scholar]
- James, H.G.; James, H.H.; Mark, J.K.; David, G. Petroleum refining technology and economics. In Petroleum Engineering Book; CRC Press: Boca Raton, FL, USA, 2007. [Google Scholar] [CrossRef]
- Argillier, J.F.; Barre, L.; Brucy, F.; Dournaux, J.L.; Hénaut, I.; Bouchard, B. Influence of Asphaltenes Content and Dilution on Heavy Oil Rheology. In Proceedings of the SPE International Thermal Operations and Heavy Oil Symposium, Porlamar, Venezuela, 12–14 March 2001. [Google Scholar] [CrossRef]
- Amy, H.; Eun-Jae, S.; Matthew, W.L.; Andrew, M.H.; Mike, B. Correlating the chemical and physical properties of a set of heavy oils from around the world. Fuel 2008, 87, 3065–3070. [Google Scholar]
- Mahdi, G.; Mohammad-Javad, S.; Ahmad, R.S.A. Effects of Asphaltene Content and Temperature on Viscosity of Iranian Heavy Crude Oil: Experimental and Modeling Study. Energy Fuels 2013, 27, 7217–7232. [Google Scholar]
- Lilian, P.; Lia, B.S.B.; Nelson, O.R. Role of Asphaltenes and Additives on the Viscosity and Microscopic Structure of Heavy Crude Oils. Energy Fuels 2016, 30, 3644–3651. [Google Scholar]
- Speight, J.G. The Chemistry and Technology of Petroleum; CRC Press: Boca Raton, FL, USA, 2006. [Google Scholar] [CrossRef]
- Pierre, C.; Barré, L.; Pina, A.; Moan, M. Composition and Heavy Oil Rheology. Oil Gas Sci. Technol. 2004, 59, 489–501. [Google Scholar] [CrossRef]
- Luo, P.; Gu, Y. Effects of asphaltene content on the heavy oil viscosity at different temperatures. Fuel 2007, 86, 1069–1078. [Google Scholar] [CrossRef]
- Sheu, E.Y.; De-Tar, M.M.; Storm, D.A. Rheological properties of vacuum residue fractions in organic solvents. Fuel 1991, 70, 1151–1156. [Google Scholar] [CrossRef]
- Hernández, M.E.; Vives, M.T.; Jean, P. Relationships among viscosity, composition, and temperature for two groups of heavy crudes from the Eastern Venezuelan Basin. Org. Geochem. 1983, 4, 173–178. [Google Scholar] [CrossRef]
- Rashid, S.A.; Omar, H.; Sabah, A.A. New correlating parameter for the viscosity of heavy crude oils. Energy Fuels 2006, 20, 2586–2592. [Google Scholar] [CrossRef]
- Malkin, A.Y.; Rodionova, G.; Simon, S.; Ilyin, O.; Arinina, M.P.; Kulichikhin, V.G.; Sjöblom, J. Some Compositional Viscosity Correlations for Crude Oils from Russia and Norway. Energy Fuels 2016, 30, 9322–9328. [Google Scholar] [CrossRef]
- Fan, T.; Wang, J.; Jill, S.B. Evaluating Crude Oils by SARA Analysis. In Proceedings of the SPE/DOE Improved Oil Recovery Symposium, Tulsa, OK, USA, 13–17 April 2002. [Google Scholar] [CrossRef]
- Argillier, J.-F.; Coustet, C.; Henaut, I. Heavy oil rheology as a function of asphaltene and resin content and temperature. In Proceedings of the SPE International Thermal Operations and Heavy Oil Symposium and International Well Technology Conference, Calgary, AB, Canada, 4–7 November 2002. [Google Scholar] [CrossRef]
- Yisa, A. Mathematical modelling of oil viscosity at bubble point pressure and dead oil viscosity of Nigerian crude. In Proceedings of the SPE Nigeria Annual International Conference and Exhibition, Lagos, Nigeria, 5–7 August 2019. [Google Scholar] [CrossRef]
- Izmailov, A.F.; Solodov, M.V.; Uskov, E.I. A globally convergent Levenberg–Marquardt method for equality-constrained optimization. Comput. Optim. Appl. 2019, 72, 215–239. [Google Scholar] [CrossRef]
- Fischer, A.; Izmailov, A.F.; Solodov, M.V. The Levenberg–Marquardt method: An overview of modern convergence theories and more. Comput. Optim. Appl. 2024, 89, 33–67. [Google Scholar] [CrossRef]


Disclaimer/Publisher’s Note: The statements, opinions and data contained in all publications are solely those of the individual author(s) and contributor(s) and not of MDPI and/or the editor(s). MDPI and/or the editor(s) disclaim responsibility for any injury to people or property resulting from any ideas, methods, instructions or products referred to in the content. |
© 2025 by the authors. Licensee MDPI, Basel, Switzerland. This article is an open access article distributed under the terms and conditions of the Creative Commons Attribution (CC BY) license (https://creativecommons.org/licenses/by/4.0/).