Article

Mathematical Modeling and Dynamic Simulation of a Tower Reactor for Intensified Ethanol Fermentation with Immobilized Yeasts and Simultaneous Gas Removal

1
Department of Engineering and Forestry Technology, Federal University of Paraná (UFPR), Curitiba 80210170, PR, Brazil
2
Department of Food, Federal Institute of Education, Science and Technology of São Paulo (IFSP), Matão 15991502, SP, Brazil
3
School of Pharmaceutical Sciences, São Paulo State University (UNESP), Araraquara 14800903, SP, Brazil
*
Authors to whom correspondence should be addressed.
Processes 2025, 13(4), 1122; https://doi.org/10.3390/pr13041122
Submission received: 9 March 2025 / Revised: 30 March 2025 / Accepted: 1 April 2025 / Published: 8 April 2025

Abstract

:
A mathematical model was developed for the dynamic and static simulation of a continuous ethanol production process in a tower bioreactor packed with yeast cells immobilized in citrus pectin gel. To avoid accumulation of CO2 gas during the bioprocess, a vertical fixed bed bioreactor with a working volume of 0.245 L, divided into four stages and equipped with external gas–liquid separators was used. The performance of the bioreactor was evaluated through continuous fermentations using feed medium (sugarcane juice) with substrate concentrations of 161.4 and 312.5 g/L, temperature of 30 °C, pH 4.0 and hydraulic residence times of 5 and 6 h. The developed mathematical model takes into account mass flow by convection and dispersion axial, external and internal mass transfer to/within particle, Contois kinetics for cell growth with inhibition terms, cell death, and substrate consumption for cell maintenance. The partial differential equations regarding cell, substrate and product mass balances in the solid and fluid phase were solved by numerical methods. The calculated profiles of state variables in the fluid phase agreed satisfactorily with the experimental data. The diffusional resistances within particles concerning the substrate consumption rate were not significant, resulting in calculated values of the effectiveness factor close to one.

1. Introduction

Scientists and engineers have always strived to develop techniques and technologies, leading to the intensification of all technological processes. The aim is to develop production technologies for substantial enhancements in chemical and biochemical processing. Among the various strategies for process intensification, one can cite (i) cascading or compartmentalization of reaction zones integrated with simultaneous removal devices of undesirable components (e.g., inhibitors) in the same equipment; (ii) continuous operation mode; (iii) immobilization of the biocatalyst [1,2,3].
Cell immobilization is a technique that has been tested during the development of various bioprocesses, especially those continuous processes in which high density and cell retention, better productivity, and non-contamination are desired [4,5,6]. The practical application of immobilized cell systems on an industrial scale requires the use of an appropriate bioreactor type [5,7,8] whose choice will depend on several factors, including energy and mass transfer requirements (supply and removal of gases and heat), diffusional resistances (inside and outside the particle), particle characteristics (size, density, concentration, and mechanical damage sensitivity), kinetic aspects (average reaction rate, inhibition effects), hydrodynamic considerations (flow pattern and mixing degree), and others [5].
Among the various types of existing bioreactors, the packed bed reactor is the most frequently used type of immobilized cell reactor, due mainly to its advantage of being operated continuously, with high cell density and without the need for cell separation [5,9]. Depending on the superficial velocity of fluid flowing under the up-stream flow regime through the bioreactor, the particle bed can be maintained as fixed or fluidized. The ideal hydrodynamic behavior expected for fixed bed reactors is that of the plug flow reactor (PFR), in which the superficial velocity profile of fluid is perfectly flat over the reactor’s cross section and back-mixing does not occur. Fluidized bed reactors provide a degree of intermediate mixing between the two extremes of the PFR and CSTR (Continuous Stirred Tank Reactor). Both types of reactors (fixed and fluidized bed reactors) present specific advantages and drawbacks as extensively cited by several authors [5,9,10,11,12].
Ethanol is one of the most attractive alternative fuels due to several environmental issues, and can be used either pure or blended with gasoline in flex fuel vehicles [13,14,15]. Although the industrial production of ethanol is commonly performed using the classical Melle–Boinot process (cell-reuse fed-batch fermentation), new technologies have been developed aiming at maximizing ethanol productivity and minimizing production costs [9,15,16,17]. The main technological innovations in alcoholic fermentation consisted of the development of continuous processes conducted with free cells in cascades of four to six CSTRs in series, or with natural or artificially immobilized cells in fixed bed tubular (tower) reactors [10,11,13,15,16,17,18,19,20,21]. The first innovation has already been consolidated and even implemented in several industrial units, while the second is still under full development for industrial application [15].
High cell densities in fixed bed tower reactors can be achieved by immobilizing cells in a variety of support materials, including polymeric gels (pectin, carrageenan, and calcium alginate) and others [10]. From this viewpoint, citric pectin from orange processing residues becomes a very attractive support material for cell immobilization due to its low cost and abundance.
Under ethanol fermentation conditions, a fixed-bed tower reactor is often subject to the accumulation of stagnant pockets of CO2 gas, which, if not removed, cause various undesired problems, such as the formation of dead and high hydrostatic pressure zones that, in turn, cause gel abrasion or rupture, and liquid back-mixing and channeling [5,10,11,22]. Thus, to allow the scale up of this bioprocess, the problems caused by CO2 gas formed during the fermentation reaction need to be minimized or eliminated.
To remove CO2 gas from the particle bed as quickly and quantitatively as possible, special bioreactor designs have been developed, including rotating packed drum reactors [18], horizontal packed bed bioreactors [10], horizontal rotating tubular bioreactors [23], rotating fiber disc fermenters [9], fixed-bed tower bioreactors with multiple internal stages, and external gas–liquid separators, such as that used in this present study. It is known that efficient gas removal is achieved when operating a tower type bioreactor equipped with such separation devices, which contribute to the bioreactor’s stable operation, with high ethanol productivity.
Integration of reaction and separation operations by product removal from the zone where the biotransformation occur, as well as the use of immobilized biocatalysts, are different forms of process intensification, a current concept in process synthesis, whose objective is the development of smaller, more cost-effective and environmentally friendly processing plants than the ones currently in use [1,2,3,24].
For the efficient design, optimization, and control of fixed bed bioreactors, accurate and reliable mathematical models are necessary [25]. The development of such models has been relatively slow and the models available are both mathematically complex and unreliable [25]. Therefore, it is necessary to balance the model’s complexity with the experimental and computational efforts required for its identification and build models that are as simple as possible, yet capable of accurately describing the fermentation process [14]. The class of mathematical models that satisfies such prerequisites is formed by simply applying the unsegregated and unstructured approach, through which the description of the quantity and properties of the biomass is performed by using a unique variable—the cell concentration expressed as mass or number of cells per volume [14,26]. Generally, such models combine an acceptable description of the system with a reasonable mathematical complexity and a smaller number of parameters [14,26].
In the modeling of immobilized cell systems, besides the inhibitory effects of substrate and product that are traditionally incorporated into classical Monod kinetics, the effects of other important phenomena occurring in heterogeneous fixed-bed catalytic reactors must be also included, such as diffusion external and internal to/within the particle, and transport of solutes (substrate, product, and others) through the reactor by convection and axial dispersion of the liquid phase [4,6,11,19,22,25,27,28,29].
Although almost all ethanol production in Brazil directly or indirectly uses sugarcane as feedstock, the advantages of the continuous process, as well as the mathematical models available in the literature for alcoholic fermentation, are equally valid for other fermentable feedstocks, including lignocellulosic compounds extracted from vegetable biomass for second-generation ethanol production [14,17,24,30,31,32,33].
The objective of this study was to develop a phenomenological mathematical model to predict the dynamic and static behavior of a fixed bed tower reactor, packed with particles containing immobilized yeast cells for continuous ethanol production with simultaneous CO2 gas removal, under different operating conditions. The model is based on the description of the main aspects of the fermentation system (reaction kinetics, bioreactor hydrodynamics, and intra- and inter-phase mass transfer), consisting of a set of partial differential equations representative of the cell, substrate and ethanol mass balances within the particles, as well as in the fluid phase along the bioreactor’s axial direction.

2. Materials and Methods

2.1. Experimental Data

The experimental data used in this study were obtained by operating the experimental system shown schematically in Figure 1. The fixed bed tubular reactor consists of four stages and three external gas–liquid separators connected to the solenoid valves through which the CO2 gas is exhausted. Inside the separators, there is an automatic liquid level control mechanism analogous to a float valve system in conjunction with inductive proximity sensors that open and close the solenoid valves. The reactor and the separators were kept submerged in a thermostatic water bath heated by electrical resistance. Saccharomyces cerevisiae yeast cells were immobilized on citrus pectin gel, resulting in an initial cell concentration within the particle of 21.0 g/L. Sugarcane juice was continuously fed into the reactor bottom. The fermentation tests performed made it possible to obtain the axial profiles of product and substrate concentration during the transient and stationary states for two feed volumetric flow rates (40.0 and 49.4 mL/h), two concentrations of substrate in the feed stream (161.4 and 312.5 g/L), pH 4.0 and a temperature of 30 °C. These substrate concentration levels were chosen with the aim of investigating different intensities of substrate inhibition on yeast metabolism, with 161.4 g/L being the substrate concentration level that exerts the lowest inhibitory effect, while 312.5 g/L exerts the highest inhibitory effect. These substrate concentration levels were represented by LC and HC, respectively.
The substrate and ethanol concentrations were determined by chromatographic methods (HPLC, High Performance Liquid Chromatography, and GC. Gas Chromatography), respectively. To determine the initial concentration of viable cells within the particles, yeast cells were first released from the immobilization gel using a 5% EDTA solution, which was mixed with a known mass of pellets and shaken at 30 °C until the gel was completely dissolved. Then, viable cell counting was performed in a Neubauer chamber using the methylene blue staining method, observing under a microscope the number of unstained cells (viable cells).

2.2. Mathematical Modeling

The mathematical model of the bioprocess includes the models of solid (particles) and fluid (liquid) phases in the bioreactor:

2.2.1. Solid Phase Model

The mathematical model of the solid phase comprises the mass balances of viable cells, ethanol and substrate within the catalytic particles, which take into account the phenomena of internal simultaneous diffusion and reaction, in addition to the external film diffusion at the particle surface. Assuming a spherical geometry for the particle, the mass balance equations are given by Equations (1)–(3). In Equation (1), the diffusion term is absent because the cells are immobilized in the gel matrix:
  • Mass balance of cells
c X t = μ X c X r d
  • Mass balance of substrate
c S t = D S R P 2 1 ξ 2 ξ ξ 2 c S ξ μ S c X
  • Mass balance of product (ethanol)
c P t = D P R P 2 1 ξ 2 ξ ξ 2 c P ξ + μ P c X
The initial and boundary conditions for Equations (1)–(3) are as follows:
t = 0 :                       c X = c X i = 21.0     g / L     ;     c S = 0     ;     c P = 0
ξ = r / R P = 0 :           c S ξ = 0     ;     c P ξ = 0
ξ = r / R P = 1 :               D S R P c S ξ = k m S   ( C S c S sup )     ;   D P R P c P ξ = k m P   ( c P sup C P )
In boundary conditions set by Equation (5), it is assumed that diffusion occurs symmetrically from all directions; hence substrate and product concentration profiles are flat at the particle center point (symmetry condition). Boundary conditions given by Equation (6) represent the continuity of mass flux at the particle surface, i.e., the convective flux is equal to the diffusive flux at this boundary.
The model proposed to describe the specific rate of cell growth (Equation (7)) incorporates effects well known in alcoholic fermentation using immobilized cells, such as limitation by substrate and inhibition due to substrate, ethanol, and the biomass itself [14]. The variable saturation term K M c x was initially proposed by Contois as a first approximation to describe diffusional limitations present at high cell densities. The term c s 2 / K I , derived from Haldane enzyme kinetics by Andrews, accounts for substrate inhibition and was introduced in the equation of μ x due to the high feed substrate concentrations used in the continuous fermentation tests. The linear cell-concentration inhibitory term was included because, at high cell concentrations, growth and metabolism conditions are less favorable due to space and mass-transfer limitations, and cell interaction [14,34]. The exponential term is one among several empirical expressions available to describe the ethanol inhibition effect on both cell growth and product formation [14,26,34]. Another important phenomenon to be considered when modeling immobilized cell systems is cell death caused by various factors. The overall death rate ( r d ) is generally described by first-order kinetics, as given by Equation (8) [14].
μ X = μ max c S K M c X + c S + c S 2 / K I 1 c X c X   e K P C P
r d = k d c X
The specific substrate consumption rate ( μ s ) is given by the Pirt model [35], according to which the substrate provides simultaneously energy for both cell growth and maintenance:
μ S = μ X Y X / S + m
The specific ethanol production rate ( μ p ) is given by the Luedeking–Piret model, characterized by its two parameters α and β, which are, respectively, related to the ethanol production associated and not associated with cell growth [14,36]:
μ P = Y P / S Y X / S α μ X + m Y P / S β
The internal and external mass transfer coefficients of the diffusing species (substrate and product) were estimated according to the following correlations [29,37]:
D S   ( d m 2 / h ) = 2.142 × 1 0 4 e 0.002 C s
D P   ( d m 2 / h ) = 3.513 × 1 0 4 e 0.002 C s
k m j = J d u s S c j 2 / 3 ;   j = S , P
In Equations (11)–(13):
J d = 1.82   R e 0.51 ,   R e = d P u s ρ f μ f ,   and   S c = μ f ρ f D j .
The correlation adopted for J d is based on the general form J d = K R e 1 n , in which K and n are adjustable parameters and the value of n varies from 0.1 to 1.0 [29]. Some combinations of values reported for these parameters are K = 1.625 for n = 0.49 and K = 5.7 for n = 0.22 [29].

2.2.2. Fluid Phase Model

Since the cells are immobilized in the solid phase, the mathematical model of the fluid phase comprises only the ethanol and substrate mass balances. These balances are one-dimensional in the z direction and incorporate an axial dispersion model for the hydrodynamics of the bioreactor and solid–liquid interphase mass transfer. Radial dispersion was neglected because the ratio of the bioreactor diameter to its length is very small.
The axial dispersion term was included because the operation of the external gas-liquid separators causes back-mixing within the packed bed and, thus, the behavior of the plug flow reactor cannot be assumed. As a consequence, liquid phase transport of substrate and product through the bioreactor is described by a combination of convection and axial dispersion mechanisms. Moreover, the axial dispersion term also accounts for the diffusive flow that occurs superimposed on convective and dispersive flows. Different approaches are found in the literature for the mathematical formulation of the axial dispersion term, the most consistent being that presented by Blanch and Clark [38] when they modeled a chromatographic column, taking into account that, in packed beds, mass balances must be applied to a fluid phase volume element corresponding to ε·dV, where ε is the bed porosity. Thus, the following equations represent the mass balances of substrate and product (ethanol) in the fluid phase:
  • Mass balance of substrate
C S t = D z ε L 2 2 C S λ 2 u i L C S λ r S
  • Mass balance of product (ethanol)
C P t = D z ε L 2 2 C P λ 2 u i L C P λ + r P
The rates of substrate consumption ( r S ) and product formation ( r P ) are respectively given by
r S = 1 ε ε k m S ( C S c S sup ) a = 1 ε ε η ( r ^ S ) sup
r P = 1 ε ε k m P ( c P sup C P ) a = 1 ε ε Y P S   η ( r ^ S ) sup
In Equations (16) and (17), a is the interfacial area of the particle defined as the ratio between its surface area (AP) and its volume (VP), i.e., a = AP/VP. Such equations represent pseudo steady-state mass balances for substrate and product over the particle, i.e., the rate of diffusion from/to bulk liquid is equal to the rate of consumption/formation by reaction within the particle, remembering that, in a differential slice of a packed bed reactor, the bulk fluid exists only in a fraction ε of the volume, while catalyst particles occupy a fraction (1 − ε) of this volume [36].
The effectiveness factor (η), a parameter generally ranging from 0 to 1 that indicates how much diffusion resistance controls the rate of substrate consumption within the particle [39], is defined as the average rate of substrate consumption inside the particle divided by the rate evaluated in the surface substrate concentration, according to Equation (18) [40,41,42]:
η = 0 V P r ^ S d V 0 V P ( r ^ S ) sup d V = 3 0 1 r ^ S ξ 2 d ξ ( r ^ S ) sup
The initial conditions in the bioreactor are
t = 0 :           C P = 0     ;     C S = 161.4   g / L     or   312 . 5   g / L
The boundary conditions are those first stated by Danckwerts, which are known as the classical Danckwerts boundary conditions for closed–closed vessels, i.e., axial dispersion does not occur at the pre- and post-reactional imaginary sections [43]:
λ = z / L = 0 :         u i C S 0 = u i C S ( 0 + ) D z ε L C S ( 0 + ) λ     ;     0 = u i C P ( 0 + ) D z ε L C P ( 0 + ) λ
λ = z / L = 1 :     C S λ = 0     ;     C P λ = 0
Equation (20) states that, at the entrance of the reactor, the feed mass flow is partitioned in two superimposed contributions: convective and diffusive–dispersive parts. Equation (21) establishes that dispersion and reaction do not occur from the reactor’s exit, making the substrate and product downstream concentrations constant.
To estimate the axial dispersion coefficient ( D a x ) , the following equation was used:
D z ε = D a x = F D   u i d P
In Equation (22), F D is a parameter that incorporates the bed porosity (ε), which was determined to be equal to 5.33.
The above equation is based on the graphic presented by Levenspiel [41], in which the dimensionless group D a x ε / u i d P (dispersion number based on particle diameter) is approximately constant (≅1.6) in a wide range of Reynolds numbers for liquids flowing with interstitial velocity   u i = ( u S / ε ) in packed beds with particles of diameter   d P . Thus, the determined value of F D corresponds to 1.6/0.3, with 0.3 being a representative value for the bed porosity.

2.3. Numerical Methods

The model of the particle (solid phase) and the fluid phase are coupled through the mass transfer term between the phases when t = 0 or through the effectiveness factor when t > 0. The bioprocess full model is nonlinear, distributed and represented by a system of partial differential equations that requires spatial discretization followed by numerical integration of the resulting ordinary differential equations to obtain the state variable values over time (method of lines). The spatial discretization method used was that of orthogonal collocation, which has often been applied for solving complex problems in (bio)chemical reactor engineering [44,45]. In this method, orthogonal polynomials are used to build a solution to the differential equation. There are two types of polynomials that are often used to solve diffusion–dispersion–reaction problems in distributed parameter systems: Jacobi (used for problems with symmetry, such as calculations of intraparticle concentration profiles) and shifted Legendre polynomials (used for problems without symmetry, such as calculations of concentration profiles along the reactor) [44]. The Jacobi polynomials are generically represented by Pn (σ,δ), where σ and δ are characteristic parameters of the polynomial, which are also the indices of the weighting function for the orthogonality conditions, and n is the degree or order of the polynomial [45]. Legendre polynomials are a special case of Jacobi polynomials, as reported by Rice and Do [45]. The roots for the Jacobi and Legendre polynomials correspond to the coordinates of the collocation points over the radial (particle) and axial (reactor) domains. It is imperative that the differential equations be satisfied at the collocation points. Therefore, the solution function and its derivatives at the collocation points need to be evaluated, thus generating the so-called collocation matrices [44].
The collocation matrices for the particle were obtained using Jacobi polynomials with σ = 1 and δ = 1/2 and shifted Legendre polynomials were used for the bioreactor with σ = 0 and δ = 0. Four internal collocation points were used in both the particle and the reactor. The values for the state variables at the external points, corresponding to the center (ξ = 0) and the particle surface (ξ = 1) and the entrance = 0) and the exit (λ = 1) of the reactor, were calculated from the boundary conditions, and the values of the solution and its first derivative at the internal collocation points.
A variable-step fourth-order Runge–Kutta–Gill method was used for the numerical integration of the ordinary differential equations resulting from the spatial discretization procedure [44].
For the calculation of the integral involved in determining the effectiveness factor (η), the Radau quadrature formula was used with the weights obtained for spherical geometry using Jacobi polynomials, with σ = 0 and δ = 1/2. Table 1 shows the location of the collocation points in the particle, in the reactor, and the weights of the Radau quadrature.
All calculations were carried out using the FORCE (FORTRAN Compiler and Editor) 2.0 free distribution software.

2.4. Kinetic and Yield Parameter Estimation

The proposed mathematical model contains nine kinetic and yield parameters that need to be estimated prior to model verification. The Y P / S coefficient was estimated from a mass macrobalance of ethanol over the bioreactor. A similar procedure was not applied to estimate the Y X / S coefficient because the cells were immobilized in the solid phase and, consequently, cell concentration data in the fluid phase were not available.
A method to simultaneously optimize the model parameters was not applied due to the model complexity, which makes this task difficult. However, as a first approximation, the remaining parameters, except the maintenance coefficient (m), were estimated from literature data and their values were set respecting the variation boundaries reported for these parameters, as provided by the references presented in Table A1. To estimate the maintenance coefficient (m), this parameter was varied within a determined range, while the others were kept constant (univariate method), then selecting the values that provided the best fits for the mathematical model.
Thus, using the proposed strategies it was possible to assign characteristic values to all model parameters, which are presented in Table 2. Although they are non-optimized estimates, they allow a first approximation of model behavior against the experimental data.

3. Results and Discussion

3.1. Bioprocess Start-Up

Some precautions were taken regarding the initial conditions of the bioprocess, assigning null values in the computational program for the substrate and ethanol accumulation rates and for the rate of substrate consumption within the particle at the beginning of the bioprocess. As a result, the effectiveness factor becomes indeterminate at this instant, because a 0/0 division occurs due to the zero reaction rates inside and at the surface of the particle. Since the rates of substrate consumption and ethanol production in the fluid phase are given as a function of the effectiveness factor and the surface reaction rates, it was necessary to assign a value for η and the initial choice was zero. As such, the rates of substrate consumption and ethanol production in the fluid phase would be zero. Subsequent considerations indicated that the hypothesis of no substrate consumption in the fluid phase at the initial instant is unrealistic, because at this instant there is a mass flow from the liquid phase to the particle surface given by k m S a C S c S s u p 1 ε / ε , being C S = C S O and c S s u p = 0 at t = 0. Thus, at the initial time, the computational program was instructed to not calculate the terms of substrate consumption and ethanol formation in the fluid phase using the effectiveness factor, but rather by using the equations k m S a C S c S s u p 1 ε / ε and k m p a c P s u p C P 1 ε / ε , respectively. Once this problem was solved, the question regarding the value of the effectiveness factor at the initial instant remained, since, at this instant, η = 0/0, a mathematical indetermination. The non-application of the definition of the effectiveness factor at t = 0 was considered as the best solution for this question, since, at this instant, the reaction rate is zero both at the surface and inside the particle, making the value of η undefined.
From this discussion of the beginning of the process, it is clear that this instant is difficult to model and subject to several propositions.

3.2. Bioreactor Simulation

The simulation of the bioreactor was performed using the parameters and operating conditions presented in Table 2. A preliminary aspect investigated was the value adopted for the initial substrate concentration within the particle. Using c s i = C S O as initial condition, it was verified that the values of the state variables c X ,   c S ,   c P ,   C S ,   C P in steady state were the same as those obtained when using c s i = 0   as initial condition. A third value c s i = c s 0 / 2   was also used, again obtaining the same previous results. This shows that the system does not present multiple steady states as verified in other fermentation systems, such as chemostat with substrate inhibition described by the Andrews’ model, for which it is possible for two steady states to exist at the same dilution rate [38].
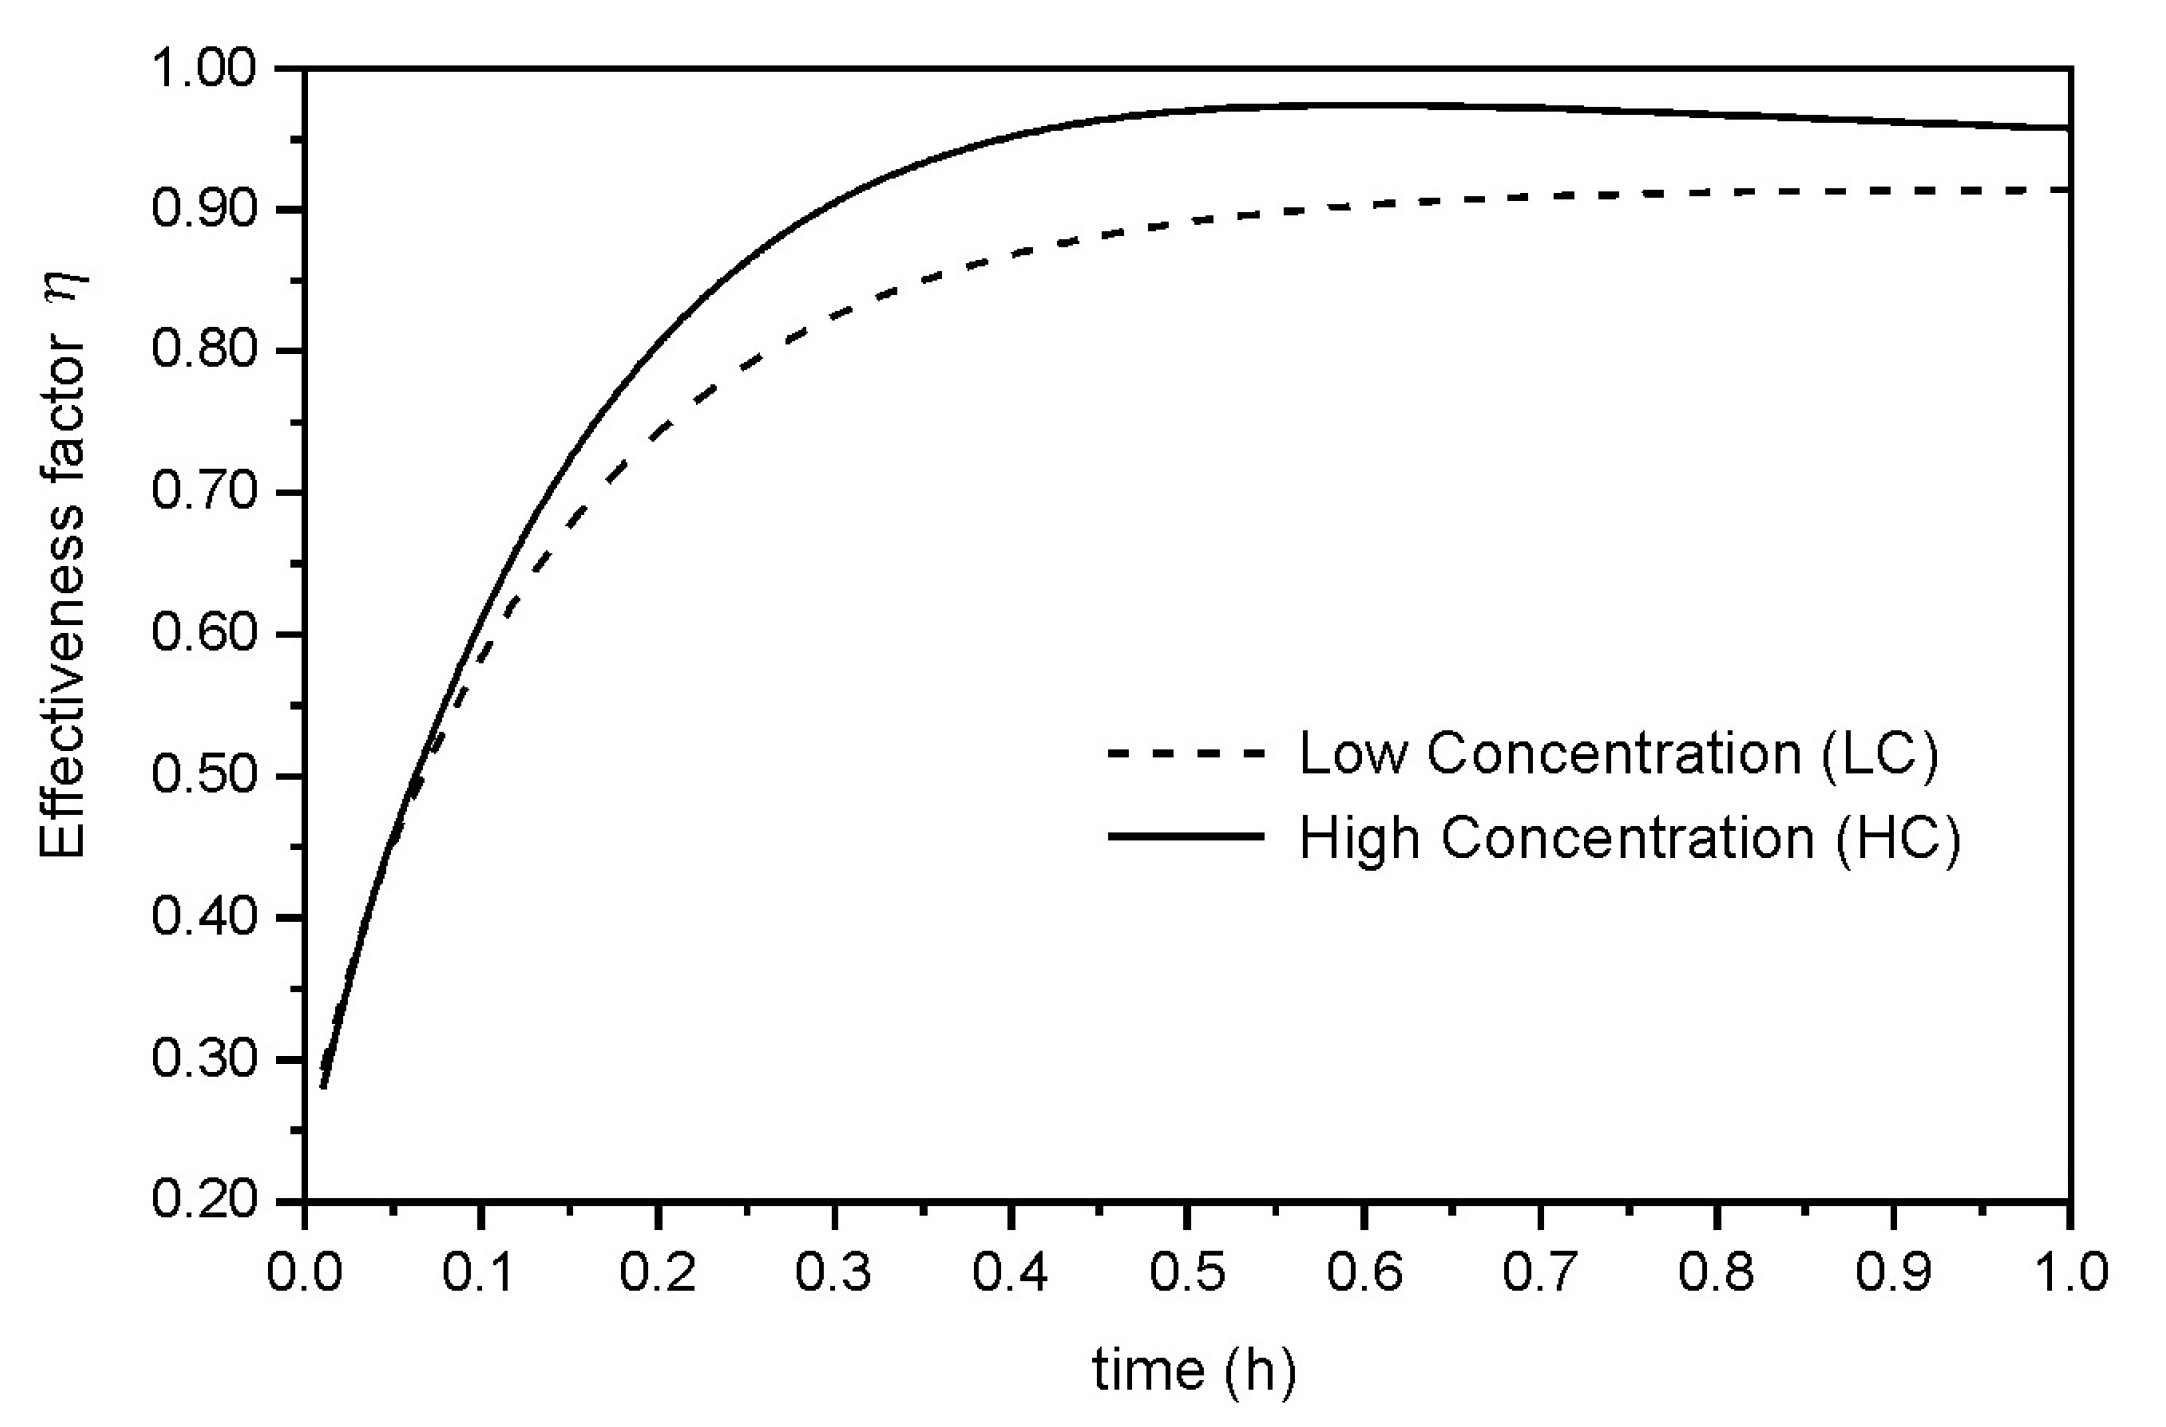
Initially, the first hour of operation was simulated to investigate the behavior of the bioprocess in this initial period, obtaining relevant information about its dynamics. Figure 2 shows the behavior of the effectiveness factor at the bioreactor’s entrance during the first hour of operation.
The entrance was taken as a reference due to the effectiveness factor in this position being the lowest among those observed throughout the bioreactor. Low values of the effectiveness factor are verified in the initial instants of the bioprocess, a result attributed to the existence of dead zones or of very low substrate concentrations inside the particle, which causes the average rate of substrate consumption inside the particle to be small when compared to that on the surface.
After approximately 0.30 h for the fermentation with high substrate concentration in the feed and 0.60 h for the fermentation with low substrate concentration, the effectiveness factor reaches values above 0.9. These times are negligible when compared to the transient regime duration times at each operation t L C = 70   h   a n d   t H C = 40   h .
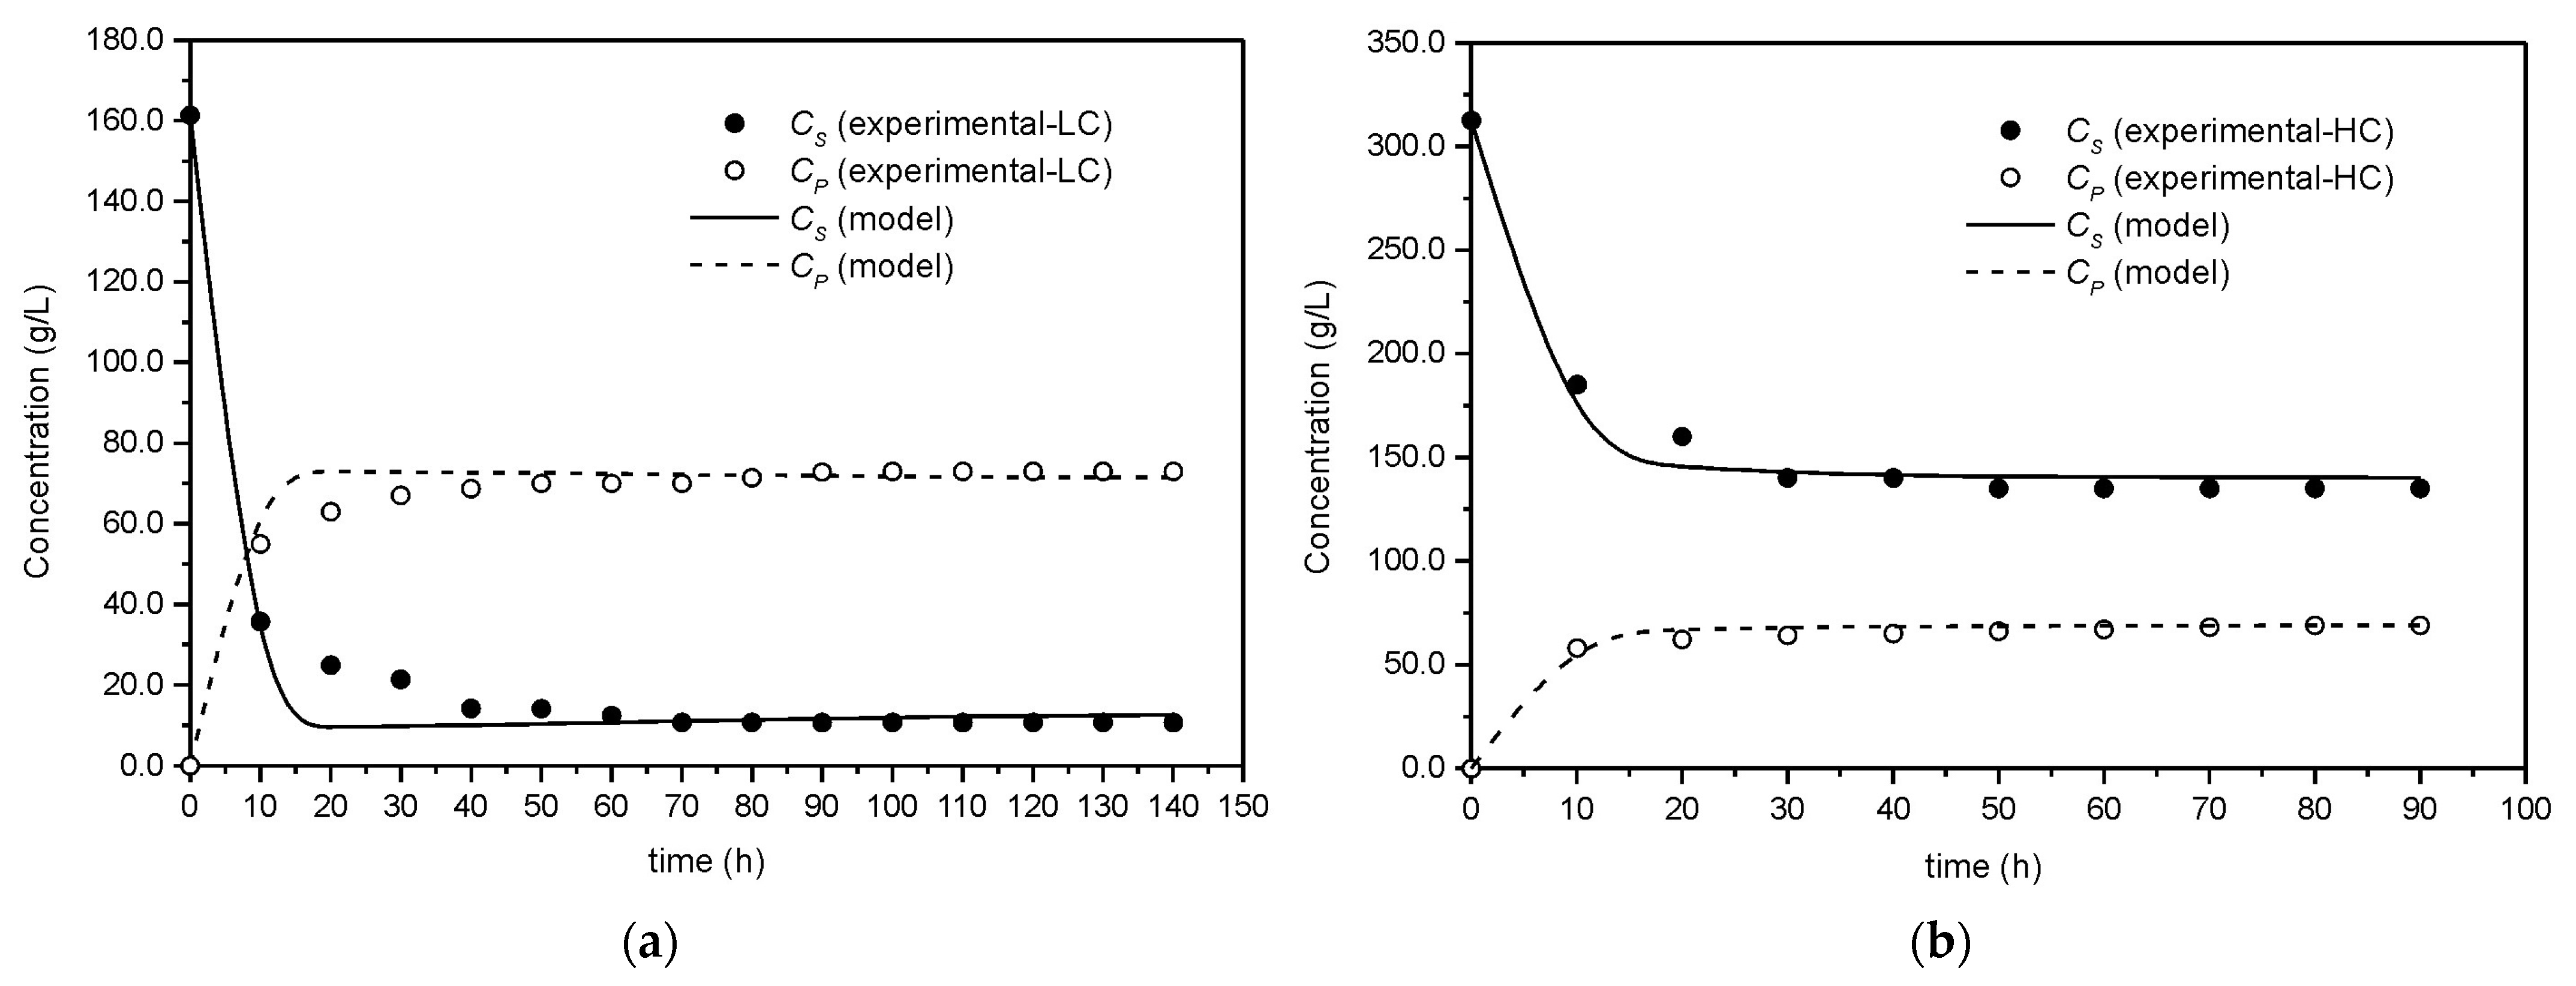
In Figure 3, it can be seen that the proposed model describes well the behavior trend of the substrate and ethanol concentrations in the fluid phase, at the bioreactor’s exit, in the transient regime. Cell concentration Cell concentration in the fluid phase was not measured because the cells were immobilized in the solid phase because the cells are immobilized in the solid phase.
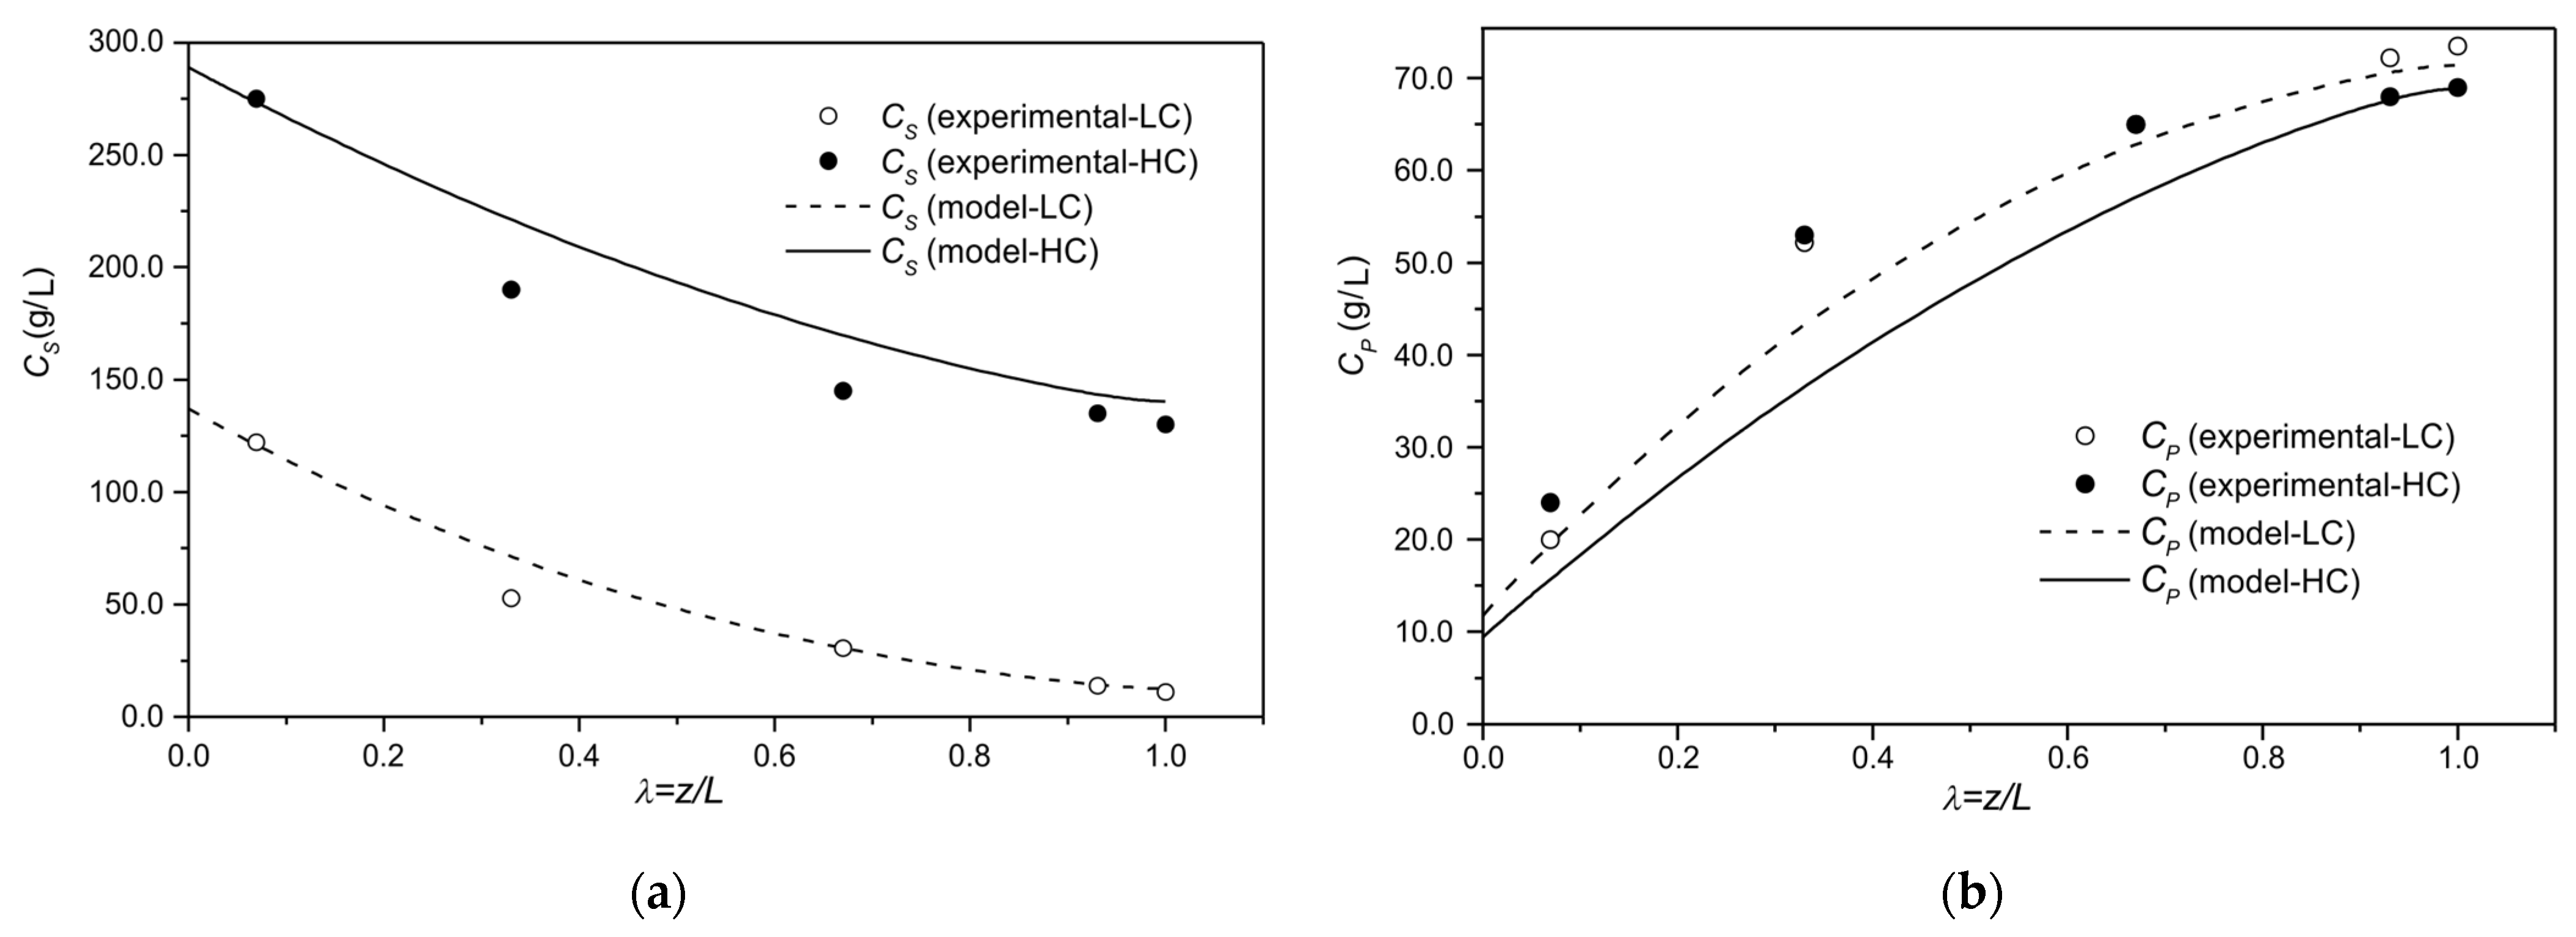
Figure 4 shows the substrate and ethanol concentration profiles in the fluid phase along the bioreactor at the steady state, in which it can be seen that the model satisfactorily describes the axial concentration profiles of substrate and ethanol.
The good quality of the adjustments of the proposed model to the experimental data can be quantitatively confirmed by the high R2 values presented in Table 3, above 0.90, which means that 90% of the total variation around the experimental mean for each data set considered was explained by the mathematical model.
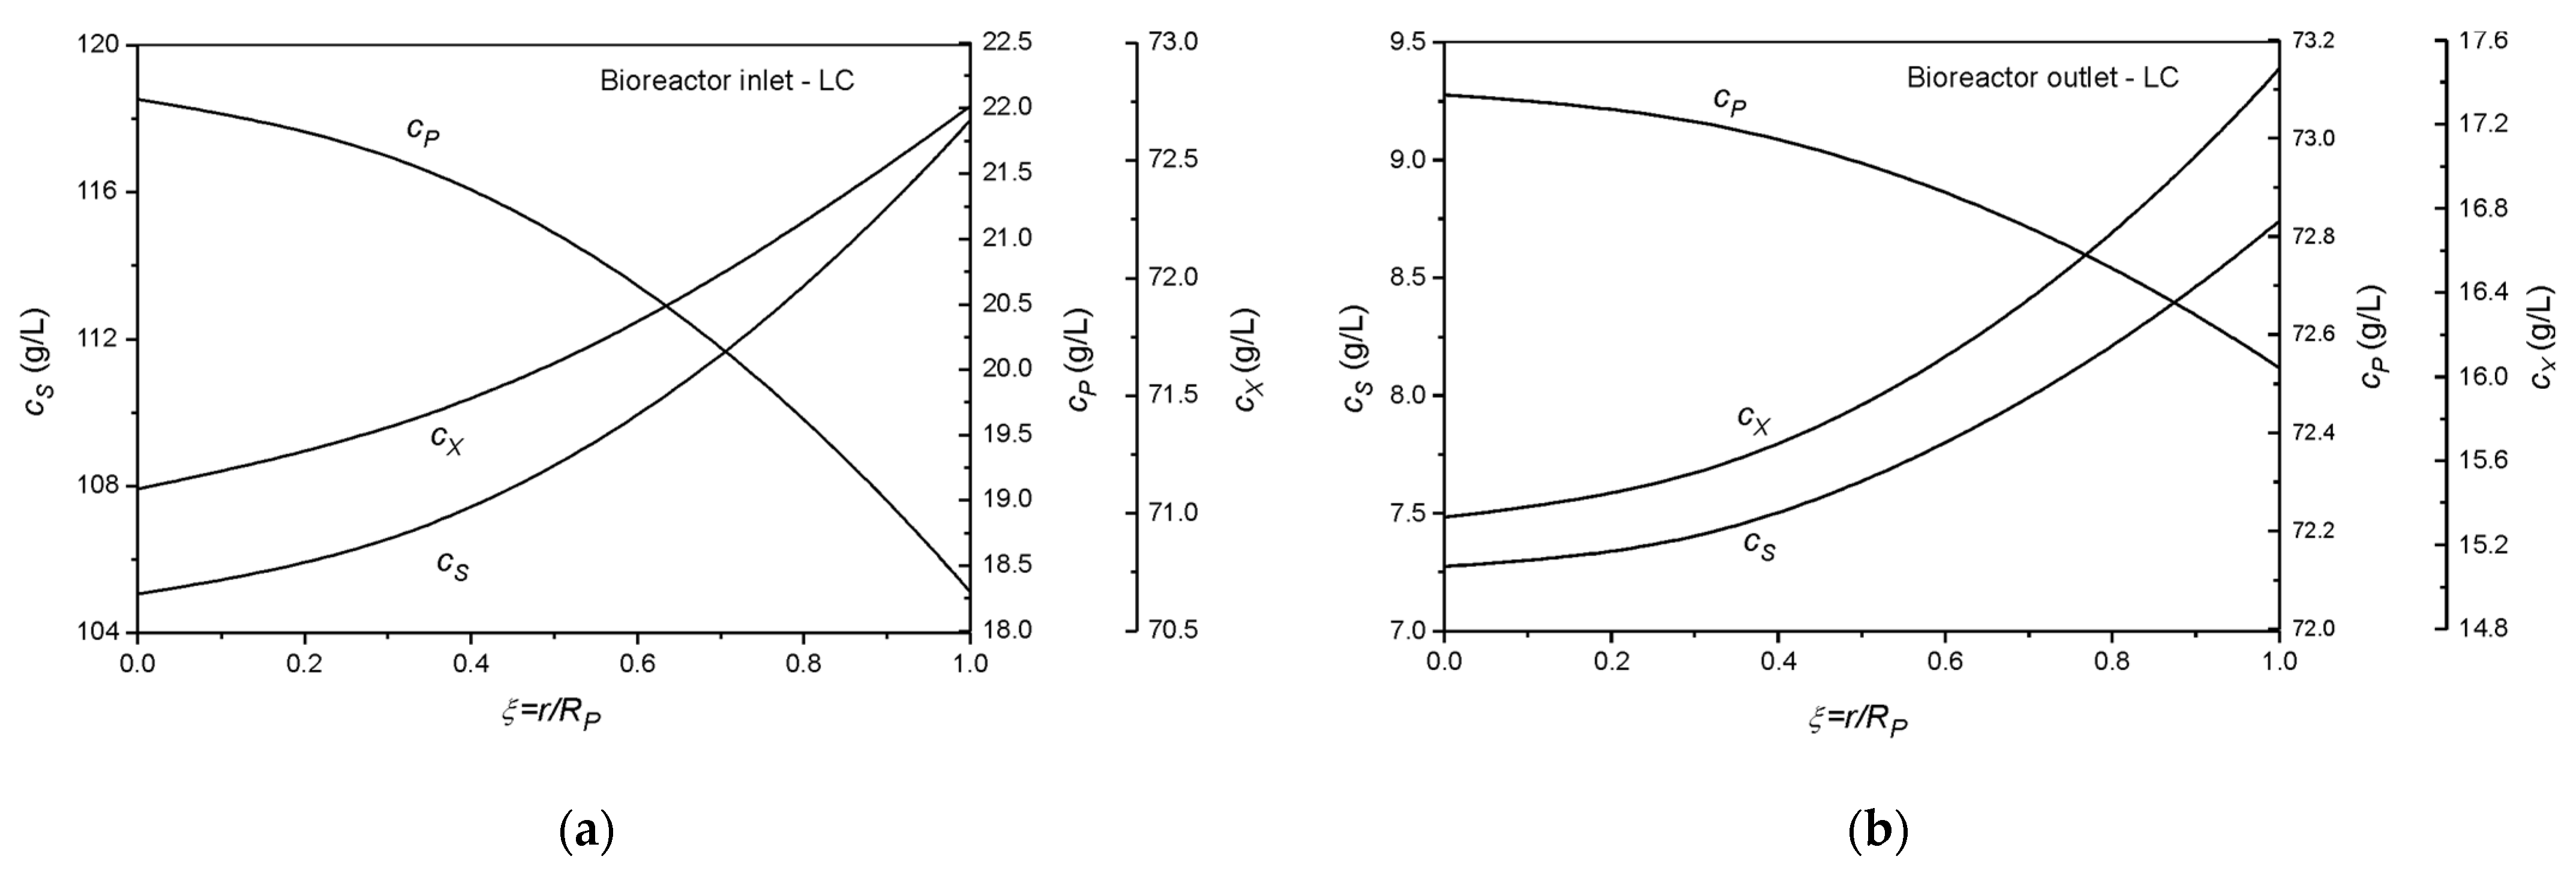
Figure 5 and Figure 6 show the simulated profiles of cell, substrate and ethanol concentrations c X ,   c S   a n d   c P   within the particle at steady state, at the bioreactor’s inlet and outlet. These profiles are in agreement with those expected, i.e., the concentration of cells increases along the particle radius because in this direction the concentration of substrate also increases, favoring cell growth. Therefore, cell concentration is higher in the vicinity of the particle surface due to a greater availability of substrate in this region. Otherwise, ethanol concentration decreases with increasing radius because ethanol is transported by diffusion from the interior of the particle to the fluid phase. Furthermore, the environmental conditions inside the particle in the inlet region of the bioreactor are favorable to cellular growth for both substrate concentrations used in the feed, whereas the conditions in the outlet region favor ethanol production.
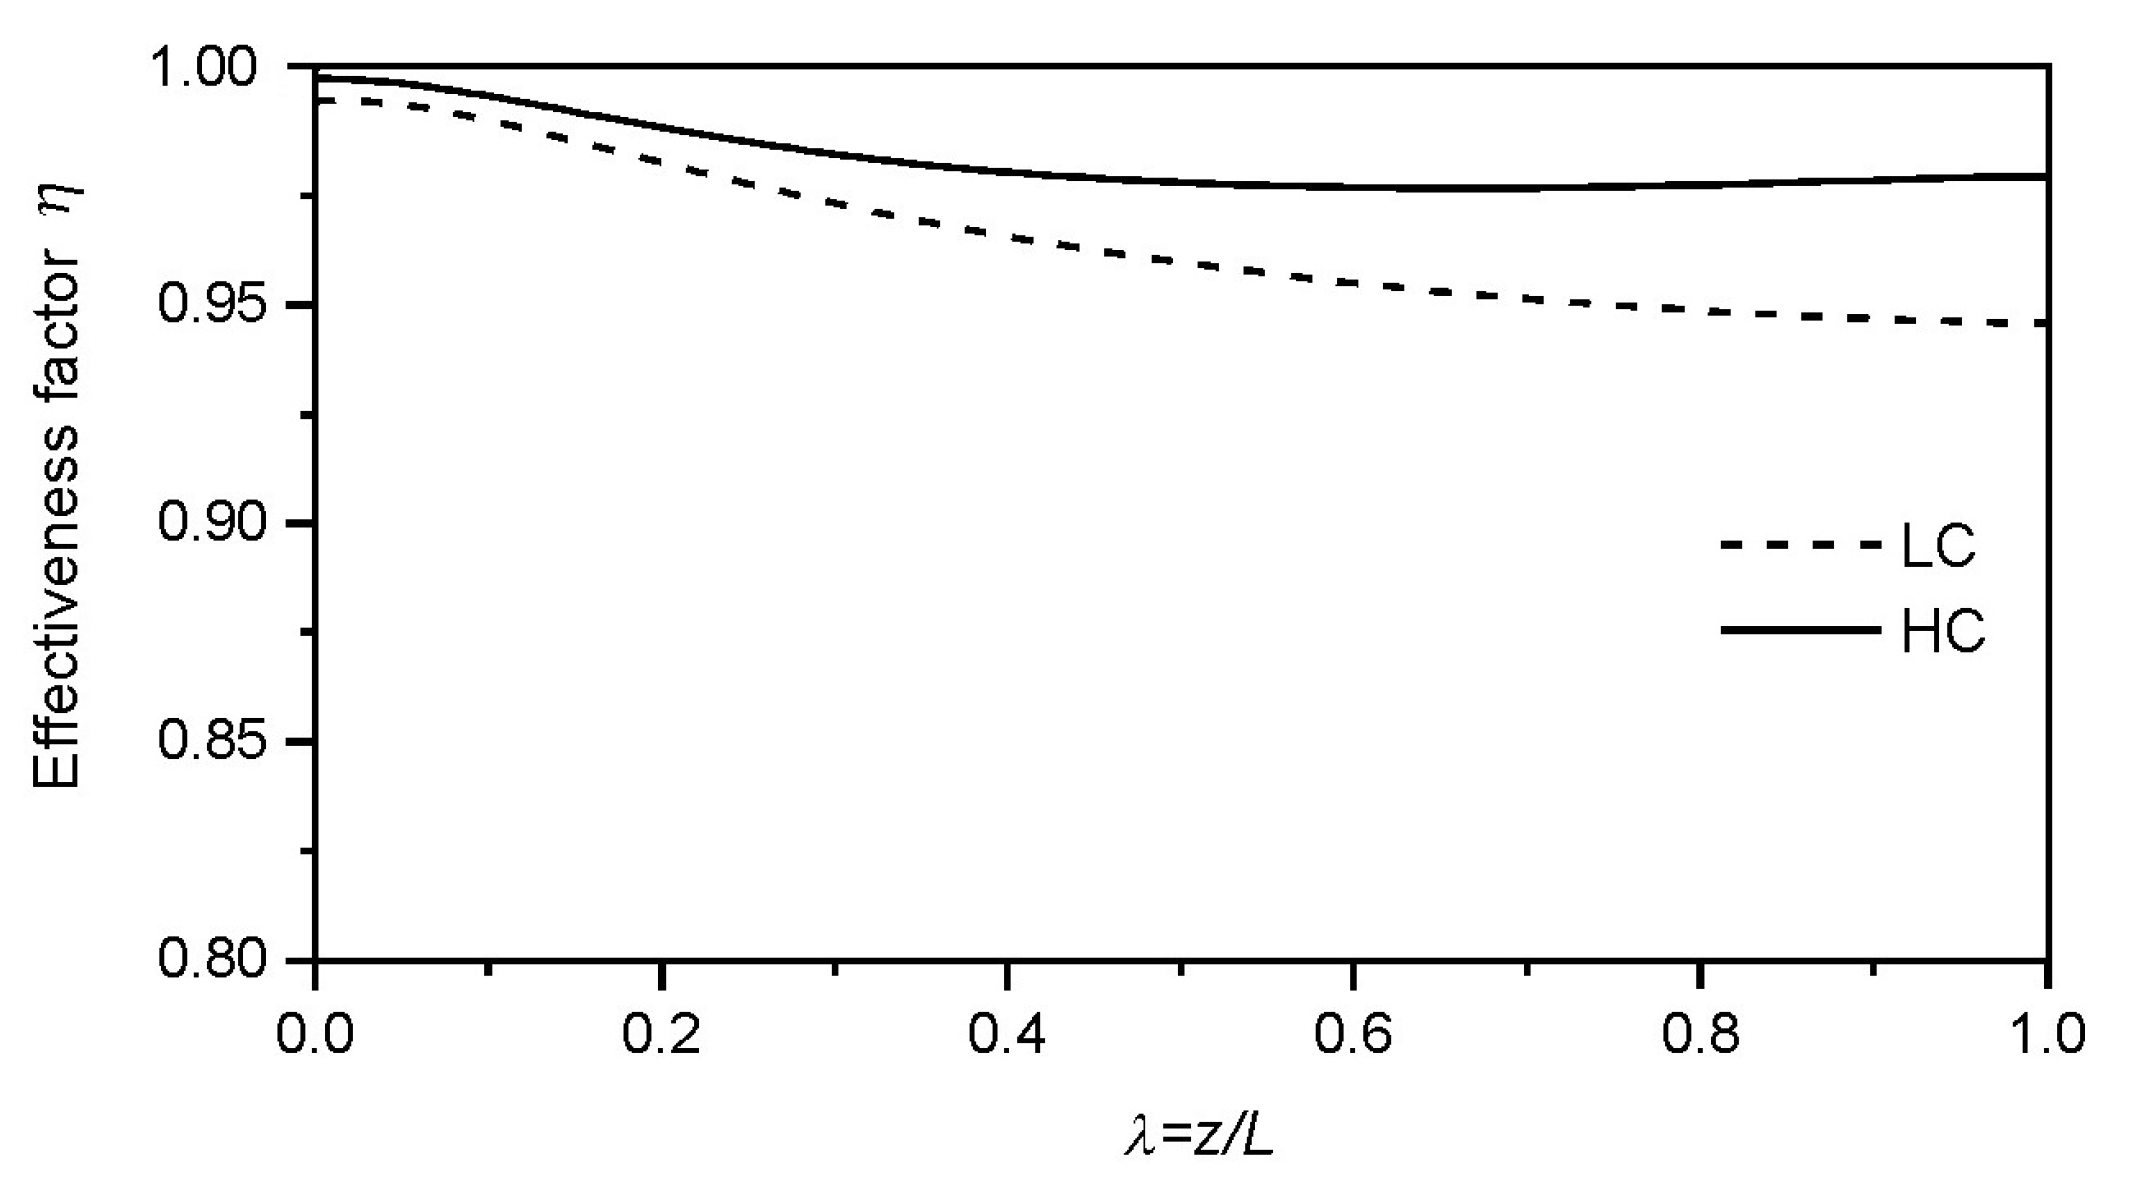
Figure 7 shows the behavior of the effectiveness factor along the bioreactor in the steady state. Effectiveness factors close to 1 are observed for both substrate concentrations used in the feed stream. It is verified that the operation with high substrate concentration in the feed provides effectiveness factors slightly superior to those obtained in the operation with low concentration, probably because in the operation with high concentration there is a greater diffusion of substrate of the phase fluid to the interior of the particle, which results in a higher average reaction rate in the particle, thereby increasing the effectiveness factor. Moreover, the slight decline in the effectiveness factor from the bioreactor’s inlet to its outlet is attributed to the progressive increase in the ethanol concentration in this direction, enhancing its inhibitory effect on the substrate consumption rate within the particle and thus decreasing its catalytic effectiveness. The high values of the effectiveness factor calculated in this study are in agreement with those calculated by Hamamci and Ryu [46], Converti et al. [11], and Ramakrishna et al. [47], when they operated packed bed bioreactors for ethanol production using immobilized yeasts in different support materials.
The fact that the effectiveness factor was close to 1 during most of the bioprocess along the bioreactor suggests that the resistance to mass transfer within the particle is negligible and that concentration gradients in the particle model can be neglected. From the experimental viewpoint, this result indicates that there is no need for particle size reduction since the conversion of substrate to ethanol is not controlled by diffusion within the particle.
Although the proposed model has provided good adjustments to the experimental data, better predictions can be achieved by optimizing the model parameters, since they were not previously optimized, being only initial estimates taken from the literature. Parameter estimation of complex mathematical models, containing a large number of parameters (as is the case in this study), can be a difficult task due to the greater computational effort required. Moreover, nonlinearities and interactions among the parameters introduce additional difficulties. The classical methods for parameter estimation are based on minimizing a given objective function, generally the sum of squared residuals, built up with the parameters to be estimated. There are several classical techniques for minimizing the sum of squared residuals of nonlinear models, including the Steepest Descent (descending gradient), Gauss–Newton, and Levenberg–Marquartd methods; the last being widely employed because it incorporates the advantages of the first two methods [42,48,49]. Genetic Algorithms and the Flexible Polyhedron method are heuristic techniques that have sometimes been preferred to solve nonlinear optimization problems aimed at avoiding nonlinearity effects, convergence difficulties, and derivative calculations.

4. Conclusions

From the results obtained, the following conclusions can be drawn:
  • The proposed model adequately reproduced the behavior trend of the main bioprocess state variables. However, it is possible to improve the model’s predictions by optimizing its parameters since they had not been optimized in a preliminary step of parameter estimation;
  • To reduce the computational effort required to estimate the parameters, the current mathematical model needs to be simplified by developing a simpler, more conservative model that incorporates the essential behavior of the bioprocess;
  • Since the effects of intraparticle mass transfer are negligible, a convenient strategy, simplifying the mathematical model, would be to neglect the concentration gradients within the particle;
  • Another strategy would be to replace the axial dispersion model with the tanks in series model to describe the bioreactor’s hydrodynamic behavior. These two combined strategies would reduce the current set of partial differential equations to a set of ordinary differential equations, significantly simplifying the mathematical model;
  • The application of such reduction strategies represents the main potential for advancement of this study aimed at accurately estimating the model’s parameters.

Author Contributions

Conceptualization, D.S. and S.O.; methodology, D.S., S.O. and V.P.; software, D.S. and S.O.; validation, D.S. and S.O.; formal analysis, D.S. and S.O.; investigation, D.S., S.O. and V.P.; resources, D.S., S.O. and V.P.; data curation, D.S., S.O. and V.P.; writing—original draft preparation, D.S. and S.O.; writing—review and editing, D.S. and S.O.; supervision, D.S. and S.O.; project administration, D.S. and S.O.; funding acquisition, D.S. and S.O. All authors have read and agreed to the published version of the manuscript.

Funding

This research was financed in part by the Coordination for the Improvement of Higher Education Personnel (CAPES) under finance code 001.

Data Availability Statement

Data are contained within the article.

Acknowledgments

The authors thank Carlos Alberto Torres Suazo (UFSCar/Brazil) for his valuable contribution to this research (In Memorian).

Conflicts of Interest

The authors declare no conflicts of interest.

Nomenclature

aArea per unit volume of the particle (dm−1)
A P Surface area of the particle (dm2)
c X Concentration of cells within the particle (g/L)
c s Concentration of substrate within the particle (g/L)
c P Concentration of product (ethanol) inside the particle (g/L)
c s s u p Concentration of substrate on the particle surface (g/L)
c p s u p Concentration of product on the particle surface (g/L)
c X Maximum concentration of cells within the particle (g/L)
C X Concentration of cells in the fluid phase (g/L)
C S Concentration of substrate in the fluid phase (g/L)
C P Concentration of product in the fluid phase (g/L)
C S 0 Substrate concentration in the feed stream (g/L)
d R Bioreactor diameter (dm)
d P Particle diameter (dm)
D z Coefficient of axial dispersion (dm2/h)
D S Diffusion coefficient of the substrate (dm2/h)
D P Diffusion coefficient of the product (dm2/h)
D a x Coefficient of axial dispersion based on the bed porosity (dm2/h)
F D Parameter defined in Equation (22) (-)
J d Chilton-Colburn factor for mass transfer (-)
K m j Coefficient of mass transfer of component j (dm/h)
K m S Coefficient of mass transfer of substrate (dm/h)
K m P Coefficient of mass transfer of product (dm/h)
k d Specific rate of cell death (g/g·h)
K I Inhibition parameter for substrate according to Andrews’ model (g/L)
K M Substrate saturation constant (g/L)
K P Inhibition parameter for product (g/L)
Lbioreactor length (dm)
mSpecific rate of substrate consumption for cell maintenance (g/g·h)
QFeed volumetric flow rate (dm3/h)
rRadial coordinate in the particle (dm)
r d Rate of cell death (g/L·h)
r P Rate of product formation (g/L·h)
r ^ S Substrate consumption rate per unit particle volume (g/L·h)
r ^ S s u p Value of r ^ S on the particle surface (g/L·h)
r S Substrate consumption rate per unit volume of fluid (g/L·h)
R P Particle radius (dm)
R e Reynolds number (-)
S c Schmidt number (-)
t Time (h)
t H C Duration time of the transient regime for fermentation with high substrate concentration in the feed stream (h)
t L C Duration time of the transient regime for fermentation with low substrate concentration in the feed stream (h)
u S Superficial velocity of the fluid (dm/h)
u i Interstitial velocity of the fluid (dm/h)
V P Particle volume (dm3)
Y X / S Apparent yield coefficient for substrate-to-cell conversion (g/g)
Y P / S Apparent yield coefficient for substrate-to-product conversion (g/g)
zAxial coordinate in the bioreactor (dm)
αParameter related to the product formation associated with cell growth (g/g)
βParameter related to product formation not associated with cell growth (g/g·h)
σ, δCharacteristic parameters of Jacobi polynomials (-)
εbed porosity (-)
λ Dimensionless axial coordinate in the bioreactor (-)
μ max Maximum specific rate of cell growth (g/g·h)
μ X Specific rate of cell growth (g/g·h)
μ S Specific rate of substrate consumption (g/g·h)
μ P Specific rate of product formation (g/g·h)
μ f Absolute viscosity of the fluid (g/dm·h)
ηEffectiveness factor of the catalytic particles (-)
ξ Dimensionless radial coordinate in the particle (-)
ρ f Fluid density (g/dm3)

Appendix A

Table A1. References used for kinetic parameter estimation.
ParametersReference
μ m a x [30]
K M [14]
K I [46]
k d [14]
K P [14]
c X [34]
Y X / S [50]
m[51]

References

  1. Polona, Z.P. Biocatalytic process intensification via efficient biocatalyst immobilization, miniaturization, and process integration, Current Opinion. Green Sustain. Chem. 2021, 32, 100546, ISSN 2452-2236. [Google Scholar] [CrossRef]
  2. Stankiewicz, A.I.; Moulijn, J.A. Process Intensification: Transforming Chemical Engineering. Chem. Eng. Prog. 2000, 96, 22–34. [Google Scholar]
  3. Gutiérrez-Antonio, C.; Romero-Izquierdo, A.G.; Gómez-Castro, F.I.; Hernández, S. Process intensification and integration in the production of biojet fuel. In Production Processes of Renewable Aviation Fuel; Romero-Izquierdo, A.G., Gómez-Castro, F.I., Hernández, S., Eds.; Elsevier: Amsterdam, The Netherlands, 2021; pp. 171–199. [Google Scholar] [CrossRef]
  4. Nakasaki, K.; Murai, T.; Akiyama, T. Dynamic modeling of immobilized cell reactor: Application to ethanol fermentation. Biotechnol. Bioeng. 1989, 33, 1317–1323. [Google Scholar] [CrossRef]
  5. Fukuda, H. Immobilized microorganisms bioreactors. In Bioreactor System Design; Asenjo, J.A., Merchuk, J.C., Eds.; Marcel Dekker: New York, NY, USA, 1995; pp. 339–373. [Google Scholar]
  6. Laca, A.; Quirós, C.; García, L.A.; Diaz, M. Modeling and description of internal profiles in immobilized cells systems. Biochem. Eng. J. 1998, 1, 225–232. [Google Scholar]
  7. Toda, K.; Ohtake, H.; Asakura, T. Ethanol production in horizontal bioreactor. Appl. Microbiol. Biotechnol. 1986, 24, 97–101. [Google Scholar]
  8. Wöhrer, W. A horizontal bioreactor for ethanol production by immobilized cells. Bioprocess Eng. 1989, 4, 105–111. [Google Scholar]
  9. Parekh, S.R.; Wayman, M. Performance of a novel continuous dynamic immobilized cell bioreactor in ethanolic fermentation. Enzyme Microb. Technol. 1987, 9, 406–410. [Google Scholar]
  10. Shiotani, T.; Yamané, T. A horizontal packed-bed bioreactor to reduce CO2 gas holdup in the continuous production of ethanol by immobilized yeast cells. European J. Appl. Microbiol. Biotechnol. 1981, 13, 96–101. [Google Scholar]
  11. Converti, A.B.M.; Sommariva, C. Ethanol production in an entrapped yeast cell column. Chem. Eng. J. 1991, 47, B1–B10. [Google Scholar] [CrossRef]
  12. Sanromán, A.; Chamy, R.; Núnez, M.J.; Lema, J.M. Enzymatic hydrolysis of starch in a fixed-bed pulsed-flow reactor. Appl. Biochem. Biotechnol. 1991, 28/29, 527–538. [Google Scholar]
  13. Belincanta, J.; Alchorne, J.A.; Teixeira da Silva, M. The brazilian experience with ethanol fuel: Aspects of production, use, quality and distribution logistics. Braz. Chem. Eng. J. 2016, 33, 1091–1102. [Google Scholar]
  14. Oliveira, S.C.; Stremel, D.P.; Dechechi, E.C.; Pereira, F.M. Kinetic modeling of 1-G ethanol fermentations. In Fermentation Processes; Jozala, A.F., Ed.; InTech: Rijeka, Croatia, 2017; pp. 93–117. [Google Scholar]
  15. Zanin, G.M.; Santana, C.C.; Bom, E.P.; Giordano, R.C.L.; de Moraes, F.F.; Andrietta, S.R.; de Carvalho Neto, C.C.; Macedo, I.C.; Fo, D.L.; Ramos, L.P.; et al. Brazilian bioethanol program. Appl. Biochem. Biotechnol. 2000, 84–86, 1147–1161. [Google Scholar] [CrossRef] [PubMed]
  16. Vasconcelos, J.N.; Lopes, C.E.; França, F.P. Continuous ethanol production using yeast immobilized on sugar-cane stalks. Braz. Chem. Eng. J. 2004, 21, 357–365. [Google Scholar] [CrossRef]
  17. Scott, F.; Conejeros, R.; Aroca, G. Attainable region analysis for continuous production of second generation bioethanol. Biotechnol. Biofuels 2013, 6, 171. [Google Scholar] [CrossRef]
  18. Lee, C.W.; Chang, H.N. Examination of immobilized cell in a rotating packed drum reactor for the production of ethanol from D-glucose. Enzyme Microb. Technol. 1985, 7, 561–563. [Google Scholar] [CrossRef]
  19. Admassu, W.; Korus, R.A.; Heimsch, R.C. Ethanol fermentation with a flocculating yeast. Chem. Eng. J. 1985, 31, B1–B8. [Google Scholar] [CrossRef]
  20. Baptista, C.M.S.G.; Cóias, J.M.A.; Oliveira, A.C.M.; Oliveira, N.M.C.; Rocha, J.M.S.; Dempsey, M.J.; Lannigan, K.C.; Benson, P.S. Natural immobilisation of microorganisms for continuous ethanol production. Enzyme Microb. Technol. 2006, 40, 127–131. [Google Scholar] [CrossRef]
  21. Oliveira, S.C.; de Castro, H.F.; Visconti, A.E.S.; Giudici, R. Mathematical modeling of a continuous alcoholic fermentation process in a two-stage tower reactor cascade with flocculating yeast recycle. Bioprocess Biosyst. Eng. 2015, 38, 469–479. [Google Scholar] [CrossRef]
  22. Setiadi, T.; Larsen, V.F. Modelling concentration profiles in tower fermenter: The influence of the axial dispersion coefficient. Biotech. Lett. 1991, 13, 647–652. [Google Scholar] [CrossRef]
  23. Ivancic, M.; Santek, B.; Novak, S.; Horvart, P.; Maric, V. Bioprocess kinetics in a horizontal rotating tubular bioreactor. Bioprocess Biosyst. Eng. 2004, 26, 169–175. [Google Scholar] [CrossRef]
  24. Cardona, C.A.; Sánchez, O.J. Fuel ethanol production: Process design trends and integration opportunities. Bioresour. Technol. 2007, 98, 2415–2457. [Google Scholar] [PubMed]
  25. Elnashaie, S.S.E.H.; Fakeeha, A.H.; Helal, E.; Abashar, M.E. A mathematical model achieving the twin objectives of simplicity and accuracy for the simulation of immobilized packed bed fermenters. Math. Comput. Modell. 1994, 19, 105–114. [Google Scholar] [CrossRef]
  26. Oliveira, S.C.; Oliveira, R.C.; Tacin, M.V.; Gattás, E.A.L. Kinetic modeling and optimization of a batch ethanol fermentation process. J. Bioprocess. Biotech. 2016, 6, 266. [Google Scholar]
  27. Gòdia, F.; Casas, C.; Solá, Ç. Mathematical modelization of a packed-bed reactor performance with immobilized yeast for ethanol fermentation. Biotechnol. Bioeng. 1987, 30, 836–843. [Google Scholar] [CrossRef]
  28. Melick, M.R.; Karim, M.N.; Linden, J.C.; Dale, B.E.; Mihaltz, P. Mathematical modeling of ethanol production by immobilized Zymomonas mobilis in a packed bed fermenter. Biotechnol. Bioeng. 1987, 29, 370–382. [Google Scholar] [CrossRef]
  29. Nath, S.; Chand, S. Mass transfer and biochemical reaction in immobilized cell packed bed reactors: Correlation of experiment with theory. J. Chem. Tech. Biotechnol. 1996, 66, 286–292. [Google Scholar] [CrossRef]
  30. Converti, A.; del Borghi, M. A new kinetic approach to the fermentation of multisubstrate complex media. Appl. Biochem. Biotechnol. 1991, 30, 361–373. [Google Scholar]
  31. Lee, C.G.; Kim, C.H.; Rhee, S.K. A kinetic model and simulation of starch saccharification and simultaneous ethanol fermentation by amyloglucosidase and Zymomonas mobilis. Bioprocess Eng. 1992, 7, 335–341. [Google Scholar] [CrossRef]
  32. Liu, D.; Xu, L.; Xiong, W.; Zhang, H.T.; Lin, C.C.; Jiang, L.; Xu, B. Fermentation process modeling with Levenberg-Marquardt algorithm and Runge-Kutta method on ethanol production by Saccharomyces cerevisiae. Math. Prob. Eng. 2014, 2014, 289492. [Google Scholar] [CrossRef]
  33. Vásquez, J.E.; Quintero, J.C.; Ochoa-Cácere, S. Modeling of a simultaneous saccharification and fermentation process for ethanol production from lignocellulosic wastes by Kluyveromyces marxianus. DYNA 2014, 81, 107–115. [Google Scholar]
  34. Oliveira, S.C.; Paiva, T.C.B.; Visconti, A.E.S.; Giudici, R. Discrimination between ethanol inhibition models in a continuous alcoholic fermentation process using flocculating yeast. Appl. Biochem. Biotechnol. 1998, 74, 161–172. [Google Scholar] [CrossRef] [PubMed]
  35. Wang, D.I.C.; Cooney, C.L.; Demain, A.L.; Dunnill, P.; Humphrey, A.E.; Lilly, M.D. Fermentation and Enzyme Technology; John Wiley: New York, NY, USA, 1979. [Google Scholar]
  36. Bailey, J.E.; Ollis, D.F. Biochemical Engineering Fundamentals, 2nd ed.; Mc. Graw-Hill: New York, NY, USA, 1986. [Google Scholar]
  37. Hannoun, B.J.; Stephanopoulos, G. Diffusion coefficients of glucose and ethanol in cell-free and cell-occupied calcium alginate membranes. Biotechnol. Bioeng. 1986, 28, 829–835. [Google Scholar] [CrossRef] [PubMed]
  38. Blanch, H.W.; Clark, D.S. Biochemical Engineering; Marcel Dekker: New York, NY, USA, 1997. [Google Scholar]
  39. Pereira, F.M.; Oliveira, S.C. Occurrence of dead core in catalytic particles containing immobilized enzymes: Analysis for the Michaelis-Menten kinetics and assessment of numerical methods. Bioprocess. Biosyst. Eng. 2016, 39, 1717–1727. [Google Scholar] [CrossRef] [PubMed]
  40. Oliveira, S.C. Evaluation of effectiveness factor of immobilized enzymes using Runge-Kutta-Gill method: How to solve mathematical undetermination at particle center point. Bioprocess Eng. 1999, 20, 185–187. [Google Scholar] [CrossRef]
  41. Levenspiel, O. Chemical Reaction Engineering, 3rd ed.; John Wiley & Sons: New York, NY, USA, 1999. [Google Scholar]
  42. Froment, G.F.; Bischoff, K.B.; De Wilde, J. Chemical Reactor Analysis and Design, 3rd ed.; John Wiley & Sons: New York, NY, USA, 2011. [Google Scholar]
  43. Fogler, E.H. Elements of Chemical Reaction Engineering, 3rd ed.; Prentice-Hall Inc.: Upper Saddle River, NJ, USA, 1994. [Google Scholar]
  44. Ramirez, W.F. Computational Methods for Process Simulation, 2nd ed.; Butterworth Publishers: Oxford, UK, 1997. [Google Scholar]
  45. Rice, R.G.; Do, D.D. Applied Mathematics and Modeling for Chemical Engineers; John Wiley & Sons: New York, NY, USA, 1995. [Google Scholar]
  46. Hamamci, H.; Ryu, D.D.Y. Performance of tapered column co-packed bed bioreactor for ethanol production. Biotechnol. Bioeng. 1987, 29, 994–1002. [Google Scholar] [CrossRef]
  47. Ramakrishna, S.V.; Prema, P.; Sai, P.S.T. Performance of cell immobilized packed bed bioreactor for continuous fermentation of alcohol. Bioprocess Eng. 1991, 6, 117–121. [Google Scholar] [CrossRef]
  48. Himmelblau, D.M. Process Analysis by Statistical Methods; John Wiley & Sons: New York, NY, USA, 1970. [Google Scholar]
  49. Constantinides, A.M.N. Numerical Methods for Chemical Engineers with MATLAB Applications; Prentice-Hall Inc.: Upper Saddle River, NJ, USA, 1999. [Google Scholar]
  50. Gencer, M.A.; Muthrasan, R. Ethanol Fermentation in a yeast immobilized tubular fermentor. Biotech. Bioeng. 1983, 25, 2243–2261. [Google Scholar] [CrossRef]
  51. Jiménez-Islas, D.; Páez-Lerma, J.; Soto-Cruz, N.O.; Gracida, J. Modelling of Ethanol Production from Red Beet Juice by Saccharomyces cerevisiae under Thermal and Acid Stress Conditions. Food Technol. Biotechnol. 2014, 52, 93–100. [Google Scholar]
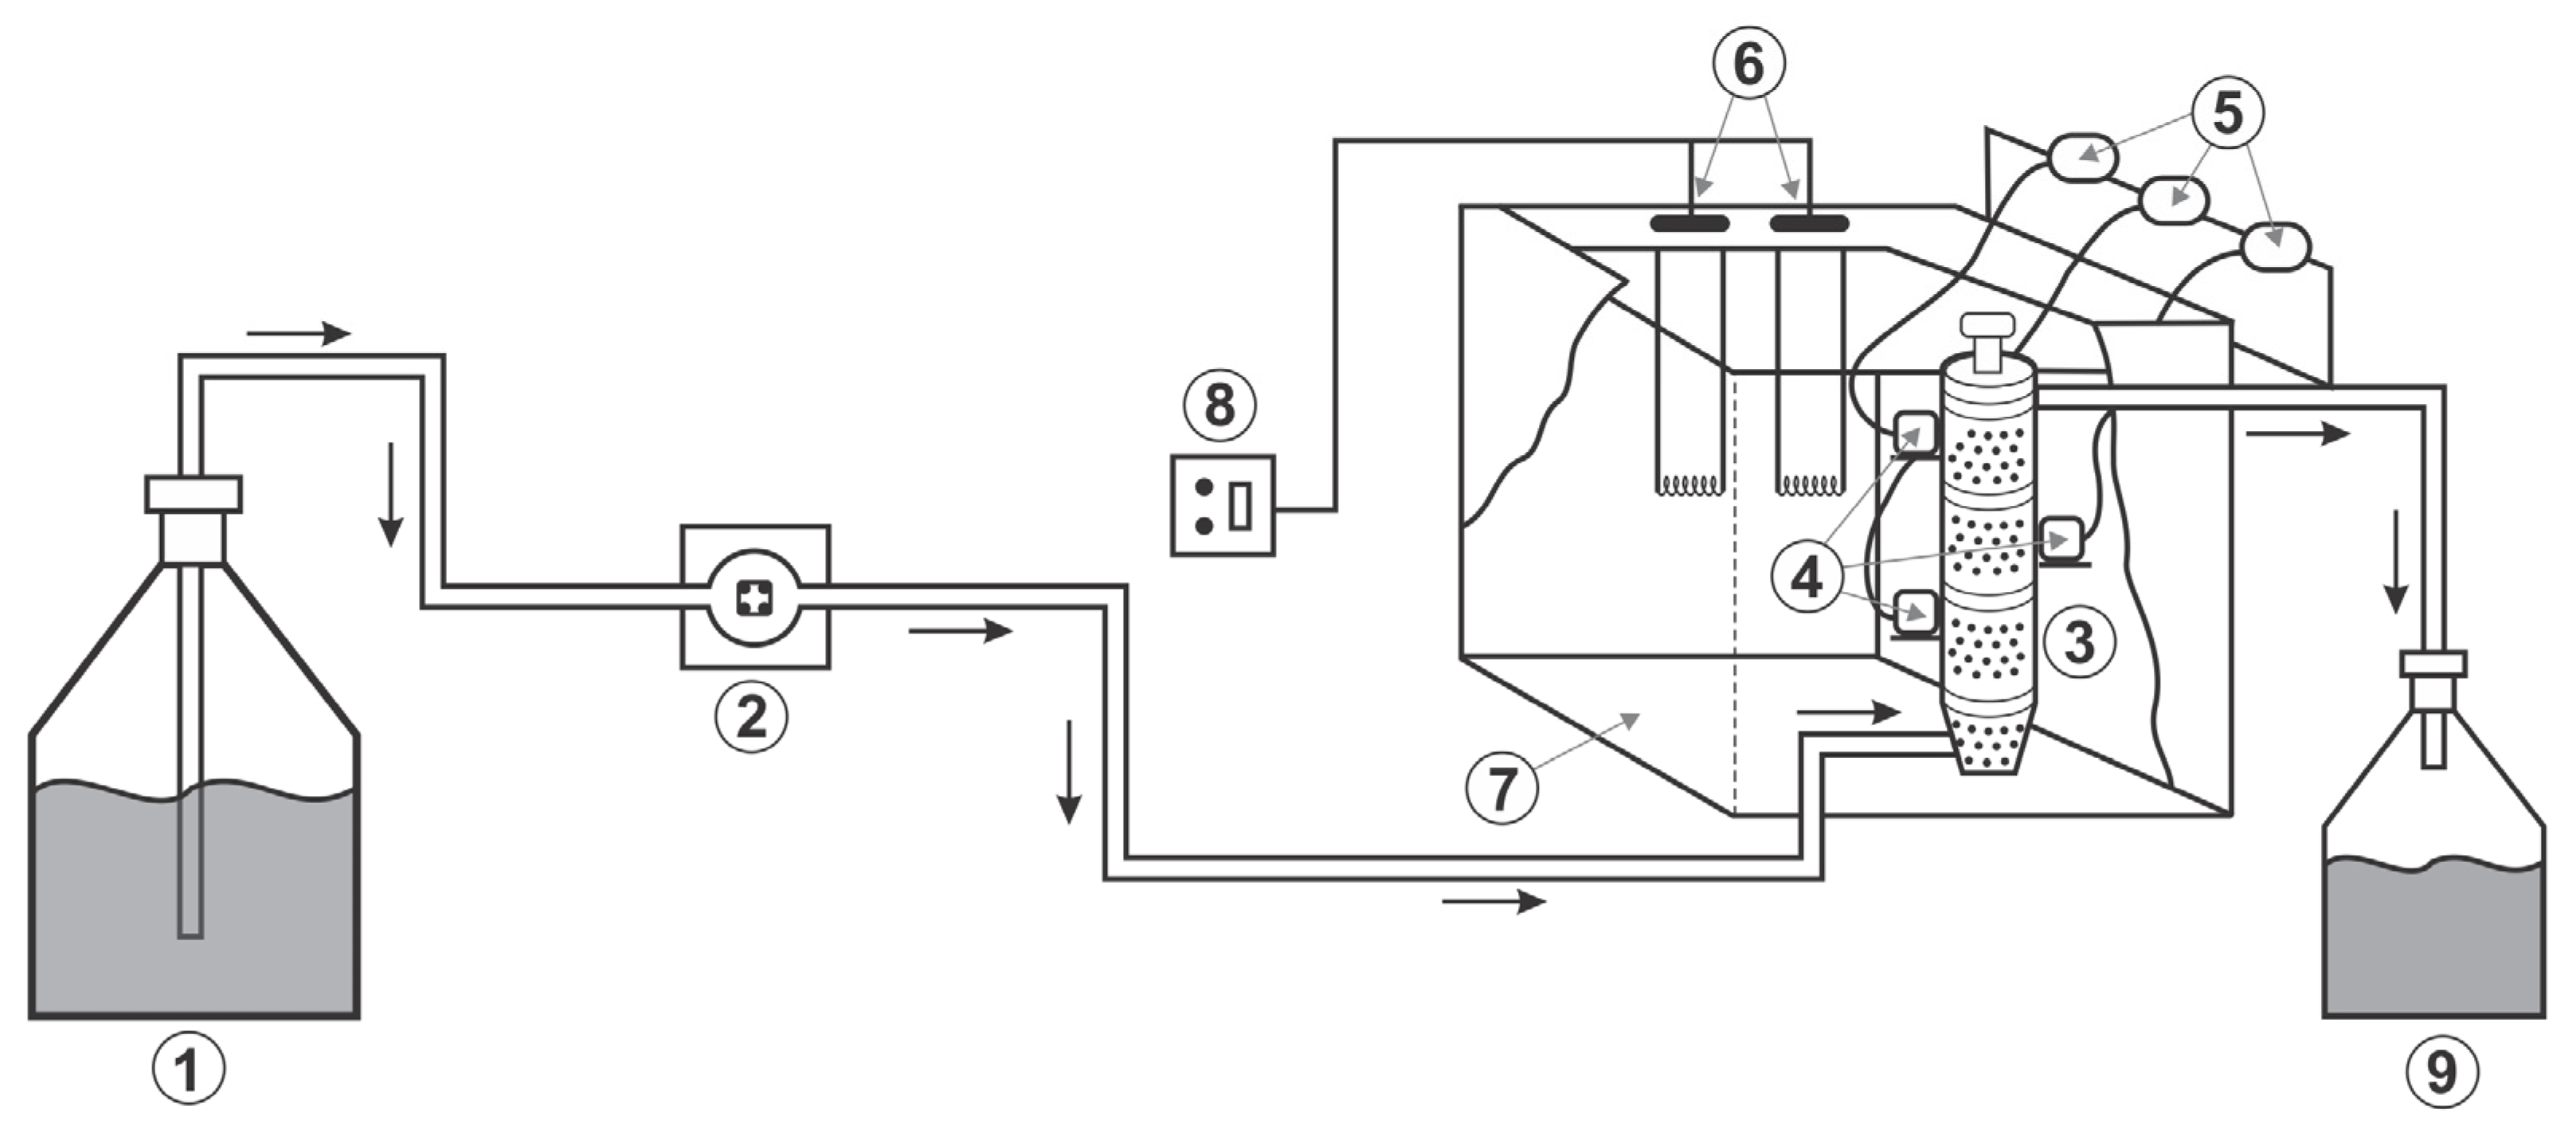
Figure 1. Schematic drawing of the experimental system used in continuous ethanol fermentation in a multi-stage fixed bed tubular bioreactor with external gas-liquid separators (Legend: 1—feed medium reservoir, 2—peristaltic pump, 3—fixed bed bioreactor, 4—gas–liquid separators, 5—solenoid valves, 6—electrical resistance, 7—thermostatic water bath, 8—temperature controller, 9–fermented medium reservoir).
Processes 13 01122 g001
Figure 2. Effectiveness factor at the entrance of the bioreactor during the first hour of operation in the transient regime.
Processes 13 01122 g002
Figure 3. Substrate and ethanol concentration profiles in the fluid phase at the exit of the bioreactor in the transient regime: (a) low feed substrate concentration; (b) high feed substrate concentration.
Processes 13 01122 g003
Figure 4. Concentration profiles in the fluid phase along the bioreactor at the steady state: (a) substrate; (b) product.
Processes 13 01122 g004
Figure 5. Simulated concentration profiles inside the particle in steady state for low substrate concentration in the feed: (a) bioreactor’s inlet; (b) bioreactor’s outlet.
Processes 13 01122 g005
Figure 6. Simulated concentration profiles inside the particle in steady state for high substrate concentration in the feed: (a) bioreactor’s inlet; (b) bioreactor’s outlet.
Processes 13 01122 g006
Figure 7. Effectiveness factor along the bioreactor in the steady state.
Processes 13 01122 g007
Table 1. Location of the collocation points in the particle, in the reactor, and weights for the Radau quadrature.
Collocation Pointξ = r/Rp
(Particle)
λ = z/L
(Reactor)
W
(Weight)
1-0.0000000-
20.29576580.06943180.02509
30.56523530.33000950.07925
40.78448350.66999050.11520
50.93400140.93056820.09562
61.00000001.00000000.01818
Table 2. Parameters and operating conditions adopted for simulation of the bioreactor *.
Kinetic ParametersPhysical ParametersOperating Conditions
μ m a x = 0.44 g / g · h
K M = 4.42 g / L
K I = 216.0 g / L
d P = 0.0356 d m 0.0366 d m Q = 40.0 × 1 0 3 d m 3 / h 49.4 × 1 0 3 d m 3 / h
k d = 0.0054 g / g · h 0.0060   g / g · h
K p = 0.030   L / g 0.036   L / g
L = 1.9   d m (including the headspace)
d R = 0.5 d m
C S 0 = 161.4 g / L 312.5 g / L
c X = 80.0 g / L ε = 0.304 0.256 c X i = 21.0 g / L
m = 0.30 g / g · h 0.36 g / g · h ρ f = 1152.4 g / d m 3
Y X S = 0.022 g / g 0.030 g / g μ f = 1980.0 g / d m · h
Y P S = 0.48 g / g 0.40 g / g
* in the items where there are two values, the first refers to the operation with low substrate concentration (LC) in the feed stream and the second refers to the operation with high concentration (HC).
Table 3. R2 values for the adjustments of the proposed model to the experimental data.
VariableR2Feed Substrate Concentration/Position/State
C S 0.98LC/Exit Reactor/Transient State
C S 0.98HC/Exit Reactor/Transient State
C P 0.96LC/Exit Reactor/Transient State
C P 0.97HC/Exit Reactor/Transient State
C S 0.96LC/Axial Position/Steady State
C S 0.90HC/Axial Position/Steady State
C P   0.96LC/Axial Position/Steady State
C P 0.90HC/Axial Position/Steady State
Disclaimer/Publisher’s Note: The statements, opinions and data contained in all publications are solely those of the individual author(s) and contributor(s) and not of MDPI and/or the editor(s). MDPI and/or the editor(s) disclaim responsibility for any injury to people or property resulting from any ideas, methods, instructions or products referred to in the content.