Article

Cortisone Analysis by FTIR Spectroscopy: In Vitro Study

by
Luciana Paula Benício Arcas
1,
Sara Maria Santos Dias da Silva
1,
Felipe Carlos Dias Arcas
1,
Flávio Henrique Alves
2,
Luís Felipe das Chagas e Silva de Carvalho
1 and
Marina Amaral
1,*
1
Post Graduation Program in Health Sciences, University of Taubaté, Taubaté 12020-270, Brazil
2
Department of Dentistry, University of Taubaté, Taubaté 12020-270, Brazil
*
Author to whom correspondence should be addressed.
Processes 2025, 13(4), 1112; https://doi.org/10.3390/pr13041112
Submission received: 18 February 2025 / Revised: 22 March 2025 / Accepted: 1 April 2025 / Published: 7 April 2025
(This article belongs to the Special Issue Pharmaceutical Development and Bioavailability Analysis, 2nd Edition)

Abstract

:
Cortisol, known as the “stress hormone”, is vital for stress response, metabolism regulation, and immune function, and salivary cortisone reflects serum cortisol levels. The measurement of salivary cortisone levels has been proposed as an effective alternative method for estimating serum cortisol levels. Objective: This study aimed to evaluate the use of Fourier Transform Infrared Spectroscopy (FTIR) for salivary cortisone identification and quantification and to assess the impact of adding the surfactant TWEEN 80 to the analysis. Methods: Initially, cortisone was diluted in chloroform and methanol (5,000,000 µg/dL). FTIR spectra were obtained, and absorbance characteristics and peaks were identified. The spectrum of this initial dilution was processed using the Savitzky-Golay filter to evaluate peak heights at 1655 cm−1 and 1700 cm−1, and the effect of signal processing on these peaks was assessed. Additionally, two series of dilutions were performed by adding the surfactant TWEEN 80 at two different concentrations, and the effect of the surfactant on the cortisone spectra was evaluated to reduce noise and enhance the signal. Results: The spectra obtained from the cortisone solution were similar to those found in the literature for solid samples. The peak corresponding to the wavenumber range of 1600–1680 cm−1, related to the stretching bands of C=C, was found to be reliable for use in cortisone quantification studies. The standard deviation between the spectra of the same sample was less than 0.01. It was not possible to detect cortisone when TWEEN 80 was added; however, with signal processing, TWEEN 80 could be detected in quantities as low as 0.0033% of the solution. Conclusions: FTIR demonstrates potential as a non-invasive method for cortisone analysis. While Tween 80 aids in the dilution of cortisone in water, it obscures its spectrum.

1. Introduction

Cortisol, often referred to as the “stress hormone”, is essential for modulating the body’s response to stress, as well as being vital in regulating metabolism and maintaining immune function [1,2,3,4,5,6]. In the salivary glands, cortisol binds to specific receptors and is converted into cortisone, its inactive form. This conversion is mediated by the enzyme 11β-Hydroxysteroid dehydrogenase type 2 [7,8].
Studies have demonstrated a correlation between salivary cortisone levels and serum cortisol levels [6,8]. The abundant presence of the enzyme 11β-Hydroxysteroid dehydrogenase in saliva facilitates the conversion of cortisol into cortisone, resulting in a cortisone concentration approximately five times higher than that of cortisol [7,9]. Therefore, the measurement of salivary cortisone levels has been proposed as an effective alternative method for estimating serum cortisol levels [9,10], especially in situations where, due to illness or variations in the circadian cycle, the levels of this hormone may be significantly reduced.
Routine hormonal assays in laboratories for clinical use or research largely depend on immunoassays, primarily due to their low cost and ease of technique [11,12,13]. Moreover, highly sensitive methods such as Liquid Chromatography—Tandem Mass Spectrometry, require high technical specialization [14,15]. Fourier Transform Infrared Spectroscopy (FTIR) is a non-destructive and non-invasive technique, cost-effective, and an alternative to conventional methods [16,17]. The potential expansion of FTIR for cortisol quantification could enable broader applications in clinical and research settings, facilitating large-scale epidemiological studies and real-time monitoring of hormonal variations without the need for extensive sample preparation or complex instrumentation.
FTIR technique is based on the unique ability of molecules and compounds to absorb and transmit different wavelengths [18]. The transmitted wavelengths are captured and transformed into graphs of sines and cosines (Fourier transform), allowing for the identification and quantification of simple molecules to complex compounds through FTIR analysis [19,20]. FTIR for identification and quantification of cortisol in saliva would allow the dosage of this hormone in an ambulatorial setting, facilitating research and diagnostics.
Due to the technique used and environmental conditions at the time of FTIR analysis, spectra often contain unwanted elements such as noise and background. Noise consists of random modifications, while the background corresponds to parts of the spectrum that are not related to the desired signal [21]. Signal processing is a widely accepted approach for removing these unwanted elements in spectra obtained by infrared spectroscopy and other techniques. The application of specific filters, such as the Savitzky-Golay smoothing and differentiation filter, effectively reduces these unwanted elements, facilitating the identification and quantification of substances [22].
While FTIR has been widely explored for biomolecular analysis [23,24], its application in the detection and quantification of cortisone remains largely unexplored. One of the major challenges in applying FTIR to cortisone analysis is its lipophilic nature, which results in poor solubility in water, leading to non-homogeneous dispersions that can interfere with spectral accuracy [25]. To address this issue, the present study introduces the use of Tween 80, a non-ionic surfactant with a high Hydrophilic-Lipophilic Balance (HLB) value of 15.0, to improve the dispersion of cortisone in aqueous solutions. Tween 80, also known as polysorbate 80, has a polyoxyethylene chain that enhances its dispersibility in water and provides both polar and apolar terminations, allowing it to bind to both hydrophilic and lipophilic molecules [26]. This approach has not been systematically investigated in the context of FTIR analysis for cortisone detection.
The objective of this study was to evaluate the feasibility of using Fourier Transform Infrared Spectroscopy (FTIR) for the identification and quantification of cortisone. Specifically, the study aimed to determine the stability of main peaks of absorbance after smoothing with the Savitzky-Golay method and to assess the impact of the surfactant TWEEN 80 on the solubilization and spectral observation of cortisone in water. The study also sought to explore the potential of FTIR as an ambulatorial and non-invasive method for cortisone analysis and to identify the need for further research to enable accurate quantification of cortisone in water and, eventually, in saliva.

2. Material and Methods

2.1. Spectrum of Cortisone and Reliability of Spectra Obtained by FTIR

Initially, 200 mg of cortisone (C2755 Sigma-Aldrich, St. Louis, MO, USA, ≥98) was diluted in 4 mL of methanol:chloroform solution (1:1), according to the manufacturer’s recommendation, obtaining a solution of 5,000,000 μg/dL. The tube in contact with the vibrator was shaken for 6 min until complete dilution was confirmed by visual inspection.
Using the FTIR spectrometer (Alpha II, BRUKER, Berlin, Germany), the absorbance spectrum of all solutions in this study were acquired. This equipment has a special tool for analyzing pastes, gels, and liquids. This technique, known as Fourier Transform Infrared Spectroscopy—Attenuated Total Reflectance (FTIR-ATR), utilizes a horizontal diamond crystal, which provides the necessary sensitivity for analyzing components in low-concentration samples, according to the manufacturer.
The absorbance versus wavenumber graph was plotted (OriginLab 2024, OriginLab Corporation, Northampton, MA, USA). The bands and respective wavenumbers suggested in the literature were evaluated [27,28].
Each spectrum was taken three times, with the mean and standard deviation calculated to identify the characteristics of the wavenumber curve by absorbance and to identify the peaks that characterize the cortisone molecule. Furthermore, ensuring reliability in obtaining spectra.

2.2. Evaluation of Cortisone Spectra in Water

A serial dilution of 1 mL of the 5,000,000 µg/dL solution was performed as shown Table 1.
In the same way, the spectra of the dispersions were acquired after the test tubes were taken to the mixer, to evaluate the possibility of identifying cortisone in an aqueous medium, as it is clinically desirable to accurately measure cortisone in saliva, which is composed of 99.9% water.

2.3. Analysis of Surfactant Increment in Obtaining Cortisone Spectra

Additionally, two series of dilutions were performed, adding to 1 mL of the cortisone solution diluted in methanol and chloroform two different concentrations of the surfactant polysorbate 80 (Tween® 80, 655207, Merck Millipore, Darmstadt, Germany). The dilutions performed can be seen in Table 2 and Table 3.
The introduction of a surfactant would produce a spectrum with less noise and the possibility of detecting cortisone in the presence of water.

2.4. Signal Processing and Data Treatment

The graphical coordinates for the spectra were obtained using the software (Vibrational Spectroscopy Software Opus, version 6.5, BRUKER, Berlin, Germany) of the equipment used. The curve smoothing was performed using the Savitzky-Golay method. The Savitzky-Golay filter is a statistical technique that fits a set of data points to a polynomial using the least squares method [22,29].
To verify the effect of the mentioned smoothing on the height of the cortisone peaks found around 1655 cm−1 and 1700 cm−1, a series of smoothings were performed from the spectrum of cortisone diluted in chloroform and methanol. Every 5 points, a new graph was plotted, and the peak heights were measured.

3. Results

Figure 1 presents the graph of the three spectra obtained from the 5,000,000 µg/dL solution, without any data processing. The standard deviation among the samples does not exceed 0.01, demonstrating the reliability of the obtained spectra [20]. Four characteristic peaks of the cortisone spectrum were identified, consistent with the literature [27].
The absorbance peaks characterizing the cortisone molecule can be observed in Figure 1. Additionally, the similarity of the obtained curves is noted.
In the present study, when analyzing the three samples of cortisone diluted in chloroform and methanol, a standard deviation of less than 0.01 was observed at all points, consistent with the precision reported in the literature [20]. The cortisone spectrum is clearly observed without data processing at this concentration (Figure 1), and the main peaks can be seen in Table 4.
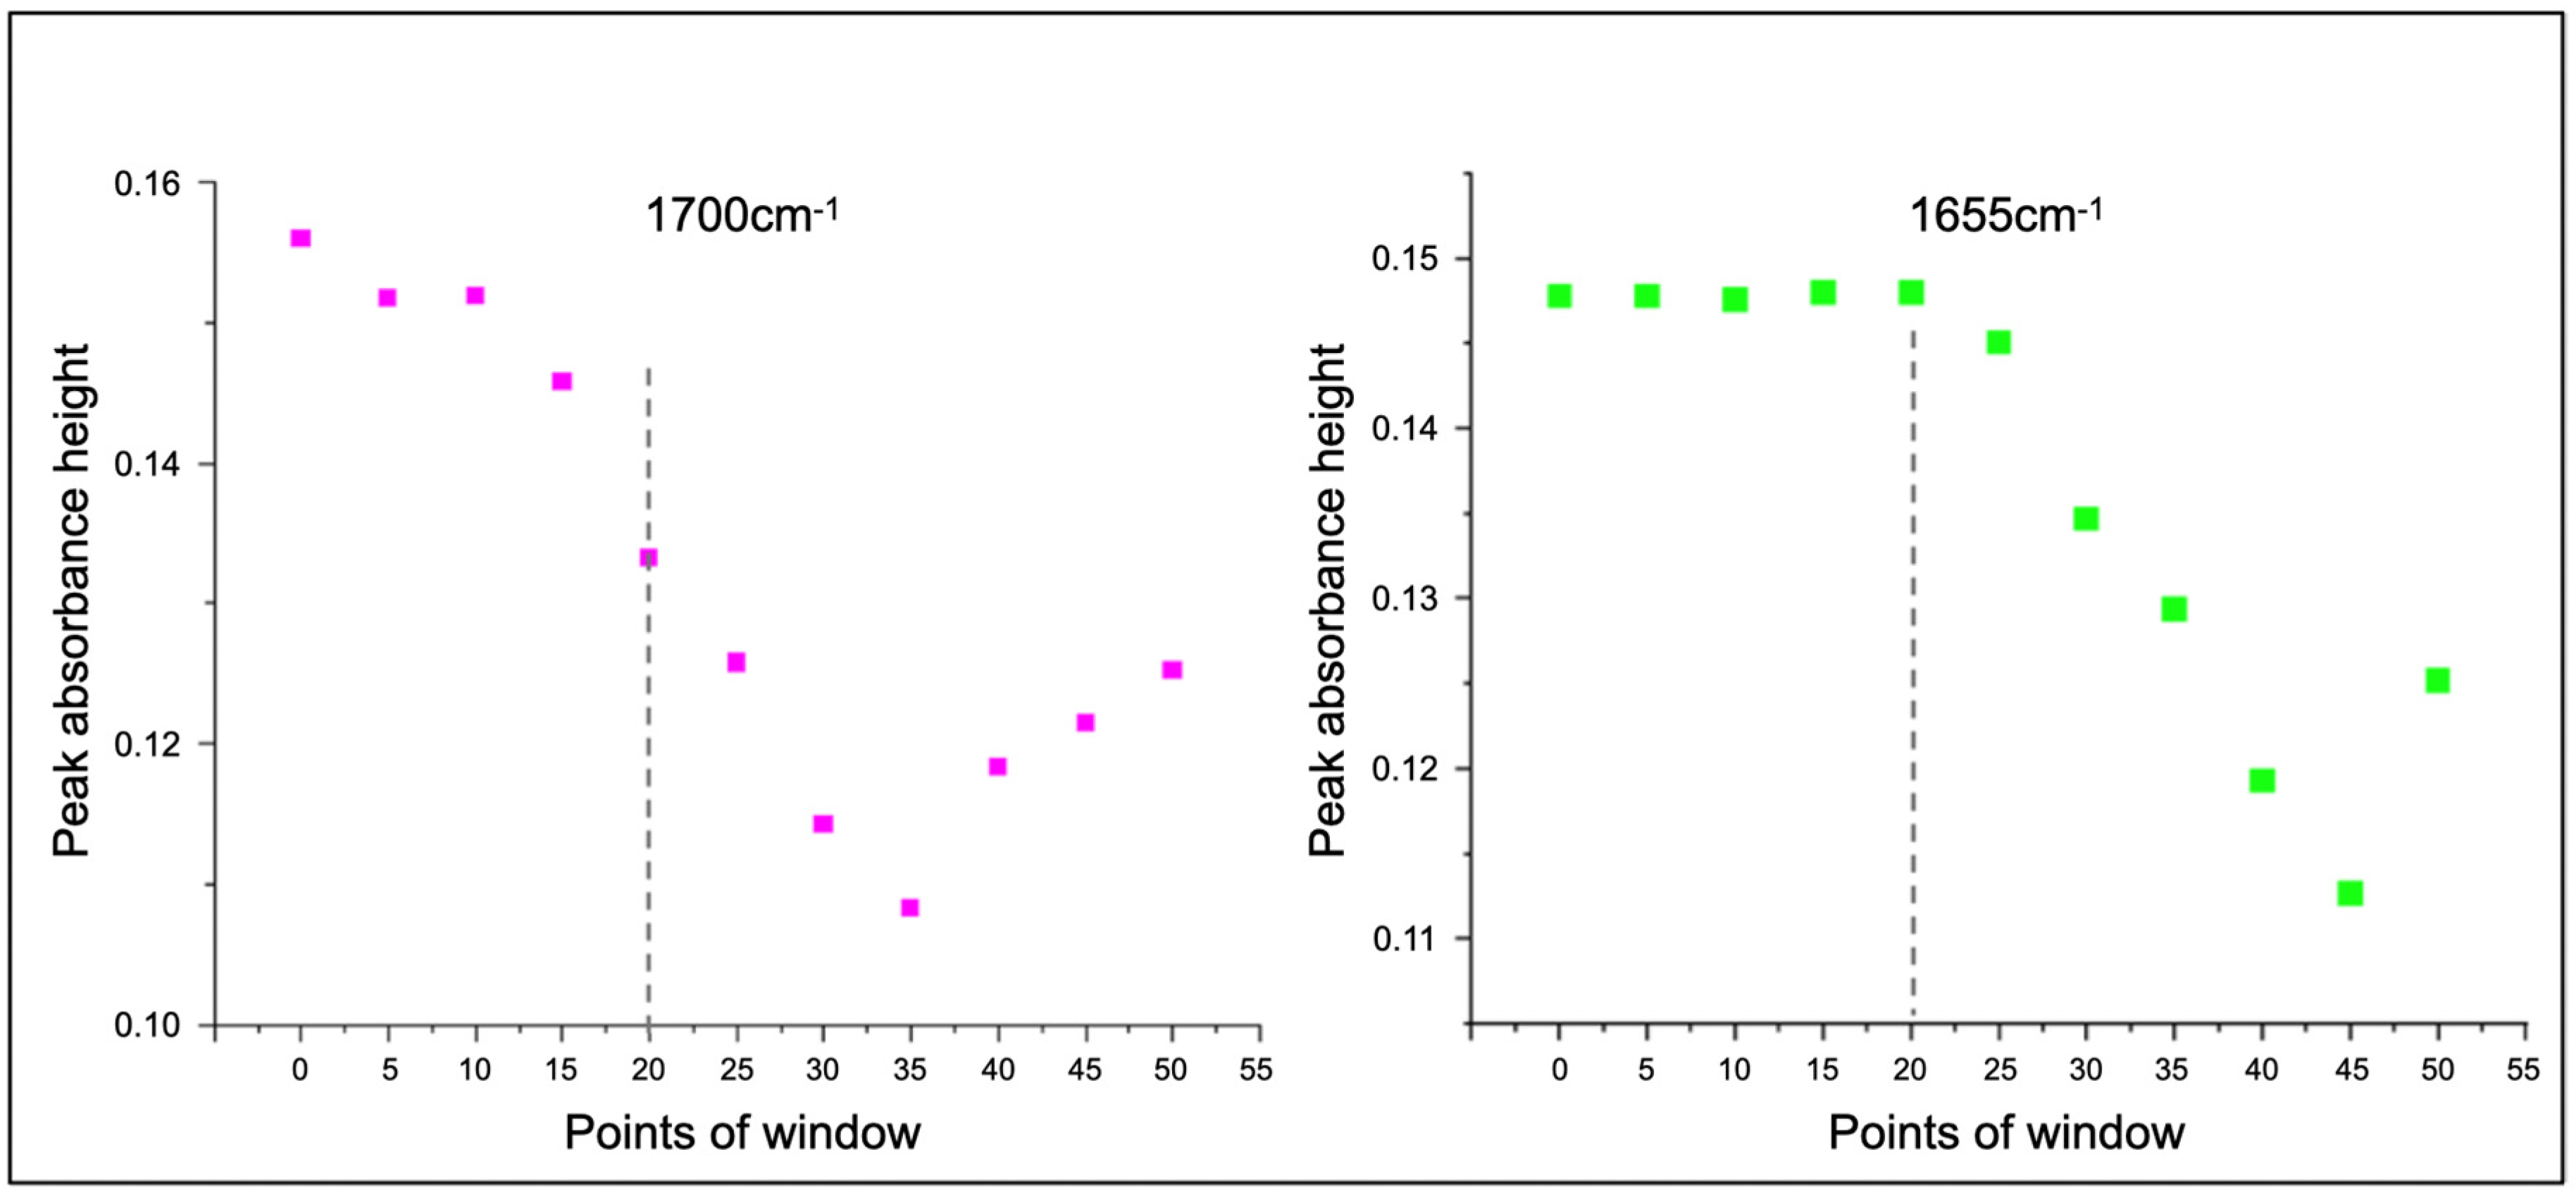
Figure 2 illustrates the effect of signal processing using various window points on the highest peaks identified in the cortisone spectrum (5,000,000 µg/dL). In the graph on the left, corresponding to the peak at 1700–1750 cm−1, variations in peak height can be observed even with minimal signal processing. Conversely, in the graph on the right, at 1600–1680 cm−1, there was virtually no difference in peak height up to 20 window points.
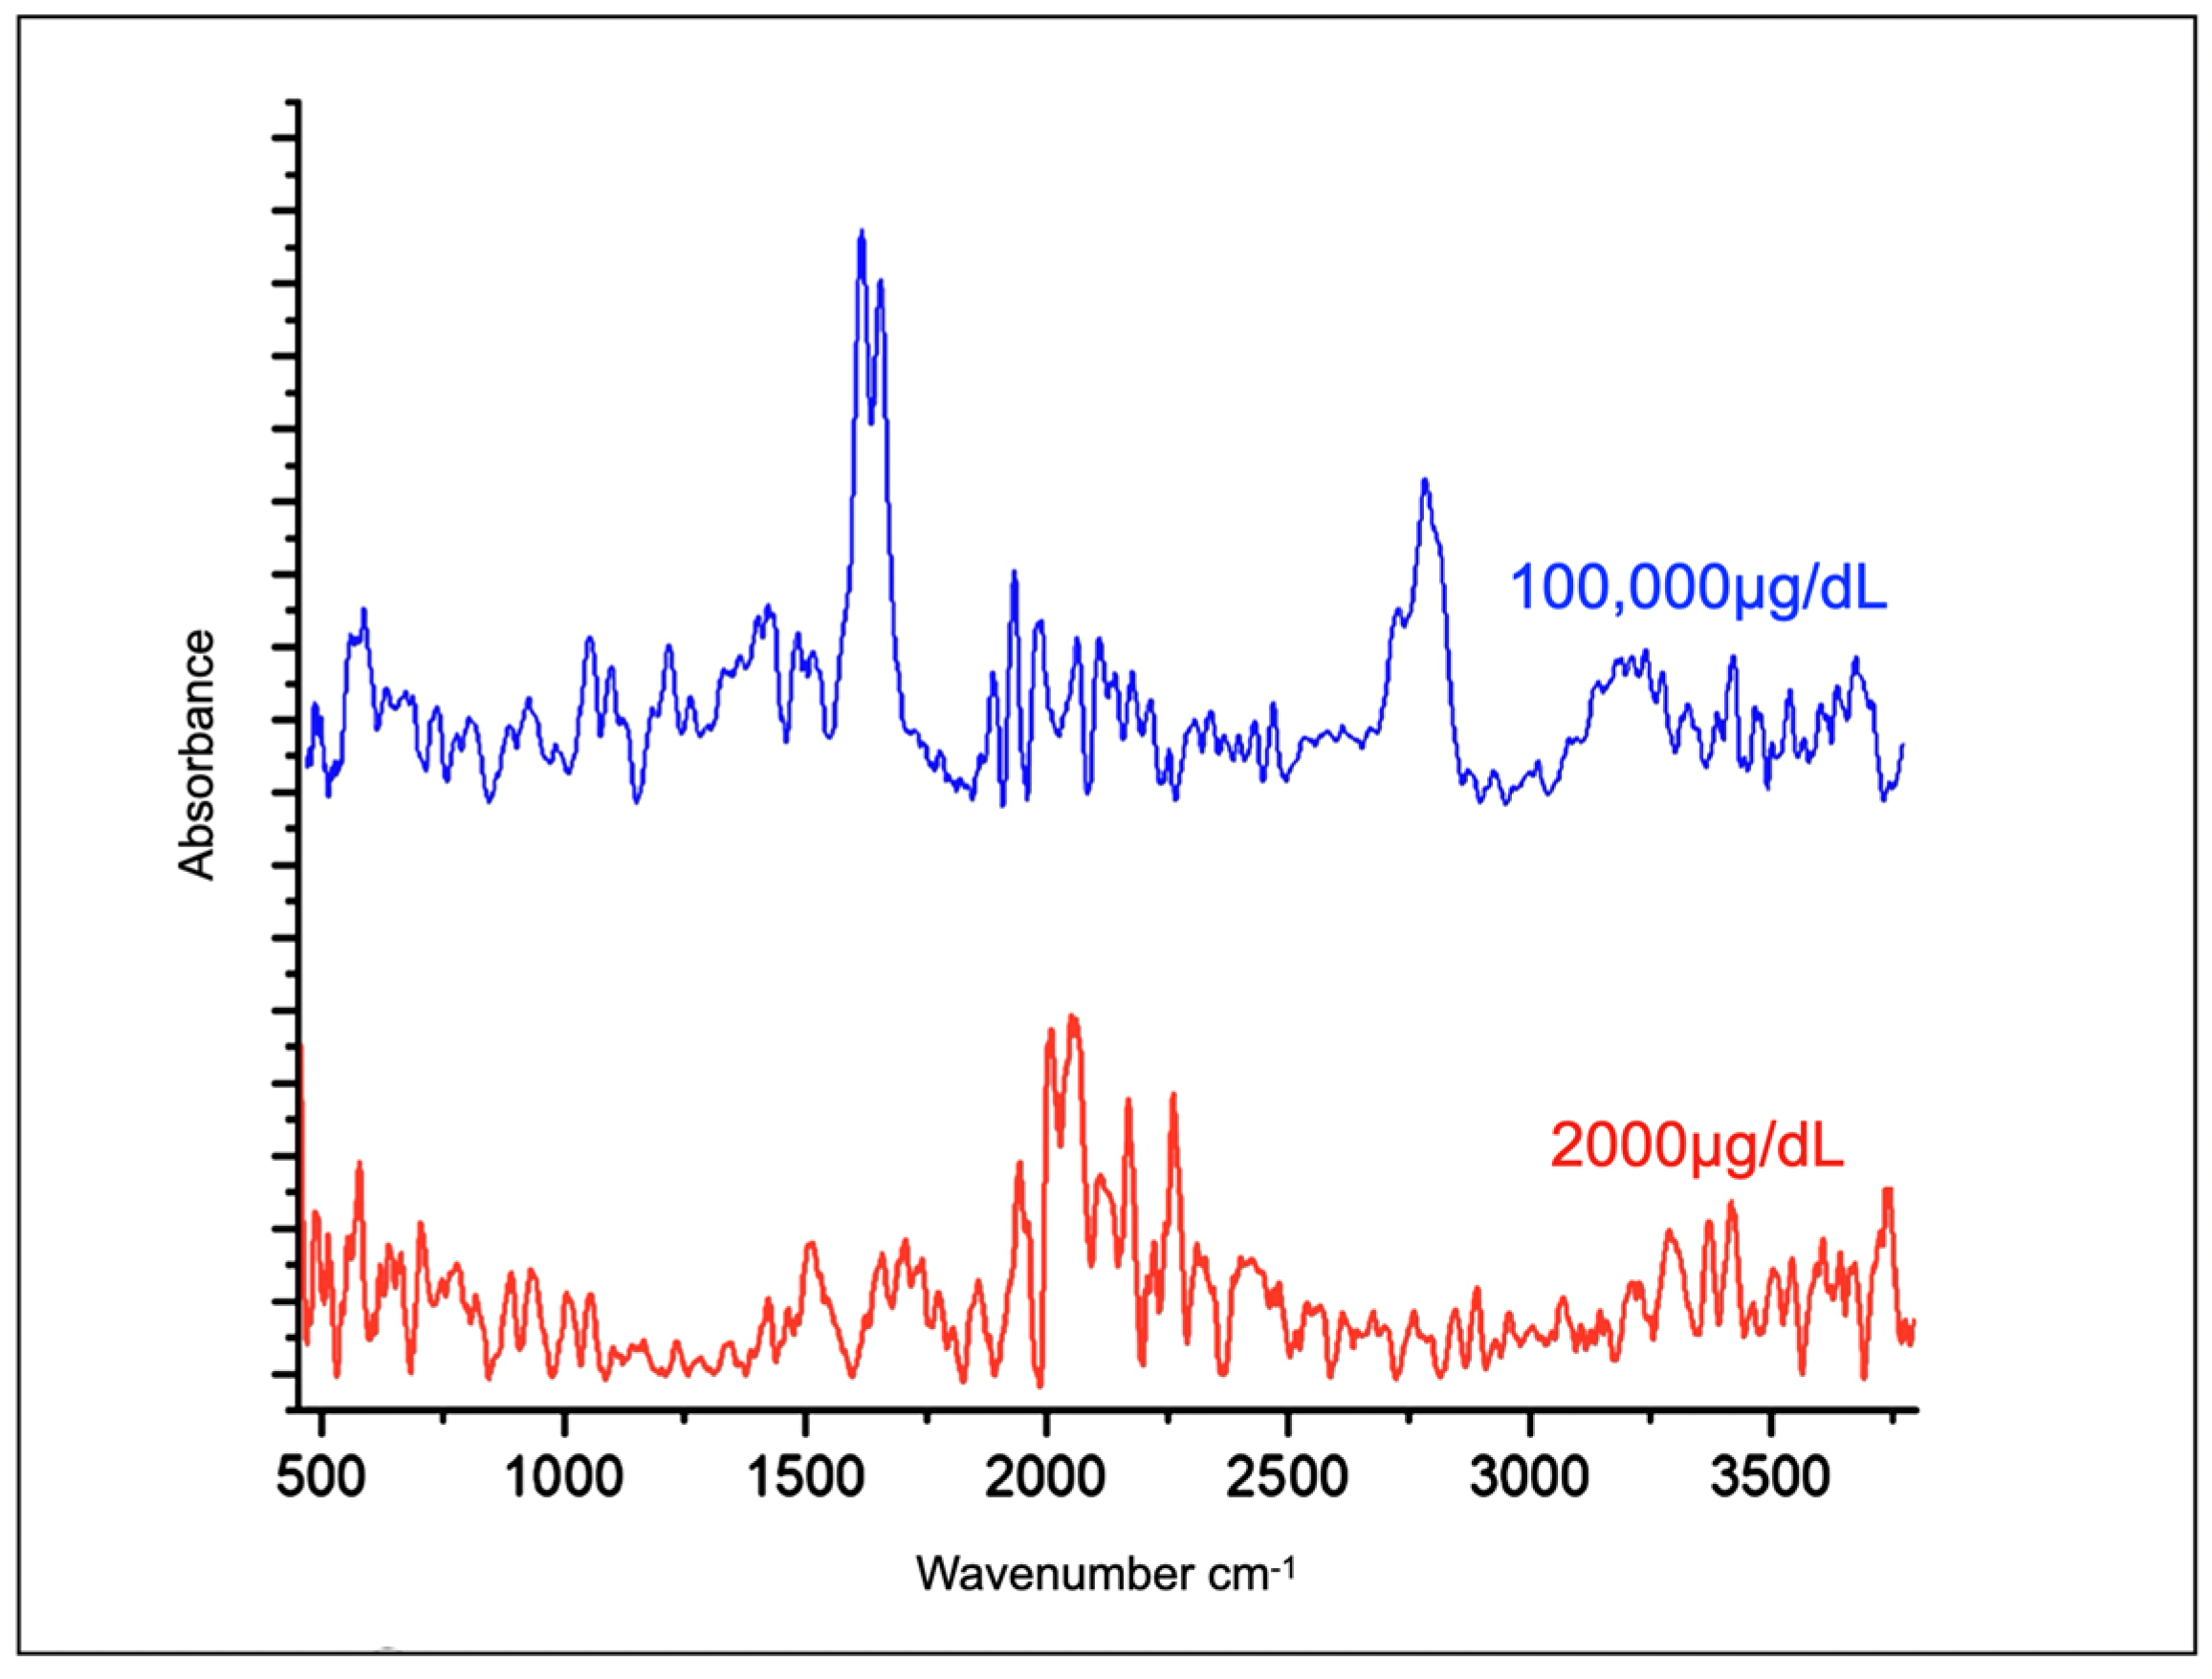
Figure 3 shows the spectrum of cortisone diluted in water at concentrations of 100,000 µg/dL and 2000 µg/dL, after noise and baseline removal. Although cortisone identification was possible, the spectra were not suitable for cortisone quantification.
Regarding the dilutions with the addition of Tween 80, at the highest concentration (0.5%), sample homogeneity promoted by the surfactant was observed. However, only the spectrum of Tween 80 was detected in the graphs obtained. Figure 4 illustrates the spectrum of sorbitol in the five dilutions performed (Table 3). On the left, the 3D graph shows the five obtained spectra, and on the right, the signal-processed spectra of the three lowest concentrations.

4. Discussion

In a solution of cortisone diluted in methanol:chloroform and further diluted in water or in water with polysorbate 80 (Tween 80), it was not possible to perform FTIR analysis for cortisone quantification. However, in the cortisone solution in methanol:chloroform (5,000,000 μg/dL), the cortisone spectrum was clearly observed. The difficulty in detecting cortisone by FTIR in aqueous solutions may be associated with solvent interference and the low concentration of the analyte in the dispersed phase.
Cortisone is the inactive form of cortisol and has a carbonyl group (specifically a ketone) at position 11, responsible for the peak at 1700–1750 cm−1 [27,30]. In contrast, cortisol, which has a hydroxyl group at the same position, does not exhibit this peak but instead shows one in the region of 3200–3600 cm−1 [30]. This distinction could be important for differentiating cortisone from cortisol in saliva samples.
In order to facilitate the dilution of cortisone in water, a surfactant, specifically polysorbate 80 (Tween 80), was added. Cortisone is a liposoluble hormone, and when the analyte, in this case, cortisone, is not solubilized, the light beams passing through the sample experience intense reflection, resulting in significant noise observed in the graph [18]. Furthermore, the probability of the sample not accurately reflecting the actual concentration is high due to the inconsistency of the concentration per area in the dispersion. This can be observed in the concentration graph of 100.000 and 2.000 µg/dL.
Kartsova et al. (2021) demonstrated that microemulsion preconcentration techniques can be effective for extracting steroid hormones from aqueous solutions, significantly increasing concentration factors and improving analytical sensitivity [31]. Tween 80 is a non-ionic surfactant widely used for its biocompatibility and low toxicity. In this study, Tween 80 was used as a surfactant due to its proven efficacy in solubilizing lipophilic compounds in aqueous solutions. Additionally, Tween 80 forms stable micelles that improve the dispersion and homogeneity of solutions, which is crucial for the accuracy of spectroscopic analyses [32,33]. However, the addition of the surfactant Tween 80 masked the cortisone spectrum, although it was possible to detect Tween 80 in quantities as low as 0.0033% of the solution after signal processing (Figure 4).
Some studies have reported the quantification of cortisol in saliva using FTIR [30,34]. However, saliva is composed of 99.99% water, and further laboratory studies are needed to establish proper quantification methods and reliable protocols for cortisone or cortisol quantification [3,6]. Particularly around 1700–1750 cm−1, corresponding to the stretching of the C=O bond in ketones, and a peak around 1600–1680 cm−1 was observed, which is typical of C=O bonds found in cortisone [27]. The quantification of substances using FTIR occurs in a semi-direct manner [20]. The spectrum of a substance in the same medium without interferences is always similar [20,35,36]. However, the height of the most intense peaks, which characterize the substance, varies according to its concentration in the medium [20,35]. In other words, higher concentrations result in higher peaks. This can be illustrated with the spectrum of sorbitol (Figure 4). This figure shows, on the right (in 3D format), the spectra obtained from the dilution seen in Table 2. The highest peak can be seen at 1115 cm−1 in the first two dilutions (3.33% and 0.33% of polysorbate 80). In an initial analysis, in samples 3, 4, and 5, the characteristic peaks of sorbitol are barely visible; however, after signal processing, the detection of the peak at 1115 cm−1 can be observed.
Despite being a widely recognized low-cost and accessible technique, one of the disadvantages attributed to it is the inability to detect small amounts of solute. However, the technique may be able to identify and quantify low concentrations depending on the molecule or substance analyzed, as can be observed in the identification of small concentrations of Tween 80. When compared to the pure spectrum of sorbitol, the characteristic peaks of sorbitol can be clearly identified, but not those of cortisone.
Spectroscopy is an ancient technique that has gained significant momentum over the past two decades [37]. This resurgence is due to advancements in spectrometers, the availability of software for data manipulation, and more recently, machine learning [37,38]. These technological advances can enable the acquisition of spectra with less noise in a reproducible and reliable manner.
However, signal processing must be approached with caution. In the present study, the difference in the height of the main peaks of the cortisone spectrum was evaluated in relation to the intensity of smoothing. The Savitzky-Golay filter was used due to its ability to smooth data without significantly distorting the shape of the signals, which is crucial for the accurate analysis of cortisone peaks. Although the Savitzky-Golay filter is effective, there are alternative methods of smoothing and noise elimination that can be more efficient under certain circumstances. For example, techniques such as convolution with a modified sinc kernel and Whittaker-Henderson smoothing have shown superior results in suppressing high frequencies and reducing noise [29]. Future studies evaluating the impact of these methods on signal processing in the cortisone spectrum are essential to advance the precise quantification of this substance by FTIR. [22,28].
In this study, the heights of the two highest peaks were evaluated to verify the effect of smoothing on peak height. The Savitzky-Golay method was used with intervals of 5/5 window points. As demonstrated in the point graph, there was no significant change due to signal processing in the graph at the heights corresponding to the spatial frequency (wavenumber) of 1600–1680 cm−1 with up to 20 window points. It can be concluded that the highest peak is not always the most suitable for use in the quantification of substances.
Cortisol is a hormone associated with many conditions and chronic diseases. Rapid and cost-effective quantification could enable ambulatory measurement at various times of the day, as studies have shown the importance of the release curve related to the circadian rhythm, rather than measuring cortisol at a single moment of the day. Cortisol levels during the night can drop below 10 µg/dL [39]. Due to the very low levels during the night, salivary cortisone measurement could be more feasible than measuring cortisol in saliva. This is because cortisone in saliva reaches approximately six times the amount of cortisol and reflects serum cortisol levels [6].
This study presents some limitations that should be considered. First, only a single signal processing method, the Savitzky-Golay filter, and one surfactant (Tween 80) were employed for spectral smoothing. However, other signal processing techniques and surfactants could lead to different spectral outcomes and improved detection capabilities. Future studies should explore alternative filtering methods and surfactants to enhance cortisone solubility while maintaining spectral integrity.
Second, the concentrations at which cortisone was observed in this study were significantly higher than physiological levels. While this allowed for a clear identification of cortisone’s spectral features, the challenge remains in detecting and quantifying the hormone at concentrations closer to those found in saliva. Future research should focus on optimizing the methodology to enable reliable detection at lower, biologically relevant levels.
Nevertheless, these limitations do not diminish the value of this research, as the primary objective was to evaluate the feasibility of Fourier Transform Infrared Spectroscopy (FTIR) for cortisone detection and quantification, particularly in aqueous solutions, and to assess the impact of Tween 80 on its spectral characteristics. This study provides important insights into the potential and challenges of using FTIR for cortisone analysis and sets the foundation for further methodological refinements.

5. Conclusions

This study highlights the potential of FTIR as a non-invasive and cost-effective method for the analysis of cortisone in aqueous solutions. The peak between 1600–1680 cm−1 showed stability after smoothing using the Savitzky-Golay method, even with up to 20 points of window, which is a significant finding for FTIR analysis in complex samples. The use of polysorbate 80 (Tween 80) facilitated the dilution of cortisone in water, although it interfered with the observation of the cortisone spectrum. Despite this challenge, FTIR demonstrated strong potential for non-invasive analysis, opening possibilities for further exploration in future studies.

Author Contributions

Conceptualization, L.P.B.A. and L.F.d.C.e.S.d.C.; methodology, S.M.S.D.d.S. and F.H.A.; validation, F.C.D.A. and L.F.d.C.e.S.d.C.; formal analysis, M.A. and L.F.d.C.e.S.d.C.; investigation, L.P.B.A.; resources, L.P.B.A.; data curation, L.P.B.A.; writing—original draft preparation, L.P.B.A.; writing—review and editing, F.C.D.A. and L.F.d.C.e.S.d.C.; supervision, M.A.; project administration, L.P.B.A. All authors have read and agreed to the published version of the manuscript.

Funding

Luis Felipe das Chagas e Silva de Carvalho is funded by Fundação de Amparo à Pesquisa do Estado de São Paulo (FAPESP—2017/21827-1) and by Conselho Nacional de Pesquisa e Desenvolvimento (CNPq—406761/2022-1). Sara Maria Santos Dias da Silva is funded by Fundação de Amparo à Pesquisa do Estado de São Paulo (FAPESP—2022/16091-4).

Data Availability Statement

Data are available upon request to Dr. Luciana P. B. Arcas (draluciana@hotmail.com).

Conflicts of Interest

The authors declare no conflict of interest.

References

  1. Festa, F.; Rotelli, C.; Scarano, A.; Navarra, R.; Caulo, M.; Macrì, M. Functional magnetic resonance connectivity in patients with temporomadibular joint disorders. Front. Neurol. 2021, 12, 629211. [Google Scholar] [CrossRef] [PubMed]
  2. Villa, J.E.L.; Garcia, I.; Jimenez de Aberasturi, D.; Pavlov, V.; Sotomayor, M.D.P.T.; Liz-Marzán, L.M. SERS-based immunoassay for monitoring cortisol-related disorders. Biosens. Bioelectron. 2020, 165, 112418. [Google Scholar] [CrossRef] [PubMed]
  3. Hellhammer, D.H.; Wüst, S.; Kudielka, B.M. Salivary cortisol as a biomarker in stress research. Psychoneuroendocrinology 2009, 34, 163–171. [Google Scholar] [CrossRef] [PubMed]
  4. Stalder, T.; Kirschbaum, C.; Kudielka, B.M.; Adam, E.K.; Pruessner, J.C.; Wüst, S.; Dockray, S.; Smyth, N.; Evans, P.; Hellhammer, D.H.; et al. Assessment of the cortisol awakening response: Expert consensus guidelines. Psychoneuroendocrinology 2016, 63, 414–432. [Google Scholar] [CrossRef]
  5. de Jesus Pinto, W.; Muricy, V.C.; Treto, R.R.R. Ritmos Biológicos No Sistema Endócrino. Braz. J. Dev. 2020, 6, 53677–53696. [Google Scholar] [CrossRef]
  6. Titman, A.; Price, V.; Hawcutt, D.; Chesters, C.; Ali, M.; Cacace, G.; Lancaster, G.A.; Peak, M.; Blair, J.C. Salivary cortisol, cortisone and serum cortisol concentrations are related to age and body mass index in healthy children and young people. Clin. Endocrinol. 2020, 93, 572–578. [Google Scholar] [CrossRef]
  7. Blair, J.; Adaway, J.; Keevil, B.; Ross, R. Salivary cortisol and cortisone in the clinical setting. Curr. Opin. Endocrinol. Diabetes Obes. 2017, 24, 161–168. [Google Scholar] [CrossRef]
  8. Harrison, R.F.; Debono, M.; Whitaker, M.J.; Keevil, B.G.; Newell-Price, J.; Ross, R.J. Salivary Cortisone to Estimate Cortisol Exposure and Sampling Frequency Required Based on Serum Cortisol Measurements. J. Clin. Endocrinol. Metab. 2018, 104, 765–772. [Google Scholar] [CrossRef]
  9. Debono, M.; Harrison, R.F.; Whitaker, M.J.; Eckland, D.; Arlt, W.; Keevil, B.G.; Ross, R.J. Salivary cortisone reflects cortisol exposure under physiological conditions and after hydrocortisone. J. Clin. Endocrinol. Metab. 2016, 101, 1469–1477. [Google Scholar] [CrossRef]
  10. Bäcklund, N.; Brattsand, G.; Israelsson, M.; Ragnarsson, O.; Burman, P.; Engström, B.E.; Høybye, C.; Berinder, K.; Wahlberg, J.; Olsson, T.; et al. Reference intervals of salivary cortisol and cortisone and their diagnostic accuracy in Cushing’s syndrome. Eur. J. Endocrinol. 2020, 182, 569–582. [Google Scholar] [CrossRef]
  11. Shin, S.; Oh, H.; Park, H.R.; Joo, E.Y.; Lee, S.Y. A Sensitive and Specific Liquid Chromatography-Tandem Mass Spectrometry Assay for Simultaneous Quantification of Salivary Melatonin and Cortisol: Development and Comparison with Immunoassays. Ann. Lab. Med. 2020, 41, 108–113. [Google Scholar] [CrossRef] [PubMed]
  12. Holčapek, M.; Kolářová, L.; Nobilis, M. High-performance liquid chromatography-tandem mass spectrometry in the identification and determination of phase I and phase II drug metabolites. Anal. Bioanal. Chem. 2008, 391, 59–78. [Google Scholar] [CrossRef] [PubMed]
  13. Zhang, T.; Zhao, H.; Li, M.; Zeng, J.; Wang, J.; Long, Q.; Wang, Y.; Zhang, C.; Chen, W. Development and validation of a candidate reference method for serum cortisol by isotope dilution liquid chromatography-tandem mass spectrometry combined with dextran sulfate-Mg2+ precipitation. Anal. Bioanal. Chem. 2020, 412, 1325–1333. [Google Scholar] [CrossRef] [PubMed]
  14. Nugrahani, I.; Fauzia, R. Quantitative vibrational methods development and its performance comparison to colorimetry on the assay of kanamycin sulfate. Int. J. Appl. Pharm. 2019, 11, 426–435. [Google Scholar] [CrossRef]
  15. Perogamvros, I.; Owen, L.J.; Newell-Price, J.; Ray, D.W.; Trainer, P.J.; Keevil, B.G. Simultaneous measurement of cortisol and cortisone in human saliva using liquid chromatography-tandem mass spectrometry: Application in basal and stimulated conditions. J. Chromatogr. B 2009, 877, 3771–3775. [Google Scholar] [CrossRef]
  16. Fahelelbom, K.M.; Saleh, A.; Al-Tabakha, M.M.A.; Ashames, A.A. Recent applications of quantitative analytical FTIR spectroscopy in pharmaceutical, biomedical, and clinical fields: A brief review. Rev. Anal. Chem. 2022, 41, 21–33. [Google Scholar] [CrossRef]
  17. Fadlelmoula, A.; Pinho, D.; Carvalho, V.H.; Catarino, S.O.; Minas, G. Spectroscopy to Analyse Human Blood over the Last 20 Years: A Review towards Lab-on-a-Chip Devices. Micromachines 2022, 13, 187. [Google Scholar] [CrossRef]
  18. Mayerhöfer, T.G.; Ivanovski, V.; Popp, J. Infrared Refraction Spectroscopy. Appl. Spectrosc. 2021, 75, 1526–1531. [Google Scholar] [CrossRef]
  19. Qu, S.; Wu, G.; Fang, J.; Zang, D.; Xing, H.; Wang, L.; Wu, H. Dielectric and Magnetic Loss Behavior of Nanooxides. In Dielectric and Magnetic Materials; Elsevier: Amsterdam, The Netherlands, 2017; pp. 323–461. [Google Scholar] [CrossRef]
  20. Nerdy, N.; Margata, L.; Sembiring, B.M.; Ginting, S.; Putra, E.d.L.; Bakri, T.K. Validation of the developed zero-order infrared spectrophotometry method for qualitative and quantitative analyses of tranexamic acid in marketed tablets. Molecules 2021, 26, 6985. [Google Scholar] [CrossRef]
  21. Amais, R.S.; Rocha, F.R.P.; Nóbrega, J.A. Sinais de fundo em análise instrumental: Uma discussão essencial em cursos de graduação. Quim. Nova 2017, 40, 228–237. [Google Scholar] [CrossRef]
  22. Luo, J.; Ying, K.; Bai, J. Savitzky-Golay smoothing and differentiation filter for even number data. Signal Process. 2005, 85, 1429–1434. [Google Scholar] [CrossRef]
  23. Nogueira, M.S.; Leal, L.B.; Macarini, W.; Pimentel, R.L.; Muller, M.; Vassallo, P.F.; Campos, L.C.G.; dos Santos, L.; Luiz, W.B.; Mill, J.G.; et al. Rapid diagnosis of COVID-19 using FT-IR ATR spectroscopy and machine learning. Sci. Rep. 2021, 11, 15409. [Google Scholar] [CrossRef] [PubMed]
  24. Nogueira, M.S.; Barreto, A.L.; Furukawa, M.; Rovai, E.S.; Bastos, A.; Bertoncello, G.; Carvalho, L.F.D.C.E.S.D. FTIR spectroscopy as a point of care diagnostic tool for diabetes and periodontitis: A saliva analysis approach. Photodiagnosis Photodyn. Ther. 2022, 40, 103036. [Google Scholar] [CrossRef] [PubMed]
  25. Manna, L.; Banchero, M. Solubility of Cortisone and Hydrocortisone in Supercritical Carbon Dioxide and Ethanol. J. Chem. Eng. Data 2023, 68, 601–611. [Google Scholar] [CrossRef]
  26. Schmidt, A.; Koulov, A.; Huwyler, J.; Mahler, H.C.; Jahn, M. Stabilizing Polysorbate 20 and 80 Against Oxidative Degradation. J. Pharm. Sci. 2020, 109, 1924–1932. [Google Scholar] [CrossRef]
  27. Chemistry Database. Infrared Spectroscopy Absorption Table—OChemOnline. LibreTexts 2020, 1–6. Available online: https://chem.libretexts.org/@go/page/22645 (accessed on 31 March 2025).
  28. Movasaghi, Z.; Rehman, S.; Rehman, I.U. Fourier transform infrared (FTIR) spectroscopy of biological tissues. Appl. Spectrosc. Rev. 2008, 43, 134–179. [Google Scholar] [CrossRef]
  29. Schmid, M.; Rath, D.; Diebold, U. Why and How Savitzky-Golay Filters Should Be Replaced. ACS Meas. Sci. Au 2022, 2, 185–196. [Google Scholar] [CrossRef]
  30. Fernandes, J.; Silva, R.; Oliveira, L.; Santos, A. Line Shape Analysis of Cortisol Infrared Spectra for Salivary Sensors: Theoretical and Experimental Observations. In XXVII Brazilian Congress on Biomedical Engineering; Springer: Cham, Switzerland, 2020; pp. 1345–1352. [Google Scholar] [CrossRef]
  31. Kartsova, L.A.; Solov’eva, S.A.; Bessonova, E.A. Microemulsion Preconcentration of Steroid Hormones from Aqueous Solutions and Urine Samples. J. Anal. Chem. 2021, 76, 1058–1064. [Google Scholar] [CrossRef]
  32. Wang, C.; Yang, Y.; Cui, X.; Ding, S.; Chen, Z. Three different types of solubilization of thymol in Tween 80: Micelles, solutions, and emulsions—A mechanism study of micellar solubilization. J. Mol. Liq. 2020, 306, 112901. [Google Scholar] [CrossRef]
  33. Szymczyk, K.; Taraba, A. Properties of aqueous solutions of nonionic surfactants, Triton X-114 and Tween 80, at temperatures from 293 to 318 K: Spectroscopic and ultrasonic studies. Chem. Phys. 2017, 483–484, 96–102. [Google Scholar] [CrossRef]
  34. Lemes, L.C.; Cesar, P.; Júnior, C.; Strixino, J.F.; Aguiar, J. Analysis of serum cortisol levels by Fourier Transform Infrared Spectroscopy for diagnosis of stress in athletes. Res. Biomed. Eng. 2016, 32, 293–300. [Google Scholar] [CrossRef]
  35. Chechekina, O.G.; Tropina, E.V.; Fatkhutdinova, L.I.; Zyuzin, M.V.; Bogdanov, A.A.; Ju, Y.; Boldyrev, K.N. Machine learning assisted rapid approach for quantitative prediction of biochemical parameters of blood serum with FTIR spectroscopy. Spectrochim. Acta A Mol. Biomol. Spectrosc. 2025, 326, 125283. [Google Scholar] [CrossRef] [PubMed]
  36. AlKadi, H.; Alzier, A.; Mando, H.; Mando, Z.; Darwicha, J.A.N.; Allaf, A.W. Quantitative Determination of Pitavastatin in Tablets Using FTIR and RP-HPLC Analysis: A Comparative Study. Infect. Disord. Drug Targets 2022, 22, 49–55. [Google Scholar] [CrossRef] [PubMed]
  37. Vigo, F.; Tozzi, A.; Disler, M.; Gisi, A.; Kavvadias, V.; Kavvadias, T. Vibrational Spectroscopy in Urine Samples as a Medical Tool: Review and Overview on the Current State-of-the-Art. Diagnostics 2023, 13, 27. [Google Scholar] [CrossRef]
  38. Wang, Y.; Li, M.; Ji, R.; Wang, M.; Zhang, Y.; Zheng, L. Mark-Spectra: A convolutional neural network for quantitative spectral analysis overcoming spatial relationships. Comput. Electron. Agric. 2022, 192, 106624. [Google Scholar] [CrossRef]
  39. Brum, M.C.B.; Senger, M.B.; Schnorr, C.C.; Ehlert, L.R.; da Costa Rodrigues, T. Effect of night-shift work on cortisol circadian rhythm and melatonin levels. Sleep Sci. 2022, 15, 143–148. [Google Scholar] [CrossRef]
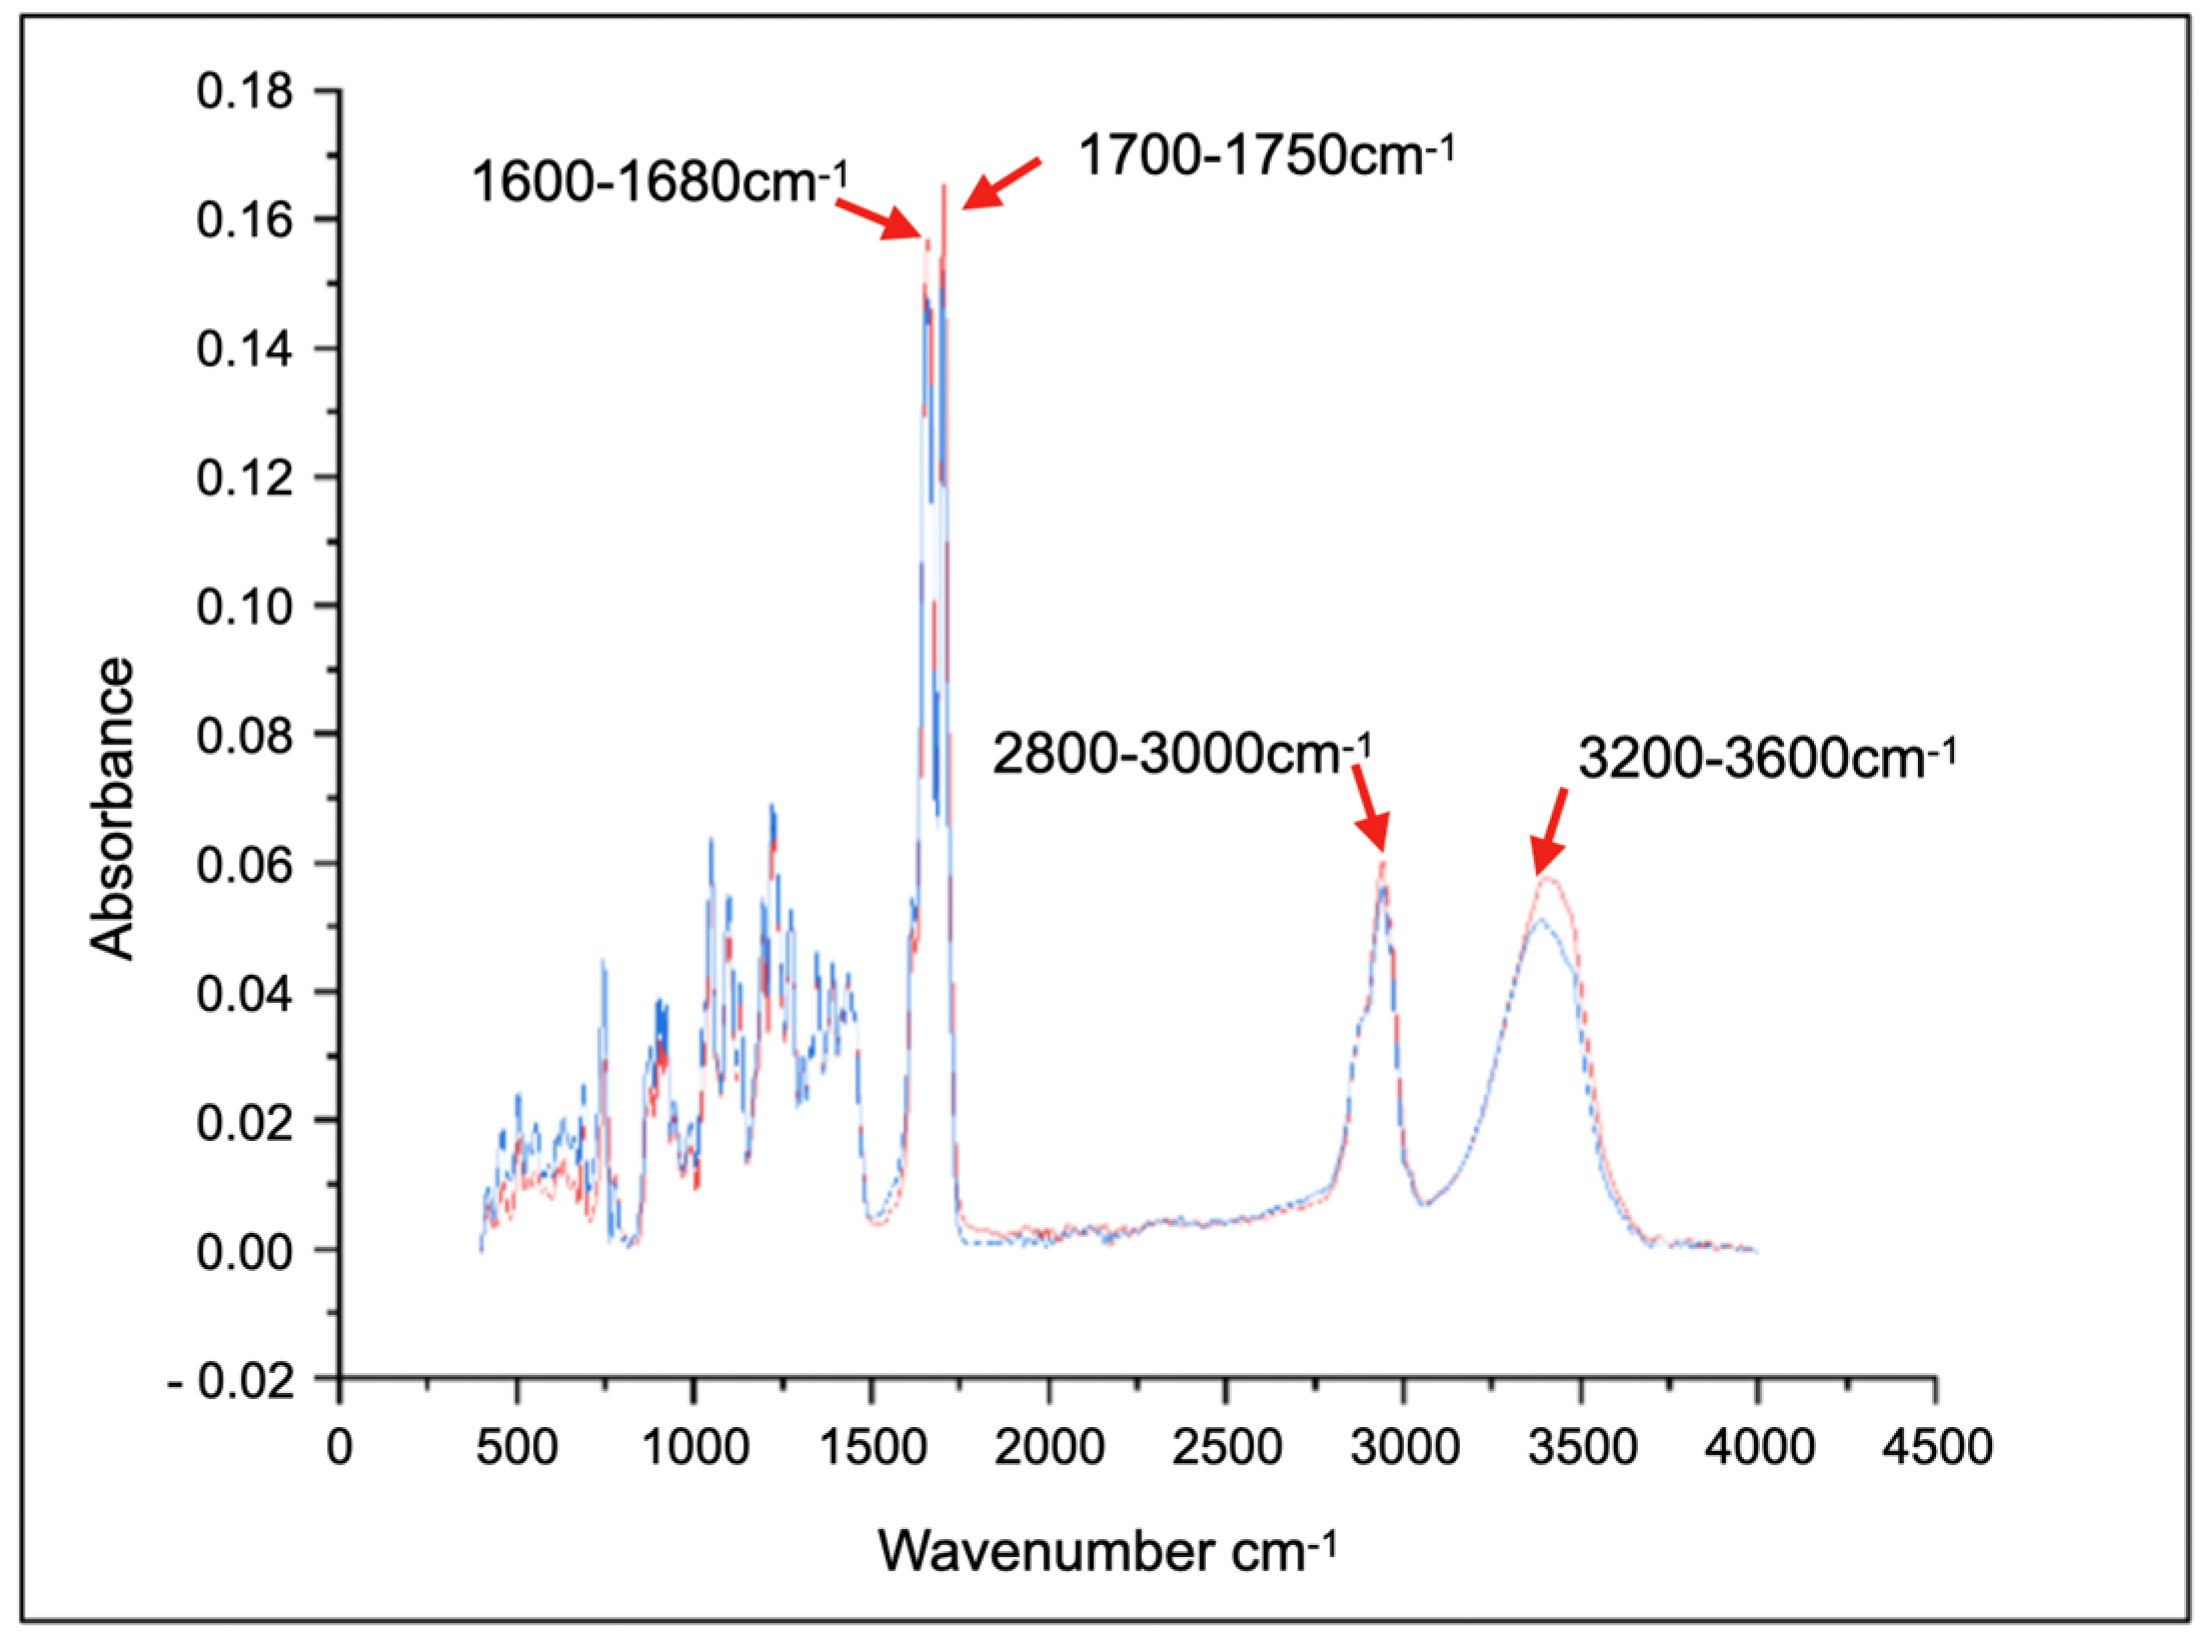
Figure 1. Overlay of spectra from three samples of cortisone solution in methanol and chloroform (5,000,000 µg/dL).
Processes 13 01112 g001
Figure 2. Signal processing effect using Savitzky-Golay filter on the main peaks of the cortisone spectrum.
Processes 13 01112 g002
Figure 3. The spectrum of cortisone dispersion in water underwent signal processing and baseline removal. At a concentration of 2000 µg/dL, cortisone cannot be identified. In blue, the spectrum can be observed, but contains significant noise.
Processes 13 01112 g003
Figure 4. FTIR spectra of the dilution series of cortisone with Tween 80 (0.5%). The peak at 1115 cm−1, characteristic of Tween 80, is not clearly identified in the lower concentration curves of the 3D plot on the left (green, yellow, and blue lines), but becomes visible after signal processing in the right-hand plot, where a difference in peak height between the green and yellow curves is also observed, corresponding to different concentrations of Tween 80. No bands attributable to cortisone were observed. This demonstrates the sensitivity of the FTIR method in detecting microconcentrations of matrix components.
Processes 13 01112 g004
Table 1. Dilution of cortisone solution in water.
Serial Dilution (1:50—1 mL Solution + 49 mL Ultrapure Water Type I)
StageInitial Concentration (µg/dL)Concentration After Dilution (µg/dL)
1st5,000,000100,000
2nd100,0002000
3rd200040
4th400.8
5th0.80.016
Table 2. Dilution of cortisone (5,000,000 µg/dL) plus surfactant (0.2 mL) solution in water.
1 mL Solution + 9 mL Ultrapure Water Type 1
StageCortisone (µg/dL)Tween 80 (%)
1st416,666.161.66
2nd41,666.660.16
3rd4166.660.016
4th416.660.0016
5th41.660.00016
Table 3. Dilution of cortisone (5,000,000 µg/dL) plus surfactant (0.5 mL) solution in water.
1 mL Solution + 9 mL Ultrapure Water Type 1
StageCortisone (µg/dL)Tween 80 (%)
1st333,333.333.33
2nd33,333.330.33
3rd3333.330.033
4th333.330.0033
5th33.330.00033
Table 4. Functional groups identified in the cortisone spectrum.
Wavenumber
Range (cm−1)
IntensityShapeBond TypeFunctional Group
1600–1680StrongSharpC=CAlkene
1700–1750StrongSharpC-OKetone
2800–3000MediumSharpC-HAlkyl and Methyl
3200–3600MediumBroadOHHydroxyl
Disclaimer/Publisher’s Note: The statements, opinions and data contained in all publications are solely those of the individual author(s) and contributor(s) and not of MDPI and/or the editor(s). MDPI and/or the editor(s) disclaim responsibility for any injury to people or property resulting from any ideas, methods, instructions or products referred to in the content.