Article

On the Fluid Behavior Response Characteristics During Early Stage of CBM Co-Production in Superimposed Pressure Systems: Insights from Experimental Analysis

1
College of Mining, Liaoning Technical University, Fuxin 123000, China
2
China Coal Research Institute, Beijing 100013, China
3
State Key Laboratory of Coal Mine Disaster Dynamics and Control, Chongqing University, Chongqing 400030, China
4
Shanxi Jinxing Energy Co., Ltd., Lyuliang 035300, China
*
Authors to whom correspondence should be addressed.
Processes 2025, 13(4), 1095; https://doi.org/10.3390/pr13041095
Submission received: 9 December 2024 / Revised: 25 February 2025 / Accepted: 27 February 2025 / Published: 5 April 2025
(This article belongs to the Special Issue Advances in Coal Processing, Utilization, and Process Safety)

Abstract

:
The fluid disturbance effect is a significant challenge in CBM (CBM) co-production within superimposed pressure systems in China. To address the unique CBM reservoir of superimposed pressure systems, a CBM co-production experimental apparatus for multi-pressure systems has been independently developed. To comprehensively understand fluid behavior during the early stage of CBM co-production, two sets of experiments were conducted using the self-developed physical simulation test device: one in single-production mode and the other in co-production mode. The dynamic response of reservoir fluids and gas production characteristics were analyzed, and the fluid disturbance mechanism under wellbore fluid confluences was explored. The method adopted in this study addresses the issues of traditional co-production equipment, such as the use of series-parallel core holders, small dimensions, limited monitoring capabilities, single loading methods, and the lack of consideration for wellbore co-production flow disturbance and fluid redistribution in superimposed pressure systems. The following results were obtained: ① A flow disturbance effect emerges when fluids from coal reservoirs with different pressure properties converge and mix in a main wellbore. The pressure inside the four horizontal wells simultaneously reaches 1.45 MPa at t = 0.03 min. ② Based on the fluid disturbance effect, the evolution process of wellbore pressure is categorized into two stages: the confluence disturbance stage and the confluence pressure drop stage. ③ This fluid disturbance effect exacerbates the disparities among coal reservoirs, facilitating fluid exchange between the main wellbore and coal reservoirs through branch wellbores. Under the co-production mode, the instantaneous gas production of the No. 1 coal reservoir reaches its maximum negative value at the moment of production, amounting to −3.85 L/min, indicating that a portion of the fluid from high-pressure coal reservoirs flows back into low-pressure coal reservoirs. ④ A dynamic characterization compatibility method is proposed based on the differences in fluid flow between the single and co-production modes during the early stage of CBM production. For example, at t = 0.1 min, the pressure compatibility coefficients of the No. 1–4 coal reservoirs are 0.72, 0.45, 0.34, and 0.33, respectively. The pressure compatibility and production compatibility coefficients exhibit rapid growth during the early stages, followed by a slight decrease during the middle and later stages. ⑤ The worst compatibility performances are observed during the early stage of CBM co-production, but these performances improve as the co-production time extends. ⑥ Optimizing superimposed pressure systems involves progressive co-production: dynamically introducing coal reservoirs, balancing reservoir pressure, minimizing fluid disturbance, and enhancing recovery efficiency.

1. Introduction

Coal serves as the primary energy resource in China, accounting for 56.0% of its total national energy supply in 2021 [1]. The overuse of coal and oil resources has negatively impacted the country’s ecosystems [2,3]. As public awareness of environmental conservation rises, coalbed methane (CBM) resources, regarded as efficient and clean unconventional natural gas resources, have been increasingly developed globally [4,5]. The CBM co-production method in areas with multiple coal reservoirs can convert uneconomic and thick marginal and thin coal reservoirs into valuable reservoirs [6,7].
In eastern Yunnan and western Guizhou, the most abundant resources of CBM are in southern China. The primary coal-bearing strata are the Changxing Formation and the Longtan Formation, with a total CBM resource volume of about 32.04 × 10⁸ m3, which accounts for about 10% of China’s total national CBM resource volume [6,8,9]. In this area, the distances between coal reservoirs are relatively small, and the coal reservoirs are relatively closely spaced, exhibiting the distinctive characteristic of coal reservoir group development. Meanwhile, multiple sets of independent gas-bearing systems are developed vertically, characterized by superimposed pressure systems [10]. In the two pilot demonstration zones of coalbed methane development in eastern Yunnan, there are 8–16 minable coal reservoirs in the Enhong demonstration zone, with an accumulated thickness of 9.35–26.27 m. In the Laochang demonstration zone, there are 5–14 minable coal reservoirs with an accumulated thickness of 14–26 m and an average thickness of 20 m. The pilot demonstration area situated in western Guizhou is the Songhe block within the Tucheng syncline, encompassing 2–24 minable coal reservoirs that collectively possess an accumulated thickness ranging from 3.0 to 29.8 m [11]. In the eastern Guizhou region, CBM wells are primarily concentrated in the Tucheng Syncline and Yangmeishu Syncline in Panxian County. Among these, the Songhe exploration area has deployed clustered well groups GP-1 to GP-9 and the GC-1 CBM parameter well. Currently, the producing CBM wells in the Yangmeishu Syncline include three wells: DC-1, YMC-1, and QSC-1. Notably, the YMC-1 well exhibits high production characteristics, while the GP-3, GP-4, GP-5, GP-6, and GP-8 wells in the Songhe block are classified as medium-production wells, with the remaining wells being predominantly low-production. In contrast, CBM development in the eastern Yunnan region is mainly focused on the Laochang Basin, located in the southeastern part of Fuyuan County [12].
In contrast, the single-well production of CBM wells in eastern Yunnan has not achieved industrial gas flow breakthrough. The main reason for the above phenomenon is that many relatively thin coal seams exist in eastern Yunnan and western Guizhou. The frequent interaction of marine and continental coal measures deposits has resulted in the formation of superimposed pressure systems in the vertical direction, with a complex lithologic combination. The superimposed pressure systems provide superior gas sources and preservation conditions, which provide favorable conditions for CBM development [10,11,12,13]. On the other hand, it leads to the superposition of multiple fluid pressure systems to superimpose, making it challenging to regulate the redistribution and transmission of fluid energy among the systems involved in CBM co-production (as shown in Figure 1). It is easy to destroy the dynamic balance effect between systems due to poor compatibility, and the technology of the CBM co-production faces significant challenges. Based on the superimposed pressure systems, the fluid disturbance is common in the CBM co-production, limiting the maximum production capacity release. Hence, the investigation of the fluid flow mechanism underlying CBM co-production in superimposed pressure systems holds significant theoretical importance and practical worth, which is vital for guaranteeing the sustainable development and utilization of CBM resources.
To accurately understand the fluid effects in multi-gas reservoirs and effectively guide the efficient development of gas wells, a series of test devices have been designed for the development methods of multi-gas reservoirs. The disturbance of fluid in CBM co-production is still in the exploratory stage, and current physical simulation experiments have revealed common understandings [2,6,7,12,14,15,16,17,18,19,20,21,22]. In the physical simulation device for the co-production of a double-layer coalbed methane reservoir, the convergence point of the two gas flow paths in the wellbore simulation system creates a site for interlayer interference, and the forward and reverse flow rates of the upper and lower layers are monitored through bidirectional flow meters [6]. The physical simulation device for co-production in superposed gas-bearing systems can simulate the gas and water flow processes during CBM co-production in superposed gas-bearing systems under high-temperature and high-pressure conditions, achieving separate measurements of gas and water flow rates entering and exiting the reservoir specimens [7]. The physical simulation device for combined desorption of double-layer coalbed methane reservoirs integrates the characteristics of multi-layer CBM reservoirs and CBM co-production features, enabling simultaneous simulation of the bottom-hole pressure in each co-production reservoir and each individual reservoir [14]. The physical simulation device for multi-layer co-production uses permeable materials between adjacent coal seams to better reflect actual formation conditions, allowing uniform interlayer crossflow and simulating the fluid flow processes within single layers and between multiple coal seams during CBM co-production [16]. The simulation experiment device for multi-reservoir production damage can replace traditional permeability measurements with constant pressure or constant flow rate methods, simulating the fluid flow state of multi-lithology reservoirs entering the wellbore simultaneously under different pressures [17,18]. In the simulation experiment device for CBM co-production of superposed gas-bearing systems, the coal reservoir simulation unit and the CBM extraction unit are the core components. This device can simulate the gas reservoir and CBM occurrence conditions of stacked gas-bearing systems under different well-type conditions, featuring advantages such as large-scale coal rock specimens, true triaxial stress loading, intelligent data monitoring, and multi-purpose integration [22]. The above research indicates that under the condition of multi-pressure system co-production, the borehole breakthrough disrupts the dynamic balance of fluid energy among various reservoirs, leading to fluid disturbance during co-production. Simultaneously, gases originating from multiple reservoirs interfere with each other as they converge into the wellbore from different pressure systems, affecting gas flow in the reservoirs, causing production damage, and reducing gas production capacity. Upon summarizing the existing physical simulation results, it has been found that multi-pressure system co-production is sensitive to reservoir physical properties and co-production patterns. Differences in interlayer pressure, permeability, effective stress, water saturation, and other factors may all induce fluid disturbance during co-production and production damage to the reservoirs. Strategies such as constant-pressure co-production, constant-production co-production, alternating and progressive production systems, and controlled production pressure differentials may be effective in reducing fluid disturbance and production damage during co-production.
Compared to physical simulation, numerical simulation boasts numerous advantages, such as repeatability and low cost. Currently, research on the dynamic changes of reservoir parameters in CBM co-production predominantly relies on numerical simulation and mathematical modeling. Xiong et al. established a dual-layer non-crossflow homogeneous gas reservoir model to analyze the influence of factors such as gas pressure and reservoir physical properties on co-production. They concluded that when the pressure coefficients are similar, differences in reservoir physical properties are the primary cause of interlayer interference [23]. Guided by the theory of superimposed pressure systems, Fu et al. proposed a progressive drainage strategy: first, the gas-bearing system with higher critical desorption pressure and gas production pressure is drained. When the pressure drops to the critical desorption and production pressures of another gas-bearing system, co-production of the two systems is initiated [24]. Jiang et al. used COMET 3 software to simulate the productivity of CBM co-production in the Bide-Santang Basin in western Guizhou, concluding that reservoir physical properties and hydrogeological conditions form the basis for co-production within and across gas-bearing systems, with permeability differential being the main factor affecting productivity contribution distribution, and the impact of production layer spacing reaching up to 70%, while the influence of reservoir pressure gradient is relatively limited [25]. Li et al. established a numerical model for the synergistic production of CBM and tight gas, systematically analyzing the dynamic changes in permeability and reservoir pressure during co-production, and suggested that single wellbore co-production of coal series gases also experiences interlayer interference due to pressure imbalance [26]. Wang et al. Simulated CBM co-production in the Huangnitang Syncline in Guizhou, with results showing that the effect of pressure-to-storage ratio and permeability on recovery rate is more than twice that of other factors [27]. Wang et al. constructed a geological-mathematical model for CBM co-production production layer groups, discussing the control mechanisms of permeability differential, reservoir fluid pressure difference, and production layer spacing on productivity contribution distribution and interlayer interference from an engineering adaptation perspective [28]. In summary, under CBM co-production conditions, the wellbore’s connecting effect merges multiple gas-bearing systems into a single pressure system. When the attribute differences between the gas-bearing systems are significant, the dynamic equilibrium state of fluid energy among the systems is disrupted, leading to interlayer interference or incompatibility phenomena.
To address the aforementioned challenges, an independently developed physical simulation test system for CBM production in large-scale multi-field coupling superimposed pressure systems has been used to perform the physical simulations on CBM co-production in superimposed pressure systems. The fluid dynamic response characteristics of the reservoir and their gas-production characteristics during the early stages of the single production and co-production have been analyzed. Meanwhile, the formation mechanism of fluid behavior under well-hole fluid confluences has been explored, and the disturbance degrees of CBM co-production have been quantitatively evaluated.

2. Simulation Test Method

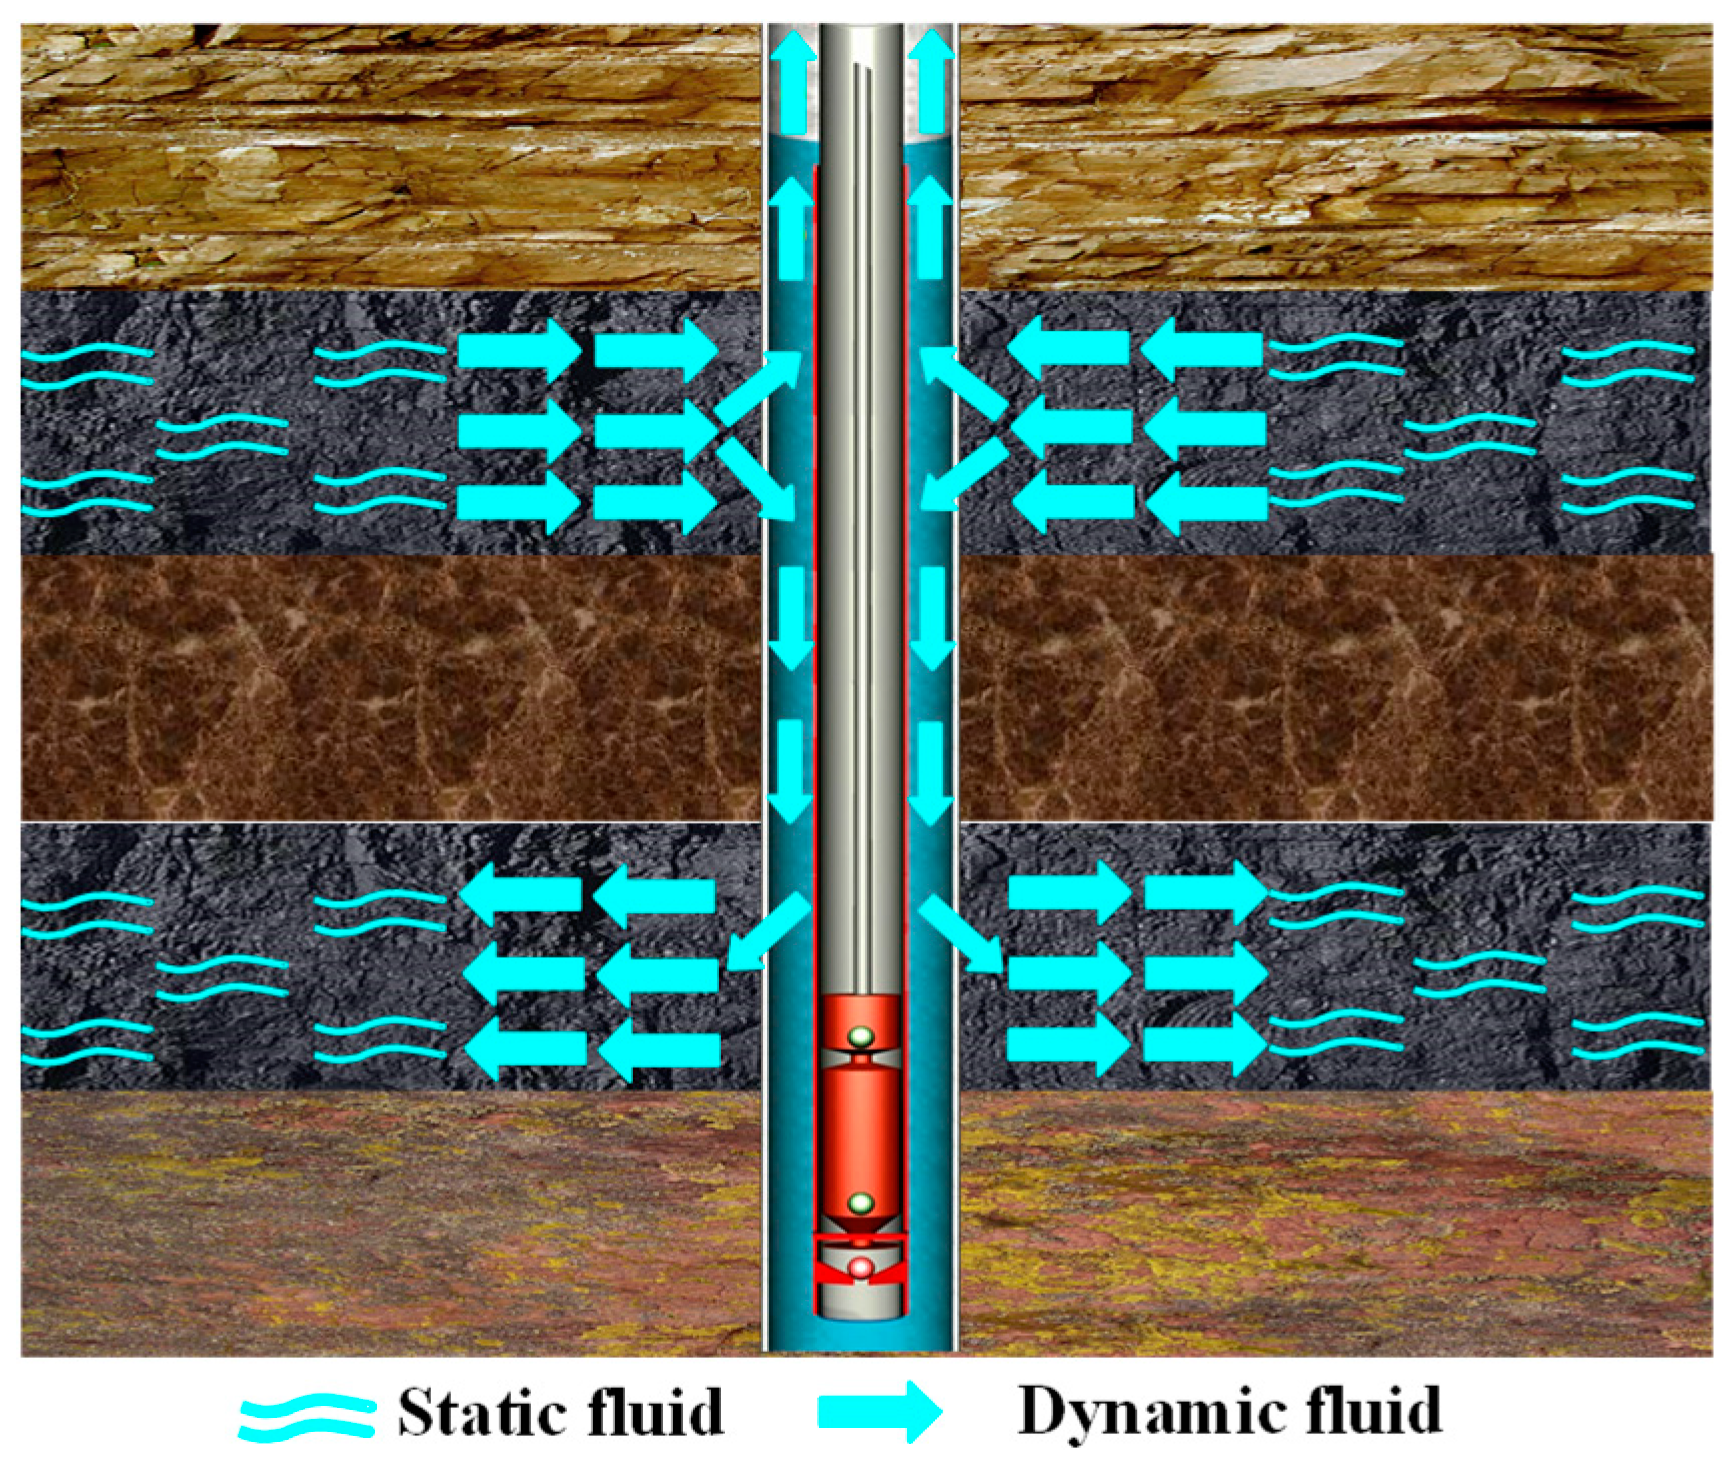
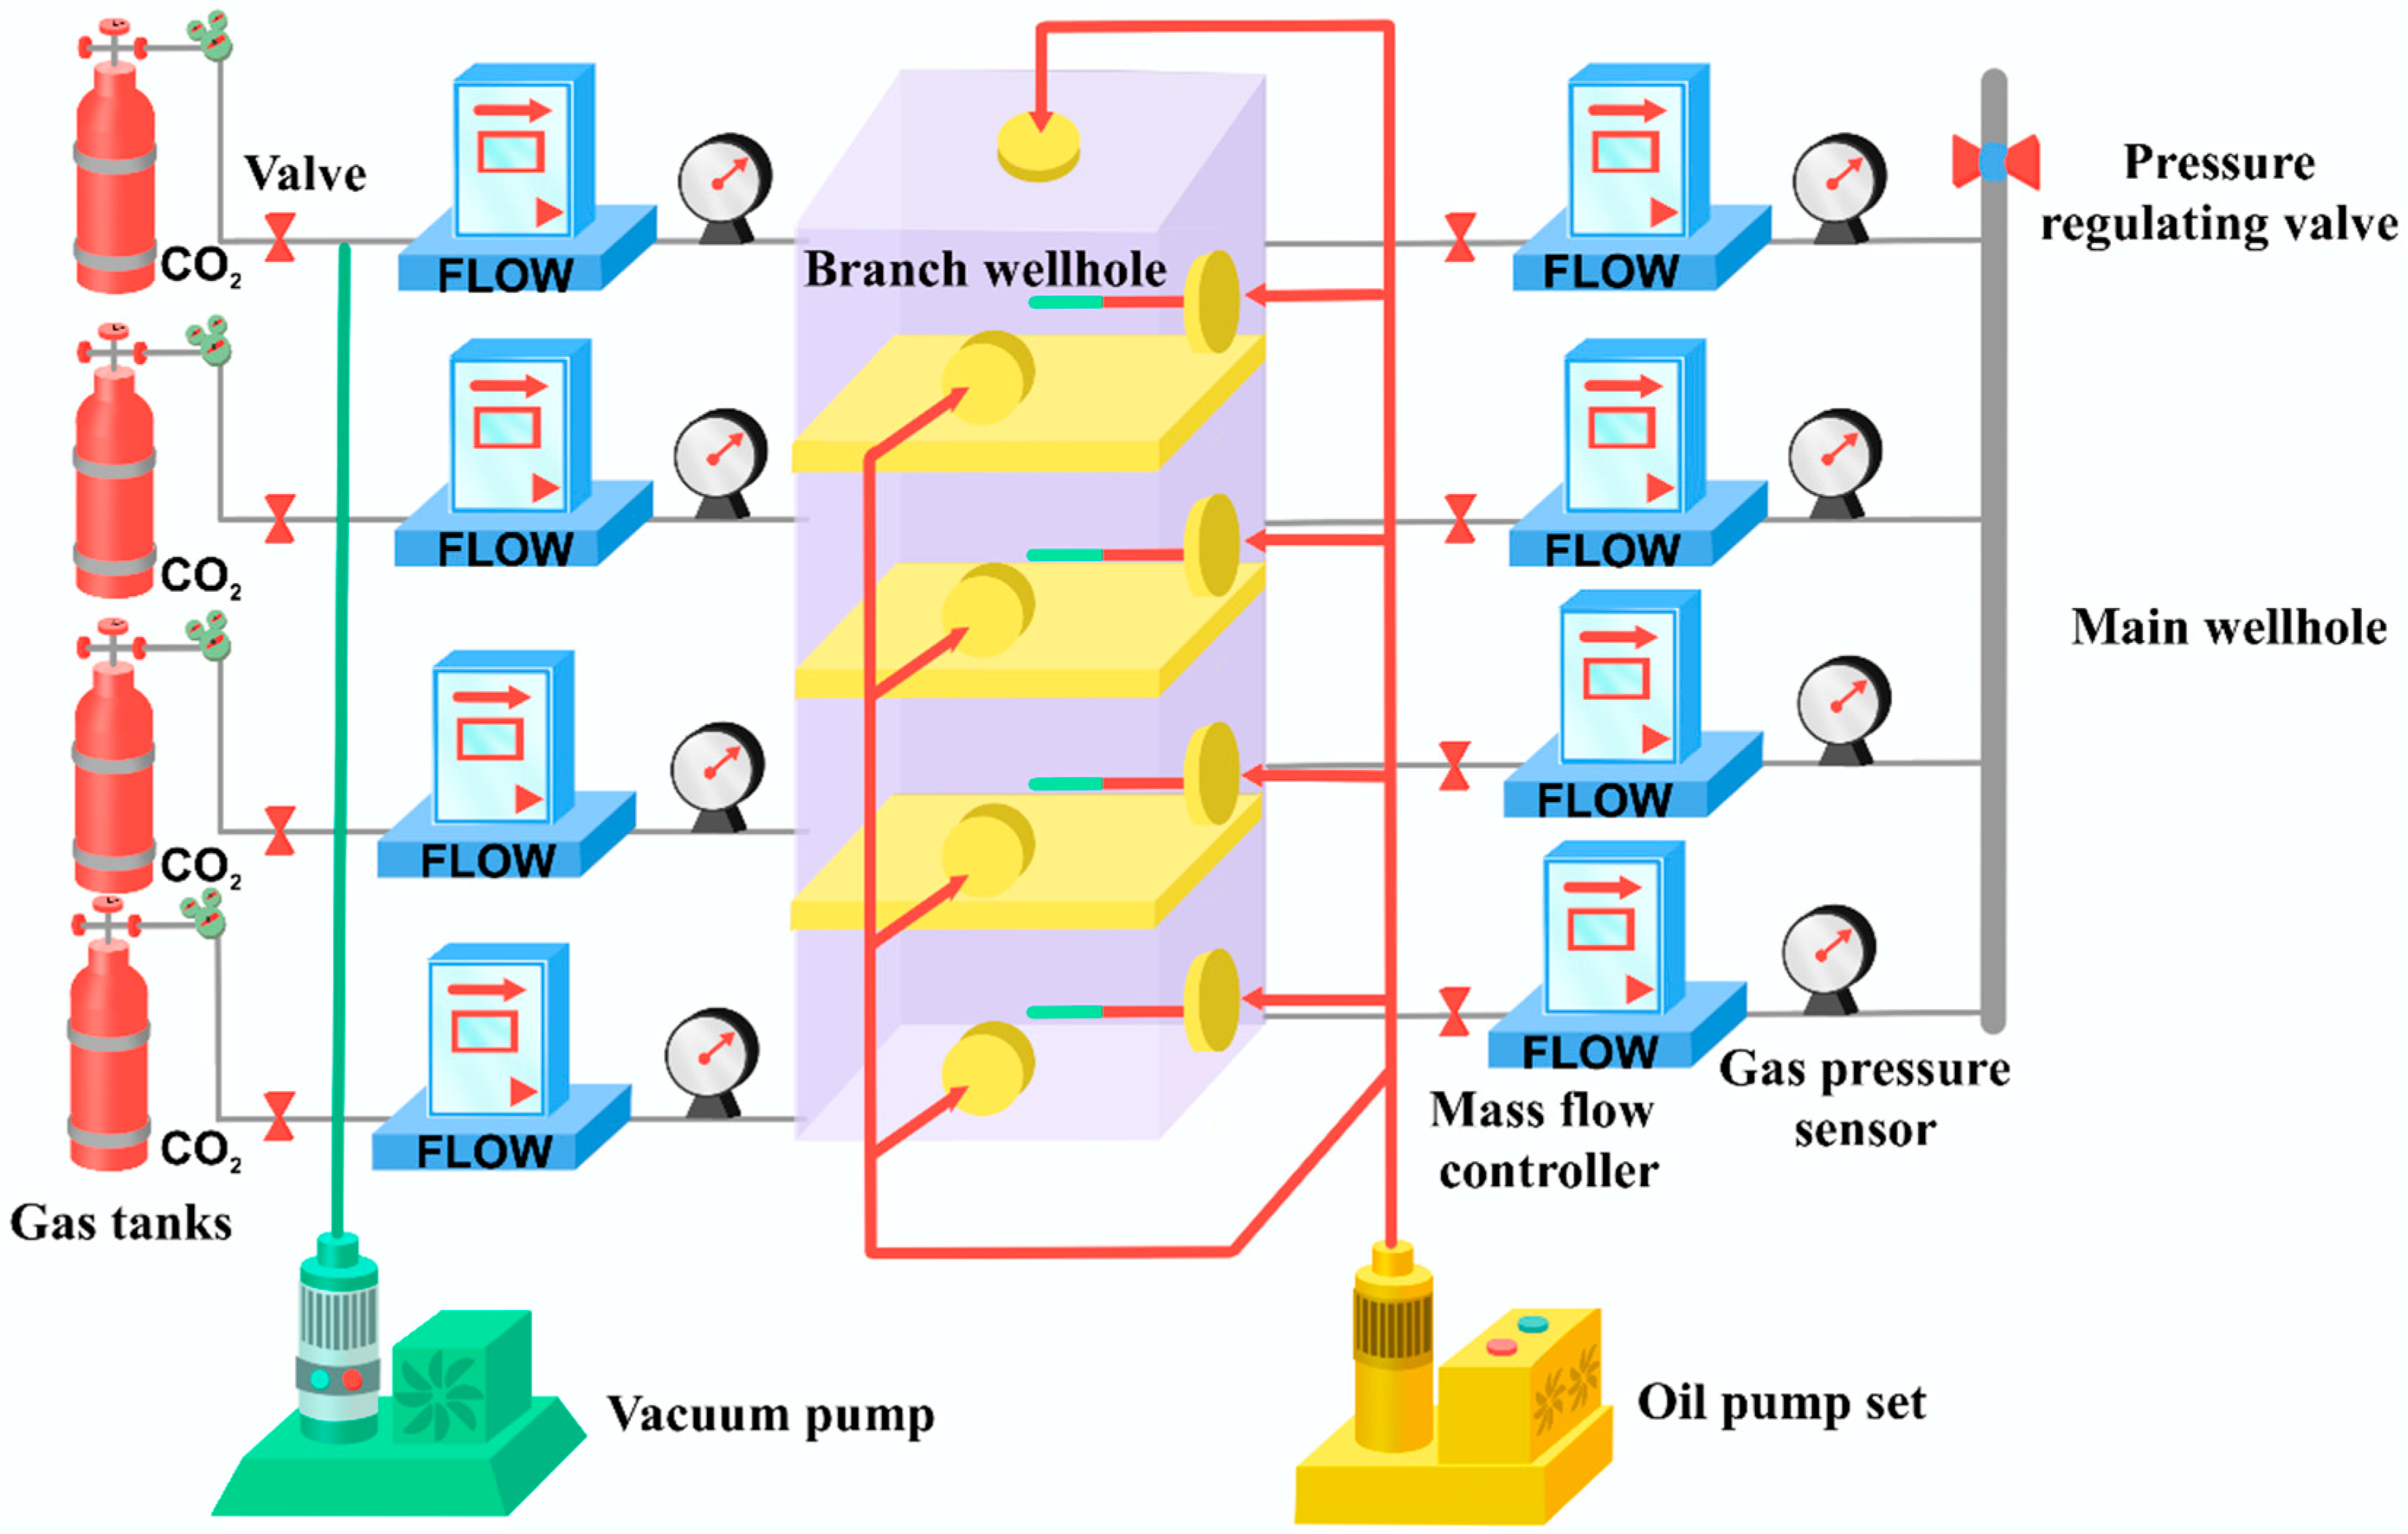
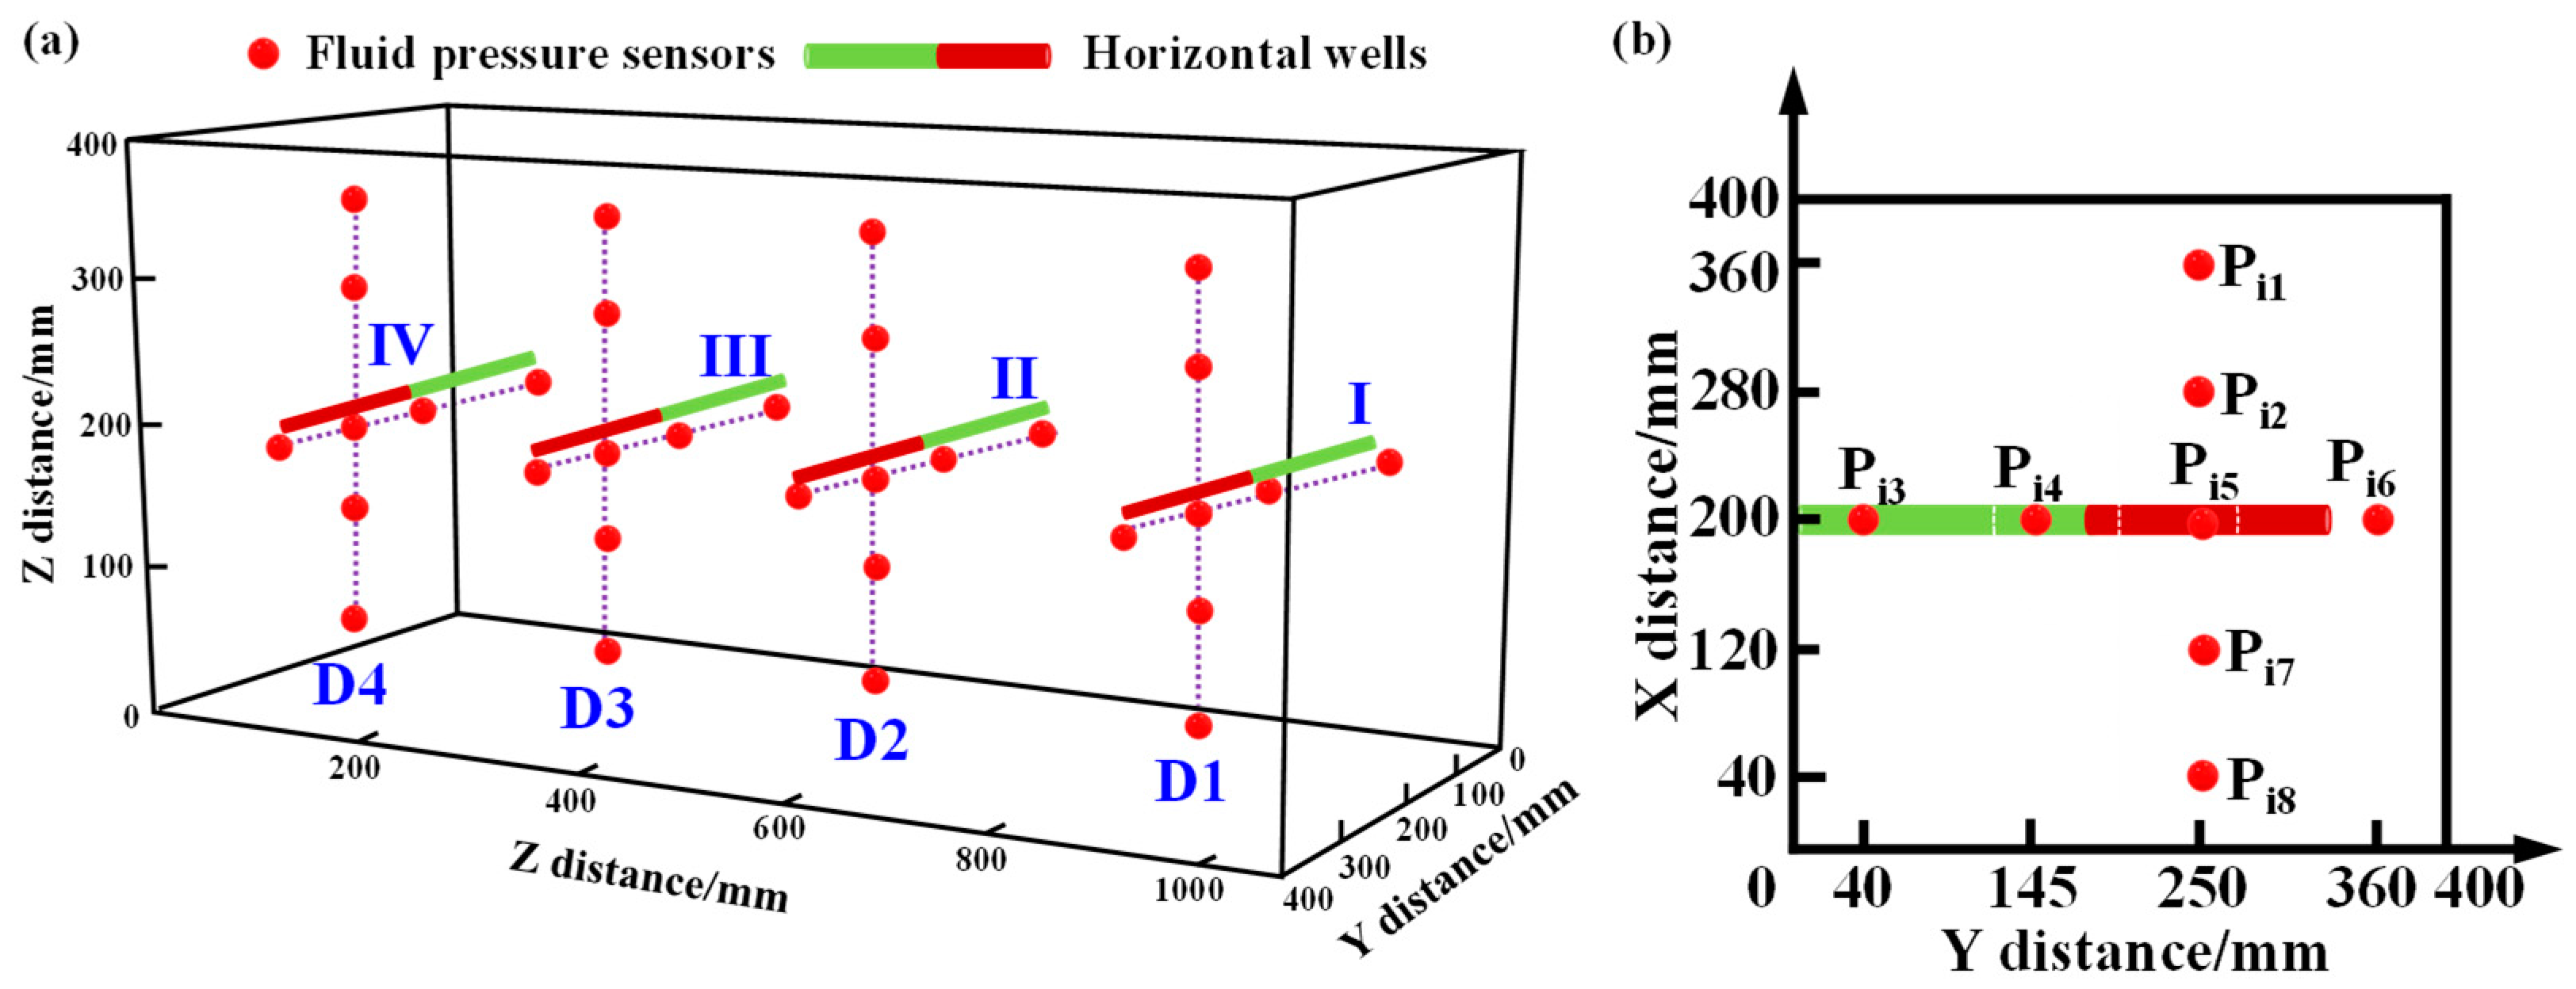
2.1. Simulation Test Device

The simulation test device is comprised of various modules, including a well-hole simulator, reservoir simulation, CBM production, multi-gas source, test control and data acquisition, real three-axis loading servo control, and coal-rock specimen formation (as shown in Figure 2). This device is a physical simulation test device for multi-field coupling CBM production with the functional advantages of large-scale coal-rock specimens, true triaxial stress loading, intelligent data monitoring, and integration of multi-purposes [29,30]. Its primary features are ① Simulating the multi-pressure system composed of coal reservoirs and impermeable gas barriers. ② Simulating the real three-dimensional non-evenly distributed complex crustal stress state by controlling nine loading oil cylinders to independently apply stresses to different coal reservoirs. The large-scale physical simulation test device employed in this study effectively eliminates or mitigates the issues associated with the parallel core holder approach in constructing a co-production model, such as the monotony of reservoir samples, limited monitoring data methods, and uniform stress loading forms. This device enables the consideration of fluid pressure transmission characteristics in large-scale heterogeneous and multi-type reservoir samples under true three-dimensional and complex non-uniform geostresses, as well as between adjacent reservoirs.
It should be noted that the inhibitory effect of produced water on gas production in low-pressure coal reservoirs under different pressure systems cannot be ignored. However, since gas mass flow controllers can only monitor dry gases, the presence of moisture or other impurities in the gas can impair their measurement accuracy. Therefore, a gas-liquid separator must be installed at the inlet of the gas mass flow controller, as shown in Figure 3. Without a gas-liquid separator, a spray-like mixture of gas and liquid will emerge from the outlet. The water produced in this study differs from that produced by on-site drainage, and due to experimental constraints, the role of water in different gas-bearing systems is neglected.

2.2. Coal Reservoir Design and Material Selection

A superimposed pressure system is comprised of vertically stacked independent gas-bearing systems [31]. The material basis for its formation is low-permeability thick rock strata with high water and gas resistance between adjacent gas-bearing systems [32,33,34]. Thus, the gas and water within different gas-bearing systems are isolated, and the vertical gas and water exchanges between different gas-bearing systems are stopped. Given this characteristic of superimposed pressure systems, reproducing the test conditions constructed during the CBM production process in superimposed pressure systems with test methods must have four elements simultaneously: reservoir, CBM, impermeable gas barriers, and well-hole. To prevent inter-layer gas channeling resulting from fracture penetration, impermeable gas barriers are installed between adjacent coal reservoirs, along the four walls of the reservoir simulation module, and within each coal reservoir. Within the reservoir simulation module, there are four superimposed coal reservoirs, with each layer having a size of 212 mm × 380 mm × 390 mm, and the size of the whole sample is 1040 mm × 400 mm × 400 mm. Figure 4 shows the spatial layouts of the coal reservoir and impermeable gas barriers.
The materials used in the physical simulation test encompass coal reservoir materials, impermeable gas barrier materials, and cementing agents. In these experiments, briquette specimens are employed, utilizing raw coal sourced from the Jinjia coal mine in Guizhou. The test was conducted using crushed coal for two primary reasons. Firstly, acquiring large-scale raw coal is challenging, and its internal primary fractures are highly developed, potentially resulting in significant deviations in test outcomes. Conversely, briquette specimens can be regarded as an isotropic medium, offering more consistent results. Secondly, there are certain similarities between briquette specimens and raw coal in terms of physical mechanics and permeability [35,36,37,38,39,40,41,42].
The production flow chart of the briquette specimens is shown in Figure 5. After undergoing impurity removal, crushing, and screening processes, raw coal with four particle sizes of 0.250–0.425 mm, 0.180–0.250 mm, 0.150–0.180 mm, and 0.000–0.150 mm was obtained. To minimize the differences between the four groups of coal reservoirs, the raw material sources of the four independent coal reservoirs are consistent, and the conditions such as material proportioning, pulverized coal weight, molding pressure, and molding time are kept the same. Clay materials with dense texture, strong cementation, and viscosity were chosen for the impermeable gas barriers to realize their strong water and gas resistance characteristics. The impermeable gas barriers exhibit a wrapping effect on the coal reservoir.
The optimized mix proportion scheme table of coal reservoir and impermeable gas barriers is detailed in the published papers [43]. Likewise, clay materials undergo the processes of impurity removal, crushing, and screening, with clay powder particles of 0.000–0.425 mm obtained. Cementing agents include the polyvinyl acetate emulsion adhesive and gypsum powder. Specifically, the polyvinyl acetate emulsion adhesive enhances specimen shaping, while the gypsum powder boosts specimen strength. The specific steps for specimen preparation are as follows: the material mixture was loaded into the reservoir simulation, and the specimen was molded under a cold forming pressure of 10.0 MPa for 1.0 h. After the first forming, the height of the specimen was 70 mm. The second batch of material mixture was loaded into the coal specimen box to form the second layer of the coal specimen (i.e., second forming). The extraction pipe and sensors are installed on the surface of the second layer. The third and fourth layers are formed correspondingly. The specimen height after the second, third, and fourth forming is 200 mm, 300 mm, and 390 mm, respectively. The fifth layer, an interlayer, is composed of clay materials, and the specimen height after the fifth forming is 400 mm. The gas pressure sensor model is GB-Y-J6M, with a measurement range of −0.1 to 6 MPa and an accuracy of ±0.25% F.S. The temperature sensor selected is a platinum resistance thermometer, model Pt100, with a theoretical measurement range of −200 to 850 °C and an accuracy of ±0.15 °C.

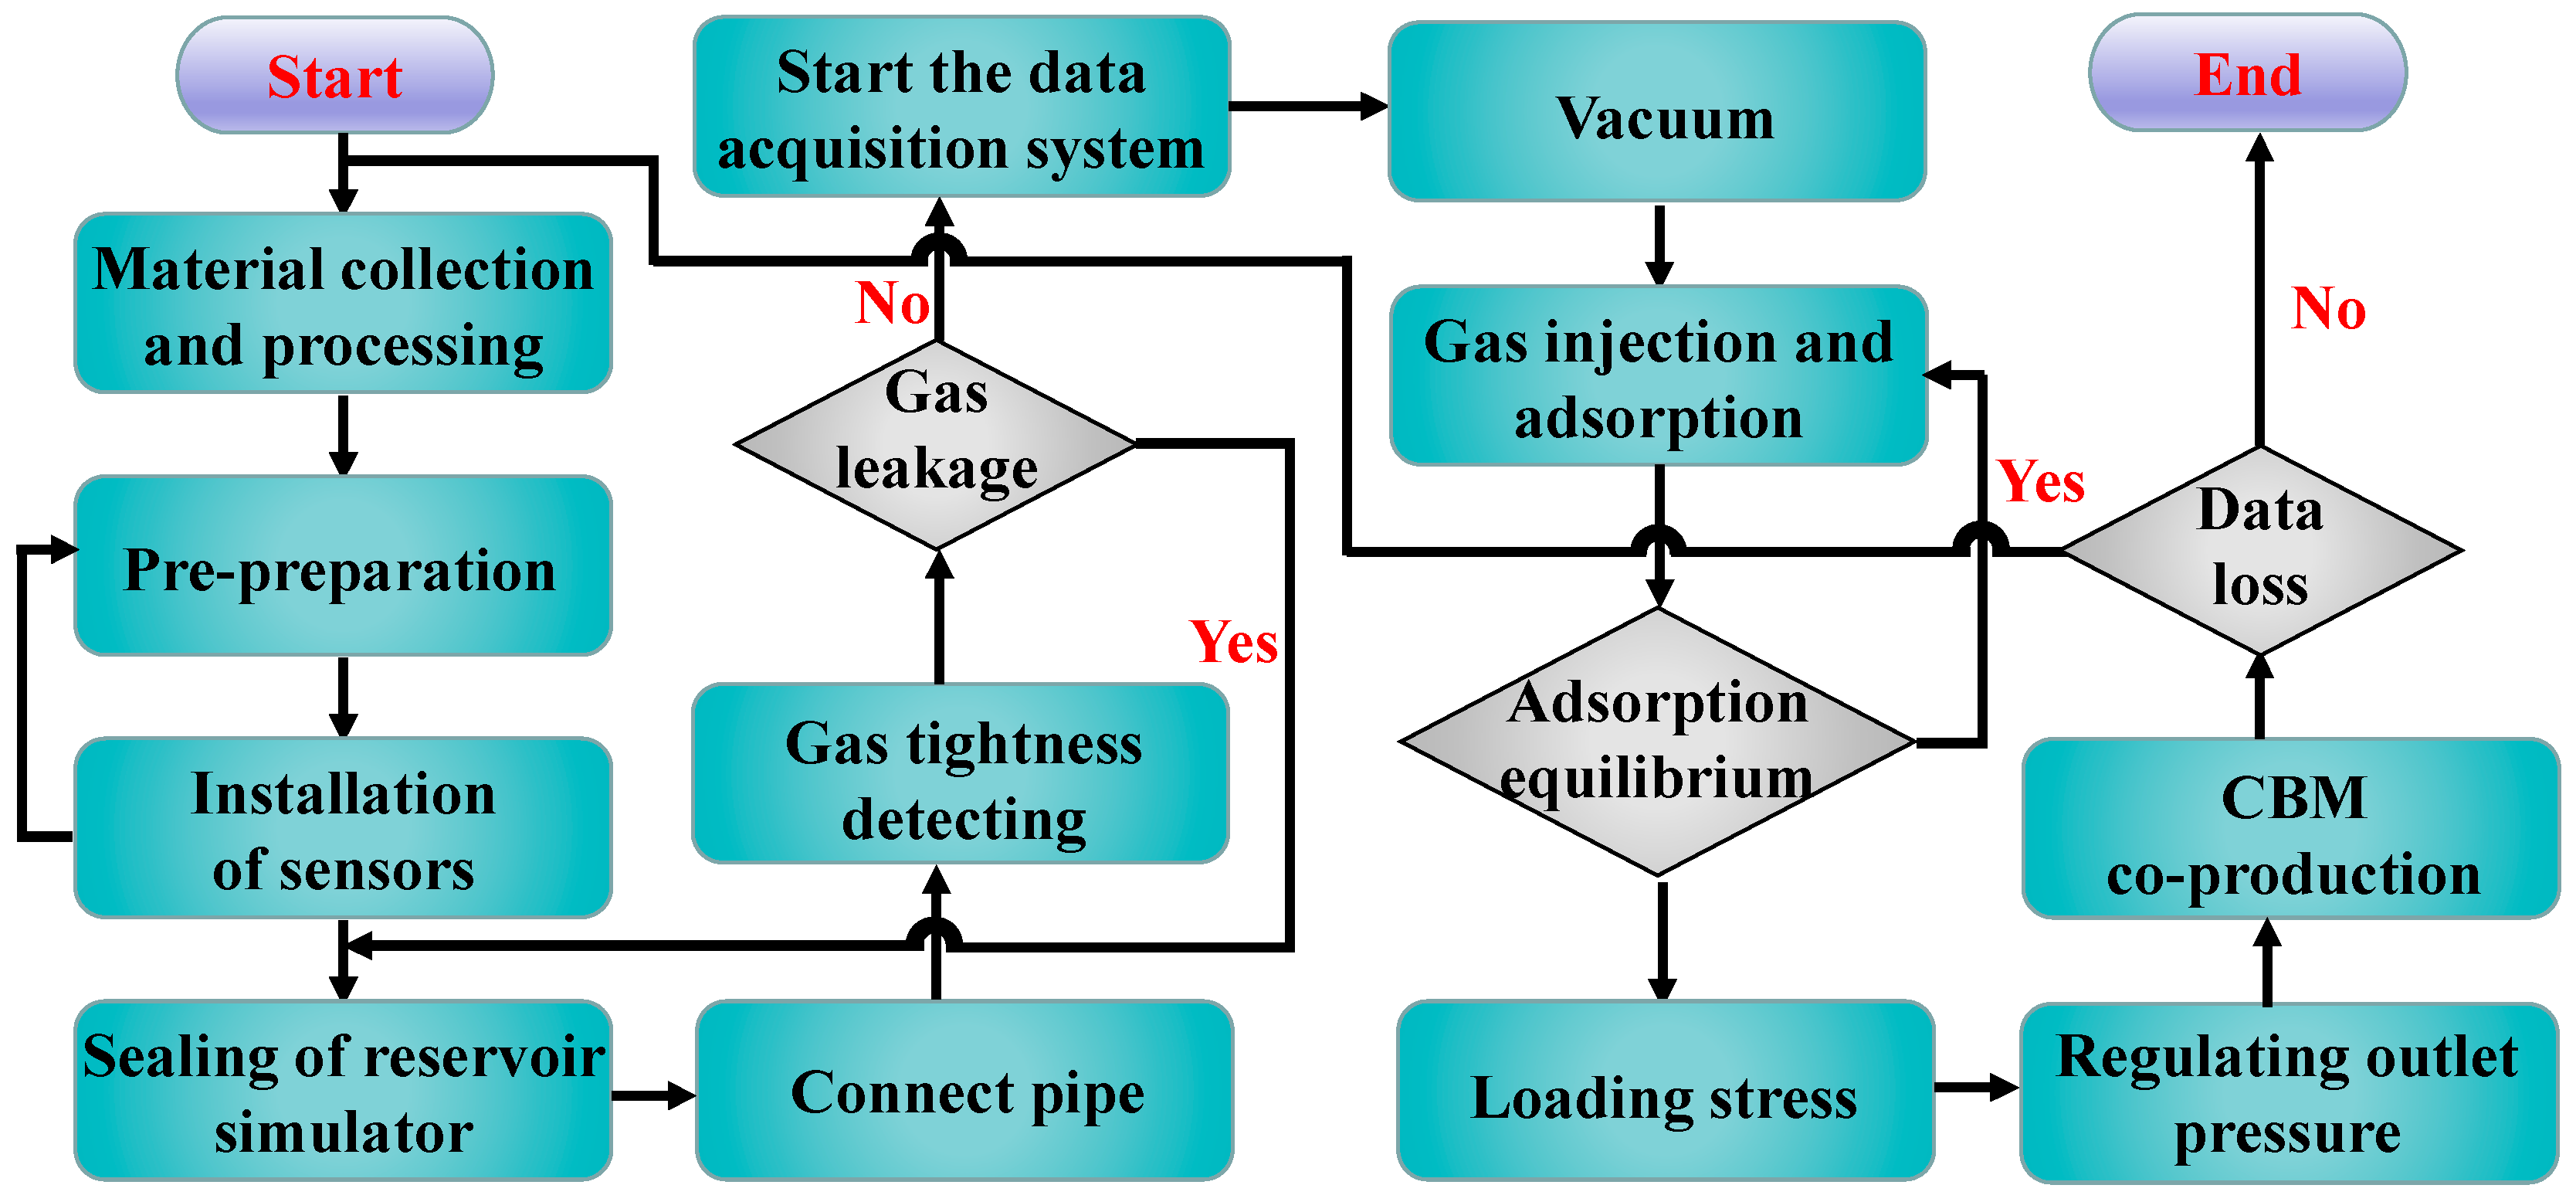
2.3. Test Scheme and Steps

Two modes of single production and co-production have been designed in this scheme. The distinguishing feature between these two modes lies in the presence or absence of fluid confluences within the main well-hole. This distinction is further reflected in whether four independent horizontal wells are interconnected with the main well-hole. Four coal reservoirs in the superimposed pressure systems have been numbered, with the reservoirs along the Z axis being reversely numbered as 1, 2, 3, and 4. There is an independent horizontal well within each coal reservoir in the superimposed pressure systems. Therefore, the horizontal wells in the No. 1, 2, 3, and 4 coal reservoirs are numbered I, II, III, and IV. Multiple fluid pressure sensors are placed in different areas of the coal reservoir to obtain the changes in reservoir parameters in different positions during CBM production. The fluid pressure sensors model is GB-Y-J6M, with a measuring range of 0.1~6.0 MPa and a testing accuracy of ±0.25% F.S. The fluid pressure sensor is connected to the measuring point through a PU tube that can ignore the pressure loss. Figure 6a shows four independent cross sections, namely D1, D2, D3, and D4 (z = 141 mm, z = 395 mm, z = 645 mm, and z = 925 mm), and Figure 6b shows the specific positions of fluid pressure sensors in these cross sections. Different crustal stress values are set for different coal reservoirs. That is, loads of σH1, σH2, σH3, and σH4 are sequentially applied to No. 1–4 coal reservoirs along the X-axis direction, with loads of σh1, σh2, σh3, and σh4 applied along the Y-axis direction, and a load of σv applied along the Z-axis direction. Different initial reservoir pressures of PI, PII, PIII, and PIV are applied to coal reservoirs No. 1–4, respectively. The stress-loading process commenced, with a schematic representation of the stress application illustrated in Figure 7.
According to the analysis of the in-situ stress field characteristics in the eastern Yunnan and western Guizhou regions, it is evident that the three principal stresses and initial reservoir pressure exhibit a significant increasing trend with burial depth [44,45]. This results in a distinct vertical zonation of in-situ stress and initial reservoir pressure across different coal seams. Based on similarity theory analysis, the study determined a geometric similarity ratio of 2.31 and a bulk density similarity ratio of 1.04 between the prototype and the model. Consequently, the in-situ stress similarity ratio was calculated to be 2.4. In accordance with the fundamental principles of similarity theory, it is essential to strictly maintain consistency in the similarity ratios of in-situ stress and initial reservoir pressure to ensure the reliability of the model experiments. The study set the burial depth of the No. 1 coal reservoir at 350 m. Based on the vertical in-situ stress calculation formula and the empirical relationship for initial reservoir pressure in the eastern Yunnan and western Guizhou regions [44,45,46], the vertical in-situ stress of No. 1 coal reservoir was determined to be approximately 4.0 MPa, with an initial reservoir pressure of about 1.0 MPa. Considering that the ratio of minimum to maximum horizontal principal stress typically ranges between 0.4 and 0.8, this study selected the median value of 0.6 as the calculation parameter [47]. The lateral pressure coefficient (defined as the ratio of the average of the two horizontal principal stresses to the vertical principal stress) has a range of 0.39 to 1.95, and a value of 1.0 was adopted for this study [46]. According to the three-dimensional stress relationship theory, the maximum horizontal principal stress of the No. 1 coal reservoir was calculated to be 5.0 MPa, while the minimum horizontal principal stress was 3.0 MPa. Additionally, the reservoir pressure difference between adjacent coal reservoirs was set at 0.4 MPa. Based on the calculated results of the above parameters, the experimental scheme shown in Table 1 was ultimately determined.
The test procedures follow (shown in Figure 8): ① Preliminary Preparation: Verify the proper functioning of the test system. Conduct air tightness detection to ensure the system is leak-free. Perform sensor calibration to guarantee accurate measurements. ② Vacuum Pumping: Initiate the evacuation of impurity gases from pipelines, cavities, and reservoirs to establish a controlled environment, reducing the reservoir pressure to −0.1 MPa. ③ Stress Loading: Following the vacuum pumping process, apply the predetermined stress to the specimen. In the X direction, σH1, σH2, σH3, and σH4 were set to 5.0 MPa; in the Z direction, σv was maintained at 4.0 MPa; and in the Y direction, σh1, σh2, σh3, and σh4 were 3.0 MPa. ④ Gas Injection and Adsorption: Inject gas incrementally in steps of 0.25 MPa until adsorption equilibrium is attained. Note: Adsorption equilibrium is determined by monitoring the pressure sensor. A stable pressure reading indicates that the system has reached equilibrium. ⑤ CBM Production: Upon completion of the preceding steps, commence the CBM production test. While the CBM co-production process typically spans 6.0 h, this study emphasizes the initial phase, specifically analyzing data collected within the first 10.0 min of the co-production process. This structured approach ensures clarity and enhances the readability of the experimental methodology.

2.4. Definition of Relevant Parameters

Using the single production mode as a benchmark, a pressure compatibility coefficient and a production compatibility coefficient are constructed from the perspective of dynamic variations of pressure and gas production during CBM production. Subsequently, the dynamic variation characteristics caused by fluid disturbance are explored, and the compatibility of CBM co-production is evaluated.
Based on the condition of the single production mode, the pressure compatibility coefficient is characterized by the ratio of the real-time difference in pressure between the co-production mode and single production mode to the maximum difference. The pressure compatibility coefficient is calculated as follows:
p i , r = P i , C - P i , S max ( P i , C - P i , S )
Based on the condition of single production mode, the production compatibility coefficient is characterized by the ratio of the real-time difference in production between co-production mode and single production mode to the maximum difference. The production compatibility coefficient is calculated as follows:
q i , r = q i , S - q i , C max ( q i , S - q i , C )
where p represents the pressure inside horizontal wells and q represents the instantaneous gas production volumes. The subscripts of i , C and i , S , i represents the number of the corresponding coal reservoir, with a value of 1, 2, 3, or 4 representing the No. 1, 2, 3, and 4 coal reservoirs, respectively. The C represents a single production mode, and the S represents a co-production mode.

3. Test Results and Analysis

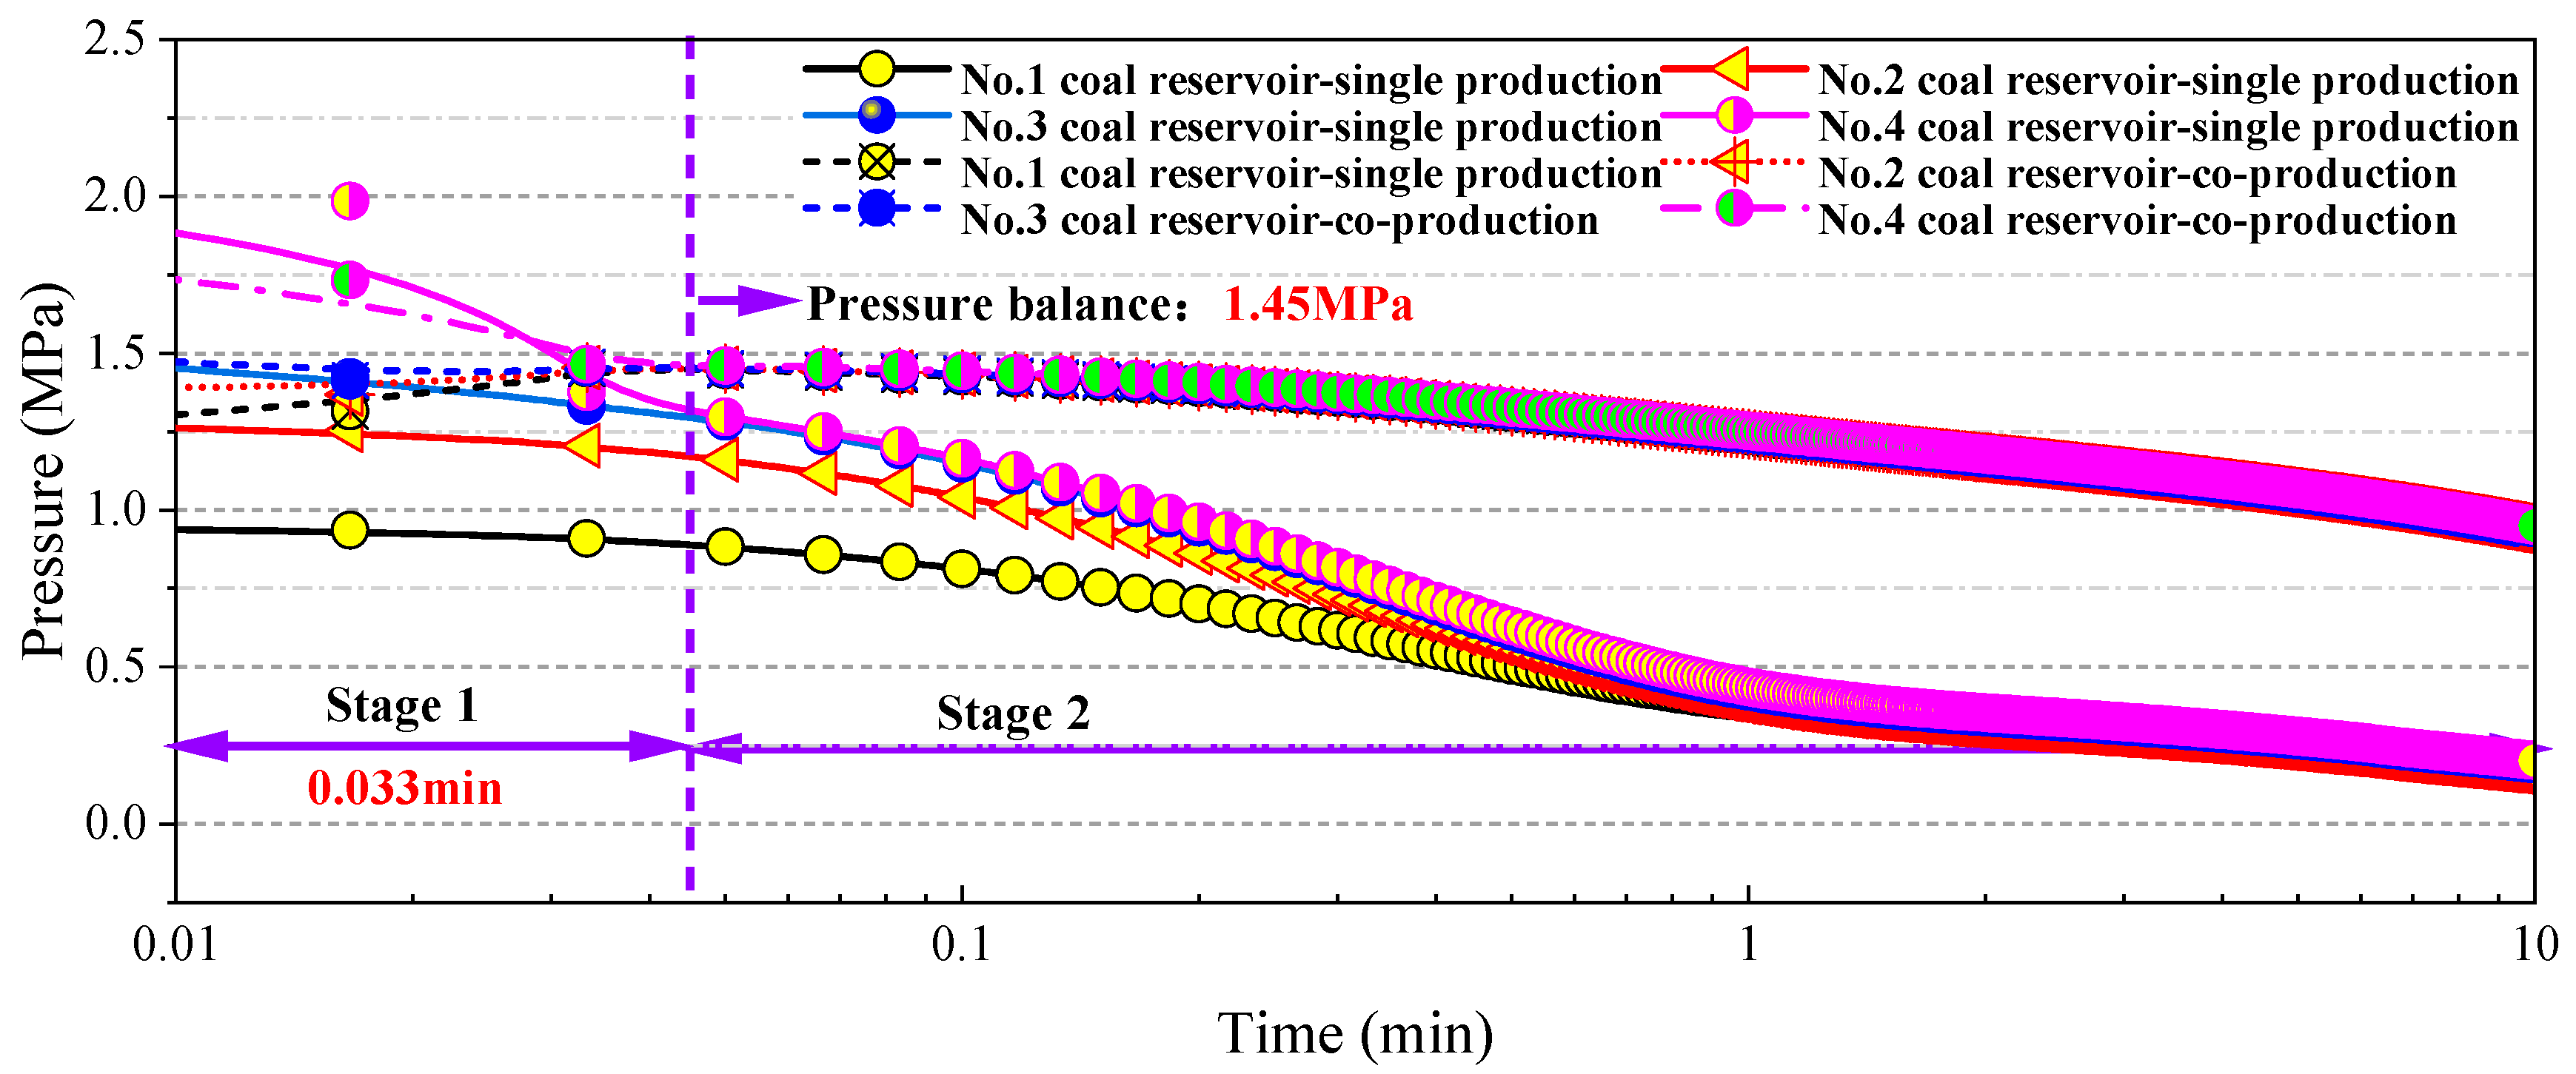
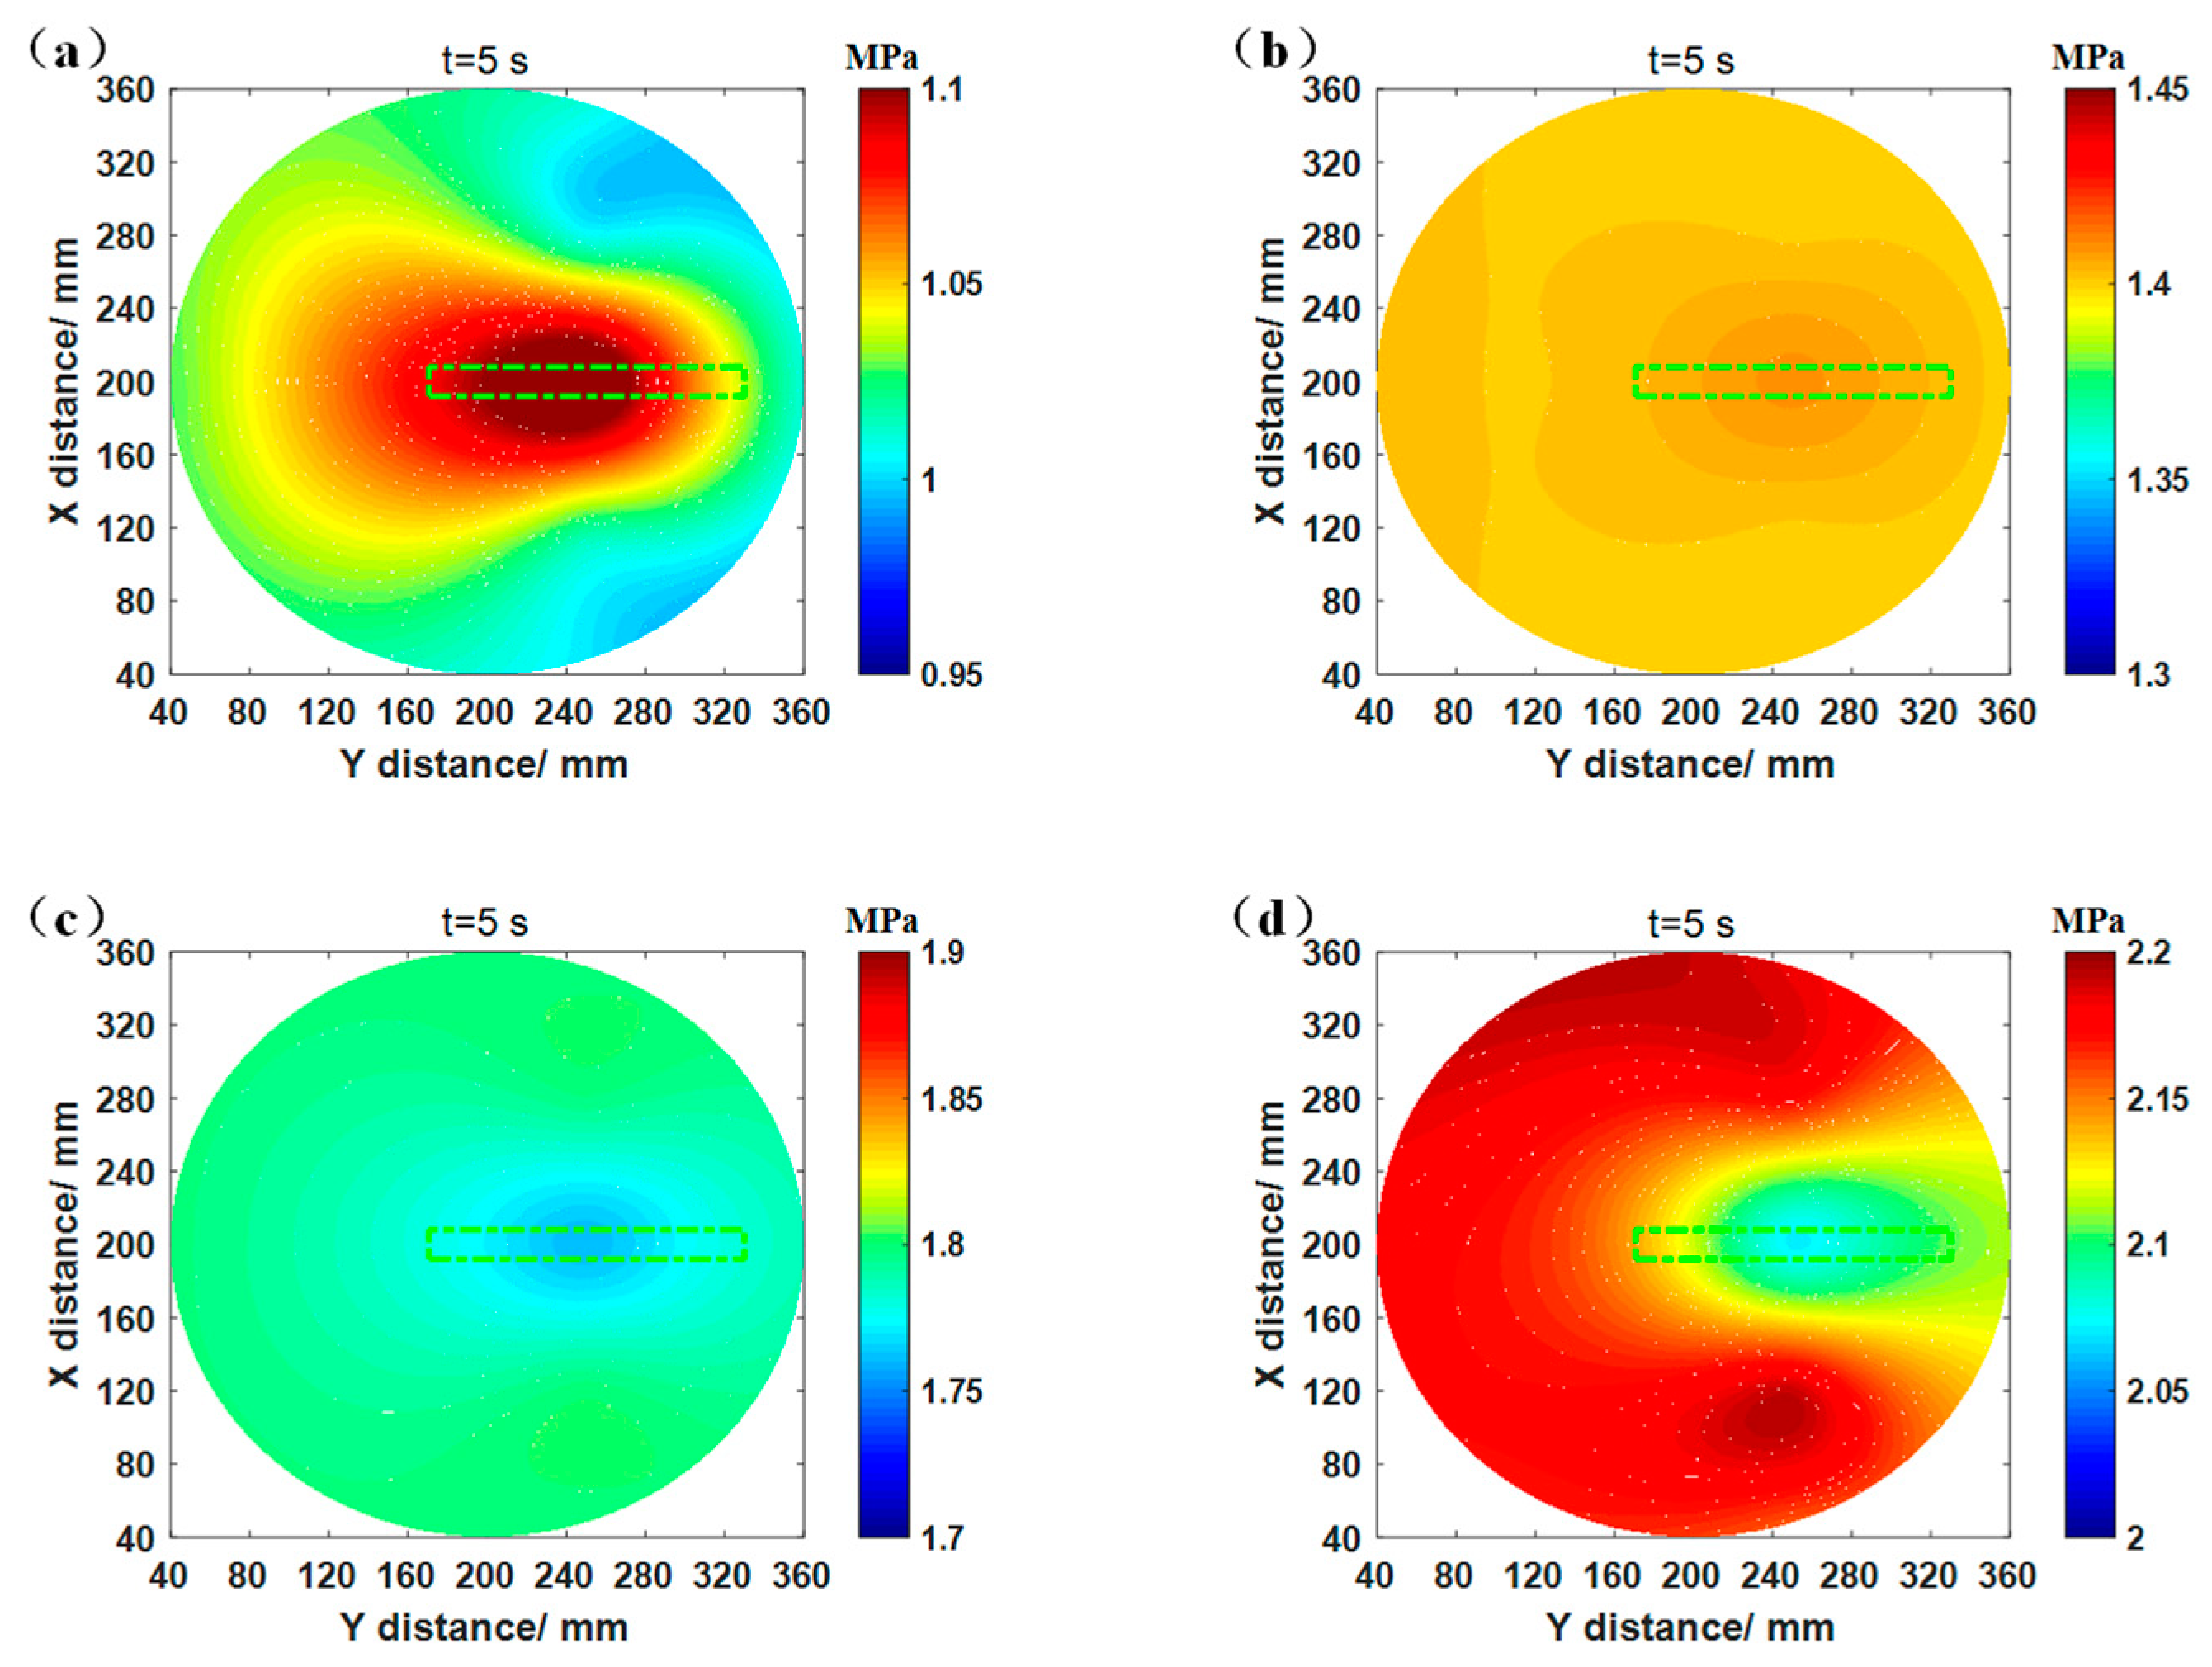
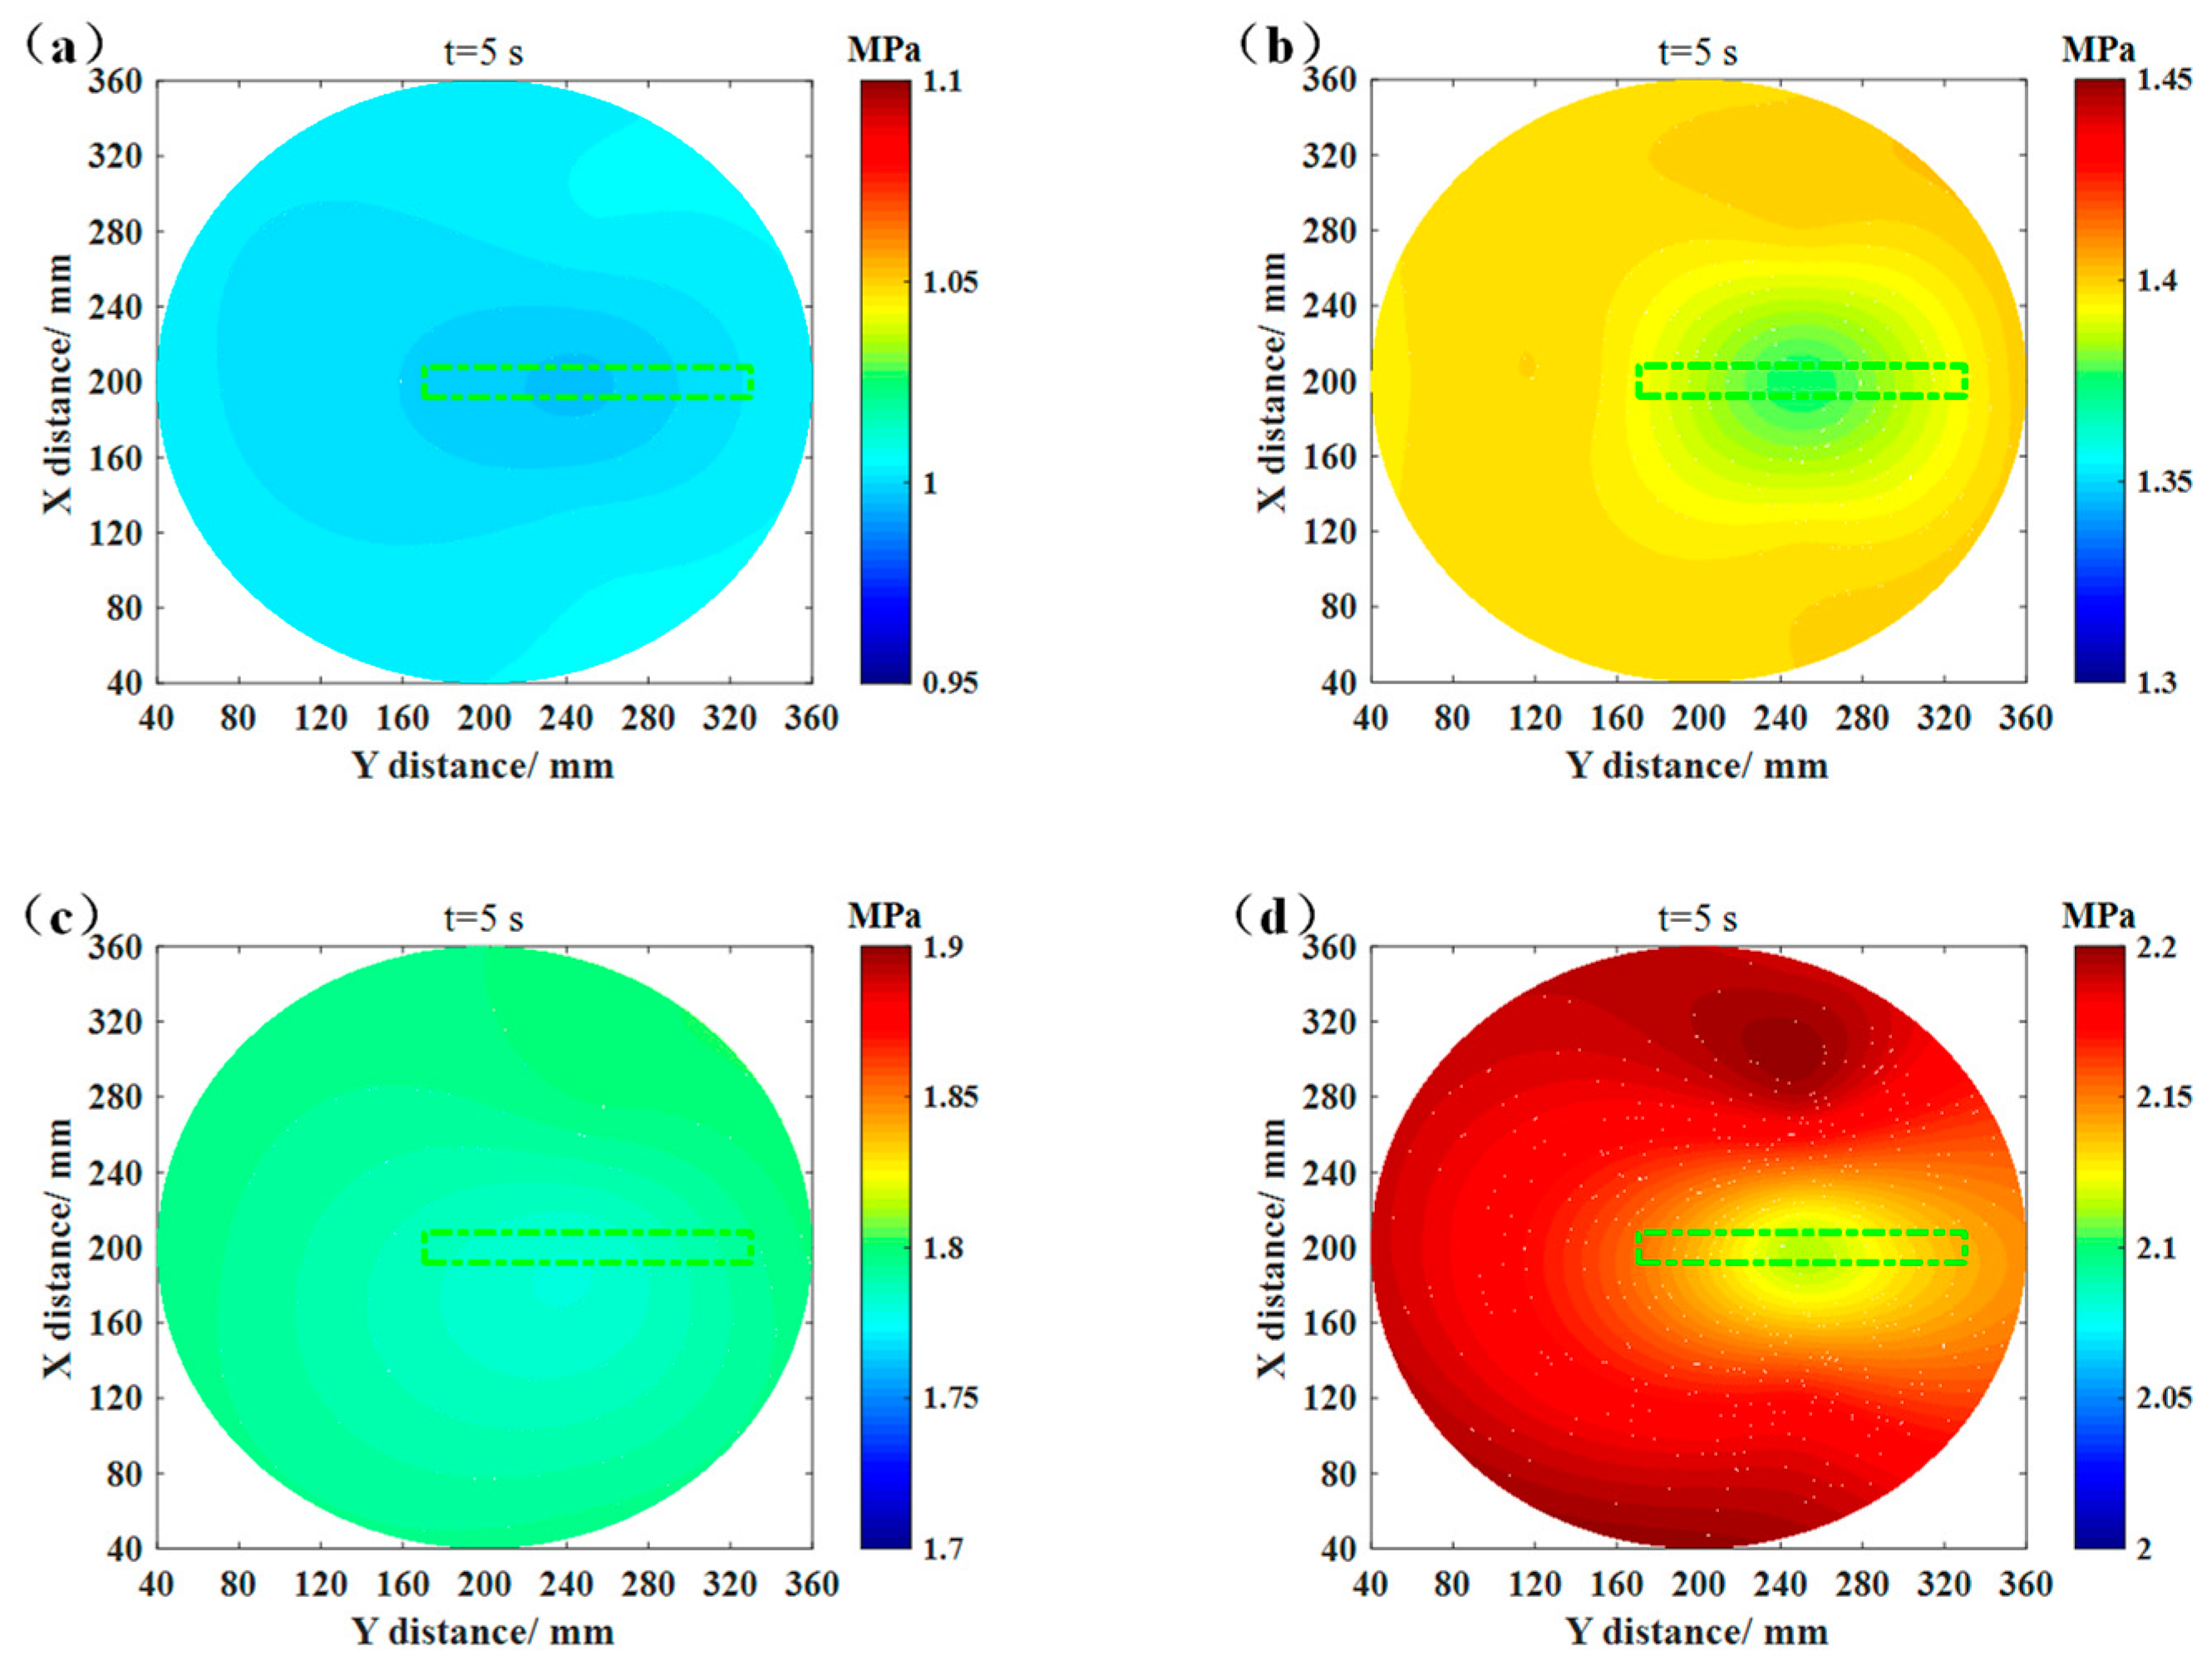
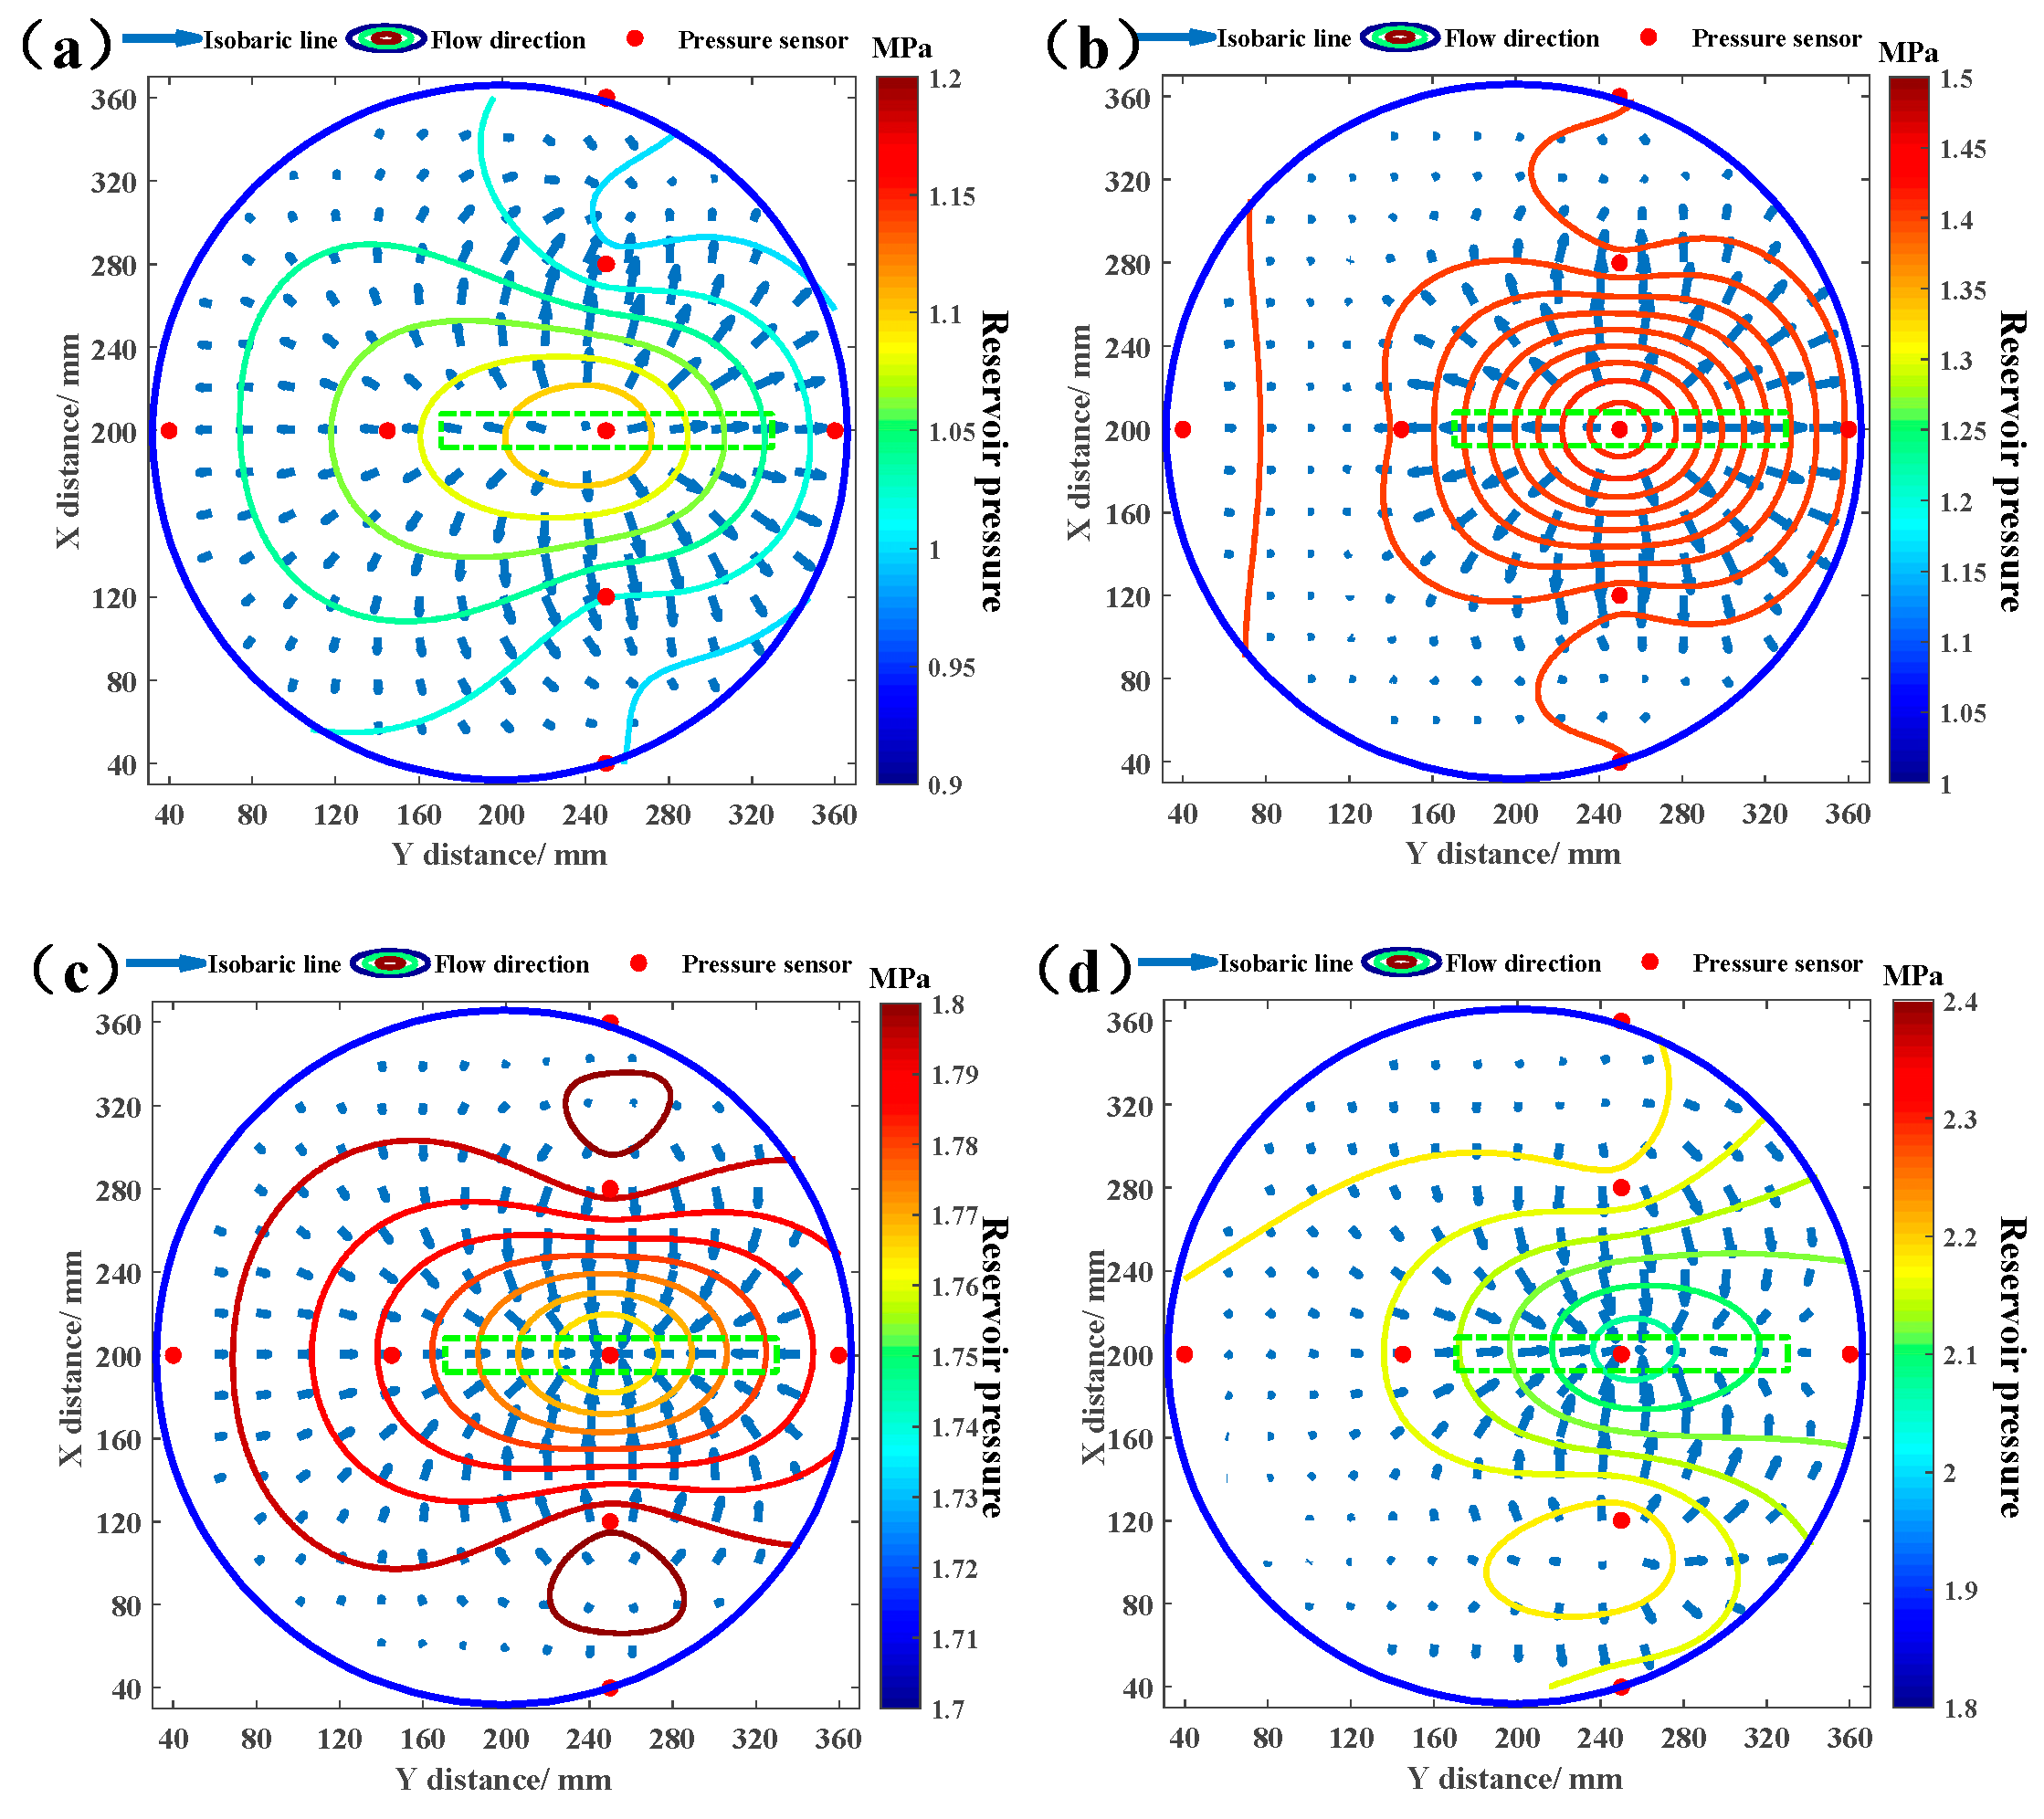
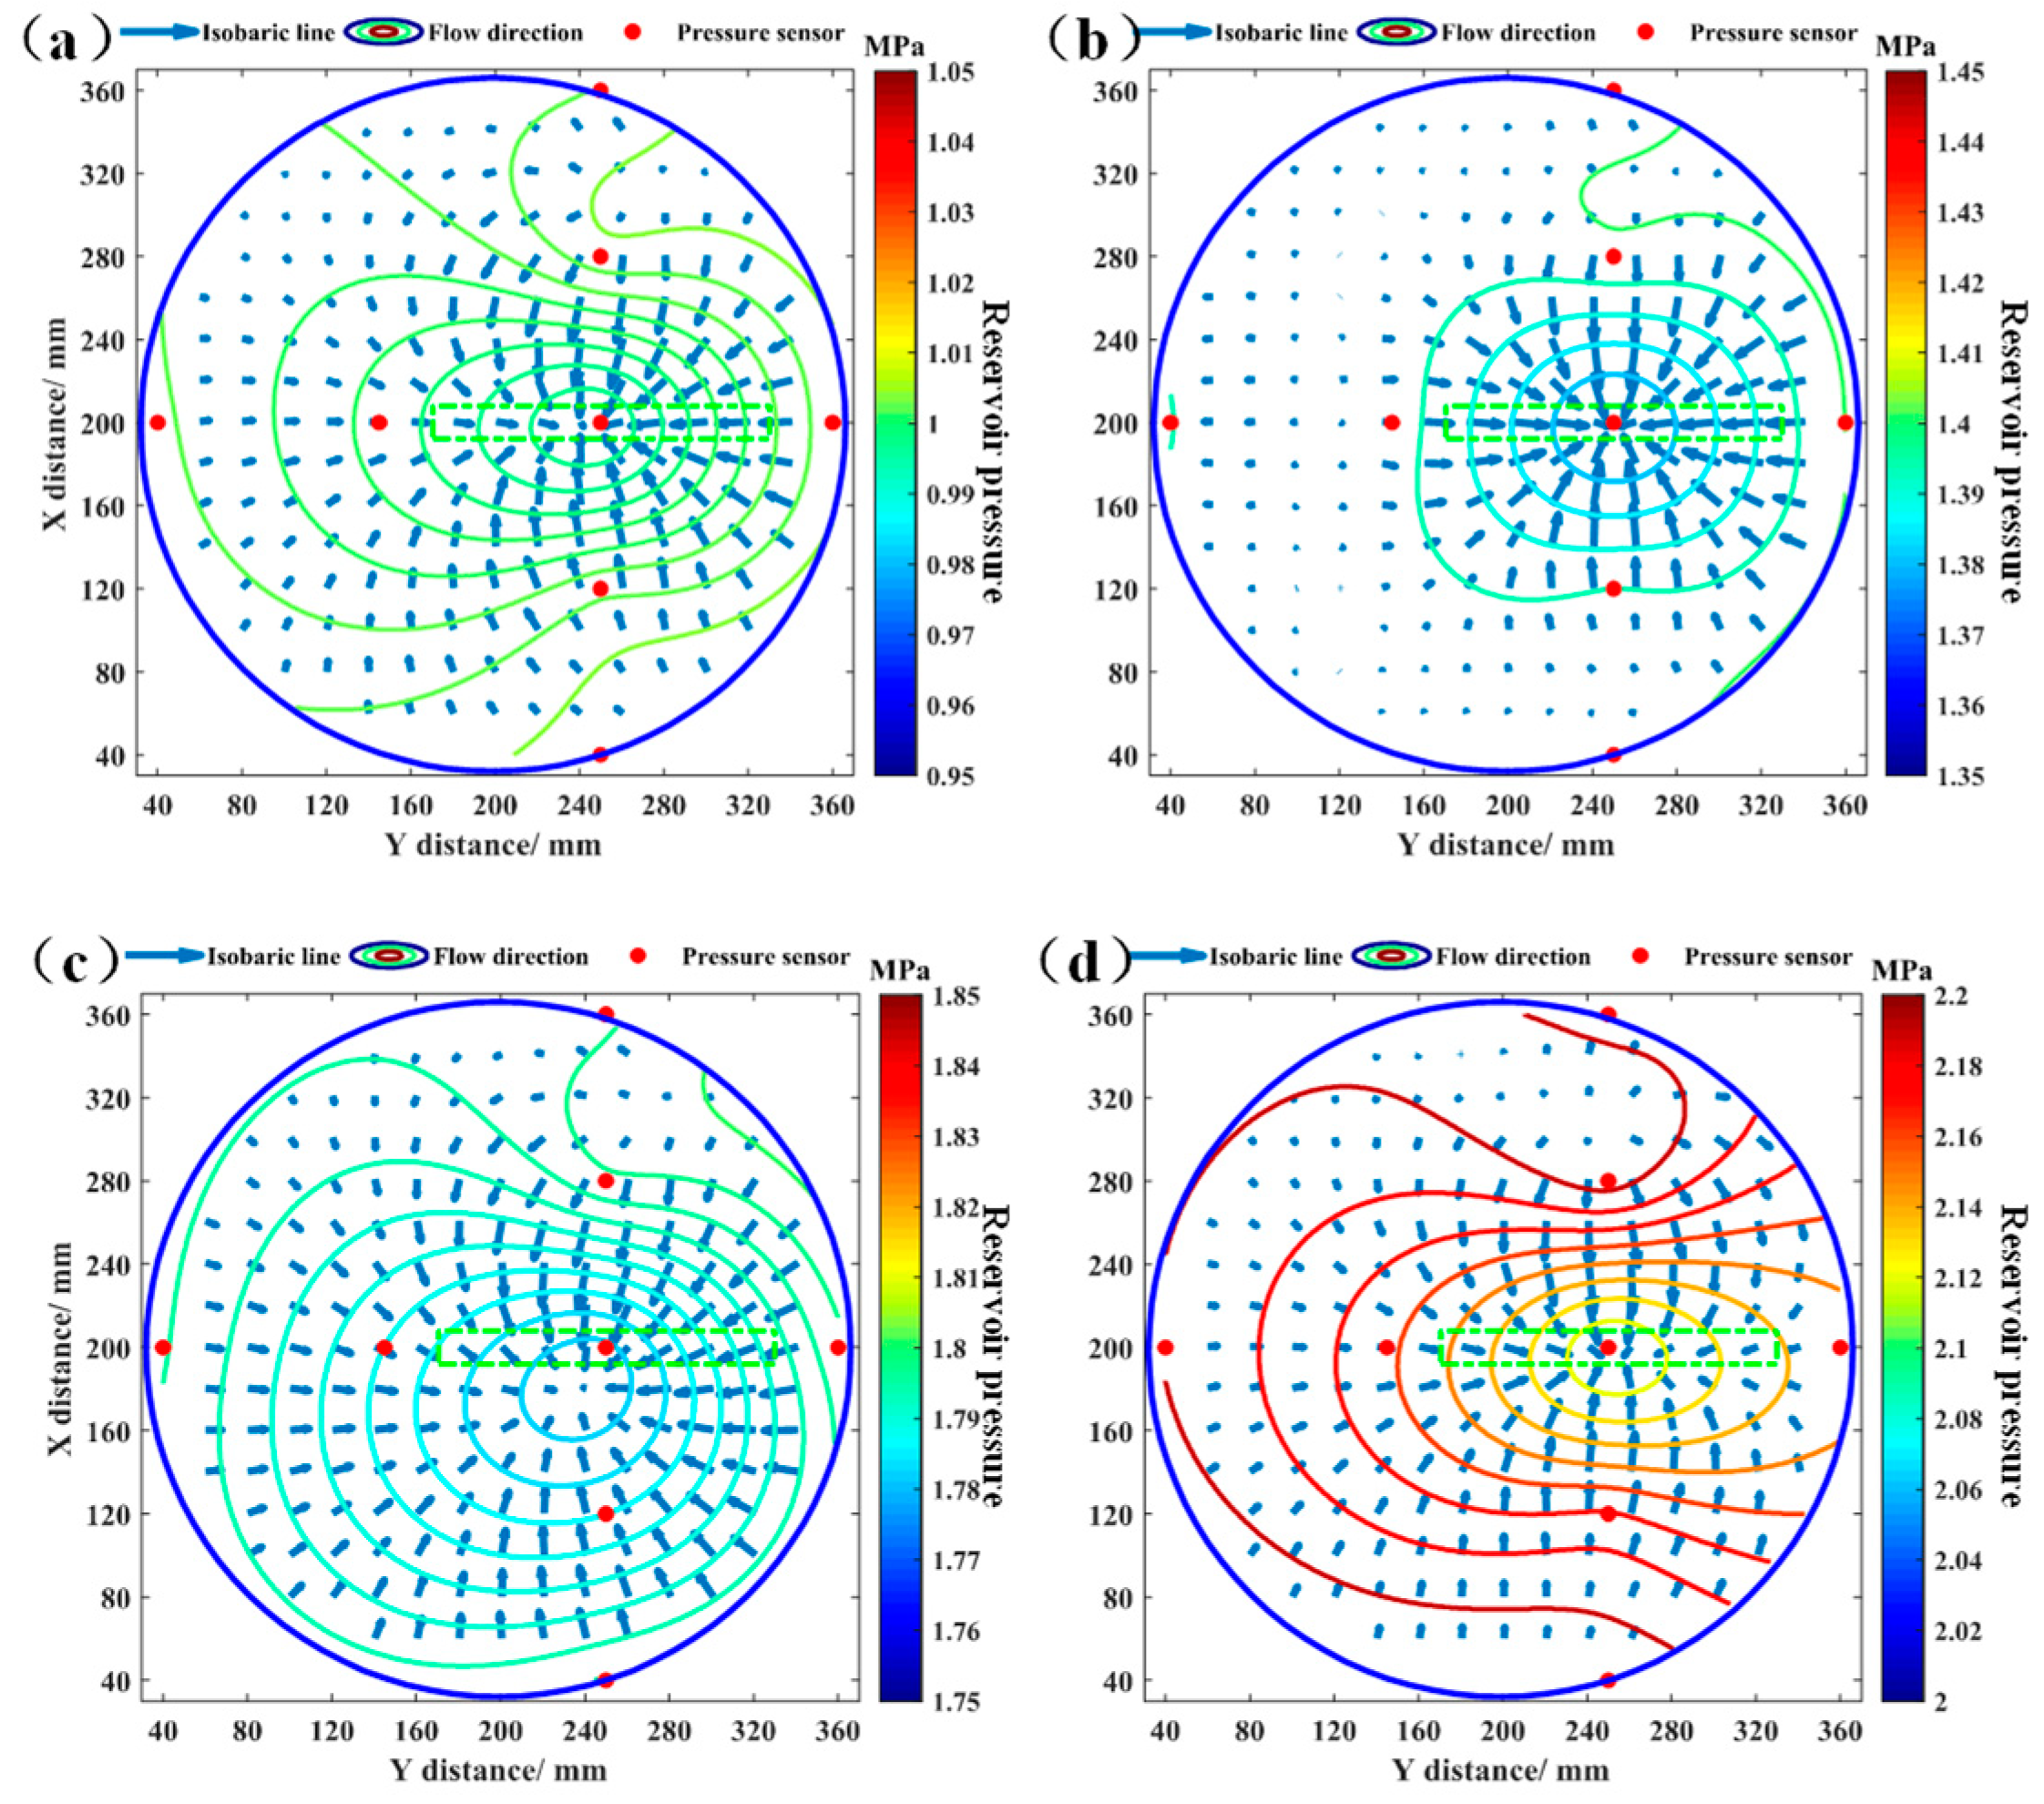
3.1. Influences of Well-Hole Fluid Confluences on the Pressure Field

Figure 9 illustrates the dynamic evolution curves of pressure within four horizontal wells during the initial phase of CBM co-production. Under the co-production mode, the pressure in horizontal wells I and II demonstrates an increasing trend, while the pressure in horizontal wells III and IV exhibits a decreasing trend during the early stage of co-production. Notably, the pressure in all four horizontal wells simultaneously reaches 1.45 MPa at t = 0.03 min. Subsequently, the pressure curves for all four wells align, showing a consistent downward trend. Based on this observation, the pressure evolution in the horizontal wells can be divided into two stages: Stage 1, the confluence disturbance stage, and Stage 2, the pressure converging and drop stage.
Stage 1: The Confluence Disturbance Stage
This stage is attributed to the varying reservoir pressure properties of different coal reservoirs. During this stage, when fluids with different pressure properties converge in the main wellbore, the pressure in the horizontal wells corresponding to the low-pressure coal reservoirs does not decrease but instead rises due to the confluence effect. This phenomenon can be explained from a fluid dynamics perspective: when high-pressure fluids mix with low-pressure fluids in the main wellbore, the low-pressure fluids are pushed by the high-pressure fluids, leading to a temporary pressure increase. This pressure rise is particularly pronounced during the initial co-production period and differs significantly from the pressure evolution observed in single-production mode.
Stage 2: The Pressure Converging and Drop Stage
This stage follows the confluence disturbance stage, during which the pressures in the four horizontal wells reach equilibrium and begin to decline synchronously. In this stage, fluids with different pressure properties are fully mixed in the main wellbore, and the pressure gradient gradually becomes uniform, resulting in the four pressure decline curves becoming largely consistent. The downward trend in this stage reflects the uniform flow characteristics of the co-production fluids in the main wellbore.
In summary, under the co-production mode, fluids originating from coal reservoirs with varying pressure properties converge within the main wellbore, leading to the formation of confluences and subsequently inducing the co-production fluid disturbance effect. In contrast, this effect is absent under the single production mode.
To further investigate the differences in pressure curves between single production mode and CBM co-production modes, a pressure compatibility coefficient was proposed to quantify the degree of pressure difference between single production mode and CBM co-production modes. Specifically, based on the conditions of the single production mode, the pressure compatibility coefficient is characterized by the ratio of the real-time pressure difference between the co-production mode and the single production mode to the maximum pressure difference.
Figure 10 illustrates the evolution curves of the pressure compatibility coefficient during the early stage of CBM co-production. As shown in the figure, the pressure compatibility coefficients of No. 1–4 coal reservoirs all rapidly increase to 1.00 at the beginning of co-production, reaching this value around t = 1.4 min, and then gradually decline as co-production continues. During this stage, the pressure in the No. 1 coal reservoir exhibits significant fluid disturbance phenomena at the early stage of CBM co-production. Fluid exchange occurs between the main wellbore and each coal reservoir through the branch wellbores, meaning that a portion of the fluid from the high-pressure coal reservoir flows back into the low-pressure coal reservoir, creating pressure disturbances and inhibiting the productivity release of the low-pressure coal reservoir. The pressure compatibility coefficient curve of No. 1 is positioned at the top, followed by the curves of No. 2, 3, and 4 in descending order. For example, at t = 0.05 min, the pressure compatibility coefficients of coal reservoirs 1 to 4 are 0.72, 0.45, 0.34, and 0.33, respectively. This indicates that when coal reservoirs with significantly different pressure characteristics are co-produced, the coal reservoir with a higher initial reservoir pressure exhibits stronger resistance to pressure disturbances caused by fluid interference and demonstrates better compatibility. Conversely, coal reservoirs with lower initial reservoir pressures show weaker resistance to pressure disturbances and poorer compatibility. However, as co-production progresses, the pressure compatibility coefficients begin to decline from their peak values. After t = 10 min of co-production, the pressure compatibility coefficients of No. 1–4 coal reservoirs are 0.88, 0.89, 0.89, and 0.90, respectively. Numerically, the pressure compatibility coefficients of No. 1–4 coal reservoirs are relatively close, indicating that fluids from coal reservoirs with different pressure properties mix in the main wellbore, creating a fluid disturbance effect. As the pressures in the lateral wellbores stabilize, the impact of the fluid disturbance effect on coal reservoirs with similar pressure properties weakens, and the degree of influence becomes more uniform.
Figure 11 and Figure 12 show the cloud pictures of reservoir pressure at t = 0.08 min under CBM co-production and single-production modes, respectively. The figures show that under the co-production mode, there is a high-pressure area with a distribution shape of pear around the production section of the horizontal well in the No. 1 coal reservoir. Also, the pressure-rise trend develops towards the inner side of the coal reservoir. The reservoir pressure spatial distribution characteristics of the No. 2 coal reservoir are similar to those of the No. 1 coal reservoir. That is, their pressure rises. However, the pressure increase in the amplitude of the No. 2 coal reservoir is lower than that of the No. 1 coal reservoir. This observation suggests that pressure disturbances are more likely to emerge in low-pressure coal reservoirs and initially manifest in the near-well zones of these reservoirs. Under the single production mode, the pressure spatial distribution characteristics of the No. 1 and 2 coal reservoirs exhibit a distinct pattern. Specifically, a low-pressure area occurs around the production section of the horizontal well, and the pressure decrease trend develops towards the inner side of the coal reservoir. Their spatial pressure distributions differ from those under the co-production mode. The pressure spatial distribution characteristics of the No. 3 and 4 coal reservoirs under the single-production mode are similar to those under the co-production mode. Additionally, low-pressure areas are observed in the vicinity of the production sections of horizontal wells within these two coal reservoirs.
In summary, during the single production mode, fluids flow continuously from individual coal reservoirs through independent branch shafts. Conversely, during the co-production mode, fluids exiting individual branch shafts converge within the main well hole, resulting in fluid interference between shafts and coal reservoirs. This interference extends into the coal reservoirs, leading to pressure disturbances. Its manifestation is that under the co-production mode, pressure drop rates will decrease, and even the pressure of low-pressure coal reservoirs will increase. According to CBM co-production cases in the Qinshui Basin, Hancheng area, and Laochang block in eastern Yunnan, strong interlayer interference occurs during multi-layer co-production due to phenomena such as fluid backflow, which aligns with the experimental results [48,49,50,51].

3.2. Influences of Well-Hole Fluid Confluences on the Flow Field

Figure 13 and Figure 14 describe the flow field diagrams at t = 0.08 min under the CBM co-production and single production modes, respectively. Through observation of flow spatial distribution characteristics of fluids under the co-production mode, the flow vector arrows of fluids in the near-well zones of the No. 1 and 2 coal reservoirs all point to the deep sides of these reservoirs, showing a pattern of centrifugal flow. Also, the closer the areas are to the production sections of horizontal wells in these coal reservoirs, the faster the fluids flow. Under the single production mode, the flow vector arrows of fluids in the near-well zones of the No. 1 and 2 coal reservoirs all point to the production sections of horizontal wells, presenting a pattern of centripetal flow. It shows that under the co-production mode, the dynamic pressure equilibrium between well-holes and coal reservoirs is partially driven by the reverse injection of fluids from the high-pressure coal reservoirs to the low-pressure coal reservoirs. The fluids flow reversely towards the deep sides of the coal. Under both production modes, the flow field diagrams of the reservoirs create the centrifugal flow inside these reservoirs. e No. 3 and 4 coal reservoirs show dense equipotential lines in the near-well zones and sparse lines in the areas far from the wells. Their fluid flow vector arrows all point to the centers of well holes, presenting a pattern of centripetal flow. Although the pressure inside four horizontal wells reached equilibrium at t = 0.03 min with a pressure value of 1.45 MPa, the pressure at t = 0.08 min was higher than the original reservoir pressure of the No. 1 reservoir, indicating that the No. 1 reservoir was still affected by fluid disturbance, resulting in a reverse flow of fluid. The dynamic pressure balance between the coal reservoir and the wellbore drives the fluid from the coal reservoir with a high initial reservoir pressure to be injected in reverse into the coal reservoir with a low initial reservoir pressure, creating a fluid disturbance effect that results in reverse flow within the coal reservoir with a low initial pressure. As the production time extends, the fluid disturbance effect weakens its impact on the fluid within the coal reservoir with low initial pressure, and the reverse flow restores to a centripetal flow.
Figure 15 shows the evolution of fluid flow characteristics at the moment of t = 0.08 min under both production modes. The calculation principle of fluid flow characteristic parameters can be found in the published papers [43]. The figure shows that under the co-production mode, the evolution patterns of fluid flow characteristic parameters of the No. 1 and 2 coal reservoirs are similar, with negative relative flow velocities, deflection angles of about 180°, and absolute deviations of fluid flowing from the optimal flow trajectory trend line. The relative flow velocity of the No. 2 coal reservoir, measured at a distance of 140 mm from the center of the horizontal well’s production section, returns to a positive value. This is accompanied by a sharp decrease in the deflection angle, which falls significantly below 90°, indicating a restoration of the fluid flow direction towards the optimal flow trajectory trend line. The relative flow velocities of the No. 3 and 4 coal reservoirs have positive values, with relatively small deflection angles. Under the single production mode, the relative flow velocities of fluids in the near-well zones of the No. 1–4 coal reservoirs all have positive values, with deflection angles below 90°. This observation indicates that fluids flow along the optimal flow trajectory trend line under the single production mode.
In summary, during the initial stage of CBM co-production, fluids from different coal reservoirs converge into well holes, resulting in interference. This interference, referred to as “well-hole fluid disturbance” in this study, has the potential to inversely impact the flow states of fluids within different coal reservoirs, ultimately altering their flow characteristics. Under the influence of a relatively strong fluid disturbance effect, high-pressure fluids flow into low-pressure coal reservoirs through centrifugal flow. Consequently, this alters the pressure distributions within the low-pressure coal reservoirs, leading to the formation of high-potential zones proximate to the well zones. Additionally, the influences of fluid disturbance on near-well zones are more significant than those in areas far from the wells. The relative reverse flow velocity of fluids exhibits a decreasing trend as the distance from the well hole increases.

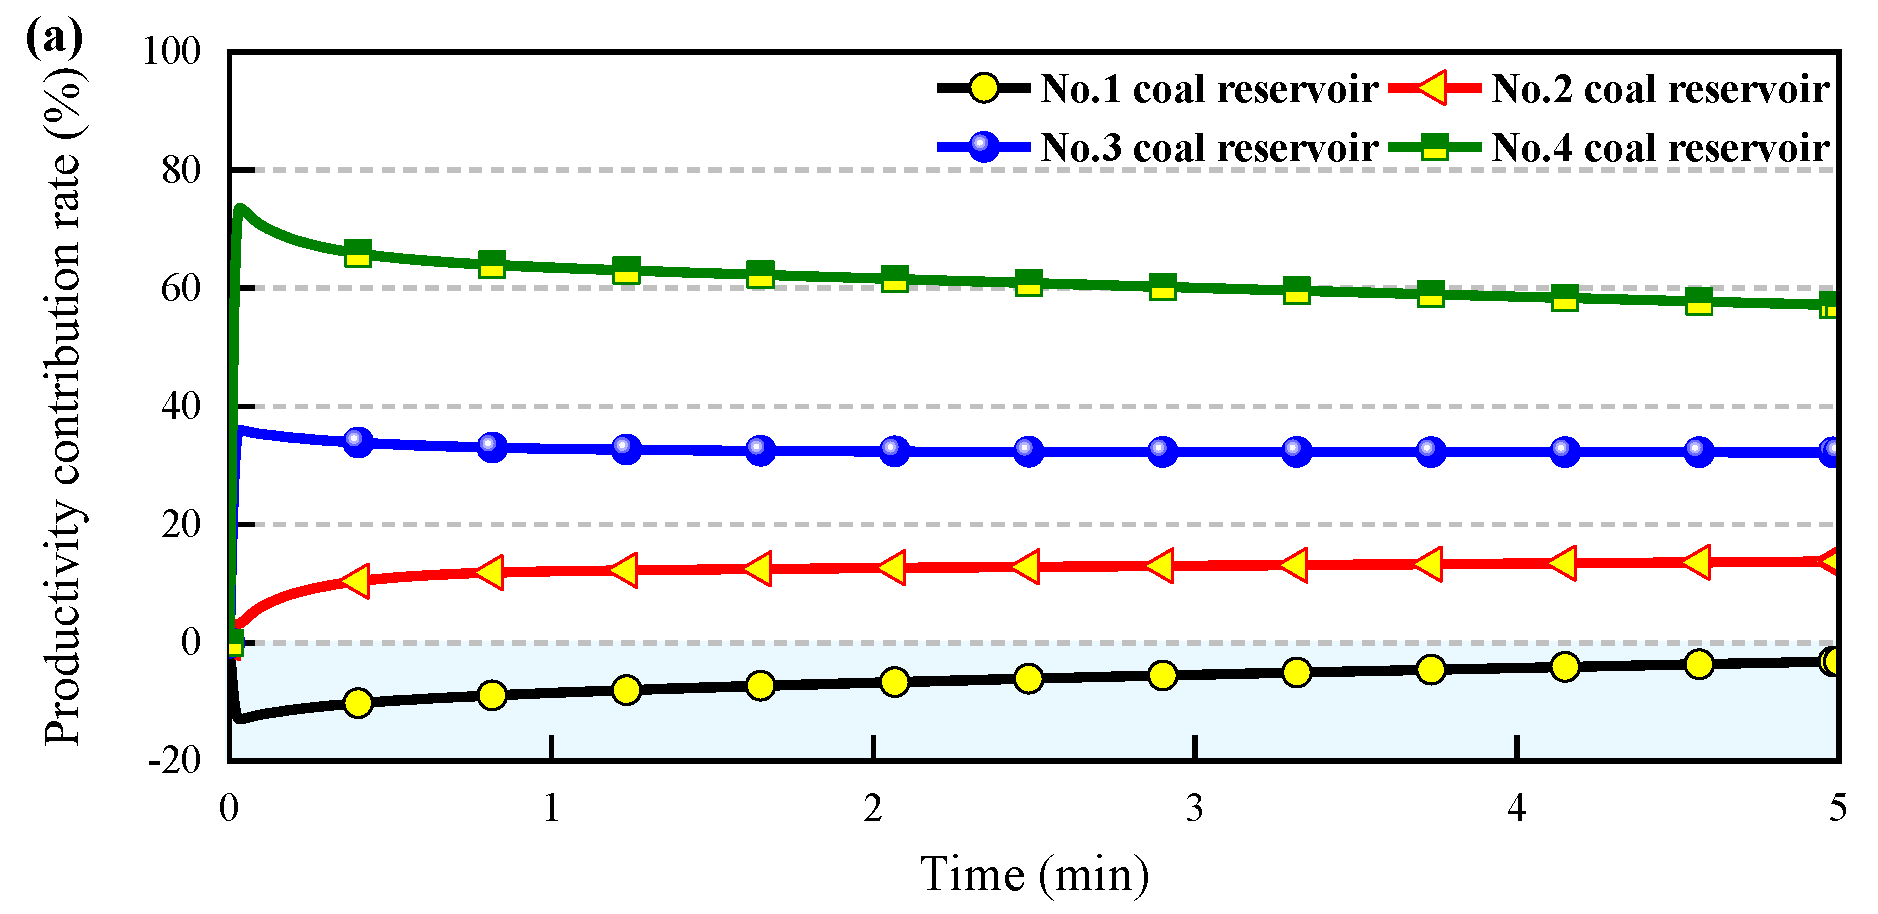
3.3. Influences of Well-Hole Fluid Confluences on Gas Production Characteristics

Figure 16 shows the characteristic evolution curves of instantaneous gas production under the initial CBM co-production and single-production stages. It can be seen that under the single production mode, the evolution patterns of instantaneous gas production curves of four coal reservoirs are consistent. At the moment of production, their instantaneous gas production quickly reaches its peak values and then rapidly decreases, presenting a characteristic unimodal class exponential decline pattern. The No. 4, 3, 2, and 1 coal reservoirs, in descending order of instantaneous gas production amount, have a peak instantaneous gas production amount of 176.77 L/min, 43.96 L/min, 29.59 L/min, and 10.67 L/min, respectively.
Under the co-production mode, the instantaneous gas production of the No. 1 coal reservoir reaches its maximum negative value at the moment of production, amounting to −3.85 L/min. Then, it rises to 0.0 L/min at the moment of t = 3.6 min. The duration of negative gas production lasts for 3.6 min. The gas production of the No. 2 coal reservoir reaches its peak value at t = 0.53 min, which is 3.5 L/min. Before that moment, a suppression phase of gas production exists, then the production drops. The No. 3 and 4 coal reservoirs exhibit a pattern of instantaneous gas production reaching its peak value first and then decreasing quickly. This is comparable to that observed in the single production mode. The peak values of instantaneous gas production of the No. 3 and 4 coal reservoirs are 10.71 L/min and 21.92 L/min, respectively.
Figure 17 shows the evolution curves of the productivity contribution rate during the early stage of CBM production under co-production and single-production modes. It can be seen that under the co-production mode, the productivity contribution rates of the No. 1 and 2 coal reservoirs exhibit an upward trend during the early stage. Conversely, the productivity contribution rates of the No. 3 and 4 coal reservoirs exhibit a downward trend. Under the single production mode, the productivity contribution rates of the No. 1–4 coal reservoirs at the moment of production are 3.1%, 9.3%, 11.5%, and 76.1%, respectively. Under the co-production mode, the productivity contribution rates of the No. 1–4 coal reservoirs at the moment of production are −13.0%, 3.2%, 36.0%, and 73.8%, respectively. Meanwhile, the productivity contribution of the No. 1 coal reservoir starts to rise from its initial rate of −13.0%. Then, it returns to a rate of 0.0% at the moment of t = 8.3 min.
In summary, the co-production mode accentuates productivity differences among coal reservoirs, amplifying the release of high-pressure coal reservoirs while suppressing low-pressure coal reservoirs. The disturbance during the early stage of co-production will force some fluids from high-pressure coal reservoirs to reverse flow into low-pressure coal reservoirs, thus inhibiting the gas production in those low-pressure coal reservoirs. Consequently, peak gas production may lag or even experience reverse flow. The pressure corresponding to individual coal reservoirs is different, so their instantaneous gas production caused by disturbance is also different. High-pressure coal reservoirs that encounter minimal disturbances gradually revert to single-production mode characteristics. However, their gas production capacity is suppressed for low-pressure coal reservoirs that undergo significant disturbances. Based on these findings, this study optimizes production strategies for superimposed pressure systems and proposes a progressive co-production schedule. The core of this schedule lies in the dynamic introduction of gas-bearing layers: initially, CBM from high-pressure coal reservoirs is extracted, and when the reservoir pressure decreases to a level comparable to that of low-pressure coal reservoirs, CBM from the low-pressure reservoirs is co-produced. The primary objective of the progressive co-production schedule is to achieve uniform reservoir pressure (i.e., similar fluid energy) across the superimposed pressure systems, thereby reducing fluid disturbance effects during CBM co-production and ultimately enhancing recovery efficiency.

4. Conclusions

The fluid disturbance effect is a prevalent challenge in coalbed methane (CBM) co-production in superimposed pressure systems in China. This study improved a large-scale experimental technique to evaluate the gas supply characteristics and visualize the fluid flow behavior based on CBM co-production experiments of superimposed pressure systems with four independent pressure systems. The formation mechanism of the fluid disturbance effect under well-hole fluid confluences was explored during the early stage of CBM production. Also, the coordination of CBM co-production has been evaluated through the utilization of the self-built pressure compatibility coefficient and production compatibility coefficient. The primary conclusions are drawn as follows:
  • Current laboratory research primarily focuses on seepage experiments involving series-parallel core samples, while large-scale physical simulation studies on CBM development in superimposed pressure systems are scarce. This study replicates the indoor simulation of superimposed pressure systems, which involve multiple pressure systems coexisting within a reservoir, providing a new approach for the safe and efficient extraction of superimposed pressure systems.
  • Based on the characteristics of superimposed pressure systems, the reconstructed coal simulates the coal reservoir and provides the occurrence place of CBM. The impermeable gas barrier of clay is used as the low-permeability thick rock strata to cut off the fluid connection between coal reservoirs. This work provides a new research approach for revealing fluid disturbance mechanisms and guiding CBM development.
  • The convergence and mixing of fluids from coal reservoirs exhibiting distinct pressure characteristics within the main well hole generate a fluid disturbance effect. The evolution process of well-hole pressure is categorized into two stages: the confluence disturbance stage and the confluence pressure drop stage. Due to well-hole fluid confluences, the well-hole pressure of branch well-holes in the corresponding low-pressure coal reservoirs increases in terms of reservoir pressure. This increase in pressure leads to fluid exchanges between the coal reservoirs and well-holes, manifesting in terms of production.
  • Based on the differences between the fluid disturbance effects of CBM co-production modes, a compatibility method of dynamic characterization has been put forward. The pressure compatibility and production compatibility coefficients exhibit rapid growth during the early stages, followed by a gradual decline during the middle and later stages. The worst compatibility is witnessed during the early stage of co-production, but the compatibility will improve the extension of co-production time.
  • Optimizing production strategies for superimposed pressure systems involves implementing a progressive co-production schedule. The core of this schedule lies in the dynamic introduction of gas-bearing layers: initially extracting CBM from high-pressure coal reservoirs and, once the reservoir pressure decreases to a level comparable to that of low-pressure reservoirs, co-producing CBM from the low-pressure reservoirs. The primary objective of this approach is to achieve uniform reservoir pressure (i.e., similar fluid energy) across the superimposed pressure systems, thereby minimizing fluid disturbance effects during CBM co-production and ultimately enhancing recovery efficiency.
  • This research is currently focused on the flow characteristics of superimposed pressure systems within the reservoir. Future studies should prioritize investigating the coupling effects of low porosity and permeability, gas-water two-phase seepage, the coexistence of multi-phase natural gas, and multi-type reservoirs on the dynamic evolution of the fluid behavior response characteristics induced by fluid interference. Additionally, it is essential to clarify the mechanisms and impacts of reservoir damage caused by the invasion of different fluid phases during CBM co-production and to reveal the coupled flow characteristics of interlayer crossflow and wellbore pipe flow.

Author Contributions

Software, Writing—original draft, J.R.; Conceptualization, Methodology, Software, Writing—original draft, Q.L.; Writing–Review and Editing, M.Z.; Validation, Resources, Supervision, J.X.; Review and Editing, Y.L. and P.Y. All authors have read and agreed to the published version of the manuscript.

Funding

This research was funded by the National Natural Science Foundation of China (No. 52304224).

Data Availability Statement

The data are available from the corresponding author on reasonable request.

Acknowledgments

We also would like to thank the anonymous reviewers for their valuable comments and suggestions that led to a substantially improved manuscript.

Conflicts of Interest

Authors Qixian Li and Yang Li were employed by the China Coal Research Institute, Author Pengbin Yang was employed by the Shanxi Jinxing Energy Co., Ltd. The remaining authors declare that the research was conducted in the absence of any commercial or financial relationships that could be construed as a potential conflict of interest.

References

  1. National Bureau of Statistics of the People’s Republic of China. Development of the People’s Republic of China in 2021. In Statistical Bulletin of National Economic and Social Development; National Bureau of Statistics: Beijing, China, 2022. [Google Scholar]
  2. Liu, H.; Su, G.; Okere, C.; Li, G.; Wang, X.; Cai, Y.; Wu, T.; Zheng, L. Working fluid-induced formation damage evaluation for commingled production of multi-layer natural gas reservoirs with flow rate method. Energy 2022, 239, 122107. [Google Scholar]
  3. Pourhoseini, S.H. Enhancement of radiation characteristics and reduction of NOx emission in natural gas flame through silver-water nanofluid injection. Energy 2022, 194, 116900. [Google Scholar]
  4. Quan, F.; Wei, C.; Ma, J.; Hao, S.; Song, Y. Modeling analysis of coalbed methane co-production interference: A case study in Eastern Yunnan Basin, China. J. Nat. Gas Sci. Eng. 2022, 103, 104631. [Google Scholar]
  5. Huang, H.; Bi, C.; Sang, S.; Miao, Y.; Zhang, H. Signature of coproduced water quality for coalbed methane development. J. Nat. Gas Sci. Eng. 2017, 47, 34–46. [Google Scholar]
  6. Wang, Z.W.; Qin, Y. Physical experiments of CBM co-production: A case study in Laochang district, Yunnan province, China. Fuel 2019, 239, 964–981. [Google Scholar]
  7. Guo, C.; Qin, Y.; Sun, X.; Wang, S.; Xia, Y.; Ma, D.; Bian, H.; Shi, Q.; Chen, Y.; Bao, Y.; et al. Physical simulation and compatibility evaluation of multi-seam CBM co-production: Implications for the development of stacked CBM systems. J. Petrol. Sci. Eng. 2021, 204, 108702. [Google Scholar]
  8. Li, S.; Tang, D.Z.; Pan, Z.J.; Xu, H.; Guo, L.L. Evaluation of coalbed methane potential of different reservoirs in western Guizhou and eastern Yunnan, China. Fuel 2015, 139, 257–267. [Google Scholar]
  9. Lau, H.; Li, H.; Huang, S. Challenges and opportunities of coalbed methane development in China. Energ. Fuel 2017, 31, 4588–4602. [Google Scholar]
  10. Qin, Y.; Moore, T.A.; Shen, J.; Yang, Z.B.; Shen, Y.L.; Wang, G. Resources and geology of coalbed methane in China: A review. Int. Geol. Rev. 2018, 60, 777–812. [Google Scholar]
  11. Qin, Y.; Wu, J.G.; Zhang, Z.G.; Yi, T.S.; Yang, Z.B.; Jin, J.; Zhang, B. Analysis of geological conditions for coalbed methane co-production based on production characteristics in early stage of drainage. J. China Coal Soc. 2020, 45, 241–257. [Google Scholar]
  12. Wang, Z.W. Simulation and Geological-Mathematical Models of CBM Co-Production Interference: A Case of Longtan Formation in Western Guizhou and Eastern Yunnan, China; China University of Mining and Technology: Xuzhou, China, 2021. [Google Scholar]
  13. Qin, Y.; Wu, J.G.; Shen, J.; Yang, Z.B.; Shen, Y.L.; Zhang, B. Frontier research of geological technology for coal measure gas joint-mining. J. China Coal Soc. 2018, 43, 1504–1516. [Google Scholar]
  14. Liang, B.; Shi, Y.; Sun, W.; Fang, S.; Jia, L.; Zhao, H. Experiment on influence of inter layer spacing on combined desorption of double-layer coalbed methane reservoir. J. China Univ. Min. Techno. 2020, 49, 54–61. [Google Scholar]
  15. Guo, X. Production Prediction of Multilayered CBM Reservoirs and Optimization of Production Strategy; China University of Petroleum: Beijing, China, 2019. [Google Scholar]
  16. Liu, L. Experimental Study on Interlayered Crossflow of Multilayered CBM Reservoir in Eastern Yunnan and Western Guizhou; China University of Petroleum: Beijing, China, 2019. [Google Scholar]
  17. Zheng, L.; Li, X.; Su, G.; Zhao, W.; Kong, X.; Tao, X. Applicability of working fluid damage assessment methods for coalbed methane reservoirs. Nat. Gas Ind. 2018, 38, 34–45. [Google Scholar]
  18. Zheng, L.; Tao, X.; Wei, P.; Wu, T.; Liu, H.; Cao, Z. Multi-reservoir production damage physical simulation system and its application in coal-measure gas production. J. China Coal Soc. 2021, 46, 2501–2509. [Google Scholar]
  19. Wang, L.; He, Y.; Wang, Q.; Liu, M.; Jin, X. Improving tight gas recovery from multi-pressure system during commingled production: An experimental investigation. Nat. Resour. Res. 2021, 30, 3673–3694. [Google Scholar]
  20. Liu, G.F.; Meng, Z.; Luo, D.Y.; Wang, J.N.; Gu, D.H.; Yang, D.Y. Experimental evaluation of interlayer interference during commingled production in a tight sandstone gas reservoir with multi-pressure systems. Fuel 2020, 262, 116557. [Google Scholar]
  21. Wang, L.; Yang, S.L.; Liu, Y.C.; Xu, W.; Deng, H.; Meng, Z.; Han, W.; Qian, K. Experiments on gas supply capability of commingled production in a fracture-cavity carbonate gas reservoir. Petrol. Explor. Dev. 2017, 44, 824–833. [Google Scholar]
  22. Xu, J.; Zhang, C.L.; Peng, S.J.; Jia, L.; Guo, S.C.; Li, Q.X. Multiple layers superposed CBM system commingled drainage schedule and its optimization. J. China Coal Soc. 2018, 43, 1677–1686. [Google Scholar]
  23. Xiong, Y.; Zhang, L.; Yang, F.; Lu, Y.; Hu, S. Study on technical policy and threshold value of multiple-zone production with one well for multi-layered gas reservoir. Nat. Gas Ind. 2005, 25, 81–83. [Google Scholar]
  24. Fu, X.; Ge, Y.; Liang, W.; Li, S. Pressure control and fluid effect of progressive drainage of multiple superposed CBM systems. Nat. Gas Ind. 2013, 35, 35–39. [Google Scholar]
  25. Jiang, W.; Wu, C.; Wang, Q.; Liu, Y. Interlayer interference mechanism of multi-seam drainage in a CBM well: An example from Zhucang syncline. Int. J. Min. Sci. Technol. 2016, 26, 1101–1108. [Google Scholar]
  26. Li, Y.; Meng, S.; Wu, P.; Wang, Z.; Yu, Z. Numerical simulation of coal measure gases co-production. J. China Coal Soc. 2018, 43, 1728–1737. [Google Scholar]
  27. Wang, S.; Wang, Y.; Zhang, Z.; Li, Z.; Feng, Y. Analysis of influencing factors on productivity of coalbed methane of combined multi-layer drainage wells. Coal Sci. Technol. 2019, 47, 126–131. [Google Scholar]
  28. Wang, Z.; Qin, Y.; Li, T.; Zhang, X. A numerical investigation of gas flow behavior in two-layered coal seams considering interlayer interference and heterogeneity. Int. J. Min. Sci. Technol. 2021, 31, 699–716. [Google Scholar]
  29. Zhang, C.; Xu, J.; Yin, G.; Peng, S.; Li, Q.; Chen, Y. A novel large-scale multifunctional apparatus to study the disaster dynamics and gas flow mechanism in coal mines. Rock Mech. Rock Eng. 2019, 52, 2889–2898. [Google Scholar]
  30. Zhang, C.; Xu, J.; Peng, S.; Li, Q.; Yan, F. Experimental study of drainage radius considering borehole interaction based on 3D monitoring of gas pressure in coal. Fuel 2019, 239, 955–963. [Google Scholar]
  31. Qin, Y.; Xiong, M.H.; Yi, T.S.; Yang, Z.B.; Wu, C.F. On unattached multiple superposed coalbed-methane system: In a case of the Shuigonghe syncline, Zhijin-Nayong coalfield, Guizhou. Geol. Rev. 2008, 54, 65–70. [Google Scholar]
  32. Shen, Y.L.; Qin, Y.; Guo, Y.H.; Yi, T.S.; Yuan, X.X.; Shao, Y.B. Characteristics and sedimentary control of a coalbed methane-bearing system in Lopingian (late Permian) coal-bearing strata of western Guizhou province. J. Nat. Gas Sci. Eng. 2016, 33, 8–17. [Google Scholar]
  33. Shen, Y.L.; Qin, Y.; Wang, G.G.X.; Guo, H.Y.; Shen, J.; Gu, J.Y.; Xiao, Q.; Zhang, T.; Zhang, C.L.; Tong, G.C. Sedimentary control on the formation of a multi-superimposed gas system in the development of key layers in the sequence framework. Mar. Petrol. Geol. 2017, 88, 268–281. [Google Scholar]
  34. Shen, Y.L.; Qin, Y.; Wang, G.G.X.; Xiao, Q.; Shen, J.; Jin, J.; Zhang, T.; Zong, Y.; Liu, J.B.; Zhang, Y.J.; et al. Sealing capacity of siderite-bearing strata: The effect of pore dimension on abundance and micromorphology type of siderite in the Lopingian (Late Permian) coal-bearing strata, western Guizhou province. J. Petrol. Sci. Eng. 2018, 178, 180–192. [Google Scholar]
  35. Arenillas, A.; Pevida, C.; Rubiera, F.; Pis, J. Comparison between the reactivity of coal and the synthetic coal models. Fuel 2003, 82, 2001–2006. [Google Scholar]
  36. Jessen, K.; Tang, G.; Kovscek, A. Laboratory and simulation investigation of enhanced CBM recovery by gas injection. Transp. Porous. Med. 2008, 73, 141–159. [Google Scholar]
  37. Jasinge, D.; Ranjith, P.; Choi, S. Effects of effective stress changes on permeability of Latrobe Valley brown coal. Fuel 2011, 90, 1292–1300. [Google Scholar]
  38. Dutka, B.; Kudasik, M.; Pokryszka, Z.; Skoczylas, N.; Topolnicki, J.; Wierzbicki, M. Balance of CO2/CH4 exchange sorption in a coal briquette. Fuel Process Technol. 2013, 106, 95–101. [Google Scholar]
  39. Sobczyk, J. A comparison of the influence of adsorbed gases on gas stresses leading to coal and gas outburst. Fuel 2014, 115, 288–294. [Google Scholar]
  40. Arenillas, A.; Pevida, C.; Rubiera, F.; Pis, J. Characterisation of model compounds and a synthetic coal by TG/MS/FTIR to represent the pyrolysis behavior of coal. J. Anal. Appl. Pyrol. 2004, 71, 747–763. [Google Scholar]
  41. Sobczyk, J. The influence of sorption processes on gas stresses leading to the coal and gas outburst in the laboratory conditions. Fuel 2011, 90, 1018–1023. [Google Scholar]
  42. Dutka, B.; Kudasik, M.; Topolnicki, J. Pore pressure changes accompanying exchange sorption of CO2/CH4 in a coal briquette. Fuel Process Technol. 2012, 100, 30–34. [Google Scholar]
  43. Li, Q.; Xu, J.; Peng, S.; Yan, F.; Han, E.; Jiang, C. Physical simulation experiment on flow characteristics in a low-pressure reservoir under co-production. J. China Coal Soc. 2021, 46, 351–363. [Google Scholar]
  44. Wen, Z.; Kang, Y.; Deng, Z.; Sun, L.; Li, G.; Wang, H. Characteristics and distribution of current in-situ stress at shallow-medium depth in coal-bearing basins in China. Geol. Rev. 2019, 65, 729–742. [Google Scholar]
  45. Zhang, Z.; Qin, Y.; Yang, Z.; Jin, J.; Wu, C. Fluid energy characteristics and development potential of coalbed methane reservoirs with different synclines in Guizhou, China. J. Nat. Gas Sci. Eng. 2019, 71, 102981. [Google Scholar]
  46. Chen, S.; Tang, D.; Tao, S.; Xu, H.; Li, S.; Zhao, J. Statistic analysis on macro distribution law of geostress field in coalbed methane reservoir. Coal Sci. Technol. 2018, 6, 57–63. [Google Scholar]
  47. Zhou, B.; Xu, J.; Peng, S.; Yan, F.; Yang, W.; Cheng, L.; Yang, W. Dynamic response of coal seam and roadway during coal and gas outburst. J. China Coal Soc. 2020, 45, 1385–1397. [Google Scholar]
  48. Zhang, Z. CBM System and Drainage Optimization of Taiyuan Formation in Southern Qinshui Basin; China University of Mining and Technology: Xuzhou, China, 2016. [Google Scholar]
  49. Zhang, Z.; Qin, Y.; Fu, X. The favorable developing geological conditions for CBM multi-layer drainage in southern Qinshui basin. J. China Univ. Min. Technol. 2014, 43, 1019–1024. [Google Scholar]
  50. Du, X.; Li, X.; Xu, B.; Ren, W.; Shao, C.; Hu, A.; Zhai, Y. Multi-layer production evaluation of CBM wells in Han-cheng area. Coal Geol. Explor. 2014, 42, 28–34. [Google Scholar]
  51. Zhang, E.; Wu, C.; Dang, G. Interlayer interference analysis of the multi-layer drainage for multiple seams CBM in Laochang mining area of eastern Yunnan province. J. Henan Polytech. Univ. Nat. Sci. 2020, 39, 10–17. [Google Scholar]
Figure 1. Schematic diagram of the occurrence process of fluid disturbance during CBM co-production.
Processes 13 01095 g001
Figure 2. Schematic of the simulation test device.
Processes 13 01095 g002
Figure 3. Schematic diagram of the gas-water separator.
Processes 13 01095 g003
Figure 4. The spatial arrangement of coal reservoirs and impermeable gas barriers. (a) Front view, (b) left view, (c) vertical view, and (d) physical picture.
Processes 13 01095 g004
Figure 5. Production flow chart of the briquette specimens.
Processes 13 01095 g005
Figure 6. Layout of well-hole simulator and sensor. (a) Space layout, and (b) nomenclature of sensors.
Processes 13 01095 g006
Figure 7. Stress loading scheme.
Processes 13 01095 g007
Figure 8. Physical simulation test flowchart.
Processes 13 01095 g008
Figure 9. Dynamic evolution curves of pressure inside four horizontal wells during the early stage of CBM production under single-production mode and co-production mode.
Processes 13 01095 g009
Figure 10. Dynamic evolution curves of the pressure compatibility coefficient during the early stage of CBM co-production.
Processes 13 01095 g010
Figure 11. Cloud pictures of reservoir pressure under co-production mode. (a) No. 1 coal reservoir, (b) No. 2 coal reservoir, (c) No. 3 coal reservoir, and (d) No. 4 coal reservoir.
Processes 13 01095 g011
Figure 12. Cloud pictures of reservoir pressure under single production mode. (a) No. 1 coal reservoir, (b) No. 2 coal reservoir, (c) No. 3 coal reservoir, and (d) No. 4 coal reservoir.
Processes 13 01095 g012
Figure 13. Flow field diagrams under co-production mode. (a) No. 1 coal reservoir, (b) No. 2 coal reservoir, (c) No. 3 coal reservoir, and (d) No. 4 coal reservoir.
Processes 13 01095 g013
Figure 14. Flow field diagrams under single production. (a) No. 1 coal reservoir, (b) No. 2 coal reservoir, (c) No. 3 coal reservoir, and (d) No. 4 coal reservoir.
Processes 13 01095 g014
Figure 15. Fluid flow characteristics at the moment of t = 0.08 min under both production modes. (a) Relative flow velocity, co-production mode, (b) relative flow velocity, single production mode, (c) deflection angle, co-production mode, and (d) deflection angle, single production mode.
Processes 13 01095 g015
Figure 16. Dynamic characteristic evolution curves of instantaneous gas production during the early stage of CBM production under both production modes. (a) No. 1 coal reservoir, (b) No. 2 coal reservoir, (c) No. 3 coal reservoir, and (d) No. 4 coal reservoir.
Processes 13 01095 g016aProcesses 13 01095 g016b
Figure 17. Dynamic characteristic evolution curves of productivity contribution rate during the early stage of CBM production under both production modes. (a) Co-production mode, and (b) single production mode.
Processes 13 01095 g017aProcesses 13 01095 g017b
Table 1. Test scheme.
No.Crustal Stress (MPa)Initial Reservoir Pressure (MPa)Production Mode
σH1σH2σH3σH4σvσh1σh2σh3σh4PIPIIPIIIPIV
15.04.03.01.01.41.82.2Single production
2Co-production
Disclaimer/Publisher’s Note: The statements, opinions and data contained in all publications are solely those of the individual author(s) and contributor(s) and not of MDPI and/or the editor(s). MDPI and/or the editor(s) disclaim responsibility for any injury to people or property resulting from any ideas, methods, instructions or products referred to in the content.

