Review

Malodorous Gases in Aquatic Environments: A Comprehensive Review from Microbial Origin to Detection and Removal Techniques

by
Gabriela Meléndez-Plata
1,*,†,
Jesus R. A. Mastrogiacomo
1,*,†,
Martha L. Castellanos
2,†,
Juan P. Romero
2,
Victor Hincapié
2,
Héctor Lizcano
2,
Juan D. Acero
2,
María Francisca Villegas-Torres
3,
Jorge M. Gómez
1,
Juan C. Cruz
4 and
Luis H. Reyes
1,*
1
Department of Chemical and Food Engineering, Universidad de los Andes, Bogota 111711, Colombia
2
Enel, Bogota 110221, Colombia
3
Centro de Investigaciones Microbiológicas (CIMIC), Department of Biological Sciences, Universidad de los Andes, Bogota 111711, Colombia
4
Departament of Biomedical Engineering, Universidad de los Andes, Bogota 111711, Colombia
*
Authors to whom correspondence should be addressed.
These authors contributed equally to this work.
Processes 2025, 13(4), 1077; https://doi.org/10.3390/pr13041077
Submission received: 3 March 2025 / Revised: 19 March 2025 / Accepted: 26 March 2025 / Published: 3 April 2025
(This article belongs to the Section Environmental and Green Processes)

Abstract

:
Malodorous gases—particularly hydrogen sulfide (H2S), ammonia (NH3), and volatile sulfur compounds (VSCs)—significantly degrade water quality, threaten public health, and disrupt ecosystems. Their production stems from microbial activity, nutrient overload, and industrial discharges, often magnified by low dissolved oxygen. This review integrates current insights into the microbial sulfur and nitrogen cycles to elucidate how these gases form, and surveys advances in detection technologies such as gas chromatography and laser-based sensors. We also assess diverse mitigation methods—including biotechnological approaches (e.g., biofilters, biopercolators), physicochemical treatments, and chemical conversion (Claus Process)—within relevant regulatory contexts in Colombia and worldwide. A case study of the Bogotá River exemplifies how unmanaged effluents and eutrophication perpetuate odor issues, underscoring the need for integrated strategies that reduce pollution at its source, restore ecological balance, and employ targeted interventions. Overall, this review highlights innovative, policy-driven solutions and collaborative efforts as pivotal for safeguarding aquatic environments and surrounding communities from the impacts of odorous emissions.

1. Introduction

Water pollution caused by human activities is a global issue that severely impacts water quality, limiting its use for essential applications such as agricultural irrigation, human consumption, and industrial processes such as energy generation. Generally, an estimated 48% of wastewater is released untreated, with higher rates observed in developing regions [1]. In Latin America, outdated wastewater treatment plants and inadequate sanitation infrastructure exacerbate this issue, releasing contaminants of emerging concern into the environment, particularly near urban areas [2]. An illustrative case is the Bogotá River, which traverses both rural and densely populated areas, receiving untreated domestic, industrial, and agricultural wastewater [3]. This contamination not only degrades the ecosystem but also causes the generation of unpleasant odors due to compounds such as total reduced sulfur (TRS) and ammonia (NH3), further complicating its management and sustainable use.
Malodorous gases emanating from aquatic environments represent a critical challenge to water quality and public health, necessitating a comprehensive understanding of their sources, detection, and control. Although previous reviews have examined specific aspects of this problem, such as the microbial processes involved in the generation of hydrogen sulfide (H2S) [4] or methods for the removal of ammonia (NH3) from wastewater [5], a holistic approach integrating the full spectrum of malodorous gases, including volatile sulfur compounds (VSCs), has been lacking. In addition, recent advances in detection technologies, particularly in sensor development and spectroscopic techniques, together with innovative biotechnological and chemical mitigation strategies, warrant a timely and comprehensive update of the existing literature. This review addresses this gap by providing an interdisciplinary synthesis of the current knowledge on malodorous gases in aquatic systems, including their microbial origins, advanced detection methods, various removal techniques, and relevant regulatory frameworks. In addition, we incorporate a case study of the Bogotá River to illustrate the real-world complexities and practical implications of odor pollution, a perspective often absent in previous reviews. This integrated approach offers valuable information for researchers, policymakers, and practitioners striving to mitigate the environmental and social impacts of malodorous gas emissions from aquatic environments.
Previous research has addressed the issue of foul-smelling gases in aquatic environments, but typically in a fragmented manner. For example, reviews have been published focusing exclusively on hydrogen sulfide (H2S) generated by microbial processes in sewage systems [6] or assessments of methods for hydrogen sulfide removal [7]. There are also specific studies on volatile sulfur compounds (VSCs) in inland waters—for instance, ref. [8] examined the sources and sinks of foul-smelling sulfur compounds in lakes and rivers.
However, an integrated perspective encompassing all these odorous gases together was lacking. Until now, no holistic review had integrated both sulfur compounds (H2S and VSCs) and nitrogen compounds (NH3), along with their microbial mechanisms, advanced detection methods, and control strategies. This review aims precisely to fill that gap.
Notably, this work provides an interdisciplinary synthesis of the current knowledge, covering everything from the microbial origins of these gases to the latest monitoring technologies and relevant regulatory initiatives. Additionally, it incorporates a real-world case study (the Bogotá River), illustrating the complexities and challenges of odors in a contaminated water body—something rarely addressed in previous reviews. Thus, the introduction establishes that this review will offer an integrated and novel perspective, valuable for both researchers and environmental managers, filling knowledge gaps and guiding solutions.
Although ammonia (NH3) and other volatile sulfur compounds (VSCs) also contribute to malodors in aquatic environments, this review focuses primarily on hydrogen sulfide (H2S). The rationale for this scope is twofold: First, H2S presents a more immediate toxicity risk at relatively low concentrations, often making it the highest-priority gas to mitigate in industrial and municipal contexts. Second, many NH3-focused remediation methods are substantially more complex or cost-intensive, and thus beyond the current scope. While we acknowledge the significance of NH3 and VSC removal strategies—especially in areas where these gases dominate malodor concerns—detailed analyses of their treatment mechanisms, operational costs, and technological challenges warrant a separate in-depth review. Readers interested in advanced NH3 or VSC control methods may consult the existing literature [9,10] for comprehensive assessments of associated technologies and cost-effectiveness.

2. Emission Sources of Malodorous Gases

2.1. Total Reduced Sulfur (TRS) and Ammonia (NH3) as Major Malodorants

TRS compounds consist of a group of sulfur-containing gases that are primarily known for their intense odor and low olfactory thresholds [10]. These compounds, which include hydrogen sulfide (H2S), mercaptans (e.g., methyl mercaptan (CH3SH) and dimethyl disulfide (DMDS)), are typically associated with anaerobic decomposition in organic-rich environments [8].
TRS compounds are a subset of volatile sulfur compounds (VSCs), a broader class of sulfur gases emitted during microbial activity and chemical reactions in wastewater treatment, landfills, and industrial facilities [11]. Among these, H2S is the most studied TRS compound, mainly due to its distinctive “rotten egg” odor with an extremely low odor threshold (11.1 μ g/m3) [12]. However, other TRS compounds, such as mercaptans and DMDS, also present considerable challenges. Methyl mercaptan (CH3SH) has an odor threshold ranging from 0.02 to 0.4 ppbv [13], which is perceived as more pungent than H2S and contributes significantly to complaints of malodor [14].
In addition to TRS, NH3 is a highly volatile and reactive gas that plays a significant role as an offensive odorant in various environments, particularly in agricultural, industrial and waste management activities [15]. NH3 is characterized by its sharp and pungent smell and can be detected at concentrations as low as 5 ppm [16]. Its volatility and widespread sources contribute significantly to complaints about malodors and environmental degradation, which requires effective monitoring and mitigation measures.
NH3 has significant environmental consequences, mainly due to its role as a precursor to fine particulate matter (PM2.5). Once released into the atmosphere, NH3 reacts with acidic compounds, including sulfuric acid (H2SO4) and nitric acid (HNO3), to form ammonium salts, which are a significant component of (PM2.5) [17]. These fine particles contribute to air pollution, reduce visibility, and pose significant health risks. Furthermore, the deposition of NH3 and its reaction products in soils and water bodies disrupt the balance of nutrients, promoting eutrophication and acidification in sensitive ecosystems [18]. This process disrupts aquatic habitats and reduces biodiversity, illustrating the dual role of NH3 as a local and regional environmental pollutant.

2.2. Emission Sources

2.2.1. Anthropogenic Emissions

One of the primary sources of H2S emissions is the oil and natural gas industry, through processes such as exploration, extraction, refining, and transportation [19]. In each of these processes, H2S can be released as a by-product, particularly during petroleum refining and desulfurization, and in the processing of natural gas, where chemical and thermal separations are employed [20]. Another significant source of emissions is wastewater treatment, where activated sludge is generated to promote the degradation of organic matter by microorganisms [21]. During this process, H2S is produced as a by-product of microbial anaerobic decomposition and is one of the primary compounds responsible for odors.
In sewer systems and wastewater treatment plants, the accumulation of organic matter under anaerobic conditions generates H2S and VSCs in high concentrations. Field studies in treatment plants (WWTPs) report that in confined spaces (e.g., well heads, digesters), H2S levels can reach hundreds of ppm [22]. For example, in a municipal plant, H2S concentrations in the inlet air of a biofilter were measured between 200 and 1300 mg/m3, approximately equivalent to 140 to 930 ppm [22].
Agriculture is the predominant source of global NH3 emissions, accounting for approximately 80% of anthropogenic releases [23]. The application of fertilizers is a key source of NH3 emissions [24]. Under certain environmental conditions, particularly high temperatures and alkaline soils, ammonium-based fertilizers undergo volatilization, releasing NH3 into the atmosphere [25]. In industrial contexts, NH3 is emitted from chemical manufacturing and wastewater treatment processes [26]. Furthermore, the combustion of fossil fuels and biomass also releases NH3, contributing to its presence in urban and peri-urban areas [27]. These sources highlight the widespread prevalence of NH3 emissions in various sectors.
In industrial settings, NH3 is released to a lesser extent, for instance, in chemical manufacturing processes or fertilizer storage. However, in intensive livestock facilities, concentrations can be very high: measurements inside pig or poultry barns typically report between 5 and 18 ppm of NH3, with peaks reaching up to 47 ppm under poor ventilation conditions [28].

2.2.2. Natural Emissions

Natural sources of H2S emissions include geothermal sources such as geysers and hot springs, which release H2S as a by-product of volcanic and geothermal activity [29]. Volcanoes, in particular, release H2S during eruptions, contributing to the accumulation of this gas in the atmosphere [30]. Another source is the anaerobic decomposition of organic matter by microorganisms, which also generates H2S in natural environments such as swamps, peat bogs, and standing bodies of water [31]. In these ecosystems, microorganisms break down organic matter without oxygen, producing H2S as one of the resulting compounds.
For example, in rivers highly eutrophicated by untreated wastewater, the formation of anoxic zones in sediments is common, continuously releasing H2S and ammonia. A study by the ATSDR agency reports that in polluted watercourses, dissolved ammonia concentrations of up to 16 ppm (mg/L) have been detected [28], compared to just 0.01–0.043 ppm in unaffected surface waters. These high levels occur near industrial or urban effluent discharge points, contributing to urine- or ammonia-like odors along the shorelines.
Natural sources of NH3 emissions include the decomposition of organic matter and biological processes in the environment [32]. A significant source is the microbial breakdown of nitrogen-containing compounds, such as urea and proteins, in soils and water bodies [33]. Wetlands, marshes, and other aquatic ecosystems contribute to NH3 emissions due to the anaerobic degradation of organic material [34]. Furthermore, the excretion of urea by animals, particularly in natural habitats or unmanaged grazing systems, leads to its hydrolysis by urease enzymes, releasing NH3 into the atmosphere [35].
In natural aquatic ecosystems (wetlands, swamps, estuaries), the generation of foul-smelling gases primarily originates from geothermal processes or the anaerobic decomposition of organic matter. Typical background levels of H2S in natural ambient air are very low (on the order of 0.00011 to 0.00033 ppm, i.e., 0.11–0.33 ppb) [36]. However, in locations with volcanic or geothermal activity, these values can increase significantly. For example, in areas with hot springs and fumaroles, H2S concentrations of up to several ppm have been measured; a study in Rotorua (New Zealand) recorded 7–8 ppm of H2S near the ground in geothermal emission areas [37].
In stagnant natural waters with a high organic load, the lack of dissolved oxygen leads to the biogenic production of H2S by sulfate-reducing bacteria. Volatile sulfur compounds (VSCs) resulting from microbial degradation (e.g., methanethiol, dimethyl sulfide, dimethyl disulfide) are usually detected in trace amounts, but they are sufficient to cause odors due to their extremely low olfactory thresholds [38]. In fact, the proliferation and subsequent decay of algae in freshwater bodies can release large quantities of foul-smelling VSCs—including H2S, mercaptans, and organic sulfides—during the anaerobic putrefaction of biomass [39]. A documented case involves episodes of “black water” in eutrophic lakes, where the decomposition of cyanobacterial blooms generates odors reminiscent of rotten eggs and decomposing organic matter.

2.2.3. Hybrid Emissions

Some industrial processes, by their nature, facilitate the emission of H2S generated naturally but enhanced by human activity. One such example is the use of wastewater in industrial processes, where the movement and treatment of this water lead to the release of H2S into the environment [40], particularly in still tanks in water treatment or power generation plants. The turbulence and agitation of water during its movement cause the release of H2S into the atmosphere [41]. Another example is anaerobic digestion in biogas plants, where organic waste decomposes without oxygen, generating H2S as one of the by-products [42].
The storage and spread of manure and slurry, particularly in open systems, promote the microbial degradation of nitrogen compounds, resulting in significant NH3 releases [43]. In wastewater treatment plants, the breakdown of nitrogenous waste during biological treatment can also enhance NH3 emissions, especially during stages of aeration or agitation [44]. Furthermore, composting organic waste under aerobic and anaerobic conditions releases NH3, combining natural microbial processes with industrial waste management practices [45]. These hybrid sources underscore the role of human activity in amplifying natural NH3 emissions.
Table 1 presents a comprehensive comparison between the emissions sources.

3. Regulatory Framework and Odor Thresholds

3.1. International Standards and Legislation

Numerous countries have established specific regulations and guidelines to monitor and control the emission of odorous compounds. In Europe, the UNE-EN 13725:2022 standard [46], which reviews the 2004 iteration, outlines methodologies to determine malodor concentration through dynamic olfactometry, serving as a standard reference framework for assessing odor emissions throughout the European Union. This standard has been extensively adopted by countries outside Europe, including Australia, Chile, Colombia, the United States, South Korea, and New Zealand, thus improving the consistency and comparability of measurements worldwide.
In addition to UNE-EN 13725, additional standards, including UNE-EN 15259 [47] and ISO 16911-1 [48], provide methodologies for organizations and laboratories involved in the quantification and regulation of odorous emissions. These standards delineate protocols for sampling, measurement, and data interpretation, facilitating a more precise assessment of the impact of malodor on adjacent communities.
In Asia, nations such as Australia [49], China, and Japan also have specific regional and sectoral regulations. For example, Japan’s Offensive Odor Control Law, amended in 1995, aims to enhance effectiveness. Several other countries, including Canada (Ontario [50] and Alberta [51]), the US, and Argentina’s Buenos Aires province, have established regional emission standards tailored to specific activities in their jurisdictions.
In Latin America, Chile launched a sectoral Odor Management Strategy in 2012 under its environmental regulation program [52]. By 2023, regulations for key sectors such as pork and fishing were published and adopted [53].
According to the review, most legislative initiatives do not establish specific maximum thresholds for point activities or facilities with potential odorous impact. Instead, the regulations focus on monitoring and tracking methodologies, using olfactometric studies, dispersion modeling or other assessment methods. As a result, reference thresholds are often expressed in odor units (EUo) rather than defined concentration limits for a specific odor-generating substance.

3.2. Regulation and Air Quality Standards in Colombia

In Colombia, Law 9 of 1979 sets general guidelines for preserving and improving sanitary conditions, environmental quality, and public health [54]. Later, in 1995, Decree 948 established regulations to protect and control air quality [55]. However, it was not until Resolution 601 of 2006 that air quality and emission levels were officially regulated, establishing thresholds for key substances that generate offensive odors [56]. Odor is considered offensive when unpleasant and can cause discomfort, although it does not necessarily harm the health.
Resolution 601 was amended by Resolution 610 in 2010 [57], and in 2013, Resolution 1541 expanded the regulations to include the maximum allowed levels and guidelines for evaluating activities that generate offensive odors [58]. These resolutions also adopted European olfactometry standards, which measure odor concentrations and their impact on populations.
In Colombia, the main substances of offensive odor are H2S, TRS, and NH3, with H2S being the most common in activities that involve the discharge of water, such as hydroelectric generation. Resolution 2087 of 2014 established protocols for monitoring, controlling, and surveilling offensive odors, detailing procedures to assess air quality and emission levels, and using dispersion models for atmospheric pollutants [59]. The NTC 6012-1:2013 standard [60] provides methods to evaluate odors, focusing on the psychometric evaluation of odor annoyance.

4. Thresholds, Exposure Times, and Concentrations of H2S

Odor thresholds are established based on perception, duration of exposure, and concentration levels to avoid acute and chronic effects. Table 2 summarizes the thresholds and maximum permissible levels.

5. Health Effects of Odorous Gases

5.1. Health Effects of TRS

The health impacts of TRS compounds depend on their concentration and duration of exposure. At concentrations exceeding 150 ppm, CH3SH can cause depression of the central nervous system, nausea, and respiratory irritation [62]. At concentrations as low as 50 ng/mL, CH3SH inhibits the growth and proliferation of epithelial cells, although it does not affect fibroblasts [63].
DMDS is another major TRS component, recognized for its garlic-like odor and its role in industrial malodor events [64]. Despite its higher odor threshold compared to H2S and mercaptans, DMDS has the potential to cause acute respiratory irritation and headaches at moderate concentrations [65]. Prolonged exposure can lead to delayed toxicity, including mucosal inflammation in the eyes, nose, oropharynx, and airways, and chronic exposure to lower levels may cause long-term respiratory effects [66].
Chronic exposure to low levels, often found near industrial facilities, can cause symptoms such as fatigue, headaches, and respiratory discomfort [67]. Acute exposure to high concentrations of CH3SH and DMDS can cause severe respiratory distress, effects on the central nervous system, and, in extreme cases, death [65].
A comparative analysis of the intensity and toxicity of the odor of TRS components shows that each compound contributes a distinctive profile to the overall impact of TRS emissions [68]. H2S is of particular concern due to its high toxicity and detectability, making it a primary target for mitigation efforts. Although mercaptans are less hazardous to health than H2S, they are much more potent odorants and contribute disproportionately to complaints of malodor due to their very low detection thresholds [12]. Despite its relatively low impact on the intensity and toxicity of the odor, DMDS has been shown to improve the persistence and complexity of malodors in industrial environments [68]. These differences require the implementation of comprehensive monitoring systems capable of detecting and quantifying each component of the TRS to inform effective control strategies.

5.2. Health Effects of NH3

The health impacts of NH3 exposure depend on its concentration and duration. At low concentrations, NH3 acts as an irritant, causing discomfort in the eyes, nose, and throat [69]. Chronic exposure to NH3 can have significant health effects. In laying hens, long-term exposure to 30 ppm NH3 increased plasma levels of certain inflammatory markers [70]. Moreover, NH3 contributes to the generation of (PM2.5), exacerbating pre-existing cardiovascular and pulmonary conditions, increasing morbidity and mortality in affected populations [71].

6. Biogeochemical and Microbial Processes Leading to Gas Formation

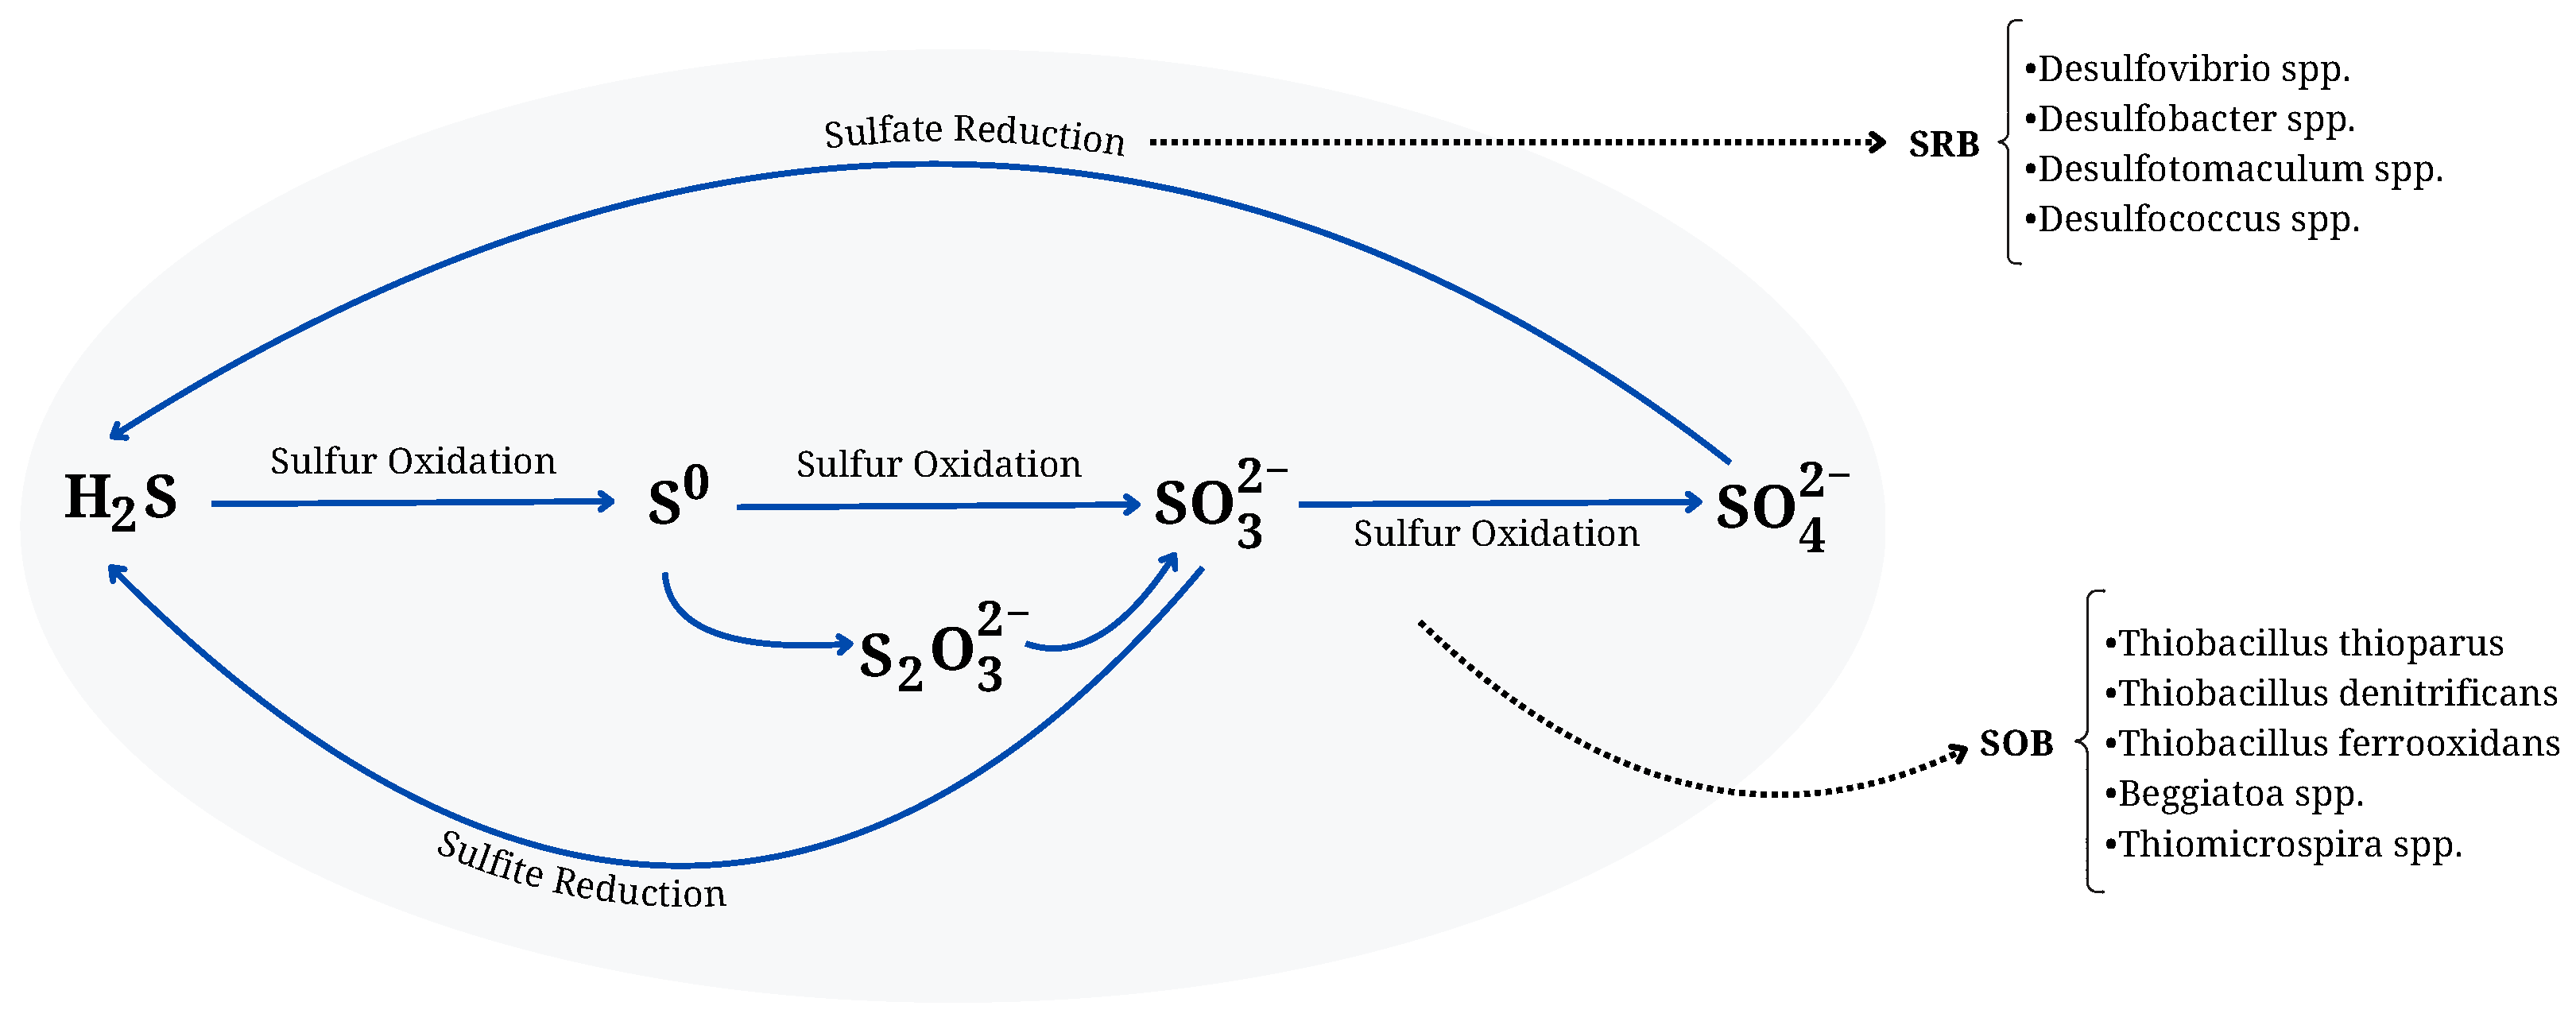
6.1. Biological Sulfur Cycle and Microbial Processes Leading to H2S Production

The sulfur cycle is an essential biogeochemical process that ensures the availability of sulfur in suitable chemical forms for living organisms and regulates fundamental processes in diverse ecosystems [72]. This cycle (Figure 1) describes the transition of sulfur between various oxidation states. The process is primarily driven by microorganisms that facilitate sulfur cycling in different environments, including extreme habitats, providing opportunities to mitigate sulfur-based pollution [73]. These microorganisms play an essential role in the conversion of sulfur compounds to reduced and oxidized forms through complex metabolic processes [74]. In addition to its role in maintaining environmental balance, the sulfur cycle is vital to biological productivity and has significant applications in wastewater treatment and sulfur pollutant mitigation [73].
A key component of the sulfur cycle is sulfate ( SO 4 2 ) reduction, carried out by sulfate-reducing bacteria (SRB) under strictly anaerobic conditions. These bacteria are essential for sulfur recycling in sedimentary environments and closed aquatic systems, contributing significantly to sulfur flux within ecosystems [77]. SRB produce H2S by reducing sulfur compounds, thus facilitating the decomposition of organic matter [78]. For example, in wastewater, H2S is often used as an indicator of anaerobic degradation of organic matter, helping to identify decomposition processes without oxygen [79]. However, some SRB have been found to respire oxygen, although no studies have shown that pure cultures of SRB thrive under aerobic conditions [80]. In addition, in oxygenated environments, H2S can form through sulfurized amino acid degradation [78], highlighting the diversity of microbial mechanisms that generate this compound and its ecological relevance in various ecosystems.
SRB utilize oxidized compounds such as SO 4 2 , sulfite ( SO 3 2 ), and elemental sulfur (S0) as electron acceptors. During this process, SO 4 2 is reduced to H2S while oxidizing organic substrates or hydrogen, which provides energy for cell growth. The general reaction for SO 4 2 reduction is as follows.
8 H 2 + 2 SO 4 2 H 2 S + HS + 5 H 2 O + 3 OH
Sulfite reduction is one of the most studied reactions. In environments suitable for SRB, sulfite reduction and thiosulfate reduction ( S 2 O 3 2 ) can also occur [81].
4 SO 3 2 + H + 3 SO 4 2 + HS
S 2 O 3 2 + H 2 O SO 4 2 + HS + H +
In contrast, sulfur-oxidizing bacteria (SOB) complement the activity of SRB by transforming reduced sulfur compounds into oxidized forms. These autotrophic bacteria convert H2S into elemental sulfur (S0) and, eventually, to SO 4 2 [82]. This oxidative process can occur under aerobic conditions or limited oxygen availability, as described by the following reactions.
2 H 2 S + O 2 2 S 0 + 2 H 2 O
H 2 S + 2 O 2 SO 4 2 + 2 H +
Elemental sulfur (S0) can also be oxidized to SO 4 2 through metabolic processes carried out by specialized microorganisms. The oxidation of S0 is primarily mediated by chemoautotrophic and photoautotrophic microorganisms [83], which use molecular oxygen as the final electron acceptor.
2 S 0 + 3 O 2 + 2 H 2 O 2 SO 4 2 + 4 H +
During the oxidation of H2S to SO 4 2 , SOB generate a series of intermediate compounds that are crucial for the dynamics of the sulfur cycle. This stepwise oxidation process, characteristic of genera such as Thiobacillus, includes the formation of S 2 O 3 2 and tetrathionate ( S 4 O 6 2 ) as intermediates before reaching the final form SO 4 2 . The general sequence of reactions is represented as follows.
H 2 S S 0 S 2 O 3 2 S 4 O 6 2 SO 4 2
In the first stage, H2S is oxidized to elemental sulfur (S0), which can accumulate temporarily inside or outside the cells, depending on the microbial species. For example, species such as Thiobacillus and Chlorobiaceae deposit S0 outside the cell [84], while others, such as Beggiatoa, Thiothrix, and Chromatiaceae, store it intracellularly [85]. Afterward, S0 is converted into S 2 O 3 2 , which is then transformed into S 4 O 6 2 before being fully oxidized to SO 4 2 . Each of these steps is catalyzed by specific enzymes that optimize electron transfer and energy flow under varying environmental conditions [76].
In environments where oxygen availability is limited, SOB exhibit metabolic versatility using alternative electron acceptors, such as nitrate ( NO 3 ), during H2S oxidation [80]. This mechanism enables anoxic sulfide oxidation, particularly in environments such as biofilms, stratified sediments, and eutrophic aquatic systems with steep oxygen gradients.
Sulfur also exists in organic forms within biomolecules such as amino acids, integrating into the sulfur cycle through assimilation and decomposition processes. During organic matter decomposition, sulfur is released as H2S or volatile compounds such as dimethyl sulfide (DMS), contributing to the sulfur flux in the atmosphere [86].
Finally, in ecosystems such as marine sediments and sewage biofilms, interactions between SRB and SOB create a tightly coupled cycle. The sulfide produced by SRB diffuses into oxygenated zones, where SOB oxidize it back to SO 4 2 , ensuring a continuous flow of sulfur. This mechanism, essential in both natural and engineered systems, is the foundation of wastewater treatment and environmental remediation technologies.

6.2. Formation Mechanisms of TRS Compounds

TRSs are produced by biochemical and microbiological processes that involve the activity of heterotrophic and anaerobic microorganisms, as well as chemical reactions catalyzed under specific conditions. Although H2S production is typically associated with anoxic environments, recent research has shown that certain freshwater bacteria, such as the Stenotrophomonas and Chryseobacterium species, can generate H2S under aerobic conditions by degradation of L-cysteine [78]. In Escherichia coli, this process occurs via two discrete metabolic pathways. One pathway involves L-cysteine desulfhydrases, which directly catalyze the production of H2S. The alternative path involves a series of enzymatic reactions in which L-cysteine is initially transformed by L-cysteine aminotransferase and subsequently by 3-mercapto pyruvate sulfurtransferase, leading to the generation of reactive sulfur species [87]. These pathways illustrate the metabolic flexibility of E. coli in the processing of sulfur amino acids, producing volatile compounds such as H2S or sulfur intermediates involved in redox processes. This demonstrates the diverse mechanisms of H2S production.
VSCs primarily originate from the degradation of organic sulfur compounds, particularly the amino acids cysteine and methionine, which are released during the decomposition of organic matter. Several studies have identified these amino acids as key precursors for the formation of VSCs, including CH3SH, DMS, and even H2S [38]. Although reduction of SO 4 2 contributes to the formation of VSCs, the decomposition of organic matter is the primary source in specific environments, such as peatlands [88].
The degradation of cysteine by microorganisms occurs under aerobic and anaerobic conditions, resulting in the release of H2S, NH3, and other compounds. In anaerobic environments, this reaction is catalyzed in archaea like Methanocaldococcus jannaschii by cysteine desulfurase, which contains a [4Fe-4S] cluster critical for its catalytic activity [89]. In bacteria such as Salmonella enterica, the enzyme CyuA plays a similar role in cysteine degradation under reducing conditions [90]. In addition, methionine is metabolized by methionine gamma-lyase, which converts it to CH3SH, producing NH3 and 2-oxobutyric acid [91]. These initial processes not only result in the formation of volatile compounds such as H2S and CH3SH but also set the stage for subsequent reactions that lead to other complex VSCs that contribute significantly to the formation of odors in organic-rich environments [88].
In addition to being a direct product of methionine degradation, CH3SH can also be formed by the methylation of H2S in the presence of methyl donors such as S-adenosylmethionine [92]. CH3SH not only serves as an intermediate in VSC synthesis but also has a distinctive odor [93]. In anaerobic systems, CH3SH can undergo further methylation to form DMS or be oxidized to DMDS [94]. This reaction, mediated by microorganisms adapted to reduce conditions such as methanogens and SRB, involves the combination of two CH3SH molecules with the release of water [95].
In environments with higher oxidative activity or where anoxic conditions alternate with oxygenic conditions, disulfides can evolve into dialkyl polysulfides [96,97]. These compounds, which contain sulfur atom chains, are formed through the oxidation of disulfides [98]. Polysulfide accumulation is particularly evident in aquatic sediments, where microbial interactions and chemical reactions favor their production [99]. Although polysulfides are less volatile than other VSCs, their presence in sediments can influence the dynamics of sulfur and the generation of other malodorous compounds when environmental conditions change [100].
The formation of dimethylsulfide from dimethylsulfoniopropionate (DMSP), a compound mainly produced by algae and phytoplankton [101], has been identified in aquatic systems [102]. This precursor is metabolized by bacteria through specific enzymatic pathways, such as DMSP lyase, which releases DMS and acrylate [103]. Although this route is more prevalent in marine environments, its contribution in freshwater systems with high salinity or eutrophication should not be overlooked [104]. The metabolic diversity of the microorganisms involved in these processes reflects the complexity of VSC formation mechanisms in different environmental contexts.
The formation of TRS, particularly VSCs, reflects intricate biochemical and microbiological processes that occur in both natural and controlled systems. The interaction between heterotrophic, sulfate-reducing, and methanogenic microorganisms with organic matter and specific environmental conditions leads to a wide diversity of sulfur compounds, each with unique properties and effects. These compounds present significant challenges in wastewater and sediment management while also playing a crucial role in the chemical and biological dynamics of ecosystems with direct implications for air and water quality.

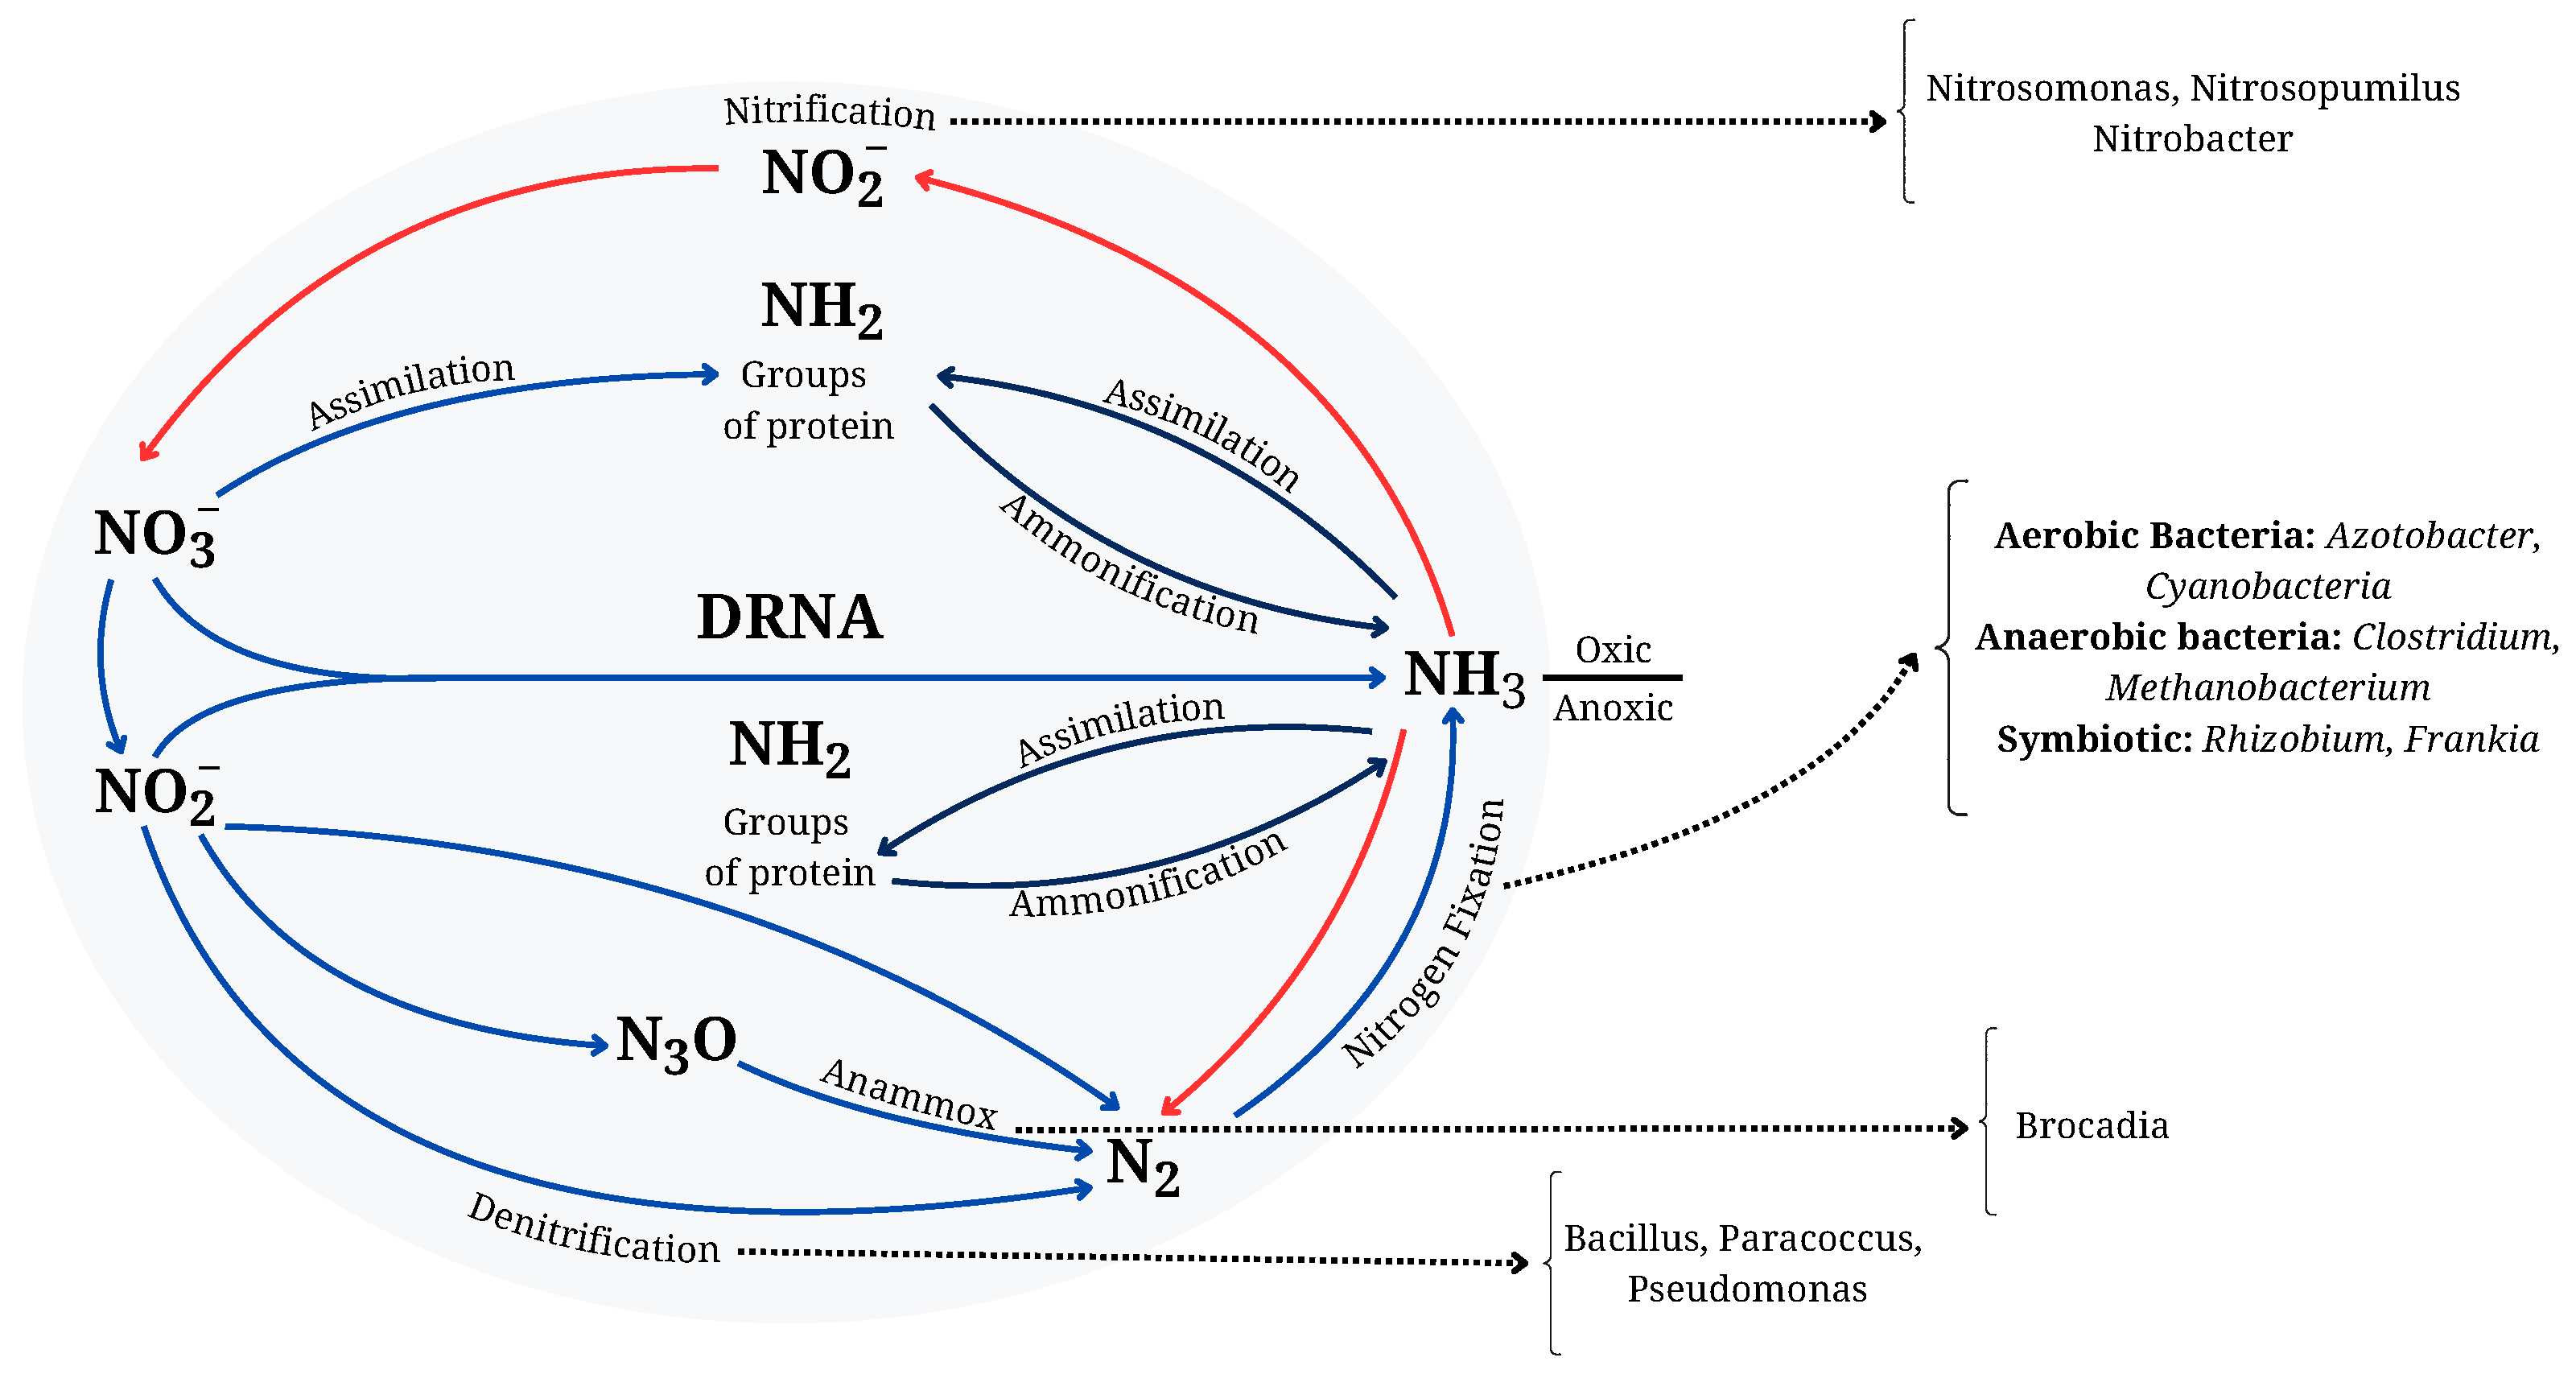
6.3. Biological Nitrogen Cycle and Microbial Processes Leading to NH3 Production

Like the sulfur cycle, the biological nitrogen cycle (Figure 2) plays a vital role in maintaining ecological balance by facilitating the circulation of essential chemical compounds between different environmental compartments. Similarly to the sulfur cycle, which was discussed earlier, the nitrogen cycle is driven by an intricate network of geochemical processes, redox reactions, and microbial pathways [33].
One of the most important processes in the nitrogen cycle is biological nitrogen fixation, a reduction reaction in which molecular nitrogen (N2) from the atmosphere is transformed into NH3, a form of nitrogen accessible to living organisms. The fundamental chemical reaction, catalyzed by the nitrogenase enzyme, is as follows.
N 2 + 8 H + + 8 e + 16 ATP 2 NH 3 + H 2 + 16 ADP + P i
Nitrogenase, a highly conserved enzyme throughout evolution [106], requires considerable energy in the form of ATP and electron transfer to break the triple bond of molecular nitrogen [107]. This process is carried out by a variety of microorganisms, including both bacteria and archaea, in different environments [106,108]. Nitrogen-fixing organisms include aerobes and anaerobes, such as Azotobacter and Clostridium. In addition, there are widespread symbiotic associations between plant species, classified into three main types: cyanobacterial, actinorhizal, and rhizobial [109]. Examples include associations of Rhizobium and Bradyrhizobium with legumes and Frankia with non-legume plants [110]. These microorganisms develop specialized mechanisms, such as heterocysts or anaerobic microenvironments, to protect nitrogenase from oxygen inhibition [111].
Ammonification is the process by which organic nitrogen in compounds such as proteins, nucleic acids, and urea is converted into NH3 or its ionized form, ammonium ( NH 4 + ) [112]. This process is carried out by decomposer microorganisms that degrade organic matter from plants, animals, and animal waste. The general reaction can be represented as follows.
Organic N + microorganism NH 3 / NH 4 +
Bacillus subtilis and Pseudomonas fluorescens have been shown to increase urease activity in soils, enhancing bioaccessible nitrogen and ammonium content in these environments [113]. This process not only recycles nitrogen into forms that microorganisms and plants can assimilate, but also connects organic matter decomposition to other cycle processes such as nitrification and denitrification [114].
Nitrogen assimilation is a critical step in transforming inorganic nitrogen, such as NH 4 + and NO 3 , into essential organic compounds [115]. This process is vital for synthesizing amino acids, proteins, and other nitrogenous compounds required for the growth and function of living organisms [116]. Plants can absorb nitrogen in the form of both NO 3 and NH 4 + , although the metabolic pathways for assimilating these forms differ. NO 3 must first be reduced to nitrite ( NO 2 ) and then to NH 4 + before incorporation into organic molecules [117].
NO 3 + CO 2 sunlight Protein
NH 3 + NH 4 + sunlight Protein
The primary nitrogen incorporation pathway in plants and microorganisms is the glutamine synthetase–glutamate synthase (GS/GOGAT) pathway, a highly conserved mechanism that converts NH 4 + into organic compounds [115]. In this pathway, NH 4 + combines with glutamate to form glutamine, which serves as an amino group donor to synthesize other amino acids [118]. This system efficiently incorporates nitrogen into cellular metabolism and regulates nitrogen homeostasis in response to environmental factors such as nutrient availability and light [119].
Nitrification is the microbial conversion of NH 4 + to NO 2 and then to NO 3 through oxidation reactions [107]. This process creates highly mobile plant-accessible forms of nitrogen, carried out exclusively by chemoautotrophic microorganisms in two main stages [120]. First, bacteria such as Nitrosomonas and Nitrosospira oxidize NH 4 + to NO 2 . In the second stage, microorganisms like Nitrobacter and Nitrospira convert NO 2 to NO 3 , a stable compound in aerobic environments [121]. Recent studies have shown that bacteria Nitrospira can complete nitrification, oxidizing NH3 directly to NO 3 [122]. Nitrification plays a key role in agricultural soils and composting systems [123]. However, it can also cause nitrogen losses due to leaching and gaseous emissions, reducing plant nitrogen availability and contributing to environmental issues such as eutrophication and greenhouse gas production [124].
2 NH 4 + + 3 CO 2 2 NO 2 + 4 H + + 2 H 2 O
2 NO 2 + O 2 2 NO 3
Denitrification is the process by which NO 3 is reduced to gaseous forms of nitrogen, including NO 2 , nitric oxide (NO), nitrous oxide (N2O), and ultimately molecular nitrogen (N2), which is released into the atmosphere [107]. This process is catalyzed by specialized enzymes, including nitrate reductase, nitrite reductase, nitric oxide reductase and nitrous oxide reductase, whose activity is up-regulated under anaerobic conditions [125]. Denitrification occurs primarily in water-saturated soils, sediments, and wastewater treatment systems, where the absence of oxygen favors the use of nitrates as electron acceptors during cellular respiration [126].
This process is dominated by denitrifying microorganisms, including families such as Comamonadaceae and genera such as Diaphorobacter, Acidovorax, and Simplicispira, which are particularly abundant in anaerobic environments [127]. Denitrifiers reduce nitrates and nitrites, closing the nitrogen cycle and playing a vital role in mitigating reactive nitrogen compounds in aquatic and terrestrial environments [128]. However, the release of N2O, a potent greenhouse gas, during intermediate stages can adversely impact global climate if the process does not proceed to completion to N2 [129].
Anaerobic ammonium oxidation (anammox) is a microbial process in which bacteria oxidize NH 4 + using NO 2 as an electron acceptor, producing N2 as the final product [130]. The following reaction represents this process.
NH 4 + + NO 2 N 2 + 2 H 2 O
Anammox bacteria, members of the Planctomycetes phylum, are essential for nitrogen loss in various anoxic environments, including marine sediments, wastewater treatment facilities, and wetlands [130]. The process involves intermediates such as nitric oxide (NO) and hydrazine (N2H4), with c-type heme proteins facilitating catalytic reactions [131]. A distinguishing feature of anammox bacteria is the anammoxosome, a specialized organelle enclosed by ladderane lipids. This organelle contains hydrazine oxidoreductase, an enzyme critical for the conversion of hydrazine to dinitrogen gas [132].
Anammox bacteria contribute significantly to nitrogen loss in oceanic systems, influencing global nitrogen cycles. Their application in engineered systems, particularly in wastewater treatment, has gained attention due to their efficiency in removing NH3 from anaerobic systems [132]. Anammox activity can be established in anaerobic membrane bioreactors using anaerobic digester seed cultures, offering a sustainable and cost-effective strategy for nitrogen removal in engineered systems [133].

7. Factors Affecting Biological Gas Formation

The formation and emission of compounds such as H2S, NH3, and VSCs are determined by a complex interaction of physical, chemical, and biological factors. These compounds not only have significant environmental impacts but also affect industrial processes, public health, and infrastructure quality. Understanding the factors influencing their formation is crucial for designing effective management strategies.
The formation of H2S is significantly influenced by pH, temperature, and SRB activity. In anaerobic digestion of sewage sludge, higher initial pH values inhibit the activity of the relevant bacteria, significantly reducing H2S production [134]. The release of H2S during the drying of the thermal sludge is controlled by temperature, pH, and the active biomass present [135]. For example, higher temperatures, common in summer, accelerate microbial metabolic rates, leading to increased H2S formation [136]. Similarly, prolonged retention times improve the interaction between microbes and substrates, facilitating the complete reduction of sulfates to sulfides [137]. In oceanic anoxic events, the sulfidation of organic matter can reduce H2S concentrations in the water column by enhancing carbon preservation, highlighting the impact of geochemical processes in marine ecosystems [138]. Moreover, in industrial applications such as thiophene pyrolysis, the presence of water facilitates the formation of H2S through hydrogen transfer and saturation of the thiophene ring [139].
The pH and temperature of the medium mainly influence the volatilization of NH3. In acidic or neutral environments, NH 4 + is the predominant form, while in alkaline conditions, gaseous NH3 volatilizes rapidly [107,140]. Ambient temperature, relative humidity, and manure management practices significantly influence NH3 emissions in crop and livestock systems. Studies have shown that NH3 emissions increase during the warmer months in dairy farms due to elevated temperatures [141]. Similarly, in croplands, soil properties, fertilizer placement, and weather conditions have been shown to affect NH3 volatilization rates [142].
In wastewater treatment plants, processes such as NH3 oxidation and accumulation of nitrite influence the emission of nitrous oxide (N2O), a by-product closely linked to NH3 transformations. The concentration of dissolved oxygen and temperature play an important role in denitrification kinetics, affecting the amount of N2O emitted [143].
The formation of VSCs, such as CH3SH and DMDS, is controlled by temperature, pH, and substrate composition. In composting, VSC emission peaks occur during the mesophilic and pre-thermophilic phases, with the temperature being a determining factor [144]. The formation of VSCs is also influenced by the temperature of the wastewater, SO 4 2 concentrations, and COD levels [145]. In treatment plants, VSC emissions tend to be higher in primary clarifiers and during warmer months due to increased temperature and organic loading [109]. In biosolids, the emission pattern of VSCs changes with time, with H2S being the dominant compound throughout storage [146]. Other factors influencing VSC production include the concentration of free nitrogen NH3, which can inhibit key enzymes involved in VSC conversion [147].
Generally, the biological processes that lead to the formation of H2S, NH3, and VSCs share several determining factors, including pH, temperature, substrate composition, and redox conditions. These variables not only modulate the microbial metabolic pathways responsible for producing these compounds but also influence their volatilization and dynamics in different environments. The regulation of chemical speciation and enzymatic activity depends on pH, while temperature controls both the microbial metabolic rates and the physical properties of gases. Furthermore, the availability of compounds such as sulfates, ammonium, and organic matter directly impacts transformation pathways. This integrated approach demonstrates the interconnectivity of environmental and microbial factors, emphasizing the need for a multidimensional analysis to understand the conditions that facilitate or hinder the formation of these compounds.
Incorporating the earlier discussion on how factors such as pH, temperature, substrate composition, and redox conditions influence biological gas formation, it is pertinent to broaden the analysis by considering studies that illustrate the complex interactions between environmental and operational factors. Several investigations have documented that those climatic conditions, including seasonal variations, precipitation, and relative humidity, along with microbial activity, play a pivotal role in the emissions of volatile compounds such as NH3, H2S, and other VOCs. The following text builds on this foundation, providing additional evidence that temperature and other environmental parameters act synergistically to modulate these processes, thereby deepening our understanding of gas formation dynamics in various real-world contexts.
Temperature emerges consistently as a critical factor across diverse environmental contexts. In wastewater treatment systems and composting processes, increased ambient temperatures during warm and dry conditions notably enhance the emissions of VSCs. For example, a study on aerobic composting reported significantly higher total VSC emissions of 561.89 mg/dry kg during summer compared to 358.45 mg/dry kg in spring, and only 215.52 mg/dry kg in winter [148]. Similarly, sequencing batch reactors exhibited elevated emission factors for H2S (361 ± 101 μ g/ton) and methyl mercaptan (82 ± 76 μ g/ton) under higher temperatures [149].
Field studies across multiple climates provide further evidence supporting temperature’s pivotal role. For instance, investigations at municipal waste biogas plants demonstrated significant correlations between concentrations of VOCs and NH3 with temperature and relative humidity [150]. Likewise, at landfill sites, increased H2S and NH3 concentrations were closely associated with higher temperatures, air pressure variations, and wind direction, intensifying odor pollution under warm, humid conditions [151]. Additionally, odorant VOC emissions from apple pomace waste were found to increase by approximately 30% under open-air and oxygen-free storage conditions, further underscoring the sensitivity of biological gas formation to ambient environmental parameters [152].
Seasonal patterns, however, illustrate a moderating influence of cooler and wetter conditions. During rainy seasons, lower temperatures and increased precipitation typically result in reduced overall VSC production. Observations from wastewater treatment plants and natural sediment environments consistently report a reduction in VSC concentrations during wet periods, primarily due to decreased microbial activity rates and modified environmental chemistry [145,148]. Studies conducted in Bogotá further highlighted this seasonal contrast, recording H2S concentrations peaking above 100 ppm during dry seasons, significantly surpassing levels during wetter periods characterized by lower temperatures and higher precipitation [153]. Table 3 presents the key characteristics and emission patterns of volatile sulfur compounds (VSCs) during dry seasons.
The seasonal variability observed in volatile sulfur compound (VSC) concentrations (Table 3) suggests a strong influence of environmental conditions, particularly during the dry season. To further explore this phenomenon, it is essential to examine the underlying mechanisms driving VSC formation. Table 4 presents the primary pathways responsible for generating these compounds, highlighting key contributing factors and their sensitivity to seasonal changes, providing deeper insight into the processes that result in the distinct dry season characteristics previously discussed.
Interaction among multiple factors also significantly influences gas formation. Research indicates that nitrogen fertilizer application rates, soil moisture, and temperature interact synergistically to promote NH3 emissions, particularly in alkaline soils where the fertilizer rate exerts the strongest influence [158]. Elevated temperatures coupled with reduced soil moisture have been shown to amplify NH3 volatilization, particularly pronounced in summer cropping systems [159,160].
Additionally, research in tropical wetland ecosystems emphasizes the complexity of factor interactions affecting VSC generation. In tropical coastal mangrove sediments and peatlands, gas emissions were significantly influenced by chemical parameters such as pH, salinity, redox potential, and organic substrate availability, as well as microbial community composition [88,161]. In peatland ecosystems, substrate additions rich in thiol and methylthiol groups led to enhanced H2S, methanethiol, and dimethyl sulfide emissions. This effect was modulated by microbial communities, particularly sulfur-cycling bacteria like Acidobacteria and Desulfosporosinus [88]. Concurrently, in mangrove sediments, lower salinity, more electronegative redox potentials, and higher organic matter availability during the rainy season significantly favored methane production, demonstrating a clear seasonal dependency linked to environmental chemistry [161].
Moreover, adverse climatic conditions interacting with pollutants have been reported to enhance the bioavailability and bioaccumulation of contaminants, exacerbating oxidative stress and accelerating energy consumption in organisms [162]. Such environmental interactions underline the complexity inherent to biological gas production and emissions, highlighting the need for comprehensive analyses considering the multifactorial and synergistic effects of environmental variables.

8. Linking Water Quality and Malodorous Gas Emissions

8.1. Effects of Contaminants and Dissolved Oxygen on Odor Formation

The formation of malodorous gases in polluted water bodies is intrinsically linked to the availability of dissolved oxygen (DO) and the abundance of organic matter [163]. The presence of contaminants in water bodies usually results in low levels of DO due to the high oxygen demand exerted by organic pollutants and microbial activity [164]. The introduction of organic matter, such as agricultural runoff, untreated wastewater, and decaying vegetation, initiates the degradation process by aerobic microorganisms, which consume oxygen during this process [165]. This phenomenon, known as biochemical oxygen demand (BOD) [166], is one of the main factors in oxygen depletion. As the concentration of DO drops below critical thresholds, anaerobic processes dominate, creating conditions that promote the formation of gases such as H2S, NH3, and VSCs [163].
The accumulation of organic matter in contaminated aquatic environments exacerbates oxygen depletion [165]. In environments with elevated concentrations of nutrients, such as nitrogen and phosphorus, eutrophication occurs as a result of human activities such as fertilizer use and discharge of untreated sewage [167]. A common consequence of eutrophication is the formation of algae blooms, which initially increase oxygen levels through photosynthesis [168]. However, as algae die and decay, microbial decomposition of organic material consumes large amounts of oxygen, often creating hypoxic or anoxic conditions. This leads to the formation of sulfides and dissolved iron, which result in malodorous black water agglomerates [39]. These oxygen-deficient zones promote the proliferation of SRB, such as Desulfobacterota, which metabolize SO 4 2 to H2S [169]. Furthermore, the decomposition of aquatic plants, such as Zizania latifolia, contributes to the production of VSCs, including DMS, which exacerbates the odoriferous conditions [170].
The presence of contaminants in water bodies directly impacts the type and intensity of gas emissions. Pollutants such as nitrogen compounds, sulfates, and organic carbon serve as substrates for microbial activity [171,172], driving the production of malodorous gases. For example, elevated levels of dissolved organic carbon (DOC) in wastewater can enhance H2S production during denitrification processes [173]. The decomposition of organic matter under anaerobic conditions in landfill leachates or swine slurry releases significant amounts of H2S, a major contributor to malodors [174].
Inorganic pollutants, including heavy metals, also influence gas emissions by modifying the dynamics of the microbial community. For example, studies have shown that ferruginous sediments promote higher concentrations of DMS, while sulfidic sediments increase CH3SH production [100]. These geochemical variations illustrate the complexity of malodorous gas formation in contaminated aquatic systems. Furthermore, the presence of fecal matter introduces both organic and microbial pollutants that exacerbate malodor formation. Sanitary inspections and tests H2S have demonstrated a strong correlation between fecal contamination and H2S emissions, highlighting the need for effective management of point sources of pollution [175].
Malodorous emissions are indicative of broader environmental degradation. Eutrophication of waterways caused by unregulated industrial and agricultural discharges contributes significantly to cyanobacterial blooms, which in turn release VSCs, leading to odor crises in drinking water systems [176]. Similarly, chlorination disinfection processes can result in the production of odor-causing substances, such as haloanisoles, in water supplies. This phenomenon complicates the management of water quality [177]. As water quality declines, the combined effects of microbial activity, organic matter accumulation, and pollutant interactions lead to the sustained release of malodorous gases, with notable ecological and public health consequences.

8.2. Real-World Data from Different Contaminated Water Sources: Case Studies from Tianziling Landfill and the Wuxi Crisis

The relationship between water quality and malodorous gas emissions can be further understood through real-world cases, which clearly illustrate the interaction between contamination and odorous emissions. While typically studied in riverine systems, other aquatic environments or waste repositories can exhibit analogous conditions suitable for investigation.
For instance, although not a river system, the Tianziling landfill located north of Hangzhou city, China, represents a relevant case due to its similarity to river systems receiving untreated urban wastewaters. Tianziling was China’s first standardized valley-type sanitary landfill, operational from 1991 to 2007 for its initial site, followed subsequently by a second landfill [151]. It had a designed filling capacity of approximately 2.2 × 10⁷ m3, accepting exclusively municipal solid waste (MSW), excluding medical, industrial, or hazardous wastes. The landfill handled between 2000 and 4000 tons of MSW per day, accounting for over 60% of Hangzhou’s municipal waste production [151]. The malodorous gases emitted from Tianziling landfill primarily resulted from the anaerobic decomposition of MSW, generating numerous volatile organic compounds (VOCs) and inorganic gases. Despite comprising less than 1% of total gaseous emissions, these odorants exhibited disproportionately adverse impacts due to their unique physicochemical characteristics. Notably, hydrogen sulfide (H2S) concentrations ranged from 56.58 to 579.84 μ g/m3, and ammonia (NH3) concentrations varied between 520 and 4460 μ g/m3. These two compounds significantly contributed to total odorant concentrations, with NH3 accounting for approximately 83.91–93.94%, and H2S representing 4.47–10.92% [151].
Similarly, the drinking water crisis in Wuxi, China, in 2007 exemplifies the direct impact of water quality deterioration on malodorous emissions in aquatic systems. During this crisis, nearly two million residents were affected by tap water exhibiting unpleasant odors and discoloration. The odor originated from Lake Taihu, caused predominantly by volatile organic sulfur compounds (VOSCs), including methyl thiols (MeSH), dimethyl sulfide (DMS), dimethyl disulfide (DMDS), and dimethyl trisulfide (DMTS) [178]. These VOSCs were generated through microbial decomposition following a massive cyanobacterial bloom triggered by illegal industrial discharge and inadequately regulated domestic pollution, driving the lake ecosystem towards a critical state [178]. Chemical analysis revealed thiols and thioethers as the primary odor contributors, with an initial dominance of MeSH and DMS, subsequently oxidized to DMDS and DMTS as dissolved oxygen levels increased. Although other potentially odorous compounds such as β -cyclocitral, geosmin, and 2-methylisoborneol (2-MIB) were detected, their limited concentrations or higher odor thresholds indicated minor roles in odor generation during this specific crisis [178]. An odoriferous “black water agglomeration” formed at the water intake point, presumably from large-scale releases of VOSCs resulting from decomposed cyanobacteria and lake sediments. Emergency treatment measures including potassium permanganate oxidation and powdered activated carbon adsorption were effectively implemented to mitigate odor issues in tap water [178].
Both cases emphasize the critical linkage between deteriorating water quality conditions and significant malodorous emissions, underlining the necessity of integrated management strategies to control and mitigate such environmental challenges.

8.3. Case Study: The Bogotá River

The Bogotá River starkly illustrates the environmental consequences of unregulated urbanization, industrial growth, and agricultural intensification. Spanning 380 km from its source in the Páramo de Guacheneque to its confluence with the Magdalena River, this vital waterway is among the most contaminated in Colombia [179]. The upper and middle basins of the Bogotá River, which traverse highly urbanized and industrialized areas, are subject to severe pollution caused by the discharge of untreated domestic and industrial wastewater, the discharge of agrochemicals, and the disposal of solid waste [180,181].
These activities have led to a significant reduction in DO levels and an increase in organic matter content, creating conditions conducive to the formation of malodorous gases and other indicators of poor water quality. The main sources of organic and chemical pollutants in the Bogotá River are domestic and industrial discharges. The wastewater treatment infrastructure in Bogotá and the surrounding municipalities is inadequate to handle the volume of effluents generated, resulting in the direct release of untreated waste into the river [179]. This has led to levels of microbial contamination that are considered unacceptable. In particular, the concentration of total coliforms and Escherichia coli has been observed to exceed the permissible limits, especially in the middle basin [181]. Industrial discharges introduce additional contaminants, including heavy metals, perfluoroalkyl and polyfluoroalkyl substances (PFAS), and complex organic compounds. PFAS concentrations are highest in areas with intense industrial activity, such as near major factories and population centers [182]. These substances persist in the environment and pose long-term risks to human and ecological health [183]. Furthermore, river sediment samples reveal a significant accumulation of pollutants, acting as reservoirs that perpetuate contamination and release odorous compounds into the water column over time [180].
The organic matter content of the river is further exacerbated by agricultural runoff, particularly in the upper basin, where the excessive use of agrochemicals contributes to the load of nutrients [184]. This enrichment of nutrients triggers eutrophication, leading to algal blooms that consume oxygen during decomposition, compounding the problem of oxygen depletion of the river [185]. These processes create a feedback loop, as the decaying biomass becomes an additional source of organic material and gases such as NH3 and H2S further degrade the quality of the water. One of the most critical issues facing the Bogotá River is the consistently low dissolved oxygen levels. Studies from 2008 to 2017 have classified water quality as regular to poor in the upper basin, with only five monitoring stations reporting acceptable conditions during this period [180]. The primary driver of oxygen depletion is the high BOD exerted by organic pollutants. Large volumes of untreated domestic and industrial effluents contribute substantial organic matter, which microorganisms metabolize, consuming oxygen in the process [186]. This imbalance leads to hypoxic or anoxic conditions, which are incompatible with healthy aquatic ecosystems [181].
In the middle basin, where the river receives most of its pollutant load, dissolved oxygen levels are critically low. Discharges can reduce oxygen concentrations by 20 μ mol/L in rivers [187]. High levels of organic carbon, nutrients, and other contaminants from domestic wastewater further exacerbate oxygen depletion [188]. These conditions not only limit the river’s ability to support aquatic life, but also promote anaerobic microbial processes. SRB thrive in such conditions, metabolizing sulfates and organic matter to produce H2S and VSC, responsible for the notorious malodors of the river [189].
The issue of unpleasant odors resulting from contamination in the Bogotá River clearly highlights the urgent need for comprehensive solutions aimed at improving water quality in this aquatic system. Effective water quality improvement must begin at the sources of contamination, making it essential to control polluted water discharges originating from both rural and urban areas through which the river flows. Several strategies have been proposed for this purpose, including optimizing and redesigning the water quality monitoring network to enhance sampling efficiency and reduce operational costs [190]. Additionally, the implementation of cleaner production practices along with the economy principles has been emphasized to minimize waste generation and reduce environmental impacts from industrial and urban activities [191].
Another significant solution involves utilizing water hyacinth (Eichhornia crassipes) as a natural method for organic matter degradation, nutrient absorption, and heavy metal removal in affected water bodies, such as the Muña Reservoir [192]. Furthermore, urban water management strategies, including stormwater harvesting, industrial wastewater reuse, and adoption of water-saving technologies in residential areas, have been evaluated. Simulations of these strategies indicate potential significant reductions in drinking water consumption and wastewater generation, particularly in the urban catchments of the Fucha and Tunjuelo rivers [193].
These integrated initiatives aim to mitigate the negative impacts caused by rapid urban growth, reduce the formation of odor-causing compounds, and substantially contribute to the restoration and preservation of the environmental quality of the Bogotá River and its tributaries.

9. Detection Technologies for Odorous Gases

9.1. Traditional Analytical Techniques

Various measurement protocols have been developed for the effective analysis of odor compounds. Among these, gas chromatography coupled with sulfur chemiluminescence detection (GC-SCD) is widely used. This approach, which incorporates N2O as an internal standard, has shown low detection limits and high reproducibility, making it particularly effective for the detection of compounds such as CH3SH, DMS, and DMDS [194]. The combination of thermal desorption with GC-SCD allows the analysis of a wider range of VSCs present in sewer headspace air, including H2S and ethanethiol [64]. In ambient measurements, cryotrapping-enhanced GC-SCD proves effective in detecting TRS at concentrations as low as 120 ppt in 100 mL of air, though its sensitivity diminishes for H2S and CH3SH below 2 ppb [195]. Similarly, olfactory detection mass spectrometry has been instrumental in identifying VSCs of biosolid emissions, shedding light on shifting emission patterns as biosolids age [146]. In addition to these techniques, thermal desorption followed by gas chromatography–mass spectrometry (GC-MS) has been used to assess VSCs in air samples collected from sewage management areas. In these samples, DMS, carbon disulfide and DMDS were identified as the predominant compounds [157].
For air odor measurement, these methods integrate sensory and chemical approaches, each contributing strengths to compound characterization. Among chemical methods, thermal desorption combined with gas chromatography and sulfur chemiluminescence detection (TD-GC-SCD) can measure multiple VSCs, such as H2S and CH3SH, in air in the sewer headspace with detection limits ranging from 0.10 to 5.26 μ g/m3 [64]. The combination of TD-GC-MS with simultaneous olfactory evaluation has proven effective in the identification and quantification of odorous compounds from various sources. This method detects trace amounts of compounds at concentrations up to 40 times higher than those typically found in air [196]. A novel quantification approach using TD-GC-MS has shown remarkable detection limits for numerous key odorants [197]. Air dispersion models provide valuable tools to assess spatial and temporal odorant distribution and to assess potential mitigation strategies [198].
Furthermore, UPLC-MS methods for the analysis of NH3 have achieved submicromolar detection limits [199], and satellite measurements of NH3 have been used to estimate H2S exposure from animal husbandry operations by integrating remote sensing with in situ data [200]. Spectroscopic techniques, such as hyperspectral infrared imaging, have revealed underestimated industrial sources and demonstrated the potential of future satellite sounders to improve monitoring accuracy [201]. UV-visible chemiluminescence spectroscopy has been effective in examining ammonia–hydrogen–air flames, facilitating nonintrusive assessments of equivalence ratios and fuel fractions [202]. In agricultural applications, open-path tunable diode laser absorption spectroscopy has enabled high temporal resolution NH3 measurements, elucidating meteorological influences and nitrogen application rates [203].
To clearly illustrate the differences among these analytical methodologies regarding cost, sensitivity, and practicality, a comparative summary table is presented (Table 5).

9.2. Advanced Optical and Spectroscopic Methods

For simultaneous detection of H2S and SO2, a portable mid-infrared sensor that employs substrate-integrated hollow waveguides and UV conversion has demonstrated detection limits as low as 207 ppbv for H2S [208]. Cavity-enhanced near-infrared laser absorption spectroscopy is another option that offers rapid and precise measurements of H2S in fuel reforming streams with minimal cross-interference [209]. Further advances in mid-infrared sensors using substrate-integrated hollow waveguides have improved the applicability of ppb-level detection of both H2S and SO2 [208].
Quartz-enhanced photoacoustic spectroscopy (QEPAS) in conjunction with external cavity quantum cascade lasers and hollow-core waveguides has demonstrated detection limits of 450 ppb for H2S in just three seconds [210]. Recent innovations in QEPAS, such as dual resonance photoacoustic spectroscopy and blocking of laser cavity molecules, have reduced the detection limits of H2S to 10 ppb [211].
Cavity ring-down spectroscopy (CRDS) has demonstrated excellent sensitivity with minimal interference from humidity or volatile organic compounds [212]. CRDS and other laser-based techniques are ideal for real-time, continuous monitoring of odorants in various environmental settings, offering an avenue to achieve more effective and rapid odor control.
Table 6 presents a comparative summary of these advanced optical and spectroscopic detection technologies, clearly illustrating their relative cost, sensitivity, and practical considerations.

9.3. Electrochemical Sensors and Colorimetric Methods

Advances in electrochemical sensors for sulfur compounds have yielded promising results, offering improved sensitivity and faster detection capabilities. Electrochromic compounds, such as 4,4′,4′,4′-tetrakis(dimethylamino)-tetraphenylethylene, can detect both NO2 and SO2 in the gas phase, with the detection of SO2 enhanced by the presence of t-butylhydroperoxide [213]. For H2S, triple-pulse amperometry enables direct electrochemical sensing without sulfur poisoning, achieving high sensitivity and rapid response times [214]. Electrochemical Impedance Spectroscopy (EIS) has emerged as a highly sensitive technique for detecting toxic gases, including H2S, using semiconducting metal oxides [215]. Thin-layer amperometric sensors with microelectrodes have been developed, providing membrane-independent responses and improving the practicality of Clark-type sensors for monitoring H2S [216].
Similarly, flame photometric detectors (FPDs) have significantly improved the detection of VSCs by reducing detection limits and enhancing performance. A multiple flame FPD (mFPD) demonstrated resilience to hydrocarbon quenching and achieved detection limits as low as 4 × 10 11 g S/s [217]. A quartz rod-enhanced FPD (qFPD) set a new benchmark with detection limits of 0.3–0.5 pg S/s, outperforming conventional detectors by a factor of 5–7 [218]. Microcountercurrent FPD (microcc-FPD) enabled ultrafast gas chromatographic separations with superior performance in detecting narrow peaks, achieving detection limits of 3 ng S/s for organosulfur compounds [219]. Pulsed FPD (PFPD) further advanced these developments with detection limits between 2.37 and 4.89 pg for various reduced sulfur compounds, maintaining consistent performance at concentrations above ~ 20 nmol mol 1 [220].
For NH3 analysis, ref. [199] introduced a UPLC-MS method utilizing dansyl chloride derivatization, achieving submicromolar detection limits. Ref. [200] employed satellite NH3 measurements to estimate H2S exposure from animal husbandry operations, integrating remote sensing with in situ data. Spectroscopic techniques have also been crucial in addressing NH3 emissions, such as hyperspectral infrared imaging to detect industrial sources [201] and ultraviolet-visible chemiluminescence spectroscopy to examine ammonia–hydrogen–air flames [202]. In agricultural applications, open-path tunable diode laser absorption spectroscopy has enabled high temporal resolution measurements of NH3 [203].
Colorimetric and smartphone-assisted detection techniques have emerged as promising alternatives to low-cost, portable monitoring of NH3 and H2S. Ref. [221] developed a 3D-printed platform with paper sensors for simultaneous detection of NH3 and sulfide in wastewater. Ref. [222] introduced QRsens, a dual-purpose QR code with built-in colorimetric sensors for in situ air analysis. Nanocatalysts have enabled ultrasensitive colorimetric detection of dissolved H2S, with detection limits of 7.5 nM [223]. Smartphone-based methods have also been refined; for example, ref. [224] used silver nanoparticles to detect NH3 with a detection limit of 200 mg/L.
Table 7 summarizes these electrochemical, colorimetric, and other emerging detection technologies clearly, comparing their cost, sensitivity, and practicality explicitly.

9.4. Emerging Technologies

Recent advances in emerging technologies have significantly enhanced the detection capabilities for hazardous gases such as NH3, H2S, and volatile sulfur compounds (VSCs), highlighting the potential of artificial intelligence (AI)-based methods to improve accuracy, sensitivity, and efficiency in environmental monitoring.
In agricultural contexts, cavity ring-down spectroscopy (CRDS) has demonstrated excellent sensitivity for precise NH3 detection [193]. Additionally, wind tunnels calibrated to ambient wind speeds provide reliable ammonia emission data [194]. Cost-effective methods such as passive flux samplers combined with dispersion models show promise in multiplot experimental setups [195]. However, an intercomparison involving 13 instruments highlighted the urgent need for standardized protocols regarding inlet design, calibration, and maintenance to ensure reliable data in routine monitoring [146].
The integration of smart sensors and Internet of Things (IoT) technologies has substantially advanced the detection of harmful gases such as H2S. Chemiresistive sensors based on metal oxide semiconductors, particularly those utilizing nanostructures like nanofibers, exhibit high surface area and excellent electrical conductivity, facilitating effective H2S detection [225]. Novel fabrication methods, such as Pd-functionalized CuCrO2 thin films, have achieved detection capabilities for H2S concentrations as low as 0.5 ppm [226]. The integration of these sensors with IoT technologies enables real-time monitoring and wireless data transmission, significantly improving safety in industrial and environmental applications [227]. Overall, these emerging technologies carefully consider critical factors such as sensitivity, selectivity, and response time to ensure effective H2S monitoring in petroleum refineries, sewage treatment plants, and fuel cell systems [228].
Additionally, electronic noses (E-noses)—artificial olfaction systems consisting of gas sensor arrays, sample handling, and signal processing components—have gained considerable attention [229]. When combined with artificial intelligence algorithms, E-noses efficiently detect and discriminate various gases, significantly contributing to improved environmental monitoring, industrial safety, and medical diagnostics [230]. Recently, ultra-low-power E-noses based on three-dimensional tin oxide nanotube arrays have been developed, achieving high sensitivity at room temperature and substantially reducing power consumption compared to conventional devices [231]. In agriculture, electronic noses demonstrate potential for detecting low ammonia concentrations typically emitted during farming activities, providing real-time monitoring and enhanced sensitivity compared to traditional methods [232].
Finally, colorimetric techniques combined with AI-based analysis have emerged as promising methods for detecting gases such as H2S, NH3, and VSCs. Ref. [233] developed a dual-sensing system assisted by deep learning for rapid H2S detection, covering a wide concentration range from 0.1 to 100 ppm. Ref. [221] implemented a smartphone-assisted method using paper sensors and a 3D-printed platform, enabling simultaneous monitoring of ammonia and sulfide in wastewater. Additionally, ref. [234] proposed a nylon-supported plasmonic assay utilizing silver nanoparticles, capable of detecting VSCs in breath samples with a detection limit of 45 ppbv for H2S. Furthermore, ref. [235] developed paper-based colorimetric sensors for H2S measurement in water and air samples, achieving detection limits as low as 1.11–1.12 mL/m3 in air and 0.5 mg/L in water. These studies clearly highlight the potential of AI-assisted colorimetric techniques to substantially improve the rapid, sensitive, and efficient detection of critical environmental gases such as H2S, NH3, and VSCs.

10. Advantages and Limitations of Different Measurement Methods

This section presents a comprehensive comparative analysis of the methodologies discussed earlier, with a particular focus on their respective strengths and limitations. Table 8 provides an overview of the techniques discussed, categorizing them according to their specific applications, operational advantages, and constraints. This facilitates a clear understanding of their suitability for various contexts.
The comparative analysis presented in Table 8 demonstrates the wide range of methodologies available to measure H2S, VSCs, and NH3. Although some methods demonstrate superior sensitivity and precision, others are distinguished by portability, cost effectiveness, or suitability for specific field conditions. The selection of the appropriate methodology is contingent on several factors, including the target compound, the environmental context, and analytical requirements. This comparison highlights the need for ongoing advances in measurement techniques to address emerging challenges in accuracy, cost effectiveness, and environmental adaptability.
Finally, it is essential to highlight that cost, required expertise, and environmental variability often pose significant barriers to implementing these measurement techniques in real-world scenarios. For instance, high-precision methods like GC-MS or CRDS, while offering excellent sensitivity, require expensive instrumentation and specialized training to operate and interpret data. Continuous monitoring systems such as TDLAS or QEPAS also demand frequent calibration and robust infrastructure, which can be challenging in remote areas or when budgets are tight.
In contrast, lower-cost approaches (e.g., electrochemical sensors, colorimetric kits) are more accessible and portable but may suffer from weaker selectivity or signal drift, especially under fluctuating temperature and humidity. Moreover, in industrial or field conditions, the presence of multiple interfering pollutants can compromise accuracy for even the most advanced systems. Ultimately, selecting the right method depends on balancing performance goals (like ultra-low detection limits) with practical feasibility (budget constraints, ease of use, and availability of trained personnel).

11. Mitigation and Control Strategies

11.1. Removal Challenges

The removal of gaseous compounds such as H2S and NH3 presents significant challenges due to their chemical properties and environmental and health implications. Although both are common in industrial gas streams and can cause serious pollution problems, difficulties in their removal vary based on their toxicity and the availability of treatment technologies.
H2S is highly toxic, making its control and removal a top priority [255]. Its presence in industries such as oil and gas requires highly specialized methods to reduce concentrations to safe levels [256]. These methods, ranging from physical and chemical processes to biological treatments, have been significantly developed to address the hazardous nature of H2S [19]. The industry has made considerable progress in its removal, prioritizing efficient solutions such as converting gas into less harmful compounds or capturing it using liquid and solid absorbents, while optimizing separation technologies [19].
In contrast, although less toxic, NH3 presents significant challenges on its own [19]. The removal of NH3 can often be more complex and costly than H2S due to its high solubility in water and the potential for the formation of unwanted by-products during treatment [257]. In addition, the removal processes of NH3 often require more careful control to avoid issues such as ammonium salt formation or other contaminants [258]. Although its presence is typically managed through biological or adsorption processes, the need for more specialized treatment technologies can make the removal of NH3 more expensive and complicated, particularly in agricultural and wastewater contexts [259].
Therefore, while both gases present challenges to removal, NH3 often requires more complex and costly treatment methods compared to H2S, which benefits from the more widely established and developed technologies described in the next section.

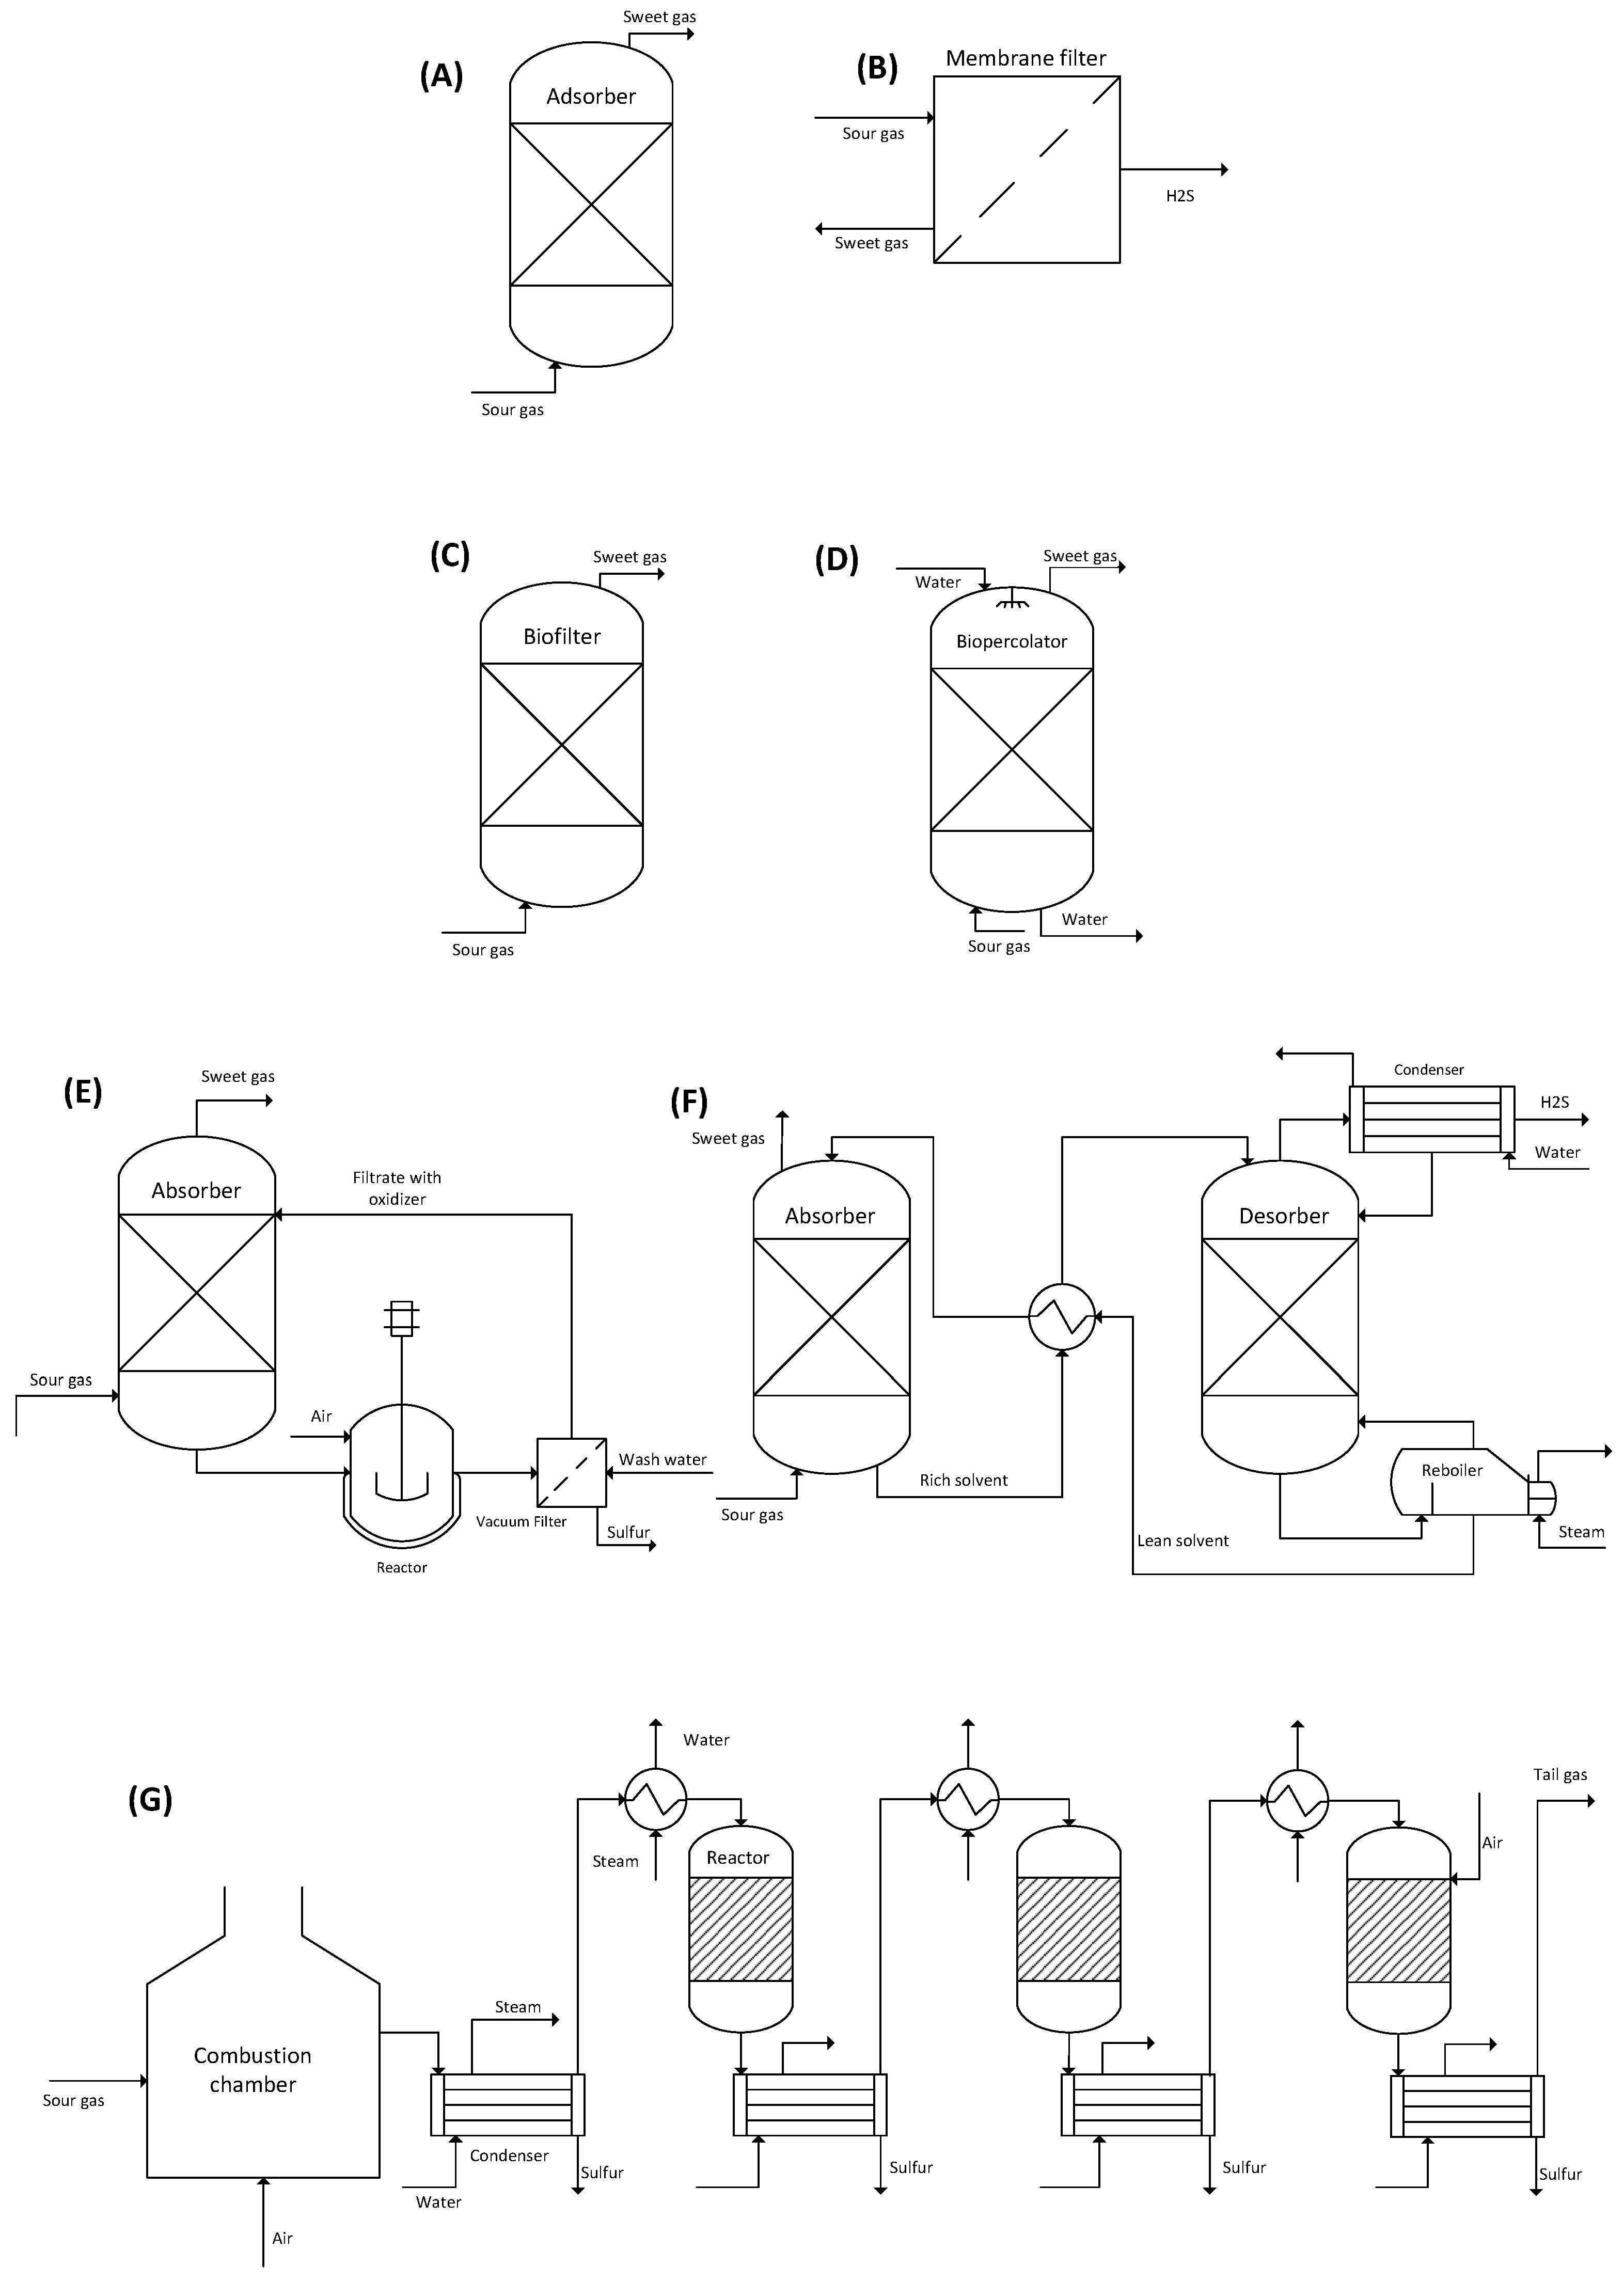
11.2. Methods for H2S Removal

The removal methods for H2S can be classified according to the phenomenon they rely on: absorption, adsorption, membrane separation, and chemical conversion.

11.2.1. Absorption

Absorption is one of the most established and widely used mechanisms for the removal of H2S in the oil and natural gas industry, using a liquid solvent as the capture medium [256]. Absorption is divided into two main categories: physical and chemical [260]. Physical absorption is based on the solubility of H2S in the solvent, utilizing weak intermolecular interactions, which facilitates the subsequent release of the absorbed gas when conditions change [261]. A typical example of a physical solvent is sulfolane, which is used for its high capacity to dissolve acid gases such as H2S without chemically reacting with them [262]. In contrast, chemical absorption involves the formation of strong chemical bonds between H2S and the solvent, resulting in more efficient removal, although it requires more energy to regenerate the solvent [263]. The chemical solvents most commonly used for H2S absorption are alkanolamines, such as monoethanolamine (MEA), diethanolamine (DEA), and methyl diethanolamine (MDEA), due to their effectiveness and widespread use in the oil and natural gas industry [264].

11.2.2. Adsorption

Adsorption is the process by which fluid molecules adhere to a solid surface [19]. Similarly to absorption, this mechanism is divided into two types: physical adsorption and chemical adsorption [260]. Physical adsorption is based on weak intermolecular interactions, such as van der Waals forces, between the fluid molecules and the adsorbent surface [265]. A common example is activated carbon, valued for its wide availability, low production cost, and ecological origin [266]. On the other hand, chemical adsorption involves chemical bonds [260]. In some cases, the adsorbent, such as activated carbon, can be impregnated with basic compounds such as sodium hydroxide or potassium hydroxide to promote chemical reactions with H2S, converting the gas into stable compounds such as sulfides, thus improving the capture capacity of the adsorbent [267].

11.2.3. Membrane Separation

Membrane separation is well-established in various industrial processes [19]. Due to its reduced carbon footprint, high modularity, low weight, and ease of operation compared to absorption and adsorption, this technology is widely used in remote areas and offshore operations [268]. Membrane separation involves the use of a porous membrane through which selective gas transport occurs based on differences in the solubility and diffusion of different components through the membrane [260]. Polymeric membranes, such as polysulfone and polyamide, are the most commonly used materials due to their ease of fabrication, flexibility, and high effectiveness in separating gases such as carbon dioxide, oxygen, and H2S [269].

11.2.4. Chemical Conversion

Chemical conversion is the process of transforming H2S into other less dangerous compounds or, in some cases, useful compounds [260]. One of the most widely used conversion routes is the Claus Process, implemented in the natural gas industry and oil refineries [270]. The Claus Process converts H2S into elemental sulfur through the partial combustion of H2S in the presence of oxygen, followed by the catalytic reaction of the resulting gas mixture [271]. This sequence of reactions allows sulfur recovery with an efficiency exceeding 95% [272].
Another conversion route is liquid-phase catalytic oxidation, where H2S is oxidized in the liquid phase, typically in the presence of a catalyst and an oxidizing agent, transforming it into sulfuric acid [260]. This method offers advantages such as high selectivity and conversion efficiency, being especially effective in applications where removal of H2S is required in liquid streams, such as in industrial wastewater treatment or gas streams with high water vapor content [273]. The ability to handle large volumes of contaminated liquid makes this process particularly useful in sectors where H2S streams are dissolved or mixed with other liquid components [274].
For processes that require an easily applicable method under standard conditions for the treatment of residual gases, packed-bed bioreactors, known as biofilters and biopercolators, are used for H2S oxidation [275]. In these systems, a consortium of microorganisms oxidizes H2S, converting it to elemental sulfur under anaerobic conditions or sulfuric acid under aerobic conditions [276]. Biofilters and biopercolators are highly effective and provide high conversion of H2S due to the efficiency of microorganisms in the oxidation process [277].

Biofilter

Biofilters are widely used in industry for the treatment of residual gases due to their ability to efficiently remove volatile organic compounds and other gaseous pollutants [278]. These systems operate through a bed of organic material, such as compost or peat, which provides an environment suitable for the growth of microorganisms capable of using pollutants as an energy source, transforming them into other compounds that are easier to manage [276]. In industrial applications, biofilters are used to treat emissions from processes such as chemical manufacturing, food processing, and the paper industry [279]. Their use is valued for their ability to reduce odor levels and toxic gases, as well as for their lower operational cost compared to other gas treatment technologies [275].

Biopercolators

Biopercolators, or percolating biofilters, are a variant of the biofilter that operates as a three-phase bioreactor: solid, liquid, and gas [280]. This system not only filters and oxidizes gases such as H2S but also allows the circulation and recirculation of water through the packed bed, improving the hydration of the biofilm and facilitating the removal of oxidation products such as elemental sulfur or sulfuric acid [281]. Biopercolators are designed to operate under controlled conditions that optimize the efficiency of the biological process and are used in industrial applications where H2S generation is constant and requires a more robust and efficient solution, such as wastewater treatment [275].

Comparison in Diverse Settings

In urban settings, high population density and low odor tolerance often favor end-of-pipe solutions (e.g., covers, scrubbers, or biofilters) that capture and treat gases before release [282]. Rural areas, especially where agricultural practices dominate, may rely on preventive measures—such as improved waste handling and controlled manure application—since full-scale industrial systems are not always economically feasible [283]. Industrial sites typically adopt advanced, technology-driven mitigation (e.g., catalytic oxidation, integrated chemical/biological treatments) to meet strict emissions targets, while natural or semi-natural environments lean toward ecological restoration (e.g., re-oxygenation, nutrient input reduction) [284]. In all cases, policy frameworks usually regulate the maximum allowable emissions rather than mandating a specific treatment method; thus, each facility can choose the most cost-effective or context-appropriate technology to comply with emission limits.
Table 9 summarizes the most commonly used processes for the removal of H2S, and Figure 3 summarizes the diagrams of these processes.

12. Conclusions

The multifaceted nature of the generation and emission of malodorous gases from aquatic environments, driven by microbial metabolism, nutrient imbalances, and anthropogenic stressors, demands a holistic approach to the system level for effective management. This review has synthesized the current understanding across the following key domains: fundamental microbial and biochemical mechanisms underlying H2S, NH3, and VSC formation; the influence of environmental parameters such as dissolved oxygen, organic load, and contaminant gradients; and the diverse range of advanced detection and mitigation techniques now available.
The interplay between regulatory oversight, scientific innovation, and community participation emerges as a crucial factor in mitigating these challenges. International standards, together with regionally adapted frameworks (exemplified by Colombian regulations), provide critical guidance for monitoring, compliance, and enforcement. However, significant improvements in odor control will require not only adherence to these standards but also adaptive management strategies that integrate continuous environmental sensing, predictive modeling, and targeted interventions.
On the detection front, while sophisticated laboratory instruments (e.g., GC-MS, GC-SCD, CRDS, QEPAS) have set new benchmarks for sensitivity and speciation, practical field applications increasingly favor portable, cost-effective, and real-time systems. Advances in electrochemical sensors, smartphone-based colorimetry, and optical spectroscopy pave the way for decentralized monitoring, enabling rapid response and adaptive odor management strategies.
Mitigation and control methods, ranging from classical physicochemical absorption and adsorption technologies to biologically driven treatments (biofilters, percolator biofilters) and chemical conversion processes, underscore the importance of context-specific solutions. Each strategy offers unique advantages and limitations that influence the selection criteria considering operational complexity, lifecycle costs, environmental impact, and scalability. Emerging hybrid technologies and integrated bioreactor designs promise to improve reliability, sustainability, and energy efficiency.
The case of the Bogotá River exemplifies the persistence and complexity of malodor problems in urbanized watersheds, where cumulative stresses from untreated wastewater, agricultural runoff, and industrial effluents converge. To restore water quality and alleviate the community’s discomfort associated with odors, interventions must address root causes, such as infrastructure deficits, nutrient management, and stakeholder awareness, rather than relying solely on end-of-pipe treatments.
Moving forward, interdisciplinary research must bridge microbial ecology, environmental engineering, analytical chemistry, and policy studies. Innovations in biomolecular techniques, sensor miniaturization, and computational modeling will deepen our mechanistic understanding and improve our predictive capabilities. In parallel, the building of capacity among environmental regulators and stakeholders, combined with transparent data sharing and inclusive decision-making, can accelerate the transition to ecologically resilient, odor-free aquatic systems.
Ultimately, tackling malodorous gases requires a convergence of technological ingenuity, sound governance, and community involvement. By strengthening these links, we can forge more effective strategies to preserve environmental integrity, safeguard public health, and ensure the sustainable use of precious aquatic resources for future generations.

Author Contributions

Conceptualization, G.M.-P., J.R.A.M., M.L.C., J.P.R., V.H., H.L., J.D.A., M.F.V.-T., J.M.G., J.C.C. and L.H.R.; investigation, G.M.-P., J.R.A.M. and M.L.C.; writing—original draft preparation, G.M.-P., J.R.A.M. and M.L.C.; writing—review and editing, M.F.V.-T., J.M.G., J.C.C. and L.H.R.; supervision, J.P.R., V.H., H.L. and J.D.A.; project administration, L.H.R. All authors have read and agreed to the published version of the manuscript.

Funding

The authors declare that this study received funding from Enel, Colombia.

Data Availability Statement

No new data were created or analyzed in this study.

Acknowledgments

The authors would like to thank the Vice Presidency of Research & Creation’s Publication Fund at Universidad de los Andes for its financial support.

Conflicts of Interest

Martha L. Castellanos, Juan P. Romero, Victor Hincapié, Héctor Lizcano, and Juan D. Acero are employed by Enel, Colombia. The funder was involved in the writing, data collection, supervision, and conceptualization of this review paper. The remaining authors declare that the research was conducted in the absence of any commercial or financial relationships that could be construed as a potential conflict of interest.

References

  1. Jones, E.R.; van Vliet, M.T.; Qadir, M.; Bierkens, M.F. Spatially-explicit estimates of global wastewater production, collection, treatment and re-use. Earth Syst. Sci. Data Discuss. 2020, 13, 237–254. [Google Scholar] [CrossRef]
  2. Sandoval, M.A.; Calzadilla, W.; Vidal, J.; Brillas, E.; Salazar-González, R. Contaminants of emerging concern: Occurrence, analytical techniques, and removal with electrochemical advanced oxidation processes with special emphasis in Latin America. Environ. Pollut. 2024, 345, 123397. [Google Scholar] [PubMed]
  3. Henao-Herreño, L.X.; López-Tamayo, A.M.; Ramos-Bonilla, J.P.; Haas, C.N.; Husserl, J. Risk of illness with Salmonella due to consumption of raw unwashed vegetables irrigated with water from the Bogotá River. Risk Anal. 2017, 37, 733–743. [Google Scholar]
  4. Zhang, L.; Qiu, Y.Y.; Sharma, K.R.; Shi, T.; Song, Y.; Sun, J.; Liang, Z.; Yuan, Z.; Jiang, F. Hydrogen sulfide control in sewer systems: A critical review of recent progress. Water Res. 2023, 240, 120046. [Google Scholar]
  5. Sheikh, M.; Harami, H.R.; Rezakazemi, M.; Valderrama, C.; Cortina, J.L.; Aminabhavi, T.M. Efficient NH3-N recovery from municipal wastewaters via membrane hybrid systems: Nutrient-Energy-Water (NEW) nexus in circular economy. Chem. Eng. J. 2023, 465, 142876. [Google Scholar] [CrossRef]
  6. Namour, P. The biogeochemical origin of sewage gases and control of their generation. J. Hazard. Mater. Adv. 2022, 7, 100124. [Google Scholar]
  7. Lee, J.; Lee, S.; Park, Y.K. Reduction of odor-causing compounds in wastewater using biochar: A review. Bioresour. Technol. 2023, 385, 129419. [Google Scholar] [CrossRef]
  8. Watson, S.B.; Jüttner, F. Malodorous volatile organic sulfur compounds: Sources, sinks and significance in inland waters. Crit. Rev. Microbiol. 2017, 43, 210–237. [Google Scholar]
  9. Morral, E.; Gabriel, D.; Dorado, A.D.; Gamisans, X. A Review of Biotechnologies for the Abatement of Ammonia Emissions. Chemosphere 2021, 273, 128606. [Google Scholar] [CrossRef]
  10. Tran, H.T.; Binh, Q.A.; Van Tung, T.; Pham, D.T.; Hoang, H.G.; Hai Nguyen, N.S.; Xie, S.; Zhang, T.; Mukherjee, S.; Bolan, N.S. A Critical Review on Characterization, Human Health Risk Assessment and Mitigation of Malodorous Gaseous Emission during the Composting Process. Environ. Pollut. 2024, 351, 124115. [Google Scholar]
  11. Moreno, A.I.; Arnáiz, N.; Font, R.; Carratalá, A. Chemical Characterization of Emissions from a Municipal Solid Waste Treatment Plant. Waste Manag. 2014, 34, 2393–2399. [Google Scholar] [CrossRef] [PubMed]
  12. Saral, A.; Demir, S.; Yıldız, Ş. Assessment of Odorous VOCs Released from a Main MSW Landfill Site in Istanbul-Turkey via a Modelling Approach. J. Hazard. Mater. 2009, 168, 338–345. [Google Scholar] [CrossRef] [PubMed]
  13. Peng, S.; Li, W.h.; Deng, Y.; Li, W.; Ma, X.; Chen, Y. Removal of Low Concentration CH3SH with Regenerable Cu-doped Mesoporous Silica. J. Colloid Interface Sci. 2018, 513, 903–910. [Google Scholar] [CrossRef]
  14. National Research Council; Division on Earth and Life Studies; Board on Environmental Studies and Toxicology; Committee on Toxicology; Committee on Acute Exposure Guideline Levels. Acute Exposure Guideline Levels for Selected Airborne Chemicals: Volume 12; Technical Report; National Research Council: Ottawa, ON, Canada, 2012. [Google Scholar]
  15. Damme, M.V.; Clarisse, L.; Whitburn, S.; Hadji-Lazaro, J.; Hurtmans, D.; Clerbaux, C.; Coheur, P.F. Industrial and Agricultural Ammonia Point Sources Exposed. Nature 2018, 564, 99–103. [Google Scholar] [CrossRef]
  16. Bekyarova, E.; Davis, M.M.; Burch, T.; Itkis, M.E.; Zhao, B.; Sunshine, A.S.; Haddon, R.C. Chemically Functionalized Single-Walled Carbon Nanotubes as Ammonia Sensors. J. Phys. Chem. B 2004, 108, 19717–19720. [Google Scholar] [CrossRef]
  17. Guo, H.; Otjes, R.P.; Schlag, P.; Kiendler-Scharr, A.; Nenes, A.; Weber, R.J. Effectiveness of Ammonia Reduction on Control of Fine Particle Nitrate. Atmos. Chem. Phys. 2018, 18, 12241–12256. [Google Scholar] [CrossRef]
  18. de Vries, W.; Cellier, P.; Erisman, J.W.; Sutton, M.A. Assessment of Nitrogen Fluxes to Air and Water from Site Scale to Continental Scale: An Overview. Environ. Pollut. 2011, 159, 3143–3148. [Google Scholar] [CrossRef]
  19. Chan, Y.H.; Lock, S.S.M.; Wong, M.K.; Yiin, C.L.; Loy, A.C.M.; Cheah, K.W.; Chai, S.Y.W.; Li, C.; How, B.S.; Chin, B.L.F.; et al. A State-of-the-Art Review on Capture and Separation of Hazardous Hydrogen Sulfide (H2S): Recent Advances, Challenges and Outlook. Environ. Pollut. 2022, 314, 120219. [Google Scholar] [CrossRef]
  20. Marriott, R.A.; Pirzadeh, P.; Marrugo-Hernandez, J.J.; Raval, S. Hydrogen Sulfide Formation in Oil and Gas. Can. J. Chem. 2016, 94, 406–413. [Google Scholar] [CrossRef]
  21. Cui, G.; Bhat, S.A.; Li, W.; Ishiguro, Y.; Wei, Y.; Li, F. H2S, MeSH, and NH3 Emissions from Activated Sludge: An Insight towards Sludge Characteristics and Microbial Mechanisms. Int. Biodeterior. Biodegrad. 2022, 166, 105331. [Google Scholar] [CrossRef]
  22. Omri, I.; Aouidi, F.; Bouallagui, H.; Godon, J.J.; Hamdi, M. Performance study of biofilter developed to treat H2S from wastewater odour. Saudi J. Biol. Sci. 2013, 20, 169–176. [Google Scholar] [PubMed]
  23. Wyer, K.E.; Kelleghan, D.B.; Blanes-Vidal, V.; Schauberger, G.; Curran, T.P. Ammonia Emissions from Agriculture and Their Contribution to Fine Particulate Matter: A Review of Implications for Human Health. J. Environ. Manag. 2022, 323, 116285. [Google Scholar]
  24. Xu, R.; Tian, H.; Pan, S.; Prior, S.A.; Feng, Y.; Batchelor, W.D.; Chen, J.; Yang, J. Global Ammonia Emissions from Synthetic Nitrogen Fertilizer Applications in Agricultural Systems: Empirical and Process-based Estimates and Uncertainty. Glob. Change Biol. 2018, 25, 314–326. [Google Scholar]
  25. Misselbrook, T.H.; Sutton, M.A.; Scholefield, D. A Simple Process-based Model for Estimating Ammonia Emissions from Agricultural Land after Fertilizer Applications. Soil Use Manag. 2004, 20, 365–372. [Google Scholar]
  26. Zhang, C.; Geng, X.; Wang, H.; Zhou, L.; Wang, B. Emission Factor for Atmospheric Ammonia from a Typical Municipal Wastewater Treatment Plant in South China. Environ. Pollut. 2017, 220 Pt B, 963–970. [Google Scholar]
  27. Li, Q.; Jiang, J.; Cai, S.; Zhou, W.; Wang, S.; Duan, L.; Hao, J. Gaseous Ammonia Emissions from Coal and Biomass Combustion in Household Stoves with Different Combustion Efficiencies. Environ. Sci. Technol. Lett. 2016, 3, 98–103. [Google Scholar]
  28. ATSDR. Toxicological Profile for Ammonia; Agency for Toxic Substances and Disease Registry (ATSDR) Toxicological Profiles; Agency for Toxic Substances and Disease Registry (US): Atlanta, GA, USA, 2004. [Google Scholar]
  29. Habeeb, O.A.; Kanthasamy, R.; Ali, G.A.M.; Sethupathi, S.; Yunus, R.B.M. Hydrogen Sulfide Emission Sources, Regulations, and Removal Techniques: A Review. Rev. Chem. Eng. 2018, 34, 837–854. [Google Scholar]
  30. Berresheim, H.; Jaeschke, W. The Contribution of Volcanoes to the Global Atmospheric Sulfur Budget. J. Geophys. Res. Ocean. 1983, 88, 3732–3740. [Google Scholar]
  31. Chou, C.H.; Ogden, J.M.; Pohl, H.R.; Scinicariello, F.; Ingerman, L.; Barber, L.; Citra, M.J. Toxicological Profile for Hydrogen Sulfide and Carbonyl Sulfide; Technical Report; Centers for Disease Control and Prevention: Atlanta, GA, USA, 2016. [Google Scholar]
  32. Ward, B.B.; Jensen, M.M. The microbial nitrogen cycle. Front. Microbiol. 2014, 5, 553. [Google Scholar]
  33. van de Leemput, I.A.; Veraart, A.J.; Dakos, V.; de Klein, J.J.M.; Strous, M.; Scheffer, M. Predicting Microbial Nitrogen Pathways from Basic Principles. Environ. Microbiol. 2011, 13, 1477–1487. [Google Scholar]
  34. Kowalchuk, G.A.; Stephen, J.R. Ammonia-oxidizing bacteria: A model for molecular microbial ecology. Annu. Rev. Microbiol. 2001, 55, 485–529. [Google Scholar] [CrossRef] [PubMed]
  35. Patra, A.K.; Aschenbach, J.R. Ureases in the gastrointestinal tracts of ruminant and monogastric animals and their implication in urea-N/ammonia metabolism: A review. J. Adv. Res. 2018, 13, 39–50. [Google Scholar] [CrossRef] [PubMed]
  36. ATSDR. Toxicological Profile for Hydrogen Sulfide and Carbonyl Sulfide; Agency for Toxic Substances and Disease Registry (ATSDR) Toxicological Profiles; Agency for Toxic Substances and Disease Registry (US): Atlanta, GA, USA, 2016. [Google Scholar]
  37. Durand, M. Toxic gases and dead birds at Sulphur Bay, Rotorua, North Island, New Zealand. Notornis 2007, 54, 42. [Google Scholar]
  38. Gao, X.; Yang, F.; Cheng, J.; Xu, Z.; Zang, B.; Li, G.; Xie, X.; Luo, W. Emission of Volatile Sulphur Compounds during Swine Manure Composting: Source Identification, Odour Mitigation and Assessment. Waste Manag. 2022, 153, 129–137. [Google Scholar] [CrossRef]
  39. Wang, G.; Li, X.; Fang, Y.; Huang, R. Analysis on the formation condition of the algae-induced odorous black water agglomerate. Saudi J. Biol. Sci. 2014, 21, 597–604. [Google Scholar] [CrossRef]
  40. Tian, L.; Han, C.; Zhang, J.; Ouyang, Y.; Xi, J. Development of an H2S Emission Model for Wastewater Treatment Plants. J. Air Waste Manag. Assoc. 2021, 71, 1303–1311. [Google Scholar] [CrossRef]
  41. Bazemo, U.; Gardner, E.; Romero, A.; Hauduc, H.; Al-Omari, A.; Takacs, I.; Murthy, S.; Torrents, A.; De Clippeleir, H. Investigating the Dynamics of Volatile Sulfur Compound Emission from Primary Systems at a Water Resource Recovery Facility. Water Environ. Res. 2021, 93, 316–327. [Google Scholar] [CrossRef]
  42. Peu, P.; Picard, S.; Diara, A.; Girault, R.; Béline, F.; Bridoux, G.; Dabert, P. Prediction of Hydrogen Sulphide Production during Anaerobic Digestion of Organic Substrates. Bioresour. Technol. 2012, 121, 419–424. [Google Scholar] [CrossRef]
  43. Langevin, B.; Génermont, S.; Basset-Mens, C.; Lardon, L. Simulation of field NH3 and N2O emissions from slurry spreading. Agron. Sustain. Dev. 2015, 35, 347–358. [Google Scholar] [CrossRef]
  44. Jeon, E.C.; Sa, J.H.; Park, J.H. Development of NH3 Emission Factors using a Dynamic Flux Chamber in a Sewage Treatment Plant. J. Environ. Impact Assess. 2005, 14, 263–273. [Google Scholar]
  45. Wang, S.; Zeng, Y. Ammonia emission mitigation in food waste composting: A review. Bioresour. Technol. 2018, 248, 13–19. [Google Scholar] [PubMed]
  46. UNE-EN 13725:2022; Determinación de la Concentración de olor por Olfatometría dináMica y cáLculo de la Emisión de olor. Asociación Española de Normalización: Madrid, Spain, 2022.
  47. UNE-EN 15259:2008; Calidad del Aire. Emisiones de Fuentes Estacionarias. Requisitos de las Secciones y Sitios de Medición y Para el Objetivo, Plan e Informe de Medición. Asociación Española de Normalización: Madrid, Spain, 2008.
  48. ISO 16911-1:2013; Stationary Source Emissions—Manual and Automatic Determination of Velocity and Volume Flow Rate in Ducts. International Organization for Standardization: Geneva, Switzerland, 2013.
  49. Corbett, S. NSW Public. NSW Public Health Bull. 2003, 14, 161. [Google Scholar] [CrossRef]
  50. Ontario Ministry of the Environment. Summary of Point of Impingement Guidelines, and Ambient Air Quality Criteria (AAQCs); Ontario Ministry of the Environment: Toronto, ON, Canada, 2011. [Google Scholar]
  51. Alberta Environment. Alberta’s Ambient Air Quality Objectives (AAAQOs) and Guidelines (AAAQGs); Alberta Environment: Edmonton, AB, Canada, 2013. [Google Scholar]
  52. Diaz, C.; Izquierdo, C.; Capelli, L.; Arias, R.; Salas Seoane, N. Analysis of Existing Regulations in Odour Pollution, Odour Impact Criteria 1; H2020SwafS-23-2017-789315; D-NOSES: Barcelona, Spain, 2019. [Google Scholar]
  53. Lopicich Catalán, B.A. Legislación en Materia de Contaminación de Olores: Evaluación Crítica de una Posible Dispersión Normativa; Consultado el 10 de Diciembre de 2024; Biblioteca del Congreso Naciona: Buenos Aires, Argentina, 2024. [Google Scholar]
  54. Congreso de la República de Colombia. Ley 9 de 1979: Por la Cual se Dictan Medidas Sanitarias; Consultado el 10 de diciembre de 2024; Congreso de la República de Colombia: Bogotá, Colombia, 1979. [Google Scholar]
  55. Presidencia de la República de Colombia. Decreto 948 de 1995. 1995. Available online: https://www.sgc.gov.co (accessed on 10 December 2024).
  56. Minambiente. Resolución 601 de 2006: Por la Cual se Establece la Norma de Calidad del Aire o Nivel de Inmisión, para Todo el Territorio Nacional en Condiciones de Referencia; Technical Report; Ministerio de Ambiente, Vivienda y Desarrollo Territorial: Bogotá, Colombia, 2006. [Google Scholar]
  57. Minambiente. Resolución 610 de 2010: Por la Cual se Modifica la Resolución 601 del 4 de Abril de 2006; Technical Report; Ministerio de Ambiente, Vivienda y Desarrollo Territorial: Bogotá, Colombia, 2010. [Google Scholar]
  58. Minambiente. Resolución 1541 de 2013: Por la Cual se Establecen los Niveles Permisibles de Calidad del Aire o de Inmisión, el Procedimiento para la Evaluación de Actividades que Generan Olores Ofensivos y se Dictan Otras Disposiciones; Technical Report; Ministerio de Ambiente, Vivienda y Desarrollo Territorial: Bogotá, Colombia, 2013. [Google Scholar]
  59. Minambiente. Resolución 2087 de 2014: Por la Cual se Adopta el Protocolo para el Monitoreo, Control y Vigilancia de Olores Ofensivos; Technical Report; Ministerio de Ambiente, Vivienda y Desarrollo Territorial: Bogotá, Colombia, 2014. [Google Scholar]
  60. NTC 6012-1:2013; Evaluación de los Efectos y Molestias Causadas por los Olores. Parte 1: Evaluación sicoméTrica de las Molestias por Olores. Instituto Colombiano de Normas Técnicas y Certificación: Bogotá, Colombia, 2013.
  61. CNCT. NTP 320: Umbrales Olfativos y Seguridad de Sustancias quíMicas Peligrosas; Technical Report; Centro Nacional de Condiciones de Trabajo: Madrid, Spain, 2011. [Google Scholar]
  62. Philipopoulos, G.; Tat, J.; Chan, A.; Jiang, J.; Mukai, D.S.; Burney, T.; Doosty, M.; Mahon, S.; Patel, H.H.; White, C.W.; et al. Methyl Mercaptan Gas: Mechanisms of Toxicity and Demonstration of the Effectiveness of Cobinamide as an Antidote in Mice and Rabbits. Clin. Toxicol. 2022, 60, 615–622. [Google Scholar]
  63. Setoguchi, T.; Machigashira, M.; Yamamoto, M.; Yotsumoto, Y.; Yoshimori, M.; Izumi, Y.; Yaegaki, K. The Effects of Methyl Mercaptan on Epithelial Cell Growth and Proliferation. Int. Dent. J. 2002, 52 (Suppl. S3), 241–246. [Google Scholar]
  64. Wang, B.; Sivret, E.C.; Parcsi, G.; Stuetz, R.M. Determination of VOSCs in sewer headspace air using TD-GC-SCD. Talanta 2015, 137, 71–79. [Google Scholar] [CrossRef]
  65. Encarnação, T.; Pais, A.A.C.C.; Campos, M.G.; Burrows, H.D. Endocrine Disrupting Chemicals: Impact on Human Health, Wildlife and the Environment. Sci. Prog. 2019, 102, 3–42. [Google Scholar]
  66. Rippey, J.C.; Charles, J.; Rippey, E.R. Nine Cases of Accidental Exposure to Dimethyl Sulphate—A Potential Chemical Weapon. Emerg. Med. J. 2005, 22, 878–879. [Google Scholar]
  67. Lewis, R.J.; Copley, G.B. Chronic Low-Level Hydrogen Sulfide Exposure and Potential Effects on Human Health: A Review of the Epidemiological Evidence. Crit. Rev. Toxicol. 2015, 45, 123–193. [Google Scholar] [CrossRef]
  68. Curren, J.; Hallis, S.A.; Snyder, C.L.C.; Suffet, I.H.M. Identification and quantification of nuisance odors at a trash transfer station. Waste Manag. 2016, 58, 52–61. [Google Scholar]
  69. Blanes-Vidal, V.; Bælum, J.; Schwartz, J.D.; Løfstrøm, P.; Christensen, L.P. Respiratory and Sensory Irritation Symptoms among Residents Exposed to Low-to-Moderate Air Pollution from Biodegradable Wastes. J. Expo. Sci. Environ. Epidemiol. 2014, 24, 388–397. [Google Scholar] [CrossRef]
  70. Wu, Y.N.; Yan, F.F.; Hu, J.Y.; Chen, H.; Tucker, C.M.; Green, A.R.; Cheng, H.W. The Effect of Chronic Ammonia Exposure on Acute-phase Proteins, Immunoglobulin, and Cytokines in Laying Hens. Poult. Sci. 2017, 96, 1524–1530. [Google Scholar] [CrossRef] [PubMed]
  71. Pope, C.A.; Turner, M.C.; Burnett, R.T.; Jerrett, M.; Gapstur, S.M.; Diver, R.W.; Krewski, D.; Brook, R.D. Relationships between Fine Particulate Air Pollution, Cardiometabolic Disorders, and Cardiovascular Mortality. Circ. Res. 2015, 116, 108–115. [Google Scholar] [PubMed]
  72. Fike, D.A.; Bradley, A.S.; Rose, C.V. Rethinking the Ancient Sulfur Cycle. Annu. Rev. Earth Planet. Sci. 2015, 43, 593–622. [Google Scholar]
  73. Gupta, S.; Plugge, C.M.; Muyzer, G.; Sánchez-Andrea, I. Harnessing the Potential of the Microbial Sulfur Cycle for Environmental Biotechnology. Curr. Opin. Biotechnol. 2024, 88, 103164. [Google Scholar]
  74. Wang, R.; Lin, J.q.; Liu, X.m.; Pang, X.; Zhang, C.J.; Yang, C.L.; Gao, X.; Lin, C.; Li, Y.Q.; Li, Y.; et al. Sulfur Oxidation in the Acidophilic Autotrophic Acidithiobacillus spp. Front. Microbiol. 2019, 9, 3290. [Google Scholar] [CrossRef]
  75. Beller, H.R.; Chain, P.S.G.; Letain, T.E.; Chakicherla, A.; Larimer, F.W.; Richardson, P.M.; Coleman, M.A.; Wood, A.P.; Kelly, D.P. The Genome Sequence of the Obligately Chemolithoautotrophic, Facultatively Anaerobic Bacterium Thiobacillus Denitrificans. J. Bacteriol. 2006, 188, 1473–1488. [Google Scholar]
  76. Lin, S.; Mackey, H.R.; Hao, T.; Guo, G.; van Loosdrecht, M.C.M.; Chen, G. Biological Sulfur Oxidation in Wastewater Treatment: A Review of Emerging Opportunities. Water Res. 2018, 143, 399–415. [Google Scholar]
  77. Hao, T.w.; Xiang, P.y.; Mackey, H.R.; Chi, K.; Lu, H.; Chui, H.k.; van Loosdrecht, M.C.M.; Chen, G.H. A Review of Biological Sulfate Conversions in Wastewater Treatment. Water Res. 2014, 65, 1–21. [Google Scholar]
  78. Tran, P.Q.; Bachand, S.C.; Hotvedt, J.C.; Kieft, K.; McDaniel, E.A.; McMahon, K.D.; Anantharaman, K. Physiological and genomic evidence of cysteine degradation and aerobic hydrogen sulfide production in freshwater bacteria. mSystems 2023, 8, e00201-23. [Google Scholar]
  79. Mutegoa, E.; Sahini, M.G. Approaches to Mitigation of Hydrogen Sulfide during Anaerobic Digestion Process—A Review. Heliyon 2023, 9, e19768. [Google Scholar]
  80. Lens, P. Sulfur Cycle. In Encyclopedia of Microbiology, 3rd ed.; Academic Press: Oxford, UK, 2009; pp. 361–369. [Google Scholar]
  81. Leavitt, W.D.; Cummins, R.C.; Schmidt, M.L.; Sim, M.S.; Ono, S.; Bradley, A.S.; Johnston, D.T. Multiple Sulfur Isotope Signatures of Sulfite and Thiosulfate Reduction by the Model Dissimilatory Sulfate-Reducer, Desulfovibrio Alaskensis Str. G20. Front. Microbiol. 2014, 5, 591. [Google Scholar] [CrossRef] [PubMed]
  82. Ito, T.; Sugita, K.; Okabe, S. Isolation, Characterization, and in Situ Detection of a Novel Chemolithoautotrophic Sulfur-Oxidizing Bacterium in Wastewater Biofilms Growing under Microaerophilic Conditions. Appl. Environ. Microbiol. 2004, 70, 3122–3129. [Google Scholar] [CrossRef] [PubMed]
  83. Luther, G.W.; Findlay, A.J.; MacDonald, D.J.; Owings, S.M.; Hanson, T.E.; Beinart, R.A.; Girguis, P.R. Thermodynamics and Kinetics of Sulfide Oxidation by Oxygen: A Look at Inorganically Controlled Reactions and Biologically Mediated Processes in the Environment. Front. Microbiol. 2011, 2, 62. [Google Scholar] [CrossRef]
  84. Camacho, D.; Frazao, R.; Fouillen, A.; Nanci, A.; Lang, B.F.; Apte, S.C.; Baron, C.; Warren, L.A. New Insights into Acidithiobacillus Thiooxidans Sulfur Metabolism through Coupled Gene Expression, Solution Chemistry, Microscopy, and Spectroscopy Analyses. Front. Microbiol. 2020, 11, 411. [Google Scholar] [CrossRef]
  85. Sander, J.; Engels-Schwarzlose, S.; Dahl, C. Importance of the DsrMKJOP Complex for Sulfur Oxidation in Allochromatium Vinosum and Phylogenetic Analysis of Related Complexes in Other Prokaryotes. Arch. Microbiol. 2006, 186, 357–366. [Google Scholar] [CrossRef]
  86. Tang, K. Chemical Diversity and Biochemical Transformation of Biogenic Organic Sulfur in the Ocean. Front. Mar. Sci. 2020, 7, 68. [Google Scholar]
  87. Li, K.; Xin, Y.; Xuan, G.; Zhao, R.; Liu, H.; Xia, Y.; Xun, L. Escherichia coli Uses Separate Enzymes to Produce H2S and Reactive Sulfane Sulfur from L-Cysteine. Front. Microbiol. 2019, 10, 298. [Google Scholar] [CrossRef]
  88. Lehnert, A.S.; Cooper, R.E.; Ignatz, R.M.; Ruecker, A.; Gomes-Alves, E.; Küsel, K.; Pohnert, G.; Trumbore, S.E. Dimethyl Sulfide Emissions from a Peatland Result More from Organic Matter Degradation than Sulfate Reduction. J. Geophys. Res. Biogeosci. 2024, 129, e2023JG007449. [Google Scholar] [CrossRef]
  89. Tchong, S.I.; Xu, H.; White, R.H. L-Cysteine Desulfidase: An [4Fe-4S] Enzyme Isolated from Methanocaldococcus Jannaschii That Catalyzes the Breakdown of L-cysteine into Pyruvate, Ammonia, and Sulfide. Biochemistry 2005, 44, 1659–1670. [Google Scholar] [CrossRef]
  90. Loddeke, M.; Schneider, B.L.; Oguri, T.; Mehta, I.; Xuan, Z.; Reitzer, L. Anaerobic Cysteine Degradation and Potential Metabolic Coordination in Salmonella enterica and Escherichia coli. J. Bacteriol. 2017, 199. [Google Scholar] [CrossRef]
  91. Mishanina, T.V.; Libiad, M.; Banerjee, R. Biogenesis of Reactive Sulfur Species for Signaling by Hydrogen Sulfide Oxidation Pathways. Nat. Chem. Biol. 2015, 11, 457–464. [Google Scholar] [PubMed]
  92. Lei, Q.; Boatright, W.L. Methionine Is the Methyl Group Donor for Sulfite-Associated Methanethiol Formation in Isolated Soy Proteins. J. Food Sci. 2006, 71, C527–C531. [Google Scholar] [CrossRef]
  93. He, R.; Yao, X.Z.; Chen, M.; Ma, R.; Li, H.J.; Wang, C.; Ding, S. Conversion of Sulfur Compounds and Microbial Community in Anaerobic Treatment of Fish and Pork Waste. Waste Manag. 2018, 76, 383–393. [Google Scholar] [CrossRef]
  94. Gallardo-Benavente, C.; Carrión, O.; Todd, J.D.; Pieretti, J.C.; Seabra, A.B.; Durán, N.; Rubilar, O.; Pérez-Donoso, J.M.; Quiroz, A. Biosynthesis of CdS Quantum Dots Mediated by Volatile Sulfur Compounds Released by Antarctic Pseudomonas fragi. Front. Microbiol. 2019, 10, 1866. [Google Scholar]
  95. Visscher, P.T.; Baumgartner, L.K.; Buckley, D.H.; Rogers, D.R.; Hogan, M.E.; Raleigh, C.D.; Turk, K.A.; Marais, D.J.D. Dimethyl Sulphide and Methanethiol Formation in Microbial Mats: Potential Pathways for Biogenic Signatures. Environ. Microbiol. 2003, 5, 296–308. [Google Scholar]
  96. Findlay, A.J. Microbial Impact on Polysulfide Dynamics in the Environment. FEMS Microbiol. Lett. 2016, 363, fnw103. [Google Scholar]
  97. Avetisyan, K.; Zweig, I.; Luther, G.W.; Kamyshny, A. Kinetics and Mechanism of Polysulfides and Elemental Sulfur Formation by a Reaction between Hydrogen Sulfide and δ-MnO2. Geochim. Cosmochim. Acta 2021, 313, 21–37. [Google Scholar] [CrossRef]
  98. Mashkina, A.V. Catalytic Reactions of Dialkyl Disulfides. Russ. Chem. Rev. 2014, 83, 733–757. [Google Scholar] [CrossRef]
  99. Yücel, M.; Sommer, S.; Dale, A.W.; Pfannkuche, O. Microbial Sulfide Filter along a Benthic Redox Gradient in the Eastern Gotland Basin, Baltic Sea. Front. Microbiol. 2017, 8, 169. [Google Scholar]
  100. Wilkening, J.V.; Turchyn, A.V.; Redeker, K.R.; Mills, J.V.; Antler, G.; Carrión, O.; Todd, J.D. The Production and Fate of Volatile Organosulfur Compounds in Sulfidic and Ferruginous Sediment. J. Geophys. Res. Biogeosci. 2019, 124, 3390–3402. [Google Scholar] [CrossRef]
  101. Yoch, D.C. Dimethylsulfoniopropionate: Its Sources, Role in the Marine Food Web, and Biological Degradation to Dimethylsulfide. Appl. Environ. Microbiol. 2002, 68, 5804–5815. [Google Scholar] [CrossRef] [PubMed]
  102. Zhang, X.; Liu, J.; Liu, J.; Yang, G.; Xue, C.X.; Curson, A.R.J.; Todd, J.D. Biogenic Production of DMSP and Its Degradation to DMS—Their Roles in the Global Sulfur Cycle. Sci. China Life Sci. 2019, 62, 1296–1319. [Google Scholar] [CrossRef] [PubMed]
  103. Shaw, D.K.; Sekar, J.; Ramalingam, P.V. Recent Insights into Oceanic Dimethylsulfoniopropionate Biosynthesis and Catabolism. Environ. Microbiol. 2022, 24, 2669–2700. [Google Scholar] [CrossRef] [PubMed]
  104. Yang, W.; Tan, Q.; Zhao, H.; Xia, F.; Li, C.; Ma, X.; Li, W. Eutrophication-Driven Infochemical Dimethylsulfide Accelerates Carbon Transfer in Freshwater Food Chain. J. Environ. Manag. 2024, 353, 120155. [Google Scholar] [CrossRef]
  105. Zanello, P. Structure and Electrochemistry of Proteins Harboring Iron-Sulfur Clusters of Different Nuclearities. Part V. Nitrogenases. Coord. Chem. Rev. 2019, 398, 113004. [Google Scholar] [CrossRef]
  106. Zehr, J.P.; Jenkins, B.D.; Short, S.M.; Steward, G.F. Nitrogenase Gene Diversity and Microbial Community Structure: A Cross-System Comparison. Environ. Microbiol. 2003, 5, 539–554. [Google Scholar] [CrossRef]
  107. Rana, A.; Pandey, R.K.; Ramakrishnan, B. Chapter 3—Enzymology of the Nitrogen Cycle and Bioremediation of Toxic Nitrogenous Compounds. In Smart Bioremediation Technologies; Academic Press: Cambridge, MA, USA, 2019; pp. 45–61. [Google Scholar]
  108. Kuypers, M.M.M.; Marchant, H.K.; Kartal, B. The Microbial Nitrogen-Cycling Network. Nat. Rev. Microbiol. 2018, 16, 263–276. [Google Scholar] [CrossRef]
  109. Xu, P.; Wang, E. Diversity and Regulation of Symbiotic Nitrogen Fixation in Plants. Curr. Biol. 2023, 33, R543–R559. [Google Scholar] [CrossRef]
  110. Santi, C.; Bogusz, D.; Franche, C. Biological Nitrogen Fixation in Non-Legume Plants. Ann. Bot. 2013, 111, 743–767. [Google Scholar] [CrossRef]
  111. Berman-Frank, I.; Lundgren, P.; Chen, Y.B.; Küpper, H.; Kolber, Z.S.; Bergman, B.; Falkowski, P.G. Segregation of Nitrogen Fixation and Oxygenic Photosynthesis in the Marine Cyanobacterium Trichodesmium. Science 2001, 294, 1534–1537. [Google Scholar] [CrossRef]
  112. Romillac, N. Ammonification. Encycl. Ecol. 2019, 2, 256–263. [Google Scholar]
  113. Ng, C.W.; Yan, W.H.; Tsim, K.W.; San So, P.; Xia, Y.T.; To, C.T. Effects of Bacillus Subtilis and Pseudomonas Fluorescens as the Soil Amendment. Heliyon 2022, 8, e11674. [Google Scholar] [PubMed]
  114. Ward, B.B. Nitrification and Ammonification in Aquatic Systems. Life Support Biosph. Sci. 1996, 3, 25–29. [Google Scholar]
  115. Lea, P.J.; Miflin, B.J. Nitrogen Assimilation and Its Relevance to Crop Improvement. In Annual Plant Reviews; Blackwell Publishing Ltd.: Oxford, UK, 2010. [Google Scholar]
  116. Heldt, H.W.; Piechulla, B. Nitrate Assimilation Is Essential for the Biosynthesis of Organic Matter. In Plant Biochemistry; Academic Press: Cambridge, MA, USA, 2021. [Google Scholar]
  117. Morot-Gaudry, J.F. Nitrogen Assimilation by Plants: Physiological, Biochemical, and Molecular Aspects. In Nitrogen Assimilation by Plants; CRC Press: Boca Raton, FL, USA, 2001. [Google Scholar]
  118. Pierzynowski, S.G.; Pierzynowska, K.G. Alpha-Ketoglutarate, a Key Molecule Involved in Nitrogen Circulation in Both Animals and Plants, in the Context of Human Gut Microbiota and Protein Metabolism. Adv. Med. Sci. 2022, 67, 142–147. [Google Scholar] [CrossRef]
  119. Nunes-Nesi, A.; Fernie, A.R.; Stitt, M. Metabolic and Signaling Aspects Underpinning the Regulation of Plant Carbon Nitrogen Interactions. Mol. Plant 2010, 3, 973–996. [Google Scholar]
  120. Wallace, W.; Nicholas, D.J.D. The Biochemistry of Nitrifying Microorganisms. Biol. Rev. 1969, 44, 359–389. [Google Scholar]
  121. Divya, M.; Aanand, S.; Srinivasan, A.; Ahilan, B. Bioremediation–an Eco-Friendly Tool for Effluent Treatment: A Review. Int. J. Appl. Res. 2015, 1, 530–537. [Google Scholar]
  122. Daims, H.; Lebedeva, E.V.; Pjevac, P.; Han, P.; Herbold, C.W.; Albertsen, M.; Jehmlich, N.; Palatinszky, M.; Vierheilig, J.; Bulaev, A.; et al. Complete Nitrification by Nitrospira Bacteria. Nature 2015, 528, 504–509. [Google Scholar] [CrossRef]
  123. Subbarao, G.V.; Ito, O.; Sahrawat, K.L.; Berry, W.L.; Nakahara, K.; Ishikawa, T.; Watanabe, T.; Suenaga, K.; Rondón, M.A.; Rao, I.M. Scope and Strategies for Regulation of Nitrification in Agricultural Systems—Challenges and Opportunities. Crit. Rev. Plant Sci. 2006, 25, 303–335. [Google Scholar]
  124. Beeckman, F.; Motte, H.; Beeckman, T. Nitrification in Agricultural Soils: Impact, Actors and Mitigation. Curr. Opin. Biotechnol. 2018, 50, 166–173. [Google Scholar]
  125. Olaya-Abril, A.; Hidalgo-Carrillo, J.; Luque-Almagro, V.M.; Fuentes-Almagro, C.A.; Urbano, F.J.; Moreno-Vivián, C.; Richardson, D.J.; Roldán, M.D. Exploring the Denitrification Proteome of Paracoccus Denitrificans PD1222. Front. Microbiol. 2018, 9, 1137. [Google Scholar] [CrossRef] [PubMed]
  126. Pan, Y.; Ni, B.J.; Bond, P.L.; Ye, L.; Yuan, Z. Electron Competition among Nitrogen Oxides Reduction during Methanol-Utilizing Denitrification in Wastewater Treatment. Water Res. 2013, 47, 3273–3281. [Google Scholar] [CrossRef] [PubMed]
  127. Wang, J.; Chu, L. Biological Nitrate Removal from Water and Wastewater by Solid-Phase Denitrification Process. Biotechnol. Adv. 2016, 34, 1103–1112. [Google Scholar] [CrossRef] [PubMed]
  128. Yang, C.; Rooke, J.A.; Cabeza, I.; Wallace, R.J. Nitrate and Inhibition of Ruminal Methanogenesis: Microbial Ecology, Obstacles, and Opportunities for Lowering Methane Emissions from Ruminant Livestock. Front. Microbiol. 2016, 7, 132. [Google Scholar] [CrossRef]
  129. Richardson, D.J.; Felgate, H.; Watmough, N.J.; Thomson, A.; Baggs, E.M. Mitigating Release of the Potent Greenhouse Gas N2O from the Nitrogen Cycle—Could Enzymic Regulation Hold the Key? Trends Biotechnol. 2009, 27, 388–397. [Google Scholar] [CrossRef]
  130. Oshiki, M.; Satoh, H.; Okabe, S. Ecology and Physiology of Anaerobic Ammonium Oxidizing Bacteria. Environ. Microbiol. 2016, 18, 2784–2796. [Google Scholar] [CrossRef]
  131. Kartal, B.; Keltjens, J.T. Anammox Biochemistry: A Tale of Heme c Proteins. Trends Biochem. Sci. 2016, 41, 998–1011. [Google Scholar] [CrossRef]
  132. op den Camp, H.J.M.; Kartal, B.; Guven, D.; van Niftrik, L.; Haaijer, S.C.M.; van der Star, W.R.L.; van de Pas-Schoonen, K.T.; Cabezas, A.; Ying, Z.; Schmid, M.; et al. Global Impact and Application of the Anaerobic Ammonium-Oxidizing (Anammox) Bacteria. Biochem. Soc. Trans. 2006, 34 Pt 1, 174–178. [Google Scholar] [CrossRef]
  133. Suneethi, S.; Joseph, K. ANAMMOX Process Start up and Stabilization with an Anaerobic Seed in Anaerobic Membrane Bioreactor (AnMBR). Bioresour. Technol. 2011, 102, 8860–8867. [Google Scholar] [CrossRef]
  134. Yan, L.; Ye, J.; Zhang, P.; Xu, D.y.; Wu, Y.; Liu, J.; Zhang, H.; Fang, W.; Wang, B.; Zeng, G. Hydrogen Sulfide Formation Control and Microbial Competition in Batch Anaerobic Digestion of Slaughterhouse Wastewater Sludge: Effect of Initial Sludge pH. Bioresour. Technol. 2018, 259, 67–74. [Google Scholar] [CrossRef]
  135. Weng, H.x.; Dai, Z.; Ji, Z.q.; Gao, C.; Liu, C. Release and Control of Hydrogen Sulfide during Sludge Thermal Drying. J. Hazard. Mater. 2015, 296, 61–67. [Google Scholar] [PubMed]
  136. Matos, R.V.; Matias, N.; Ferreira, F.; Silva, J.S.; Matos, J.S. Assessment of Sulfide Production in a Full Scale Wastewater Sludge Rising Main. J. Environ. Manag. 2018, 209, 505–514. [Google Scholar]
  137. Vásquez, Y.; Escobar, M.C.; Neculita, C.M.; Arbeli, Z.; Roldán, F. Biochemical Passive Reactors for Treatment of Acid Mine Drainage: Effect of Hydraulic Retention Time on Changes in Efficiency, Composition of Reactive Mixture, and Microbial Activity. Chemosphere 2016, 153, 244–253. [Google Scholar] [CrossRef] [PubMed]
  138. Hülse, D.; Arndt, S.; Ridgwell, A. Mitigation of Extreme Ocean Anoxic Event Conditions by Organic Matter Sulfurization. Paleoceanogr. Paleoclimatol. 2019, 34, 476–489. [Google Scholar] [CrossRef]
  139. Liu, J.; Fan, X.r.; Zhao, W.L.; Yang, S.w.; Hu, B.; Yang, S.g.; Lu, Q. Mechanical Insight into the Formation of H2S from Thiophene Pyrolysis: The Influence of H2O. Chemosphere 2021, 279, 130628. [Google Scholar]
  140. Madigan, M.T.; Martinko, J.M.; Parker, J. Brock Biology of Microorganisms; Prentice Hall Upper: Saddle River, NJ, USA, 1997; Volume 11. [Google Scholar]
  141. Yang, F.; Han, Y.; Bi, H.; Wei, X.m.; Luo, W.; Li, G. Ammonia Emissions and Their Key Influencing Factors from Naturally Ventilated Dairy Farms. Chemosphere 2022, 307, 135747. [Google Scholar]
  142. Sha, Z.; Ma, X.; Liu, H.; Wang, J.; Lv, T.; Goulding, K.W.T.; Liu, X. Crop-Specific Ammonia Volatilization Rates and Key Influencing Factors in the Upland of China—A Data Synthesis. J. Environ. Manag. 2023, 336, 117676. [Google Scholar]
  143. Kemmou, L.; Amanatidou, E. Factors Affecting Nitrous Oxide Emissions from Activated Sludge Wastewater Treatment Plants—A Review. Resources 2023, 12, 114. [Google Scholar] [CrossRef]
  144. Zhang, H.; Schuchardt, F.; Li, G.; Yang, J.b.; Yang, Q.Y. Emission of Volatile Sulfur Compounds during Composting of Municipal Solid Waste (MSW). Waste Manag. 2013, 33, 957–963. [Google Scholar]
  145. Xu, Z.; Yang, Q.; Jiang, X.; Dong, Y.; Hu, Z.; Shi, L.; Zhao, R. Multi-Dimension Analysis of Volatile Sulfur Compound Emissions from an Urban Wastewater Treatment Plant. J. Environ. Manag. 2023, 345, 118632. [Google Scholar] [CrossRef]
  146. Barczak, R.J.; Fisher, R.M.; Le-Minh, N.; Stuetz, R.M. Identification of Volatile Sulfur Odorants Emitted from Ageing Wastewater Biosolids. Chemosphere 2022, 287 Pt 2, 132210. [Google Scholar] [CrossRef]
  147. Xin, L.; Nan’an, X.; Wang, X.; Dai, X.; Guo, Y.; Dong, B. New Insight into Volatile Sulfur Compounds Conversion in Anaerobic Digestion of Excess Sludge: Influence of Free Ammonia Nitrogen and Thermal Hydrolysis Pretreatment. J. Clean. Prod. 2020, 277, 123366. [Google Scholar]
  148. Han, Z.; Qi, F.; Wang, H.; Liu, B.; Shen, X.; Song, C.; Bao, Z.; Zhao, X.; Xu, Y.; Sun, D. Emission characteristics of volatile sulfur compounds (VSCs) from a municipal sewage sludge aerobic composting plant. Waste Manag. 2018, 77, 593–602. [Google Scholar] [CrossRef]
  149. Li, R.; Han, Z.; Shen, H.; Qi, F.; Ding, M.; Song, C.; Sun, D. Emission characteristics of odorous volatile sulfur compound from a full-scale sequencing batch reactor wastewater treatment plant. Sci. Total Environ. 2021, 776, 145991. [Google Scholar] [CrossRef]
  150. Wiśniewska, M.; Kulig, A.; Lelicińska-Serafin, K. The importance of the microclimatic conditions inside and outside of plant buildings in odorants emission at municipal waste biogas installations. Energies 2020, 13, 6463. [Google Scholar] [CrossRef]
  151. Ding, Y.; Cai, C.; Hu, B.; Xu, Y.; Zheng, X.; Chen, Y.; Wu, W. Characterization and control of odorous gases at a landfill site: A case study in Hangzhou, China. Waste Manag. 2012, 32, 317–326. [Google Scholar]
  152. Hernández, D.; Zambra, C.; Astudillo, C.; Gabriel, D.; Díaz, J. Evolution of physico-chemical parameters, microorganism diversity and volatile organic compound of apple pomace exposed to ambient conditions. Heliyon 2023, 9, e19770. [Google Scholar] [CrossRef]
  153. Vela Aparicio, D.; Muñoz Lasso, C.; Cabeza Rojas, I.; Brandao, P. Evaluación de las Emisiones de H2S, NH3 y Compuestos orgáNicos Volátiles en la PTAR el Salitre a Través del réGimen climáTico de Bogotá; Universidad Santo Tomás: Santiago, Chile, 2020. [Google Scholar]
  154. Fisher, R.; Le-Minh, N.; Alvarez-Gaitan, J.; Moore, S.; Stuetz, R. Emissions of volatile sulfur compounds (VSCs) throughout wastewater biosolids processing. Sci. Total Environ. 2018, 616, 622–631. [Google Scholar] [CrossRef]
  155. Lomans, B.P.; Smolders, A.; Intven, L.M.; Pol, A.; Op, D.; Van Der Drift, C. Formation of dimethyl sulfide and methanethiol in anoxic freshwater sediments. Appl. Environ. Microbiol. 1997, 63, 4741–4747. [Google Scholar] [CrossRef]
  156. Paternina, M.F.; Fern, A.A.; Cabeza, R.I.; Forero, D.F. Evaluación de Diferentes Variables Operacionales en un Sistema de Biofiltración con Tres Tipos de Lechos Orgánicos para la Remoción Simultánea de Sulfuro de Hidrógeno (H2S) y Amoniaco (NH3); FAO: Roma, Italy, 2020. [Google Scholar]
  157. Ras, M.R.; Borrull, F.; Marcé, R.M. Determination of volatile organic sulfur compounds in the air at sewage management areas by thermal desorption and gas chromatography–mass spectrometry. Talanta 2008, 74, 562–569. [Google Scholar] [CrossRef]
  158. Wenzhu, Y.; Hu, Y.; Song, C.; Yu, Y.; Jiao, Y. Interactive effects of soil moisture, nitrogen fertilizer, and temperature on the kinetic and thermodynamic properties of ammonia emissions from alkaline soil. Atmos. Pollut. Res. 2023, 14, 101805. [Google Scholar] [CrossRef]
  159. Drame, M.; Carswell, A.; Roberts, W.; Hood, J.; Jemo, M.; Heuer, S.; Kirk, G.; Pawlett, M.; Misselbrook, T. Effects of hotter, drier conditions on gaseous losses from nitrogen fertilisers. J. Environ. Manag. 2023, 345, 118671. [Google Scholar] [CrossRef]
  160. Vangeli, S.; Posse, G.; Beget, M.E.; Otero Estrada, E.; Valdettaro, R.A.; Oricchio, P.; Kandus, M.; Di Bella, C.M. Effects of fertilizer type on nitrous oxide emission and ammonia volatilization in wheat and maize crops. Soil Use Manag. 2022, 38, 1519–1531. [Google Scholar] [CrossRef]
  161. Alvarado, M.d.R.T.; Muñoz, T.P.; Vela, N.B.M. Methanogenesis in sediments of a tropical coastal wetland: A culture-dependent method. Rev. Biol. Trop. 2024, 72, 28. [Google Scholar]
  162. Wang, M.; Hou, J.; Deng, R. Co-exposure of environmental contaminants with unfavorable temperature or humidity/moisture: Joint hazards and underlying mechanisms. Ecotoxicol. Environ. Saf. 2023, 264, 115432. [Google Scholar] [CrossRef]
  163. Wei, Z.; Xu, Y.; Shi, Y.; Zhou, X.; Lin, J.; Ruan, A. The Response Mechanism of Microorganisms to the Organic Carbon-Driven Formation of Black and Odorous Water. Environ. Res. 2023, 231, 116255. [Google Scholar] [CrossRef]
  164. Breitburg, D.; Levin, L.A.; Oschlies, A.; Grégoire, M.; Chavez, F.P.; Conley, D.J.; Garçon, V.; Gilbert, D.; Gutiérrez, D.; Isensee, K.; et al. Declining Oxygen in the Global Ocean and Coastal Waters. Science 2018, 359, eaam7240. [Google Scholar] [CrossRef]
  165. Díaz, R.J.; Rosenberg, R. Spreading Dead Zones and Consequences for Marine Ecosystems. Science 2008, 321, 926–929. [Google Scholar] [CrossRef]
  166. Jouanneau, S.; Recoules, L.; Durand, M.J.; Boukabache, A.; Picot, V.S.; Primault, Y.; Lakel, A.; Sengelin, M.; Barillon, B.C.G.; Thouand, G. Methods for Assessing Biochemical Oxygen Demand (BOD): A Review. Water Res. 2014, 49, 62–82. [Google Scholar] [CrossRef]
  167. Bonsdorff, E. Eutrophication: Early Warning Signals, Ecosystem-Level and Societal Responses, and Ways Forward. Ambio 2021, 50, 753–758. [Google Scholar] [CrossRef]
  168. Heisler, J.C.; Glibert, P.M.; Burkholder, J.M.; Anderson, D.M.; Cochlan, W.P.; Dennison, W.C.; Dortch, Q.; Gobler, C.J.; Heil, C.A.; Humphries, E.M.; et al. Eutrophication and Harmful Algal Blooms: A Scientific Consensus. Harmful Algae 2008, 8, 3–13. [Google Scholar]
  169. Olivera, C.; Tondo, M.L.; Girardi, V.; Fattobene, L.; Herrero, M.S.; Pérez, L.M.; Salvatierra, L.M. Early-Stage Response in Anaerobic Bioreactors Due to High Sulfate Loads: Hydrogen Sulfide Yield and Other Organic Volatile Sulfur Compounds as a Sign of Microbial Community Modifications. Bioresour. Technol. 2022, 350, 126947. [Google Scholar]
  170. Yu, C.; Shi, C.; Tang, J.; Ji, Q.; Wang, X.; Xu, X.; Wang, G. Release of Taste and Odour Compounds during Zizania Latifolia Decay: A Microcosm System Study. Environ. Pollut. 2019, 254 Pt A, 112954. [Google Scholar] [CrossRef]
  171. Darnajoux, R.; Inomura, K.; Zhang, X. A Diazotrophy-Ammoniotrophy Dual Growth Model for the Sulfate Reducing Bacterium Desulfovibrio Vulgaris Var. Hildenborough. Comput. Struct. Biotechnol. J. 2023, 21, 3136–3148. [Google Scholar]
  172. Parshina, S.N.; Sipma, J.; Nakashimada, Y.; Henstra, A.M.; Smidt, H.; Lysenko, A.M.; Lens, P.N.; Lettinga, G.; Stams, A.J. Desulfotomaculum Carboxydivorans Sp. Nov., a Novel Sulfate-Reducing Bacterium Capable of Growth at 100% CO. Int. J. Syst. Evol. Microbiol. 2005, 55, 2159–2165. [Google Scholar] [CrossRef]
  173. Ghorbel, L.; Coudert, L.; Gilbert, Y.G.; Mercier, G.; Blais, J.F. Determination of Critical Operational Conditions Favoring Sulfide Production from Domestic Wastewater Treated by a Sulfur-Utilizing Denitrification Process. J. Environ. Manag. 2017, 198 Pt 1, 16–23. [Google Scholar]
  174. Guerrero, L.; Montalvo, S.; Huiliñir, C.; Campos, J.L.; Barahona, A.; Borja, R. Advances in the Biological Removal of Sulphides from Aqueous Phase in Anaerobic Processes: A Review. Environ. Rev. 2016, 24, 84–100. [Google Scholar]
  175. Murei, A.; Kamika, I.; Samie, A.; Momba, M.N.B. Assessment of the Water Sources for Potential Channels of Faecal Contamination within Vhembe District Municipality Using Sanitary Inspections and Hydrogen Sulphide Test. Sci. Rep. 2023, 13, 6250. [Google Scholar]
  176. Zuo, Z. Emission of Cyanobacterial Volatile Organic Compounds and Their Roles in Blooms. Front. Microbiol. 2023, 14, 1097712. [Google Scholar]
  177. Dong, Z.Y.; Lin, Y.L.; Zhang, T.Y.; Hu, C.y.; Pan, Y.; Zheng, Z.X.; Tang, Y.L.; Xu, B.; Gao, N.y. The Formation, Analysis, and Control of Chlor(Am)Ination-Derived Odor Problems: A Review. Water Res. 2021, 203, 117549. [Google Scholar]
  178. Zhang, X.j.; Chen, C.; Ding, J.q.; Hou, A.; Li, Y.; Niu, Z.b.; Su, X.y.; Xu, Y.j.; Laws, E.A. The 2007 water crisis in Wuxi, China: Analysis of the origin. J. Hazard. Mater. 2010, 182, 130–135. [Google Scholar] [CrossRef]
  179. Jefferson, G.M.; Ciro, P.M.; Andrea, M.S.M. Environmental Education and the Bogotá River: An Intervention to Be Carried out in Cundinamarca (Colombia). Int. Res. Geogr. Environ. Educ. 2017, 26, 281–296. [Google Scholar] [CrossRef]
  180. Díaz-Casallas, D.M.; Castro-Fernández, M.F.; Bocos, E.; Montenegro-Marín, C.E.; Crespo, R.G. 2008–2017 Bogota River Water Quality Assessment Based on the Water Quality Index. Sustainability 2019, 11, 1668. [Google Scholar] [CrossRef]
  181. Fernández, M.F.C.; Manosalva, I.R.C.; Quintero, R.F.C.; Marín, C.E.M.; Cuesta, Y.E.D.; Mahecha, D.E.; Vásquez, P.A.P. Multitemporal Total Coliforms and Escherichia coli Analysis in the Middle Bogotá River Basin, 2007–2019. Sustainability 2022, 14, 1769. [Google Scholar] [CrossRef]
  182. Kim, K.Y.; Ndabambi, M.; Choi, S.; Oh, J.e. Legacy and Novel Perfluoroalkyl and Polyfluoroalkyl Substances in Industrial Wastewater and the Receiving River Water: Temporal Changes in Relative Abundances of Regulated Compounds and Alternatives. Water Res. 2021, 191, 116830. [Google Scholar] [CrossRef]
  183. Fenton, S.E.; Ducatman, A.M.; Boobis, A.R.; DeWitt, J.C.; Lau, C.; Ng, C.A.; Smith, J.S.; Roberts, S.M. Per- and Polyfluoroalkyl Substance Toxicity and Human Health Review: Current State of Knowledge and Strategies for Informing Future Research. Environ. Toxicol. Chem. 2020, 40, 606–630. [Google Scholar] [CrossRef]
  184. Ruíz-Ordóñez, D.M.; Solano-Correa, Y.T.; Maysels, R.; Figueroa-Casas, A. Land-Use Dynamics and Water Quality in Andean Basins. Sustainability 2023, 15, 15965. [Google Scholar] [CrossRef]
  185. Kennish, M.J.; Townsend, A.R. Nutrient Enrichment and Estuarine Eutrophication1. Ecol. Appl. 2007, 17, S1–S2. [Google Scholar] [CrossRef]
  186. Ma, R.; Chen, Z.; Wang, B.; Xu, C.; Jia, Z.; Li, L.; Hu, J. Spatiotemporal Variations and Controlling Mechanism of Low Dissolved Oxygen in a Highly Urbanized Complex River System. J. Hydrol. Reg. Stud. 2024, 52, 101691. [Google Scholar] [CrossRef]
  187. Rixen, T.; Baum, A.; Sepryani, H.; Pohlmann, T.; Jose, C.; Samiaji, J. Dissolved Oxygen and Its Response to Eutrophication in a Tropical Black Water River. J. Environ. Manag. 2010, 91, 1730–1737. [Google Scholar] [CrossRef]
  188. Rabalais, N.N.; Díaz, R.J.; Levin, L.A.; Turner, R.E.; Gilbert, D.; Zhang, J. Dynamics and Distribution of Natural and Human-Caused Hypoxia. Biogeosciences 2010, 7, 585–619. [Google Scholar] [CrossRef]
  189. Cao, J.; Sun, Q.; Zhao, D.; Xu, M.; Shen, Q.; Wang, D.; Wang, Y.; Ding, S. A Critical Review of the Appearance of Black-Odorous Waterbodies in China and Treatment Methods. J. Hazard. Mater. 2019, 385, 121511. [Google Scholar] [CrossRef]
  190. Peña-Guzmán, C.A.; Soto, L.; Diaz, A. A proposal for redesigning the water quality network of the Tunjuelo River in Bogotá, Colombia through a spatio-temporal analysis. Resources 2019, 8, 64. [Google Scholar] [CrossRef]
  191. Martinez Castro, C.Y. Aplicabilidad de la Producción más Limpia (PML) y el Modelo de Economía Azul en las Cuencas del Río Bogotá; Repositorio UMNG; Universidad Militar Nueva Granada: Bogotá, Colombia, 2020. [Google Scholar]
  192. Giraldo, E.; Garzon, A. The potential for water hyacinth to improve the quality of Bogota River water in the Muña Reservoir: Comparison with the performance of waste stabilization ponds. Water Sci. Technol. 2002, 45, 103–110. [Google Scholar] [CrossRef]
  193. Peña-Guzmán, C.A.; Melgarejo, J.; Lopez-Ortiz, I.; Mesa, D.J. Simulation of infrastructure options for urban water management in two urban catchments in Bogotá, Colombia. Water 2017, 9, 858. [Google Scholar] [CrossRef]
  194. Sun, J.; Hu, S.; Sharma, K.R.; Keller-Lehmann, B.; Yuan, Z. An Efficient Method for Measuring Dissolved VOSCs in Wastewater Using GC-SCD with Static Headspace Technique. Water Res. 2014, 52, 208–217. [Google Scholar] [CrossRef]
  195. Khan, M.A.H.; Whelan, M.E.; Rhew, R.C. Analysis of Low Concentration Reduced Sulfur Compounds (RSCs) in Air: Storage Issues and Measurement by Gas Chromatography with Sulfur Chemiluminescence Detection. Talanta 2012, 88, 581–586. [Google Scholar] [CrossRef]
  196. Rabaud, N.E.; Ebeler, S.E.; Ashbaugh, L.L.; Flocchini, R.G. The Application of Thermal Desorption GC/MS with Simultaneous Olfactory Evaluation for the Characterization and Quantification of Odor Compounds from a Dairy. J. Agric. Food Chem. 2002, 50, 5139–5145. [Google Scholar] [CrossRef]
  197. Kim, Y.H.; Kim, K.H. A Novel Quantitation Approach for Maximizing Detectable Targets for Offensive/Volatile Odorants with Diverse Functional Groups by Thermal Desorption-Gas Chromatography-Mass Spectrometry. Sci. Rep. 2016, 6, 29248. [Google Scholar] [CrossRef]
  198. Conti, C.; Guarino, M.; Bacenetti, J. Measurements Techniques and Models to Assess Odor Annoyance: A Review. Environ. Int. 2019, 134, 105261. [Google Scholar] [CrossRef]
  199. Yu, W.; Lewis, N.S.; Gray, H.B.; Dalleska, N.F. Isotopically Selective Quantification by UPLC-MS of Aqueous Ammonia at Submicromolar Concentrations Using Dansyl Chloride Derivatization. Acs Energy Lett. 2020, 5, 1532–1536. [Google Scholar]
  200. Leifer, I.; Melton, C.; Tratt, D.M.; Buckland, K.N.; Chang, C.S.; Clarisse, L.; Franklin, M.; Hall, J.L.; Leen, J.B.; Lundquist, T.J.; et al. Estimating Exposure to Hydrogen Sulfide from Animal Husbandry Operations Using Satellite Ammonia as a Proxy: Methodology Demonstration. Sci. Total Environ. 2019, 709, 134508. [Google Scholar]
  201. Noppen, L.; Clarisse, L.; Tack, F.; Ruhtz, T.; Merlaud, A.; Damme, M.V.; Roozendael, M.V.; Schuettemeyer, D.; Coheur, P.F. Constraining Industrial Ammonia Emissions Using Hyperspectral Infrared Imaging. Remote. Sens. Environ. 2023, 291, 113559. [Google Scholar] [CrossRef]
  202. Zhu, X.; Roberts, W.L.; Guiberti, T.F. UV-visible Chemiluminescence Signature of Laminar Ammonia-Hydrogen-Air Flames. Proc. Combust. Inst. 2022, 39, 4227–4235. [Google Scholar] [CrossRef]
  203. Yang, W.; Que, H.; Wang, S.; Zhu, A.; Zhang, Y.; He, Y.; Xin, X.; Zhang, X.; Ding, S. High Temporal Resolution Measurements of Ammonia Emissions Following Different Nitrogen Application Rates from a Rice Field in the Taihu Lake Region of China. Environ. Pollut. 2019, 257, 113489. [Google Scholar] [CrossRef]
  204. Humbert, K.; Debret, M.; Morin, C.; Cosme, J.; Portet-Koltalo, F. Direct Thermal Desorption-Gas Chromatography-Tandem Mass Spectrometry versus Microwave Assisted Extraction and GC-MS for the Simultaneous Analysis of Polyaromatic Hydrocarbons (PAHs, PCBs) from Sediments. Talanta 2022, 250, 123735. [Google Scholar]
  205. Martin, N.J.; Smith, P.A.; Brown, C.W.; Achee, N.L.; DeLong, G.T. Dichlorodiphenyltrichloroethane Determination in Air by Thermal Desorption Gas Chromatography-Mass Spectrometry. Pest Manag. Sci. 2012, 68, 1360–1367. [Google Scholar]
  206. Saji, S.; Lu, H.; Lu, Z.; Carroll, A.J.; Yin, Z. An Experimentally Verified LC-MS Protocol toward an Economical, Reliable, and Quantitative Isotopic Analysis in Nitrogen Reduction Reactions. Small Methods 2021, 5, e2000694. [Google Scholar]
  207. Joo, K.M.; Shin, M.; Jung, J.h.; Kim, B.M.; Lee, J.W.; Jeong, H.J.; Lim, K.M. Determination of N-nitrosodiethanolamine, NDELA in Cosmetic Ingredients and Products by Mixed Mode Solid Phase Extraction and UPLC-tandem Mass Spectrometry with Porous Graphitic Carbon Column through Systemic Sample Pre-Cleanup Procedure. Talanta 2015, 137, 109–119. [Google Scholar]
  208. da Silveira Petruci, J.F.; Wilk, A.; Cardoso, A.A.; Mizaikoff, B. Online analysis of H2S and SO2 via advanced mid-infrared gas sensors. Anal. Chem. 2015, 87, 9605–9611. [Google Scholar]
  209. Dong, F.; Junaedi, C.; Roychoudhury, S.; Gupta, M.X. Rapid, Online Quantification of H2S in JP-8 Fuel Reformate Using near-Infrared Cavity-Enhanced Laser Absorption Spectroscopy. Anal. Chem. 2011, 83, 4132–4136. [Google Scholar] [CrossRef]
  210. de Cumis, M.S.; Viciani, S.; Borri, S.; Patimisco, P.; Sampaolo, A.; Scamarcio, G.; Natale, P.D.; D’Amato, F.; Spagnolo, V. Widely-Tunable Mid-Infrared Fiber-Coupled Quartz-Enhanced Photoacoustic Sensor for Environmental Monitoring. Opt. Express 2014, 22, 28222–28231. [Google Scholar] [CrossRef]
  211. Zhang, H.; Wang, Z.; Wang, Q.; Borri, S.; Galli, I.; Sampaolo, A.; Patimisco, P.; Spagnolo, V.; Natale, P.D.; Ren, W. Parts-per-Billion-Level Detection of Hydrogen Sulfide Based on Doubly Resonant Photoacoustic Spectroscopy with Line-Locking. Photoacoustics 2022, 29, 100436. [Google Scholar] [CrossRef]
  212. Kamp, J.N.; Chowdhury, A.; Adamsen, A.P.S.; Feilberg, A. Negligible Influence of Livestock Contaminants and Sampling System on Ammonia Measurements with Cavity Ring-down Spectroscopy. Atmos. Meas. Tech. 2018, 12, 2837–2850. [Google Scholar] [CrossRef]
  213. Ceballos, S.; Sala, A.; Gil, S.; Rodríguez-Nuévalos, S.; Costero, A.M.; Doménech, A. Chemical and Electrochemical Behaviour of 4,4′,4″,4‴-Tetrakis(Dimethylamino)-Tetraphenylethylene in an Oxidant Environment: Toward a New Sensor for NO2 and SO2 in Gas Phase. Sensors Actuators B Chem. 2020, 311, 127929. [Google Scholar] [CrossRef]
  214. Hall, J.R.; Schoenfisch, M.H. Direct Electrochemical Sensing of Hydrogen Sulfide without Sulfur Poisoning. Anal. Chem. 2018, 90, 5194–5200. [Google Scholar] [CrossRef]
  215. Balasubramani, V.; Chandraleka, S.; Rao, T.S.; Sasikumar, R.; Kuppusamy, M.R.; Sridhar, T.M. Review—Recent Advances in Electrochemical Impedance Spectroscopy Based Toxic Gas Sensors Using Semiconducting Metal Oxides. J. Electrochem. Soc. 2020, 167, 037572. [Google Scholar] [CrossRef]
  216. Lawrence, N.S.; Jiang, L.; Jones, T.G.J.; Compton, R.G. A Thin-Layer Amperometric Sensor for Hydrogen Sulfide: The Use of Microelectrodes to Achieve a Membrane-Independent Response for Clark-type Sensors. Anal. Chem. 2003, 75, 2499–2503. [Google Scholar] [CrossRef]
  217. Hayward, T.; Thurbide, K.B. Quenching-Resistant Multiple Micro-Flame Photometric Detector for Gas Chromatography. Anal. Chem. 2009, 81, 8858–8867. [Google Scholar] [CrossRef]
  218. Ni, L.; Li, S.; Ding, K.; Geng, X.; Duan, C.f.; Guan, Y. Enhancement of Chemiluminescence Intensity of S2* in Non-Premixed Hydrogen Microjet Flame in the Photometric Detector for Sulfur Detection. Anal. Chem. 2021, 93, 1969–1975. [Google Scholar] [CrossRef]
  219. Kendler, S.; Reidy, S.M.; Lambertus, G.R.; Sacks, R.D. Ultrafast Gas Chromatographic Separation of Organophosphor and Organosulfur Compounds Utilizing a Microcountercurrent Flame Photometric Detector. Anal. Chem. 2006, 78, 6765–6773. [Google Scholar] [CrossRef]
  220. Pandey, S.K.; Kim, K.H. The Fundamental Properties of the Direct Injection Method in the Analysis of Gaseous Reduced Sulfur by Gas Chromatography with a Pulsed Flame Photometric Detector. Anal. Chim. Acta 2008, 615, 165–173. [Google Scholar] [CrossRef]
  221. Vargas-Muñoz, M.; Morales, J.; Cerdà, V.; Ferrer, L.; Palacio, E. Paper Sensor-Based Method Using a Portable 3D-printed Platform and Smartphone-Assisted Colorimetric Detection for Ammonia and Sulfide Monitoring in Anaerobic Digesters and Wastewater. Microchem. J. 2023, 188, 108469. [Google Scholar] [CrossRef]
  222. Escobedo, P.; Ramos-Lorente, C.E.; Ejaz, A.; Erenas, M.M.; Martínez-Olmos, A.; Carvajal, M.A.; Garcia-Núñez, C.; de Orbe-Payá, I.; Capitán-Vallvey, L.F.; Palma, A.J. QRsens: Dual-purpose Quick Response Code with Built-in Colorimetric Sensors. Sensors Actuators B Chem. 2022, 376, 133001. [Google Scholar] [CrossRef]
  223. Gao, Z.; Tang, D.; Tang, D.; Niessner, R.; Knopp, D. Target-Induced Nanocatalyst Deactivation Facilitated by Core@shell Nanostructures for Signal-Amplified Headspace-Colorimetric Assay of Dissolved Hydrogen Sulfide. Anal. Chem. 2015, 87, 10153–10160. [Google Scholar] [CrossRef]
  224. Amirjani, A.; Fatmehsari, D.H. Colorimetric Detection of Ammonia Using Smartphones Based on Localized Surface Plasmon Resonance of Silver Nanoparticles. Talanta 2018, 176, 242–246. [Google Scholar] [CrossRef]
  225. Shaik, R.; Kampara, R.K.; Kumar, A.; Sharma, C.S.; Kumar, M. Metal oxide nanofibers based chemiresistive H2S gas sensors. Coord. Chem. Rev. 2022, 471, 214752. [Google Scholar] [CrossRef]
  226. Kumar, A.; Kumar, A.; Kwoka, M.; Gang, M.; Kumar, M. IoT-enabled surface-active Pd-anchored metal oxide chemiresistor for H2S gas detection. Sensors Actuators B Chem. 2024, 402, 135065. [Google Scholar] [CrossRef]
  227. Pourrahmani, H.; Javadi, A.; Monazzah, A.M.H.; Herle, J.V. Real-time H2S detection kit for hydrogen fuel cell. Heliyon 2024, 10, e33321. [Google Scholar] [CrossRef]
  228. Ali, F.I.; Awwad, F.; Greish, Y.E.; Mahmoud, S.T. Hydrogen sulfide (H2S) gas sensor: A review. IEEE Sensors J. 2018, 19, 2394–2407. [Google Scholar] [CrossRef]
  229. Gutiérrez, J.; Horrillo, M.C. Advances in artificial olfaction: Sensors and applications. Talanta 2014, 124, 95–105. [Google Scholar] [CrossRef]
  230. Chen, Z.; Chen, Z.; Song, Z.; Ye, W.; Fan, Z. Smart Gas Sensor Arrays Powered by Artificial Intelligence. J. Semicond. 2019, 40, 111601. [Google Scholar]
  231. Chen, J.; Chen, Z.; Boussaid, F.; Zhang, D.; Pan, X.; Zhao, H.; Bermak, A.; Tsui, C.Y.; Wang, X.; Fan, Z. Ultra-Low-Power Smart Electronic Nose System Based on Three-Dimensional Tin Oxide Nanotube Arrays. ACS Nano 2018, 12, 6079–6088. [Google Scholar]
  232. Moshayedi, A.J.; Sohail Khan, A.; Hu, J.; Nawaz, A.; Zhu, J. E-Nose-Driven Advancements in Ammonia Gas Detection: A Comprehensive Review from Traditional to Cutting-Edge Systems in Indoor to Outdoor Agriculture. Sustainability 2023, 15, 11601. [Google Scholar] [CrossRef]
  233. Chen, Y.; Zhang, D.; Tang, M.; Wang, Z. Deep Learning-Assisted Colorimetric/Electrical Dual-Sensing System for Ultrafast Detection of Hydrogen Sulfide. ACS Sens. 2024, 9, 2000–2009. [Google Scholar] [CrossRef]
  234. Jornet-Martínez, N.; Hakobyan, L.; Argente-García, A.I.; Molins-Legua, C.; Campíns-Falcó, P. Nylon-Supported Plasmonic Assay Based on the Aggregation of Silver Nanoparticles: In Situ Determination of Hydrogen Sulfide-like Compounds in Breath Samples as a Proof of Concept. ACS Sens. 2019, 4, 2164–2172. [Google Scholar] [CrossRef]
  235. Pla-Tolós, J.; Moliner-Martínez, Y.; Verdú-Andrés, J.; Casanova-Chafer, J.; Molins-Legua, C.; Campíns-Falcó, P. New Optical Paper Sensor for in Situ Measurement of Hydrogen Sulphide in Waters and Atmospheres. Talanta 2016, 156–157, 79–86. [Google Scholar]
  236. Okamoto, J.; Matsubara, T.C.M.; Kitagawa, T.; Umeda, T. Determination of a Sulfur-Containing Drug in Human Plasma by an Improved Method for Sulfur Chemiluminescence Detection in Combination with Capillary Gas Chromatography. Anal. Chem. 2000, 72, 634–638. [Google Scholar]
  237. Siebert, T.E.; Solomon, M.; Pollnitz, A.P.; Jeffery, D.W. Selective Determination of Volatile Sulfur Compounds in Wine by Gas Chromatography with Sulfur Chemiluminescence Detection. J. Agric. Food Chem. 2010, 58, 9454–9462. [Google Scholar] [CrossRef]
  238. García, C.L.; Becchi, M.; Grenier-loustalot, M.F.; Païsse, O.; Szymanski, R. Analysis of Aromatic Sulfur Compounds in Gas Oils Using GC with Sulfur Chemiluminescence Detection and High-Resolution MS. Anal. Chem. 2002, 74, 3849–3857. [Google Scholar]
  239. Nolvachai, Y.; Kulsing, C.; Marriott, P.J. Pesticides Analysis: Advantages of Increased Dimensionality in Gas Chromatography and Mass Spectrometry. Crit. Rev. Environ. Sci. Technol. 2015, 45, 2135–2173. [Google Scholar]
  240. Sapozhnikova, Y.; Lehotay, S.J. Review of Recent Developments and Applications in Low-Pressure (Vacuum Outlet) Gas Chromatography. Anal. Chim. Acta 2015, 899, 13–22. [Google Scholar]
  241. Dymerski, T. Two-Dimensional Gas Chromatography Coupled with Mass Spectrometry in Food Analysis. Crit. Rev. Anal. Chem. 2018, 48, 252–278. [Google Scholar]
  242. Kauna-Czaplińska, J. Current Applications of Gas Chromatography/Mass Spectrometry in the Study of Organic Acids in Urine. Crit. Rev. Anal. Chem. 2011, 41, 114–123. [Google Scholar]
  243. Wu, H.; Dong, L.; Zheng, H.; Yu, Y.; Ma, W.; Zhang, L.; Yin, W.; Xiao, L.; Jia, S.; Tittel, F.K. Beat Frequency Quartz-Enhanced Photoacoustic Spectroscopy for Fast and Calibration-Free Continuous Trace-Gas Monitoring. Nat. Commun. 2017, 8, 15331. [Google Scholar]
  244. Yang, Z.L.; Lin, H.; Montano, B.A.Z.; Zhu, W.; Zhong, Y.; Yuan, B.; Yu, J.; Kan, R.; Shao, M.; Zheng, H. High-Power near-Infrared QEPAS Sensor for Ppb-Level Acetylene Detection Using a 28 kHz Quartz Tuning Fork and 10 W EDFA. Opt. Express 2022, 30, 6320–6331. [Google Scholar]
  245. Zhu, C.; Yang, G.; Li, H.; Du, D.; Lin, Y. Electrochemical Sensors and Biosensors Based on Nanomaterials and Nanostructures. Anal. Chem. 2014, 87, 230–249. [Google Scholar]
  246. Bogomolova, A.; Komarova, E.S.; Reber, K.; Gerasimov, T.; Yavuz, Ö.; Bhatt, S.; Aldissi, M. Challenges of Electrochemical Impedance Spectroscopy in Protein Biosensing. Anal. Chem. 2009, 81, 3944–3949. [Google Scholar] [CrossRef]
  247. Thurbide, K.B.; Anderson, C.D. Flame Photometric Detection inside of a Capillary Gas Chromatography Column. Analyst 2003, 128, 616–622. [Google Scholar]
  248. Lackner, M. Tunable Diode Laser Absorption Spectroscopy (Tdlas) in the Process Industries—A Review. Rev. Chem. Eng. 2007, 23, 147–165. [Google Scholar] [CrossRef]
  249. Lin, S.; Chang, J.; Sun, J.; Xu, P.F. Improvement of the Detection Sensitivity for Tunable Diode Laser Absorption Spectroscopy: A Review. Front. Phys. 2022, 10, 853966. [Google Scholar] [CrossRef]
  250. Martínez-Aviñó, A.; Molins-Legua, C.; Pilar, C.F. Scaling the Analytical Information given by Several Types of Colorimetric and Spectroscopic Instruments Including Smartphones: Rules for Their Use and Establishing Figures of Merit of Solid Chemosensors. Anal. Chem. 2021, 93, 6043–6052. [Google Scholar] [CrossRef]
  251. Kleine, D.; Mürtz, M.; Lauterbach, J.; Dahnke, H.; Urban, W.; Hering, P.; Kleinermanns, K. Atmospheric Trace Gas Analysis with Cavity Ring-down Spectroscopy. Isr. J. Chem. 2001, 41, 111–116. [Google Scholar] [CrossRef]
  252. Sommer, S.G.; Misselbrook, T.H. A Review of Ammonia Emission Measured Using Wind Tunnels Compared with Micrometeorological Techniques. Soil Use Manag. 2016, 32, 101–108. [Google Scholar]
  253. Ellis, R.; Murphy, J.G.; Pattey, E.; van Haarlem, R.P.; O’brien, J.; Herndon, S.C. Characterizing a Quantum Cascade Tunable Infrared Laser Differential Absorption Spectrometer (QC-TILDAS) for Measurements of Atmospheric Ammonia. Atmos. Meas. Tech. 2009, 3, 397–406. [Google Scholar]
  254. Pan, Y.; Gu, M.; Song, L.; Tian, S.; Wu, D.; Walters, W.W.; Yu, X.; Lü, X.; Ni, X.; Wang, Y.J.; et al. Systematic Low Bias of Passive Samplers in Characterizing Nitrogen Isotopic Composition of Atmospheric Ammonia. Atmos. Res. 2020, 243, 105018. [Google Scholar]
  255. Almenglo, F.; González-Cortés, J.; Ramírez, M.; Cantero, D. Recent advances in biological technologies for anoxic biogas desulfurization. Chemosphere 2023, 321, 138084. [Google Scholar]
  256. Babamohammadi, S.; Shamiri, A.; Aroua, M. A Review of CO2 Capture by Absorption in Ionic Liquid-Based Solvents. Rev. Chem. Eng. 2015, 31, 383–412. [Google Scholar]
  257. Mugwili, M.E.; Waanders, F.B.; Masindi, V.; Fosso-Kankeu, E. An update on sustainabilities and challenges on the removal of ammonia from aqueous solutions: A state-of-the-art review. J. Environ. Manag. 2023, 347, 119172. [Google Scholar]
  258. Zulkifli, M.; Hasan, H.A.; Abdullah, S.R.S.; Muhamad, M.H. A review of ammonia removal using a biofilm-based reactor and its challenges. J. Environ. Manag. 2022, 315, 115162. [Google Scholar]
  259. Winkler, M.K.; Straka, L. New directions in biological nitrogen removal and recovery from wastewater. Curr. Opin. Biotechnol. 2019, 57, 50–55. [Google Scholar] [CrossRef] [PubMed]
  260. Aminuddin, M.S.; Bustam, M.A.; Johari, K. Latest Technological Advances and Insights into Capture and Removal of Hydrogen Sulfide: A Critical Review. RSC Sustain. 2024, 2, 757–803. [Google Scholar] [CrossRef]
  261. Wang, M.; Lawal, A.; Stephenson, P.; Sidders, J.; Ramshaw, C. Post-Combustion CO2 Capture with Chemical Absorption: A State-of-the-Art Review. Chem. Eng. Res. Des. 2011, 89, 1609–1624. [Google Scholar] [CrossRef]
  262. Kohl, A.L.; Nielsen, R.B. Chapter 14—Physical Solvents for Acid Gas Removal. In Gas Purification, 5th ed.; Kohl, A.L., Nielsen, R.B., Eds.; Gulf Professional Publishing: Houston, TX, USA, 1997; pp. 1187–1237. [Google Scholar]
  263. Liu, X.; Wang, B.; Lv, X.; Meng, Q.; Li, M. Enhanced Removal of Hydrogen Sulfide Using Novel Nanofluid System Composed of Deep Eutectic Solvent and Cu Nanoparticles. J. Hazard. Mater. 2021, 405, 124271. [Google Scholar] [CrossRef]
  264. Kohl, A.L.; Nielsen, R.B. Chapter 2—Alkanolamines for Hydrogen Sulfide and Carbon Dioxide Removal. In Gas Purification, 5th ed.; Kohl, A.L., Nielsen, R.B., Eds.; Gulf Professional Publishing: Houston, TX, USA, 1997; pp. 40–186. [Google Scholar]
  265. Kouser, S.; Waghmare, U.V.; Tit, N. Adsorption and Splitting of H2S on 2D-ZnO1−xNy: First-Principles Analysis. Phys. Chem. Chem. Phys. PCCP 2014, 16, 10719–10726. [Google Scholar] [CrossRef]
  266. Ahmadi, R.; Alivand, M.S.; Haj Mohammad Hossein Tehrani, N.; Ardjmand, M.; Rashidi, A.; Rafizadeh, M.; Seif, A.; Mollakazemi, F.; Noorpoor, Z.; Rudd, J. Preparation of Fiber-like Nanoporous Carbon from Jute Thread Waste for Superior CO2 and H2S Removal from Natural Gas: Experimental and DFT Study. Chem. Eng. J. 2021, 415, 129076. [Google Scholar] [CrossRef]
  267. Wang, S.; Nam, H.; Nam, H. Preparation of Activated Carbon from Peanut Shell with KOH Activation and Its Application for H2S Adsorption in Confined Space. J. Environ. Chem. Eng. 2020, 8, 103683. [Google Scholar] [CrossRef]
  268. He, X.; Kumakiri, I.; Hillestad, M. Conceptual Process Design and Simulation of Membrane Systems for Integrated Natural Gas Dehydration and Sweetening. Sep. Purif. Technol. 2020, 247, 116993. [Google Scholar] [CrossRef]
  269. Liu, Y.; Liu, Z.; Liu, G.; Qiu, W.; Bhuwania, N.; Chinn, D.; Koros, W.J. Surprising Plasticization Benefits in Natural Gas Upgrading Using Polyimide Membranes. J. Membr. Sci. 2020, 593, 117430. [Google Scholar] [CrossRef]
  270. Sassi, M.; Gupta, A.K. Sulfur Recovery from Acid Gas Using the Claus Process and High Temperature Air Combustion (HiTAC) Technology. Am. J. Environ. Sci. 2008, 4, 502–511. [Google Scholar] [CrossRef]
  271. Piéplu, A.; Saur, O.; Lavalley, J.C.; Legendre, O.; Nédez, C. Claus Catalysis and H2S Selective Oxidation. Catal. Rev. 1998, 40, 409–450. [Google Scholar]
  272. George, Z.M. Advances in Claus Reaction and Related Reactions. Phosphorus Sulfur Relat. Elem. 1976, 1, 315–322. [Google Scholar] [CrossRef]
  273. de Angelis, A.; Bellussi, G.; Pollesel, P.; Perego, C. New Method for H2S Removal in Acid Solutions. ChemSusChem 2010, 3, 829–833. [Google Scholar] [PubMed]
  274. Zhang, X.; Xiong, W.; Shi, M.; Wu, Y.; Hu, X. Task-Specific Ionic Liquids as Absorbents and Catalysts for Efficient Capture and Conversion of H2S into Value-Added Mercaptan Acids. Chem. Eng. J. 2021, 408, 127866. [Google Scholar]
  275. Kennes, C.; Veiga, M.C.; Alloway, B.J.; Trevors, J.T. (Eds.) Bioreactors for Waste Gas Treatment; Environmental Pollution; Springer: Dordrecht, The Netherlands, 2001; Volume 4. [Google Scholar]
  276. Devinny, J.S.; Deshusses, M.A.; Webster, T.S. Biofiltration for Air Pollution Control, 1st ed.; CRC Press: Boca Raton, FL, USA, 2017. [Google Scholar]
  277. Iranpour, R.; Cox, H.H.; Deshusses, M.A.; Schroeder, E.D. Literature Review of Air Pollution Control Biofilters and Biotrickling Filters for Odor and Volatile Organic Compound Removal. Environ. Prog. 2005, 24, 254–267. [Google Scholar]
  278. Swanson, W.J.; Loehr, R.C. Biofiltration: Fundamentals, Design and Operations Principles, and Applications. J. Environ. Eng. 1997, 123, 538–546. [Google Scholar]
  279. Wani, A.H.; Lau, A.K.; Branion, R.M. Biofiltration Control of Pulping Odors—Hydrogen Sulfide: Performance, Macrokinetics and Coexistence Effects of Organo-Sulfur Species. J. Chem. Technol. Biotechnol. 1999, 74, 9–16. [Google Scholar] [CrossRef]
  280. Li, H.; Crittenden, J.C.; Mihelcic, J.R.; Hautakangas, H. Optimization of Biofiltration for Odor Control: Model Development and Parameter Sensitivity. Water Environ. Res. 2002, 74, 5–16. [Google Scholar]
  281. Alonso, C.; Suidan, M.T.; Kim, B.R.; Kim, B.J. Dynamic Mathematical Model for the Biodegradation of VOCs in a Biofilter: Biomass Accumulation Study. Environ. Sci. Technol. 1998, 32, 3118–3123. [Google Scholar]
  282. Alinezhad, E.; Haghighi, M.; Rahmani, F.; Keshizadeh, H.; Abdi, M.; Naddafi, K. Technical and economic investigation of chemical scrubber and bio-filtration in removal of H2S and NH3 from wastewater treatment plant. J. Environ. Manag. 2019, 241, 32–43. [Google Scholar] [CrossRef]
  283. Wi, J.; Lee, S.; Kim, E.; Lee, M.; Koziel, J.A.; Ahn, H. Evaluation of semi-continuous pit manure recharge system performance on mitigation of ammonia and hydrogen sulfide emissions from a swine finishing barn. Atmosphere 2019, 10, 170. [Google Scholar] [CrossRef]
  284. Castro, Y.E.; Viloria, A. New Trends for Hydrogen Sulfide Scavenging Using Natural Compounds as Biogenic Amines. ACS Omega 2024, 9, 10671–10679. [Google Scholar] [PubMed]
  285. Choudhury, A.; Lansing, S. Adsorption of hydrogen sulfide in biogas using a novel iron-impregnated biochar scrubbing system. J. Environ. Chem. Eng. 2021, 9, 104837. [Google Scholar]
  286. Fini, M.N.; Montesantos, N.; Maschietti, M.; Muff, J. Performance evaluation of membrane filtration for treatment of H2S scavenging wastewater from offshore oil and gas production. Sep. Purif. Technol. 2021, 277, 119641. [Google Scholar] [CrossRef]
  287. Vikrant, K.; Kailasa, S.K.; Tsang, D.C.; Lee, S.S.; Kumar, P.; Giri, B.S.; Singh, R.S.; Kim, K.H. Biofiltration of hydrogen sulfide: Trends and challenges. J. Clean. Prod. 2018, 187, 131–147. [Google Scholar] [CrossRef]
  288. Nhut, H.H.; Le, L.T. Removal of H2S in biogas using biotrickling filter: Recent development. Process Saf. Environ. Prot. 2020, 144, 297–309. [Google Scholar] [CrossRef]
  289. Khairulin, S.; Kerzhentsev, M.; Salnikov, A.; Ismagilov, Z.R. Direct selective oxidation of hydrogen sulfide: Laboratory, pilot and industrial tests. Catalysts 2021, 11, 1109. [Google Scholar] [CrossRef]
  290. Zhu, W.; Ye, H.; Zou, X.; Yang, Y.; Dong, H. Analysis and optimization for chemical absorption of H2S/CO2 system: Applied in a multiple gas feeds sweetening process. Sep. Purif. Technol. 2021, 276, 119301. [Google Scholar] [CrossRef]
  291. Jafarinejad, S. 5-control and treatment of air emissions. In Petroleum Waste Treatment and Pollution Control; Butterworth-Heinemann: Oxford, UK, 2017; pp. 149–183. [Google Scholar]
Figure 1. Simplified schematic representation of the pathways occurring in the microbial sulfur cycle. The diagram clearly illustrates key biochemical transformations within the sulfur cycle mediated by sulfate-reducing bacteria (SRB) and sulfur-oxidizing bacteria (SOB). Different oxidation states of sulfur—including hydrogen sulfide (H2S), elemental sulfur (S0), thiosulfate ion ( S 2 O 3 2 ), sulfite ion ( SO 3 2 ), and sulfate ion ( SO 4 2 )—are depicted, showing their interconnected transformations through oxidation and reduction reactions. Adapted from [75,76].
Processes 13 01077 g001
Figure 2. Simplified schematic representation of the microbial nitrogen cycle pathways. Blue arrows indicate reductive processes, and red arrows denote oxidative processes. Key nitrogen species depicted include atmospheric nitrogen (N2), ammonia (NH3), organic nitrogen (NH2 groups within proteins), nitrite ( NO 2 ), nitrate ( NO 3 ), and nitrous oxide (N2O). Representative microorganisms involved in specific transformations are provided, highlighting nitrogen fixation (e.g., Azotobacter, Rhizobium), nitrification (e.g., Nitrosomonas, Nitrobacter), denitrification (e.g., Pseudomonas), and anaerobic ammonium oxidation (Anammox, e.g., Brocadia). The diagram distinguishes between transformations occurring under oxic and anoxic conditions. Adapted from [105].
Processes 13 01077 g002
Figure 3. Summary of H2S elimination processes. (A) Adsorption [285], (B) membrane filtration [286], (C) biofiltration [287], (D) biopercolation [288], (E) liquid oxidation [289], (F) absorption [290], and (G) Claus Process [291].
Processes 13 01077 g003
Table 1. Comparison between emission sources.
CategoryExamples of SourcesMain Emitted GasesTypical Emission LevelsImpact on Air Quality
NaturalSwamps, wetlands, thermal springs, volcanic activity, anaerobic decompositionH2S, NH3, VSC (dimethyl sulfide, methyl mercaptan)0.00011–0.00033 ppm (H2S in wetland air); up to 7–8 ppm near geothermal sourcesLow to moderate; depends on environmental conditions
AnthropogenicWastewater treatment plants, agriculture (livestock, fertilizers), chemical industry, oil refineriesH2S, NH3, VSC, volatile organic compounds (VOCs)5–18 ppm (NH3 in pig farms); 200–1300 mg/m3 (H2S in wastewater treatment plants)High; contributes to strong odors in urban and rural areas
HybridRivers polluted by urban and industrial discharges, waste treatment in landfills, biogas productionH2S, NH3, VSC, gas mixtures depending on contaminationUp to 16 ppm NH3 in polluted rivers; VSC in tens of ppb in landfillsVariable; depends on pollution levels and proximity to emission sources
Table 2. Comparative summary of odor thresholds and safety of H2S in different countries based in their legislation.
ReferenceApplicationExposure Time/Concentration
Odor perception threshold in Toxicological profile AFTS [31]International reference0.0005 to 0.13 ppm
WHO guideline for tolerable concentration in airInternational reference150 µg/m3 (108 ppm)
Odor perception threshold in Spain NTP 320 [61]Spain0.0081 ppm
TA Luft Technical Instruction on Air Quality ControlGermany8 µg/m3 (0.006 ppm)
Air Quality GuideNew Zealand7 µg/m3 (0.005 ppm)
Maximum permissible level in Resolution 610 2010 [57]Colombia7 µg/m3 (0.005 ppm)
Maximum permissible level in Resolution 1541 de 2013 [58]Colombia1 h average exposure/30 µg/m3 (0.021 ppm)
24 h average exposure/7 µg/m3 (0.005 ppm)
Table 3. Seasonal patterns in VSC formation: dry season characteristics. This table summarizes studies on seasonal patterns in volatile sulfur compound (VSC) formation, highlighting dominant compounds, concentration ranges, and key formation factors observed specifically during the dry season.
StudyDominant VSCsConcentration RangesKey Formation Factors
[154]H2S, MeSHH2S: 7 to 39,000 g/m3Organic matter, pH, Fe content
[148]DMDS, DMSTotal VSCs: 561.89 mg/dry kg (summer)Higher ambient temperatures
[149]H2S, MTH2S: 361 ± 101 g/ton, MT: 82 ± 76 g/tonHigher ambient temperatures, aeration
[155]MTMT: 4 to 40 nM in sedimentAnaerobic mineralization, H2S concentration
[156]H2SMaximum 250 ppmHigher ambient temperatures
[157]DMS, C S 2 , DMDSDMS: 608.5 g/m3, C S 2 : 658.5 g/m3, DMDS: 857.8 g/m3Higher ambient temperatures
Table 4. This table summarizes primary VSC formation pathways, highlighting contributing factors, seasonal influences, and possible control measures associated with each mechanism.
Formation MechanismContributing FactorsSeasonal InfluenceControl Measures
Anaerobic degradationOrganic matter content, sulfate concentrationHigher in warmer seasonsAeration, chemical dosing
Methylation of H2SH2S concentration, methyl donorsTemperature dependentSulfide control, pH adjustment
Biological sulfate reductionSulfate concentration, organic substrateEnhanced in warmer temperaturesSulfate removal, bioaugmentation
Thermal decomposition of sulfur compoundsTemperature, sulfur-containing organicsMore significant in dry, hot seasonsTemperature control, feedstock management
Table 5. Comparative summary of traditional analytical detection technologies for odorous gases based on cost, sensitivity, and practicality.
MethodCostSensitivityPracticalityReferences
GC-SCDHigh120 ppt–2 ppbLaboratory-based, specialized equipment[64,194,195]
TD-GC-SCDHigh0.10–5.26 µg/m3Laboratory-based, broader VSC analysis[64]
TD-GC-MSHighTrace level (µg/m3 to sub-ppb)Laboratory-based, rapid, precise, integrated olfactory evaluation[157,196,197,204,205]
UPLC-MSHighSubmicromolar (below µM range)Laboratory based, rapid, accurate, ideal for complex samples[199,206,207]
Satellite Remote SensingModerate–HighIndirect NH3/H2S estimationLarge-scale coverage, good for regional assessments but indirect measurement[200,201]
UV-visible ChemiluminescenceModerate–HighHigh (ppb–ppm range)Specialized instrumentation, limited field portability[202]
Open-path Tunable Diode Laser AbsorptionModerate–HighHigh temporal resolution (ppb)Excellent field applicability, good temporal resolution, field deployable[203]
Air Dispersion ModelsModerateVariable (depends on input data)Computational approach, requires input data, useful for scenario modeling[198]
Table 6. Comparative summary of advanced optical and spectroscopic detection technologies for odorous gases based on cost, sensitivity, and practicality.
MethodCostSensitivityPracticalityReferences
Mid-infrared Sensor (Hollow Waveguide with UV)High~207 ppbv (H2S, SO2)Portable, rapid, suitable for simultaneous multi-gas detection[208]
Cavity-enhanced Near-infrared Laser Absorption SpectroscopyHighppbv levelFast response, minimal interference, precise for fuel streams[209]
Quartz-enhanced Photoacoustic Spectroscopy (QEPAS)High10–450 ppbUltra fast, highly sensitive, suitable for real-time analysis, minimal cross-interference[210,211]
Cavity Ring-Down Spectroscopy (CRDS)Highppb levelReal-time monitoring, highly sensitive, minimal VOC and humidity interference[212]
Table 7. Comparative summary of electrochemical sensors, colorimetric methods, and emerging detection technologies for odorous gases based on cost, sensitivity, and practicality.
Method CategoryMethodCostSensitivity (Detection Limit)PracticalityReferences
Electrochemical SensorsTriple-pulse amperometryModerate–Lowppb to ppm levelsPortable, rapid detection, resistant to sulfur poisoning[214]
Electrochemical impedance spectroscopyModerate–Lowppb levelsHighly sensitive, suitable for toxic gases, portable[215]
Flame Photometric Detectors (FPD)Multiple flame FPD (mFPD)High4 × 10−11 g S/sHigh sensitivity, resistant to interference[217]
Quartz rod-enhanced FPD (qFPD)High0.3–0.5 pg S/sExceptionally sensitive, stable signal[218]
Microcountercurrent FPD (microcc-FPD)High3 ng S/sUltrafast chromatographic separations, high precision[219]
Pulsed FPD (PFPD)High2.37–4.89 pgExcellent performance, stable at varying concentrations[220]
Colorimetric and Smartphone Methods3D-printed paper sensorsLowppm levels (NH3, H2S)Affordable, portable, suitable for rapid field analysis[221]
QR code-integrated sensors (QRsens)Lowppm levels (NH3, H2S)Quick field measurements, accessible via smartphones[222]
Nanocatalyst-enhanced assaysModerate–Low7.5 nM (H2S)Ultrasensitive, rapid response, field compatible[223]
Smartphone-based silver nanoparticlesLow200 mg/L (NH3)User friendly, portable[224]
Table 8. Comparative analysis of measurement techniques: applications, advantages, limitations, and color-coded effectiveness. A color-coded effectiveness column has been added. Green indicates high accuracy and sensitivity, making these methods especially suited for detecting low-concentration compounds. Orange represents moderate effectiveness, where methods may not reach the same low detection limits or selectivity but often offer practical benefits.
MethodologyWorking PrincipleApplicationAdvantagesLimitationsEffectiveness
GC-SCDGas chromatography coupled with sulfur chemiluminescence detection.H2S, VSCHigh selectivity and sensitivity in various matrices [236].Suitable for low concentrations [195].Requires advanced equipment prone to frequent maintenance and component corrosion [236].Non-linear responses at low concentrations for some compounds [195].High selectivity and sensitivity for sulfur-containing compounds; very low detection limits.
TD-GC-SCDGas chromatography with thermal desorption and chemiluminescence detection.H2S, VSCDetects a wide range of sulfur compounds [237].High sensitivity [64].For complex matrices like straight-run gas oils, high-resolution mass spectrometry may be necessary [238].Similar to GC-SCD, optimized for volatile compounds using thermal desorption; excellent for trace-level sulfur compounds.
GC-MSGas chromatography coupled with mass spectrometry.H2S, VSCQualitative and quantitative analysis capabilities [239].Suitable for odor studies with simultaneous olfactory evaluation [196].Long analysis times [240].Requires specialized equipment and expertise [241].Broad-spectrum identification and quantification; high precision.
TD-GC-MSGas chromatography with thermal desorption and mass spectrometry.H2S, VSCOptimized detection limits for trace volatile organic compounds [204].Short collection times [205].Susceptible to contamination risk [242].May be more affected by matrix effects than other methods [204].Enhanced sensitivity for highly volatile compounds; short sampling times.
Laser Spectroscopy (NIR, QEPAS)Measurement based on laser light interaction with gaseous compounds, enhancing sensitivity with optical cavities.H2S, NH3Real-time continuous monitoring [243].High sensitivity and low detection limits [210].Gas flow and temperature effects at high excitation powers [244]. Requires frequent calibration and long response times [243].Capable of ppb or sub-ppb detection in real time; ideal for continuous monitoring of one/few specific compounds.
Electrochemical Sensors (EIS, Amperometric)Based on detecting changes in current or impedance in response to gas presence.H2S, NH3Compact, portable, and cost-effective [245].Ease of operation and simplicity of construction [245].Sensitive to electrode contamination [246]. Potential for nonspecific impedance changes [246].Portable and inexpensive, but less accurate and prone to drift under complex conditions.
FPD and mFPD DetectorsBased on light emission from flames interacting with sulfur compounds.H2S, VSCHigh sensitivity for sulfur compounds [219].Low detection limits [219].Requires controlled combustion conditions, which can be challenging in unstable systems [247].Flame stability issues in certain environments [247].High sensitivity to sulfur species; excellent detection limits, though they require stable flame conditions.
UPLC-MSUltra-performance liquid chromatography coupled with mass spectrometry for NH3.NH3High precision for volatile nitrogenous compounds [206].Rapid analysis with high sensitivity [207].Detection of other compounds may obscure the detection of NH3 [207].Highly accurate for volatile nitrogen compounds (especially ammonia); very fast and sensitive. Less common for volatile sulfur.
TDLASTunable diode laser absorption spectroscopy to measure spectral absorption of specific gases.NH3, H2SHigh precision in monitoring continuous emissions [248].Suitable for harsh environmental conditions [248].Inherent sensitivity limitations due to infrared absorption principles [249].Excellent for continuous measurements, high sensitivity, robust in industrial environments.
Colorimetric Techniques and Smartphone DetectionColor changes induced by chemical reactions detected via optical platforms like smartphone cameras.NH3, H2SAffordable and portable technology [221].Suitable for rapid, low-cost measurements [221].Limited selectivity and detection limits compared to laboratory instruments [250].Detection limits ranging from 1 to 200 mg/L for NH3 and H2S [224].Very accessible and portable; lower selectivity and detection limits compared to advanced instrumentation.
CRDS (Cavity Ring-Down Spectroscopy)Laser absorption through multiple reflections in a closed cavity for NH3 and H2S analysis.NH3, H2SIdeal for real-time monitoring with high sensitivity [251].Excellent linearity over a wide range of NH3 concentrations [212].Slight humidity effects at extreme conditions [212].Highly sensitive real-time measurements; ideal for trace gases.
Wind Tunnels and Passive SamplersDevices that capture gases in open fields analyzed using dispersion models.NH3Cost-effective and easy to implement over large areas [252].High precision and fast response [253].Dependent on climatic conditions such as wind speed and temperature [252].May underestimate NH3 concentrations under low wind speed conditions [254].Useful to estimate emissions over large areas; heavily dependent on weather (wind speed, temperature). Less precise for low wind speeds.
Table 9. Comparative table between diverse H2S elimination techniques.
H2S Removal MethodPrincipleMedium UsedAdvantagesDisadvantages
AbsorptionRemoval through solubility or reaction capability in a liquid medium.Physical: sulfolane. Chemical: alkylamines.High efficiency in systems with high gas flow rates.Requires solvent regeneration.
AdsorptionSeparation by attachment to the surface of a solid through weak intermolecular interactions.Physical: activated carbon. Chemical: activated carbon impregnated with strong bases (NaOH, KOH).Low operating cost. Wide availability of adsorbents.Adsorbent saturation requires frequent replacement. Chemical adsorption implies additional costs.
Membrane SeparationSegregation by forcing passage through a porous membrane due to differences in solubility and diffusion.Polymeric membranes: polysulfones and polyamides,High modularity and ability to operate in remote areas. Low environmental impact.Lower efficiency compared to other methods. High installation costs.
Claus ProcessConversion to elemental sulfur through partial combustion and the catalytic reaction of resulting products.Oxygen, catalyst (Al2O3).High recovery of elemental sulfur.Requires controlled operating conditions. Secondary emissions need to be controlled.
Liquid Catalytic OxidationConversion to sulfuric acid in a liquid medium using an oxidizing agent and a catalyst.Oxidizing agent (O2), catalyst (Fe2O3).High selectivity and efficiency in liquid streams.Risk of corrosion. Difficult operation handling.
BiofilterConversion to sulfuric acid or elemental sulfur through aerobic biological oxidation by sulfur-oxidizing microorganisms.Packed-bed bioreactor.Eco-friendly and low operating cost. Low energy consumption.Sensitivity to environmental conditions. Requires constant monitoring. Can collapse.
BiopercolatorConversion to sulfuric acid or elemental sulfur through aerobic biological oxidation in a three-phase system.Packed-bed bioreactor.Improves biofilter efficiency by maintaining operating conditions.Complexity in design and operation. Requires liquid effluent management. Can collapse.
Disclaimer/Publisher’s Note: The statements, opinions and data contained in all publications are solely those of the individual author(s) and contributor(s) and not of MDPI and/or the editor(s). MDPI and/or the editor(s) disclaim responsibility for any injury to people or property resulting from any ideas, methods, instructions or products referred to in the content.

