Abstract
Drowsiness and stress greatly influence worker health and productivity and workplace safety. Conflict between workplace expectations and employee control results in stress, which causes mental and physical reactions that affect performance and raise the risk of accidents at work. A common precursor to inadvertent drowsiness increases workplace risks and costs due to lost productivity and accidents. Developments in the interdisciplinary subject of neuroergonomics enable the creation of novel systems to track and minimize these issues. This work introduces prototype testing to demonstrate the system’s ability to detect stress and drowsiness. Along with other indicators such as body temperature, heart rate (HR), and SpO2 levels, the system incorporates electroencephalography (EEG) and heart rate variability (HRV). By analyzing these biosignals, the system detects stress and drowsiness in real time, providing alerts to both users and the supervisor’s BI dashboard. The design is flexible, offering two wearable forms: a headband and an armband. Prototype testing demonstrates the system’s ability to detect stress and drowsiness effectively, paving the way for safer and more productive workplace environments.
1. Introduction
Stress can be defined as “the harmful physical and emotional responses that can result from conflicts between job demands on the employee and the amount of control an employee has over meeting these demands” [1]. Stress in the workplace has been revealed to have negative effects on employee health and performance and institutional profits [2], and it increases the number of job-related accidents [3,4,5]. Stress in the workplace has consequences for productivity, as found in several studies [6,7,8,9]. In addition to production and construction lines, many hospitals have investigated the impact of stress on health care staff [10,11,12]. Undeniable problems were highlighted during the COVID-19 outbreak, which include problems related to the mental health of health care staff; stress was one of the main mental issues that affected performance and increased the potential for medical mistakes [13,14,15,16,17]. Additionally, drowsiness, which refers to the early stages of sleeping or unintentional sleep at work, can have a negative impact on safety, productivity, and the education environment [18,19]. Statistics show that job-related accidents caused by sleeping at work cost up to USD 50 billion per year [20]. Moreover, serious workplace accidents and injuries are more likely to occur when people are drowsy due to sleep issues, including insomnia and sleep loss [21,22].
New non-invasive systems that can detect human biosignals have been made possible by developments in advanced engineering. These technologies enable organizations to better understand human behavior and improve working conditions and design by gathering and analyzing biological data. Furthermore, they allow scientists to study countless interpretations of human intentions as a form of controlling commands that are translated into machine actions.
In order to improve performance and lower risks, neuroergonomics combines ergonomics and neurology to obtain a deeper understanding of the human brain at work [23,24,25,26]. Neuroscience is a scientific field that studies the nervous system and human brain’s function and structure. Because it employs biosignals to investigate how people use technology in their daily lives and at work, neuroergonomics has grown into a significant area of study. The knowledge it provides aids in the creation of improved work environments that take into account both the physical and psychological components of human capabilities [27,28,29,30].
This work introduces a portable biosignal-based prototype of a system intended for monitoring stress and drowsiness that builds on previous research [31]. Along with other indicators such as body temperature, HR, and SpO2 levels, the system incorporates EEG and HRV. By analyzing these biosignals, the system detects stress and drowsiness in real time, providing alerts to both users’ and supervisors’ BI dashboards. The design is flexible, offering two wearable forms: a headband and an armband.
2. Overview
2.1. Stress- and Drowsiness-Related Biosignals
Stress and its related emotional and physical responses have been studied comprehensively over the years. There are central (brain and spinal cord) and peripheral parts in the human nervous system. Both somatic and autonomic components make up the peripheral system; the autonomic system regulates emotional states and physiological processes through its parasympathetic (relaxation) and sympathetic (stress reaction) branches [32,33]. Research has shown that stress and emotional signals can be measured from the human nervous system using both direct and indirect methods [34]. Skin response measures, heart activity, and brain imaging can all be used to track stress. According to scientific studies, human error rates are directly related to sleepiness, which is regulated by neurobiological processes [35].
2.1.1. Brain EEG
EEG measures voltage oscillations that fall into five frequency bands: delta (1–4 Hz), theta (4–8 Hz), alpha (8–12 Hz), beta (13–25 Hz), and gamma (>25 Hz). It records electrical activity from brain neurons along the scalp [36,37].
Hee Seo [33] found that there was a significant difference in the right prefrontal cortex in the beta (β)-band activity between two groups: stressed and unstressed. Brain electrical power activity increases with stress. This result is supported in [38,39,40]; recently, [41,42,43] showed that, in stress tasks, the beta-band increased while the alpha (α)-band decreased. In a recent study by Minguillon et al. [44], the scholars found that the ratio of the average power gamma divided by the average power theta and alpha, , increases with stress, allowing stress to be detected. In another study using the convolutional neural network, Joong proposed a device that detected and monitored stress over time [45]. As reported by Putman, the θ/β ratio moderately influences the effects of stress on attention [46].
The central nervous system has been utilized to study sleep stages; EEG is the most powerful tool for exploring the brain’s biosignals and patterns during sleep and before it in sleepiness/drowsiness.
Previous studies indicate that an increase or decrease in the brain’s waves/rhythms can predict drowsiness. Borghini, Shabani, and Ohsuga found that the EEG power in alpha, delta, and theta increased during mental fatigue and drowsiness in the frontal lobe [47,48]. The results presented by Nikhil and Agustina demonstrate that the power spectrum density (PSD) of alpha and theta rhythms is positively correlated with drowsiness [49,50]. Kaida et al. found that the alpha and theta PSD significantly increases with an increase in the Karolinska sleepiness scale (KSS) [51]. Recently, Mikito et al. used a single electrode at the prefrontal cortex to detect drowsiness and found the same results: that alpha and theta rhythms were increased [52]. Nguyen also found an increase in delta rhythms [53].
2.1.2. Heart Rate Variability (HRV)
Through the vagus nerve, the autonomic nervous system regulates heart function; stress causes parasympathetic suppression and sympathetic activation [54]. This changes under a physiological reaction called “fight-or-flight”, which leads to several changes in HR and HRV [55]. An increase in HRV is associated with positive emotions, while a decrease in HRV is related to negative emotions. HRV can be analyzed through time and frequency domains [34,56] using root mean square of the successive differences (RMSSD) calculations on the R-R intervals in ECG measurements, according to Equation (1) [57]:
HRV frequency domain analysis uses the LF/HF ratio (0.04–0.15 Hz/0.15–0.4 Hz). Research shows that stress decreases HRV as measured with the RMSSD (time domain), but increases the LF/HF ratio (frequency domain) [55,57,58,59,60,61,62,63,64,65,66,67].
Drowsiness can also be determined from HRV; Rodriguez et al. conducted an experiment on participants while they were driving in a real-world setting to identify signs of drowsiness and discovered a notable difference [68]. Shan Hu et al., M. Awais, and Furman reported a decrease in HRV LF/HF as subjects transitioned from awake to drowsy [69,70,71]. MURATA also reported that HRV (RRV3) increased under drowsy states [72]. Another study found a decrease in the time domain measures such as RMSSD at the beginning of drowsiness using KSS [73].
2.1.3. Other Physiological Indicators
Stress and drowsiness can also be determined using other physiological indicators such as the oxygen saturation level (SpO2), HR, and body temperature. Relaxation and decreased sympathetic nervous system activity are frequently linked to drowsiness; the HR decreases as a result and contrasts with that under stress responses [74]. A drop in SpO2 level can be associated with both stress and drowsiness due to hyperventilation [75]. In order to prepare for sleep, the hypothalamus, which controls body temperature, lowers the core temperature when drowsiness sets in [76,77,78].
3. Methodology: Conceptual and Algorithm Design
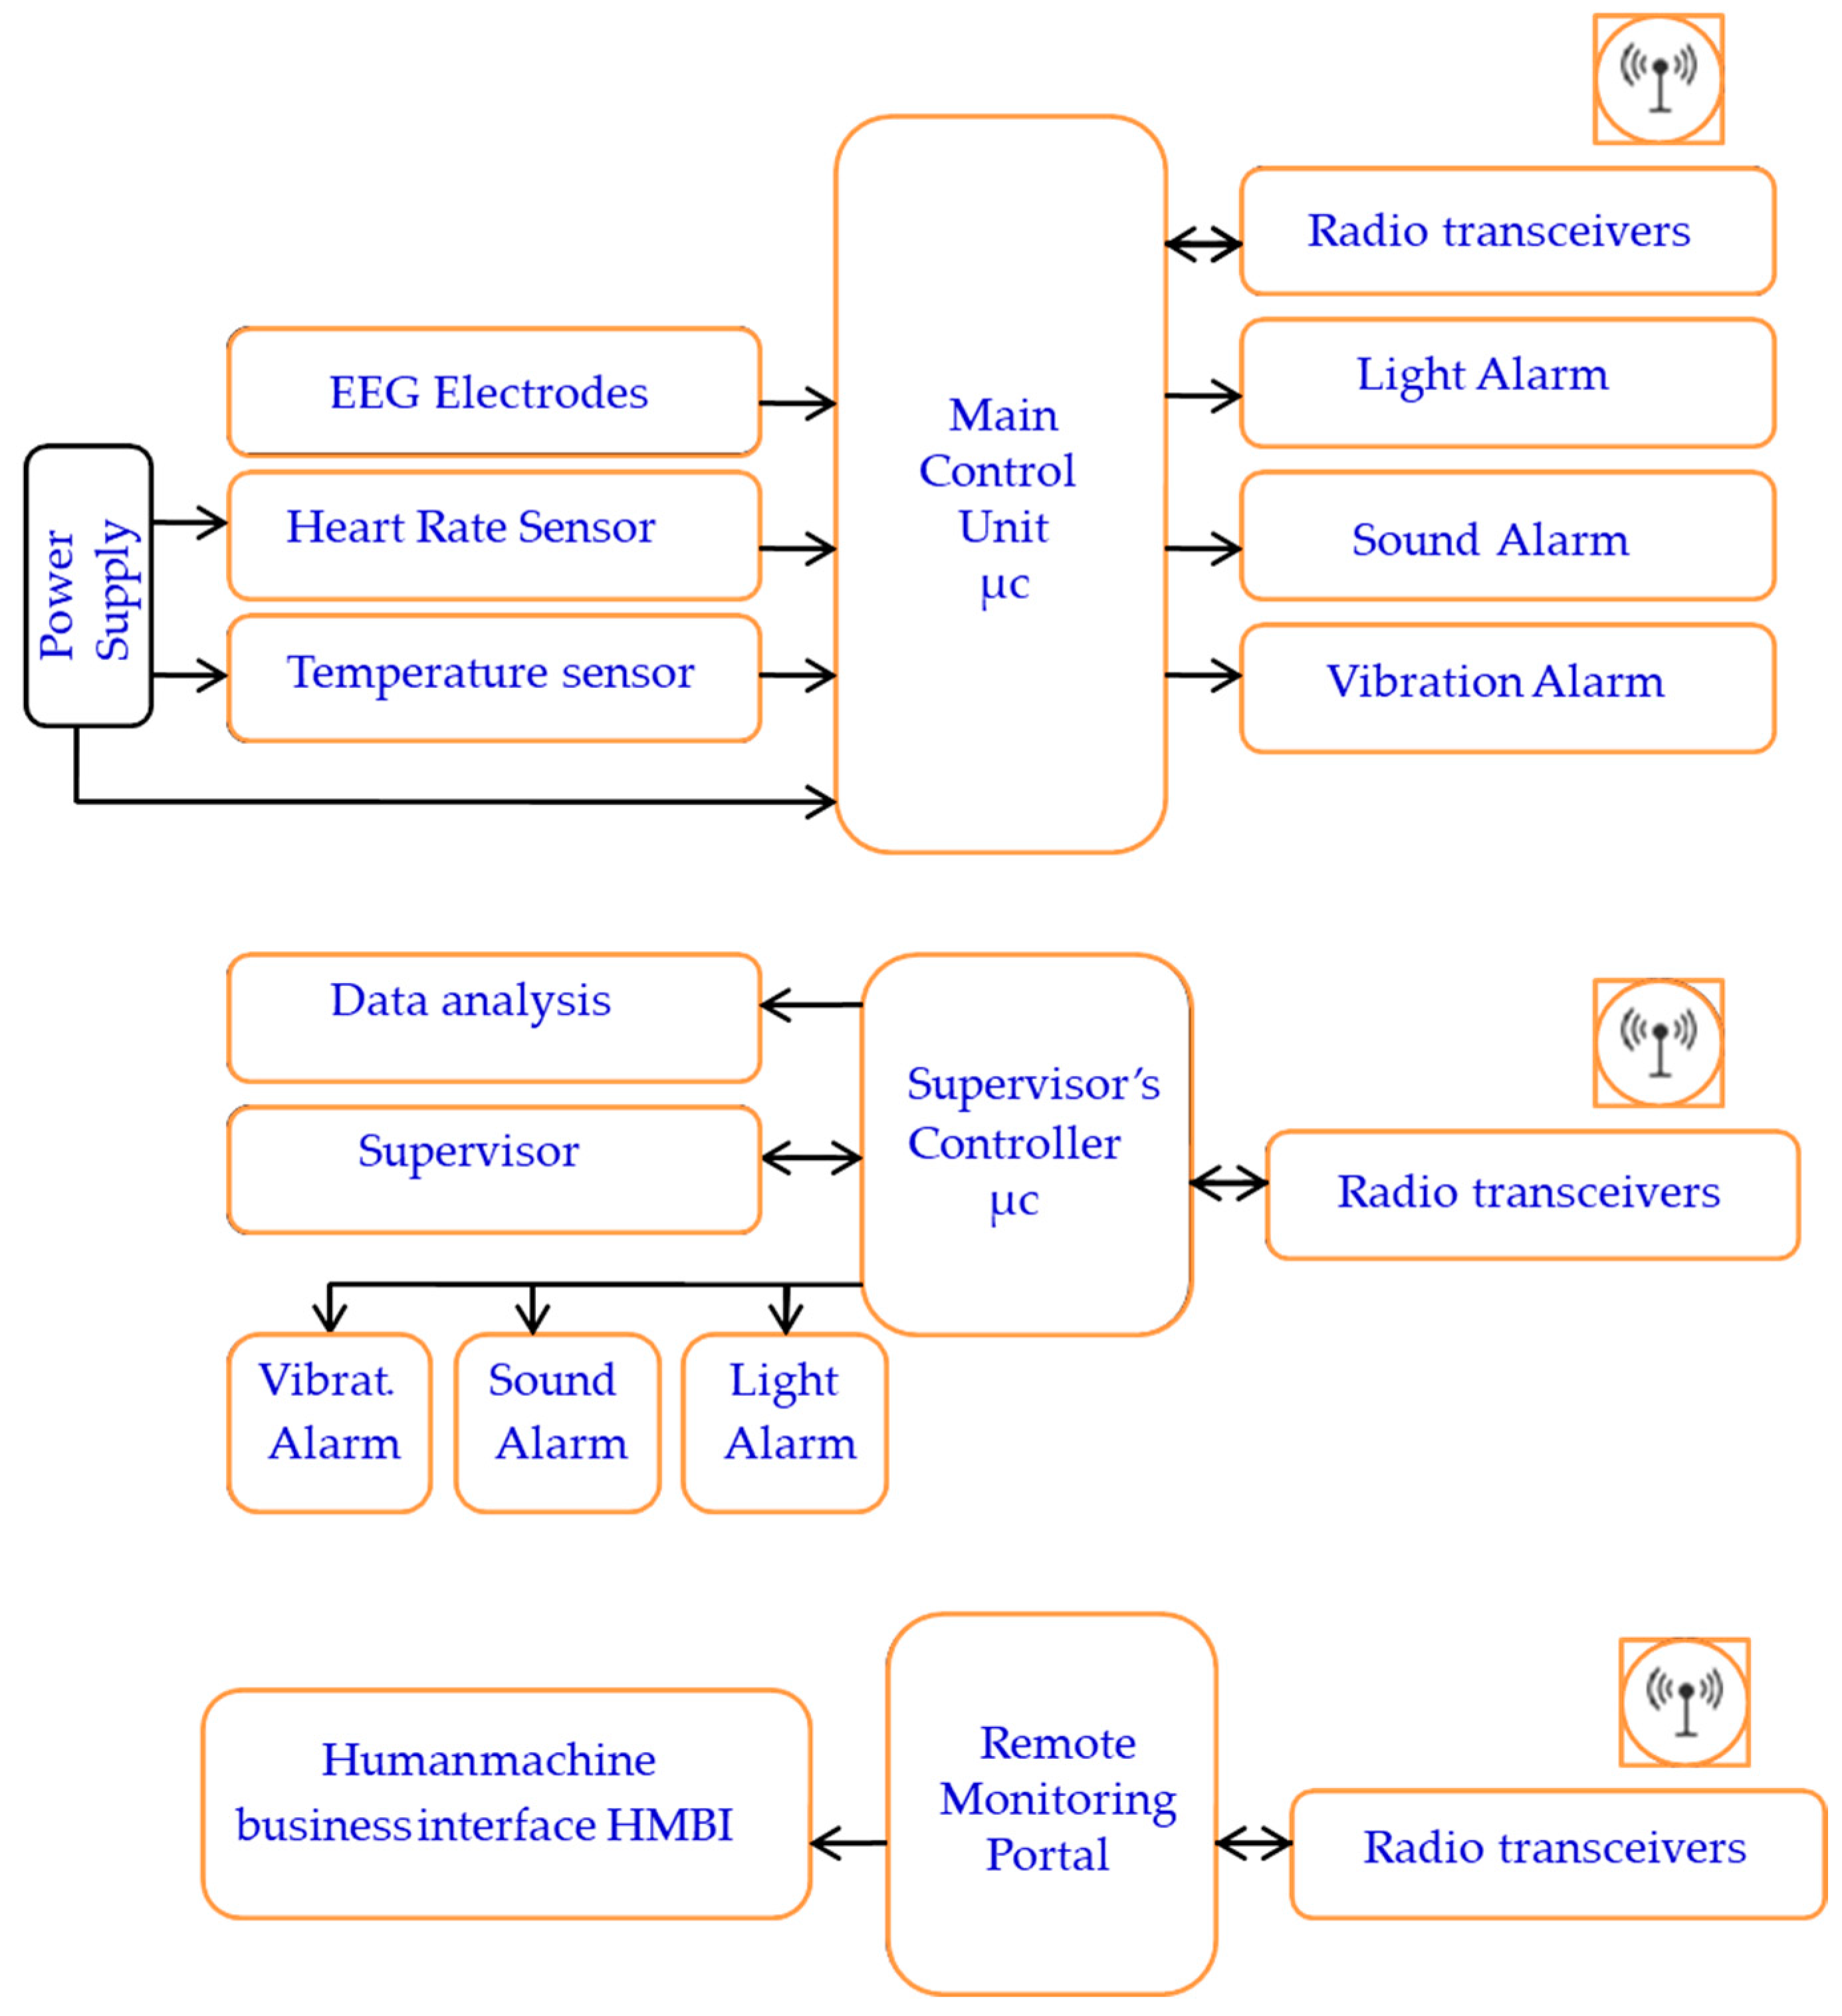
The portable system’s design, components, and configuration are shown in block diagrams and pictorial representations in Figure 1 and Figure 2. The working principle and algorithm flowchart are shown in Figure 3. The algorithm begins by assessing the worker’s current state through multiple measurements, starting with the HRV feature LF/HF. If this ratio falls outside the normal range of 1.5 ≤ LF/HF ≤ 3 [79,80], the algorithm proceeds to evaluate other stress and drowsiness features including RR intervals and the RMSSD. It then checks these values against established thresholds to confirm whether the worker is experiencing stress or drowsiness.
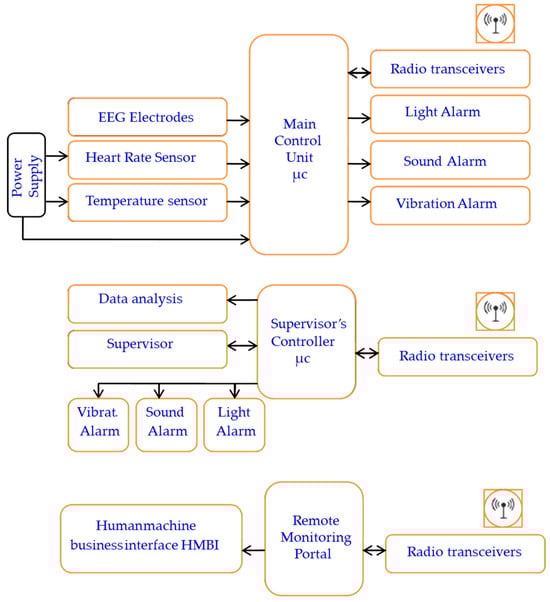
Figure 1.
The system block diagram representation.
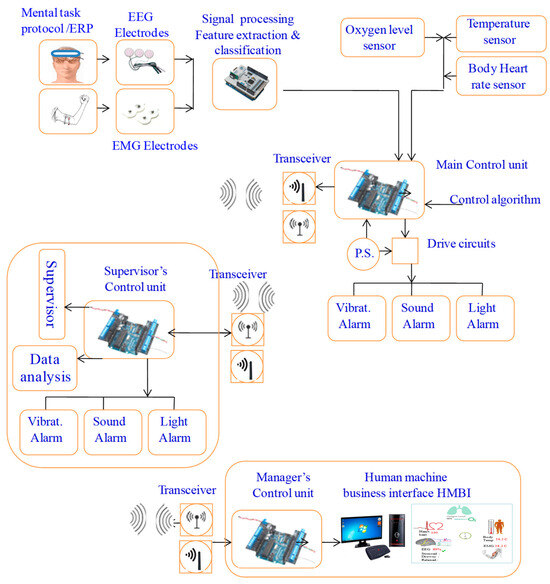
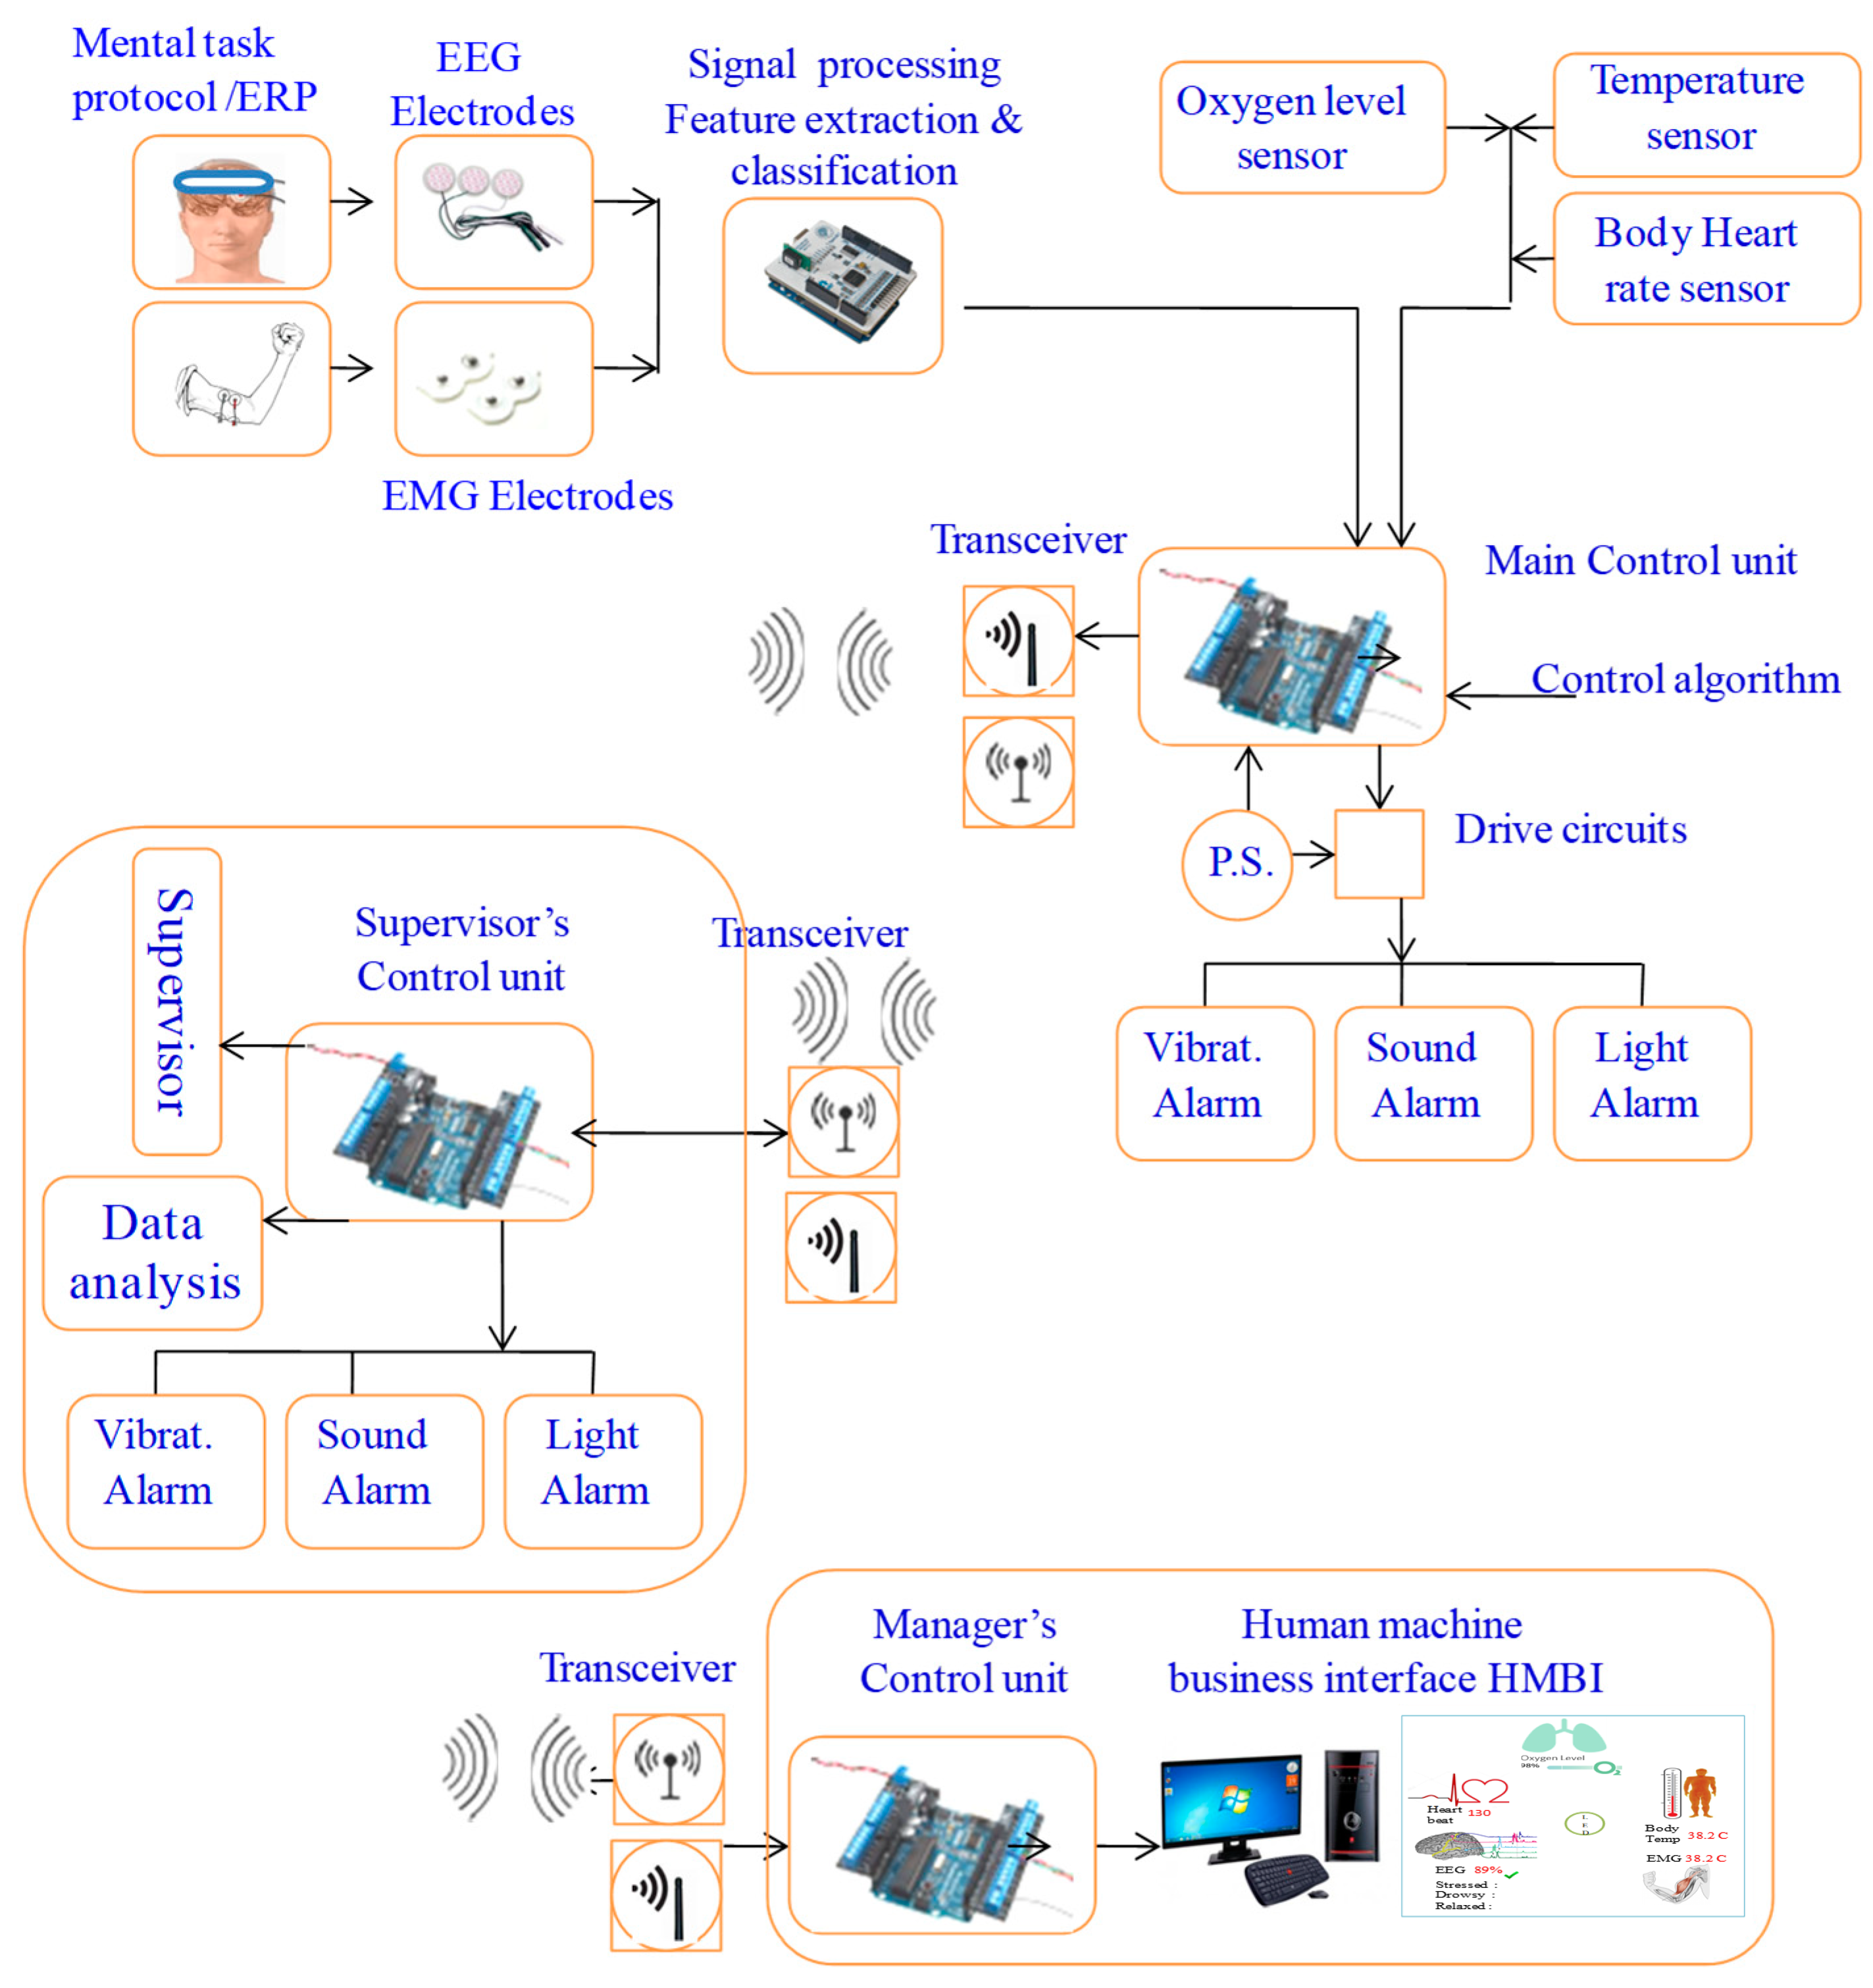
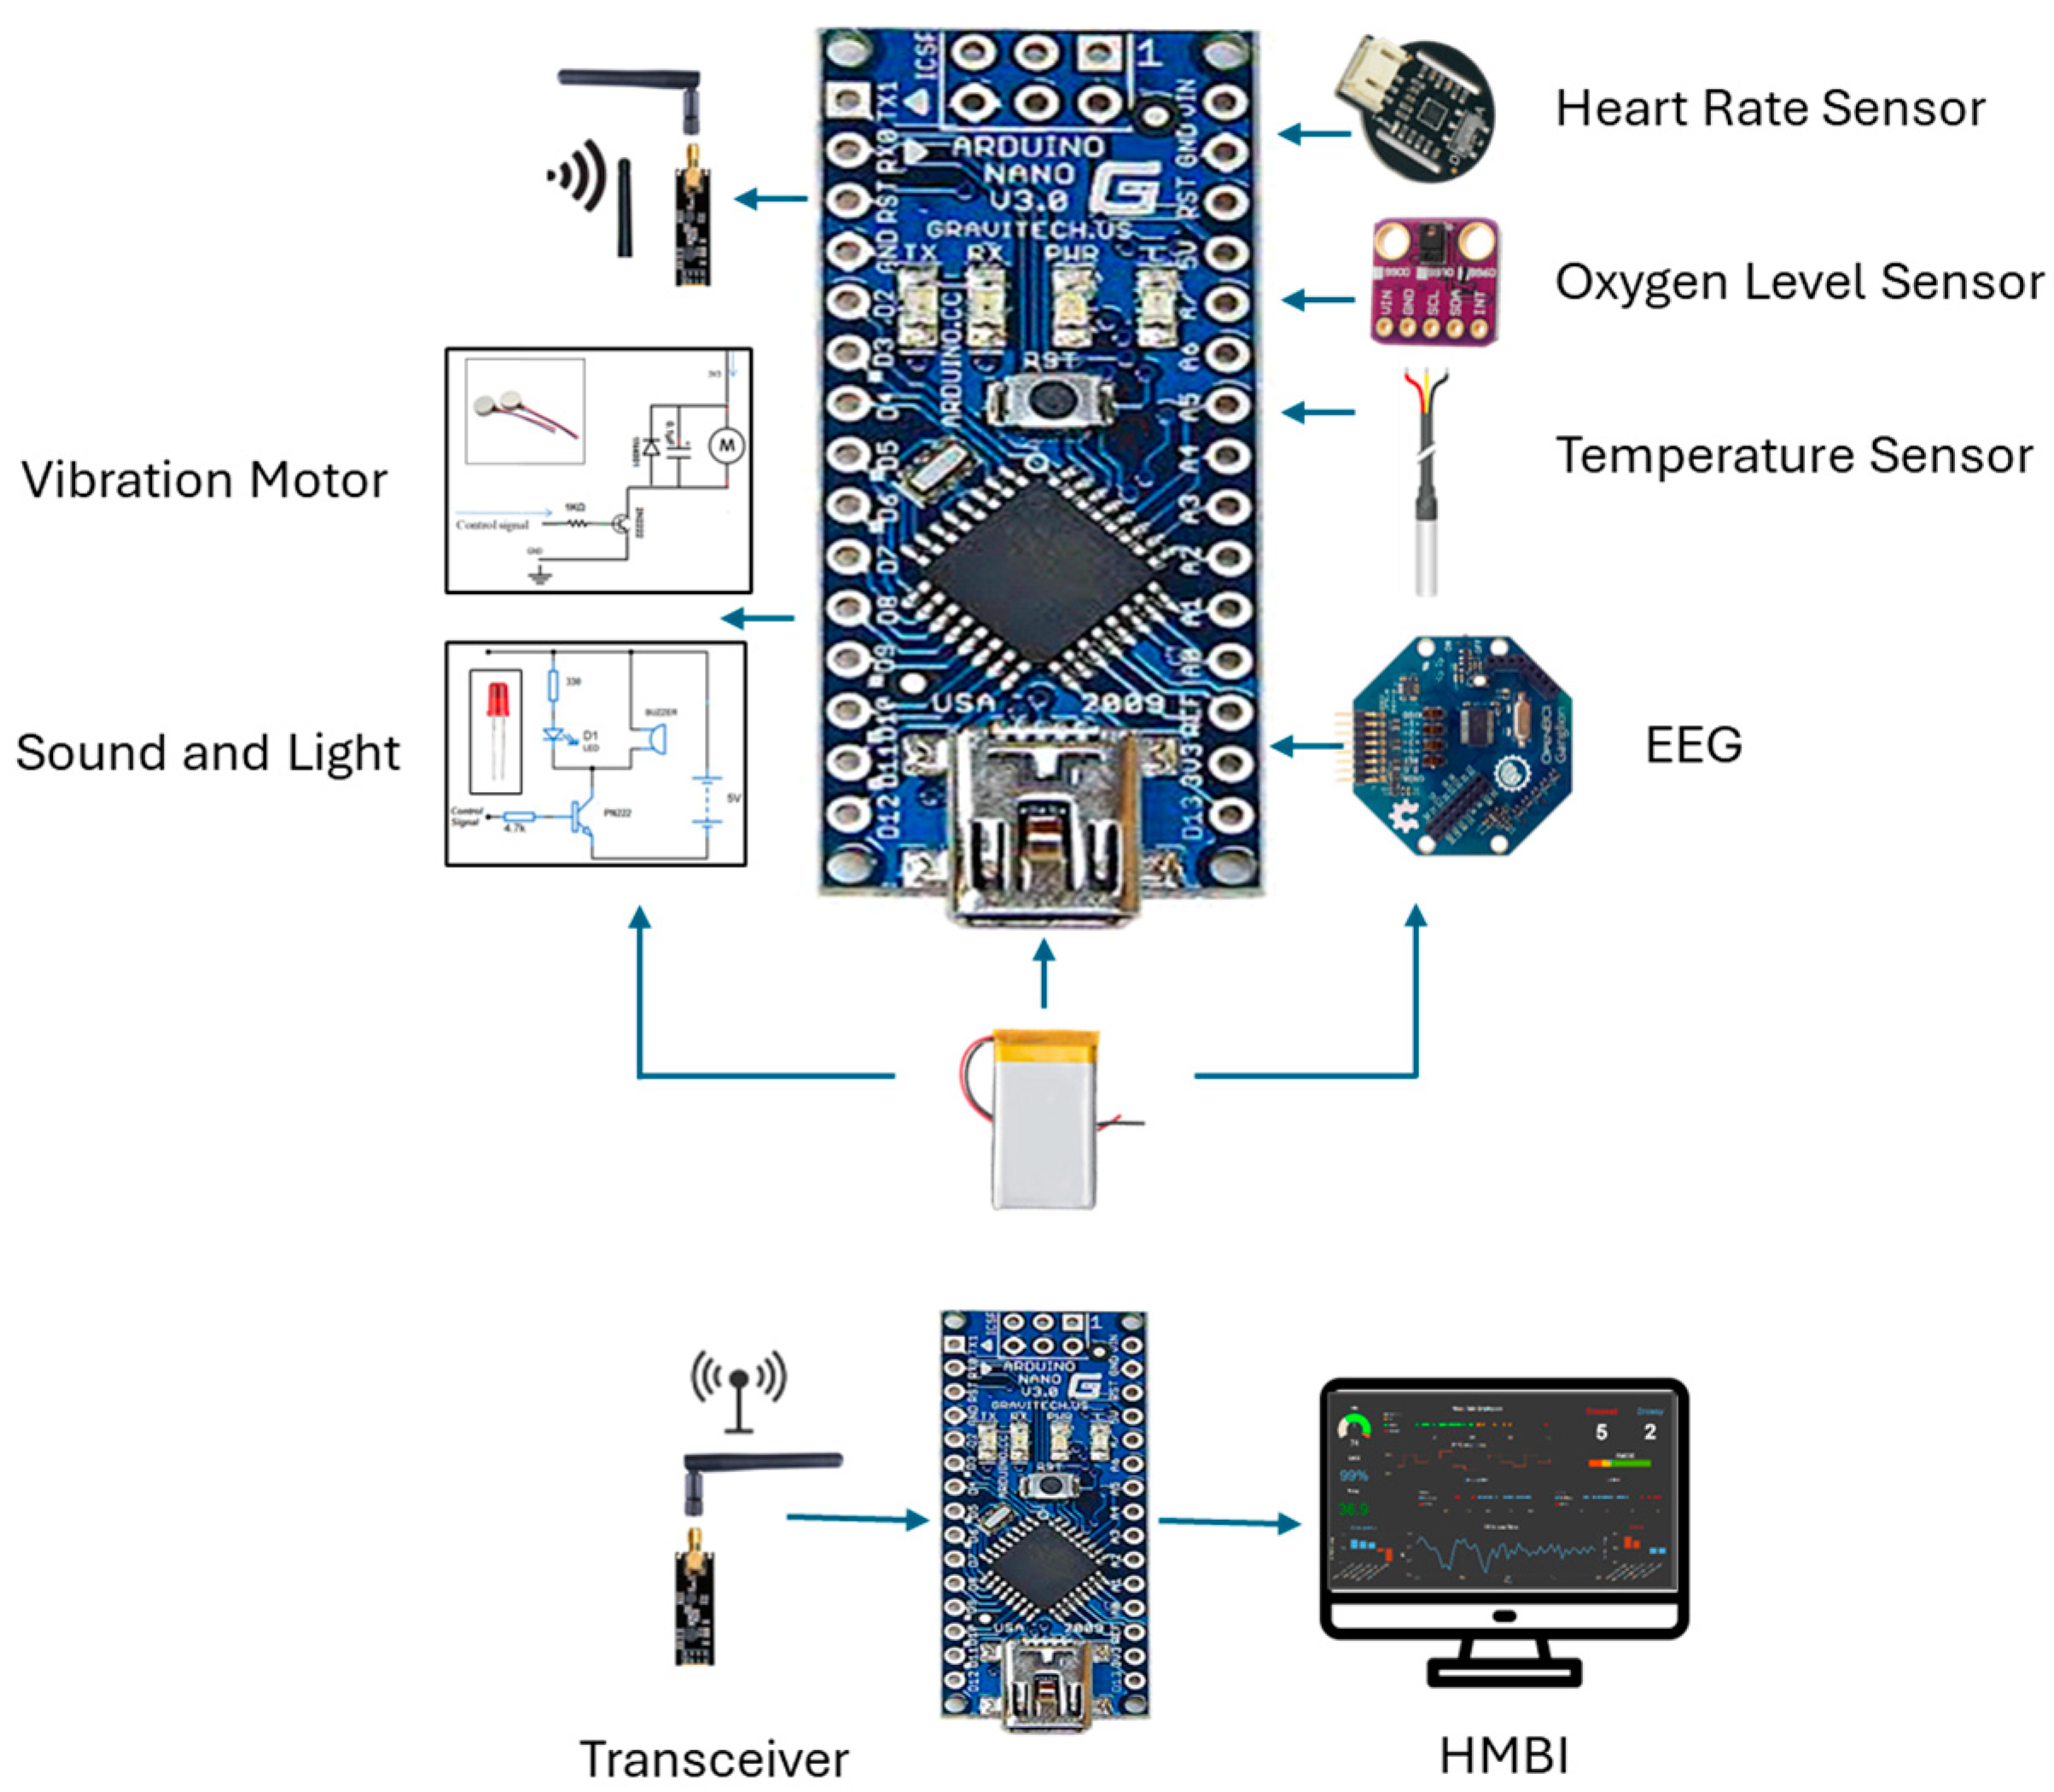
Figure 2.
Overall system design: pictorial and functional diagram representation.
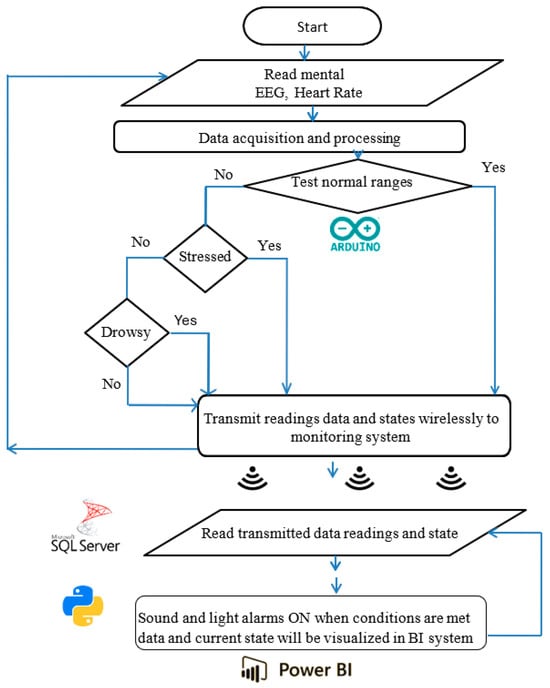
Figure 3.
Working principle and algorithm flowchart representation.
The primary components include two control units, sensors, ECG and EEG electrodes, sound and light indicators (an LED and buzzer), a vibratory motor, a wireless transceiver, and a battery power supply. The system consists of three main parts: the user part with a bio-data acquisition and signal processing system, the supervisor’s part that performs data streaming and analysis, and the alert part and management system. The system is designed to acquire physiological biosignal measures to predict human mental and physical states in a working environment from two human organs: the head and the upper arm. Then, it sends the data to the control unit, which, based on the control algorithm, evaluates the information by analyzing the acquired data. If a critical state is registered, it notifies and alerts the user, as well as continuously and wirelessly transmitting the acquired data and resulting analysis to supervisors. The system continuously records the human biosignals, i.e., the EEG, HRV, and body’s most basic functions and signs: temperature, HR, and SpO2 level. A total of 27 healthy participants aged 32 ± 12 (22 males and 5 females) participated in the system’s testing and evaluation.
4. System Design and Hardware Integration
The design features two setup forms: one to be worn on the upper arm and another to be worn on the head. This allows employees to move freely throughout their office and avoid any annoyance, impairments, or issues that may emerge from wearing the portable system. The gadget has integrated electronic components and is designed similarly to a sports headband. The sensors, including dry EEG electrodes above each eye to detect brain impulses, and temperature sensors in the forehead and temple regions, are in contact with spots on the skull. With sensors placed on the triceps region of the upper arm, the armband form of the gadget uses electronic components to measure a variety of biosignals. Depending on the purpose, the design can be modified to create several bracelet styles. Biosignal sensors (EEG, temperature, HR, and oxygen saturation), processor chips, indicators, a wireless communication component, a data visualization component, interfaces, and a battery power source are some of the physical elements that make up the system.
4.1. EEG and Signal Processing Modules
Dry comb snap silver–silver chloride-coated EEG electrodes that are compatible with the system’s design can be used. Another option is the principal brainwave sensor of the OpenBCI 4-channel Ganglion Biosensing Board (OpenBCI 4-channel Ganglion, Brooklyn, NY, USA), as illustrated in Figure 4. This module measures eye blinks, attention, and meditation using basic dry electrodes.
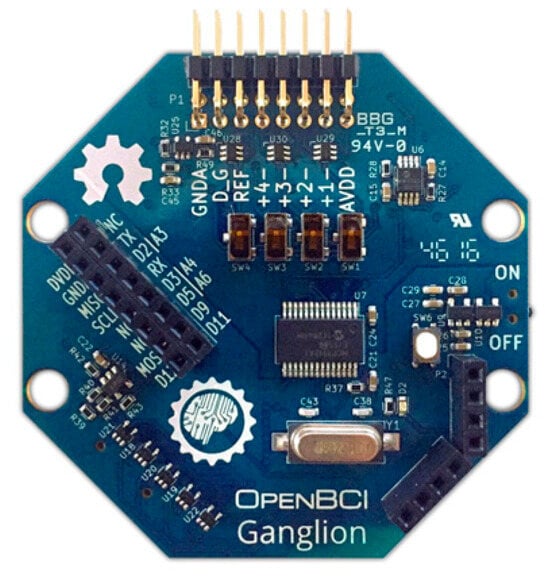
Figure 4.
OpenBCI Ganglion with EEG electrodes.
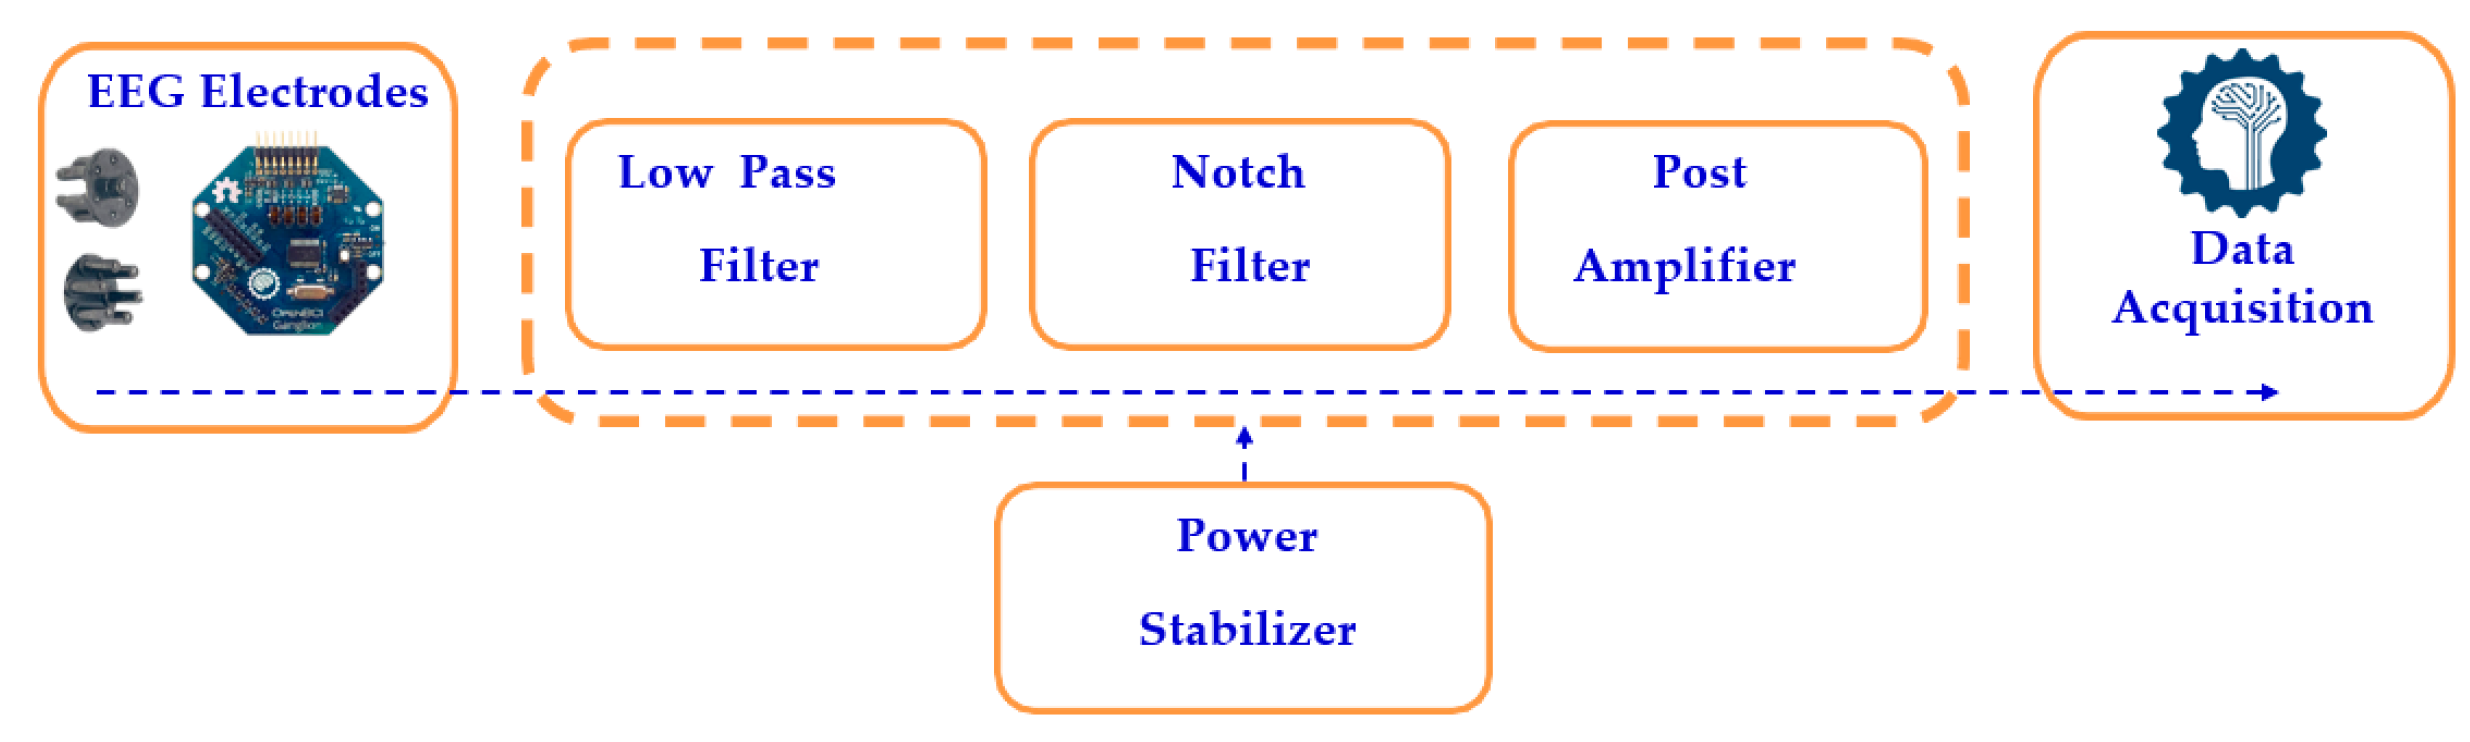
The scalp impedance and other noise interference cause the EEG electrodes to pick up tiny electrical impulses from the human head, ranging from 1 µV to 100 mV. The signal processing circuit filters the raw EEG signals, as shown in Figure 5, using both low-pass and high-pass filters, which eliminate high-frequency and low-frequency noise, respectively. A notch filter selectively blocks a narrow frequency band while allowing other frequencies to pass, after which a post-amplifier boosts the signal by 1000 times using a non-inverting amplifier, as calculated in Equation (2). The processed analog EEG signal is then converted to digital format using an analog-to-digital converter (ADC).
K = 1 + Rf/Rin
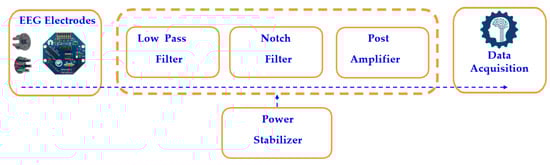
Figure 5.
Block diagram of a single-channel EEG system.
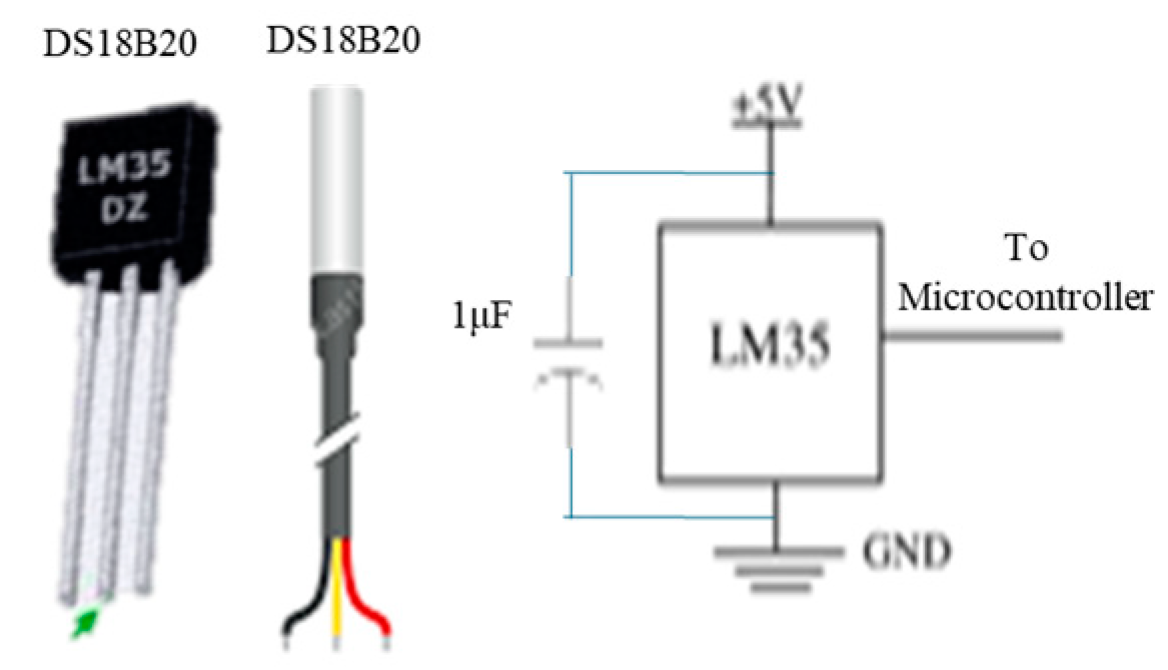
Body temperature sensors: A suitable choice is the waterproof DS18B20 temperature sensor, with alternative options including the DS18B20 and LM35 sensors, and a circuit diagram is shown in Figure 6.
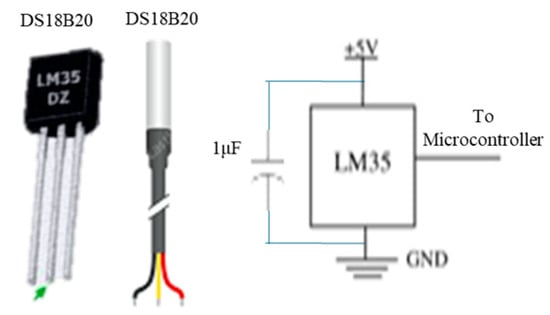
Figure 6.
Temperature sensors and circuit diagram.
Heart rate sensor: The HR represents the frequency of cardiac contractions, measuring the number of beats occurring within a one-minute period. An optical HR sensor is a suitable choice for reading heartbeats, with various design forms shown in Figure 7. The sensor uses photoplethysmography (PPG), which uses light to monitor blood flow and provide HR information. A transmitter (IRTx) and receiver (IRRx) are part of the sensor unit. The optical HR sensor’s components, circuit, block diagram, and operating principle are also shown. The fraction of oxygen-saturated hemoglobin compared to total hemoglobin in the blood, or simply the amount of oxygen in the blood, is the blood oxygen saturation level (SpO2). The usual range for arterial SpO2 is 95–100%; values above 95% are considered normal. Hypoxemia, or an abnormally low blood oxygen concentration, means SpO2 levels below 90%. The most effective choice for measuring blood oxygen saturation levels is the MAX30102 Maxim integrated high-sensitivity pulse oximeter and heart rate sensor, which is also displayed in Figure 7.
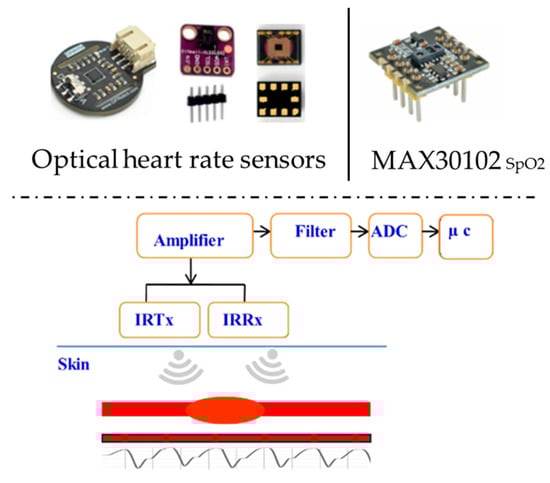
Figure 7.
HR and SpO2 sensors.
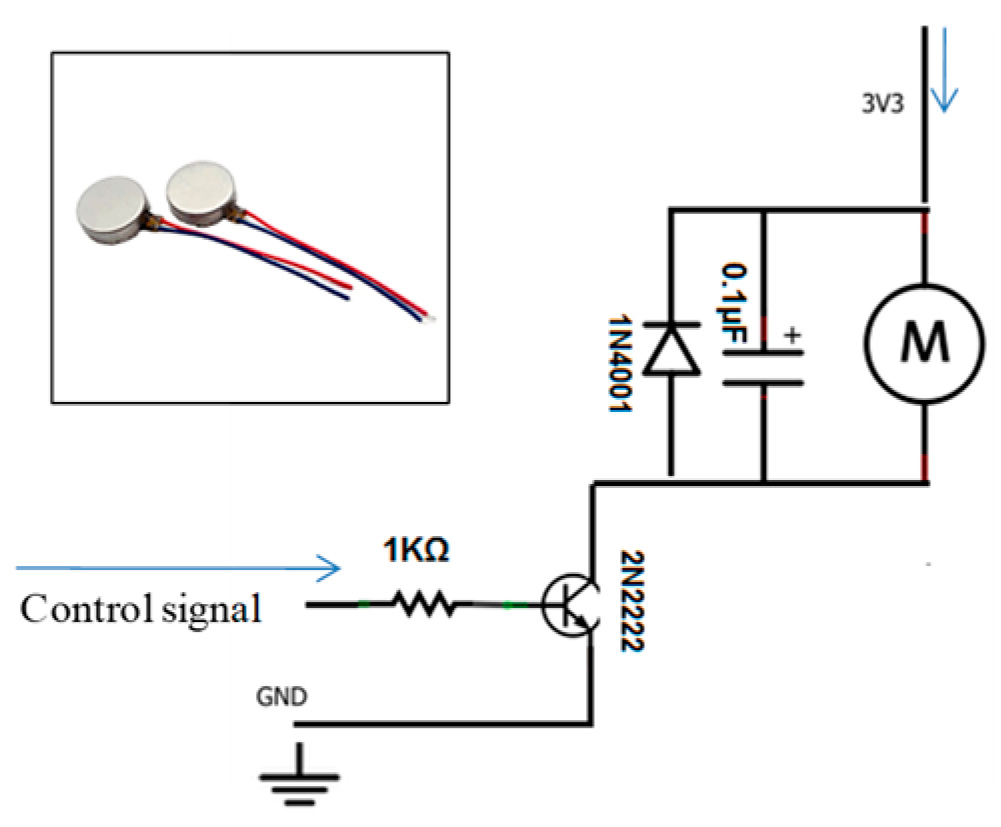
Sound and light alert indicators: A passive low-level buzzer alarm with a high-intensity LED is an example of appropriate hardware. Figure 8 shows the hardware integration and circuit diagram. The vibration motor’s circuit diagram and hardware integration are shown in Figure 9, presenting an adequate choice for non-audible alerts.
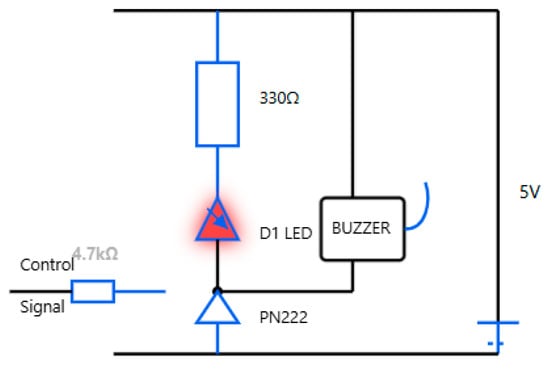
Figure 8.
Sound and light hardware integration and circuit diagram.
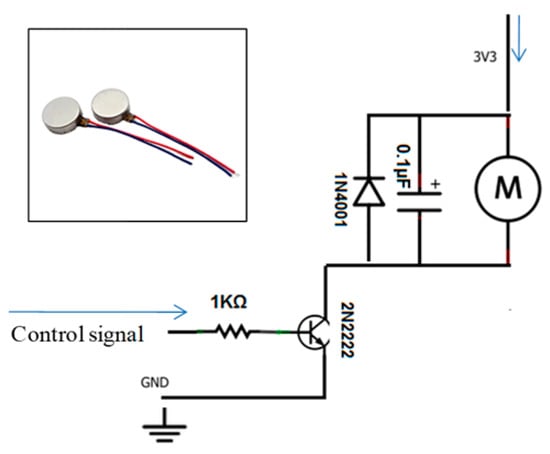
Figure 9.
Vibration motor and its circuit diagram.
As shown in Figure 10, the 433 MHz wireless serial transceiver module is a good choice for wireless communication because it can transmit up to 1000 m.
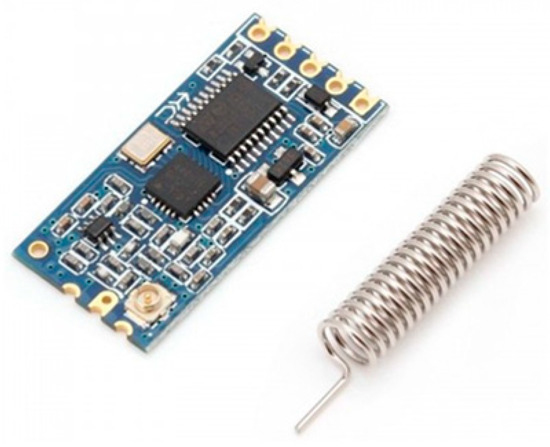
Figure 10.
A 433 MHz wireless serial module.
4.2. The Control Unit and Power Supply
Due to the design requirements, including the processing capabilities, a small size, the number of utilized input analog sensors, the required digital input pins, and transceiver module compatibility, the most suitable control unit is the ATmega328p on the Arduino Nano board or the ATmega2560 on the Arduino Mega board; both boards are shown in Figure 11.
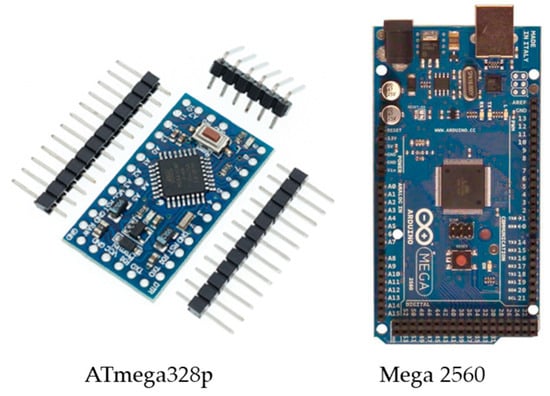
Figure 11.
The control unit Arduino (ATmega328p/ATmega2560).
A suitable power supply choice is the Lithium Polymer Battery Li-Po li-ion, 3.7 V, 180 mAH, Rechargeable Battery, and another potential power supply option is the Button Cell—Lithium Ion 3V Multipurpose Battery. To achieve the required power level, designers can use a combination of parallel series connections.
5. Prototype Validation, Overall System and Subsystem Physical Prototyping, and Experimental Setup
Figure 12 depicts the overall system’s hardware design integration in pictorial form. The EEG electrode was wired to the signal processing interface module, which, in turn, interfaced to the control unit. Temperature and HR sensors were interfaced to the control unit. The alerting circuit with a transistor, light, and sound alarm was interfaced as an actuator.

Figure 12.
The pictorial form represents the overall portable system hardware design integration.
The wireless communication unit was built utilizing an NRF24L01 transceiver module; both the WiFi and GSM modules for long-distance transmission can be utilized. The data are wirelessly transmitted to the SQL server and displayed on supervisors’ PCs; they are received and displayed using a special human–machine business interface (HMBI) design.
Finally, two forms of the overall system prototype were built by integrating all the subsystems into one overall unit with two different designs.
5.1. EEG Signal Subsystem Wiring, Reading, and Processing
The EEG signals were acquired from the user’s head and read by the control unit. The EEG data were acquired and preprocessed using the OpenBCI GUI software (OpenBCI GUI v6.0.0-beta.1), and the power spectra of all the bands were acquired, as shown in Figure 13.
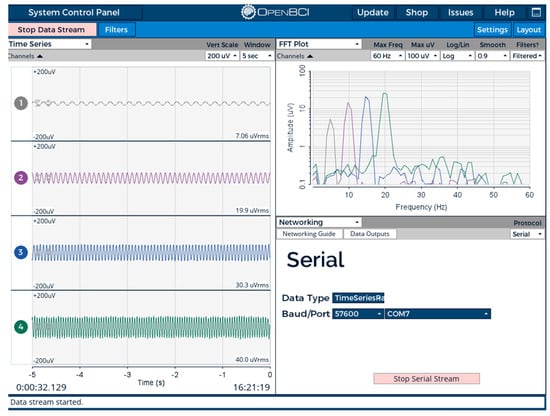
Figure 13.
Acquired EEG data from OpenBCI_Ganglion.
5.2. The Sensor Subsystem Wiring and Integration
To read the body’s most basic functions and signs, the three applied sensors (oxygen level, temperature, and heart rate) are integrated in one input module. The sensors’ integration and testing setup is shown in Figure 14. The reading from each of these sensors is one numerical value that is increased depending on the human mental and physical state in an industrial setting, for example. The average normal temperature is around 37 °C. For a normal human, the oxygen level (SpO2) is typically above 95%, and below 90% is considered low. Body temperature increases when humans are focused with high attention, and the oxygen level and HR similarly increase; the body requires more oxygen when focused or stressed, and there is also an increase in HR in this situation. The acquired values are displayed on the supervisor’s HMBI design as numerical values.
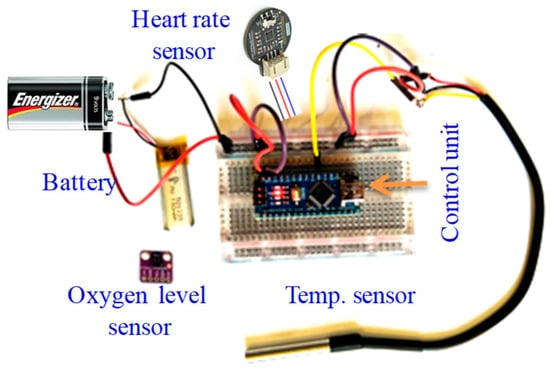
Figure 14.
Integrated module consisting of the three applied sensors for testing purposes.
5.3. The Actuator Subsystem Wiring and Integration
5.3.1. The User’s Alarm and Notification Subsystem
In the design, the alarm and notification subsystem, consisting of vibration, sound, and light alarms, is applied to notify both the user (e.g., worker/operator) and the supervisor.
The vibrating alarm was developed utilizing the selected vibrating motor and built as shown in Figure 15, in accordance with the circuit diagram.
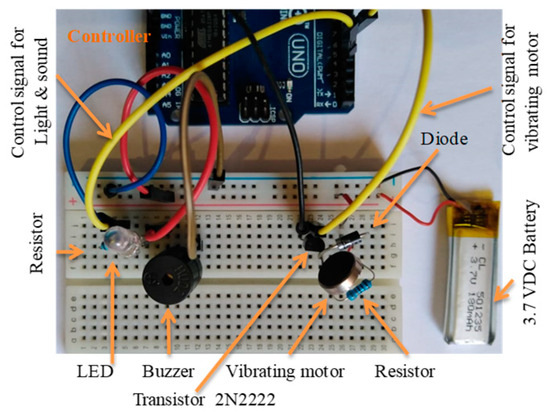
Figure 15.
The two circuits developed for testing, including light, sound, and vibrating alarms.
The light and sound alarms were physically built with a high-intensity white LED and buzzer, as shown in Figure 16, according to the circuit diagram.
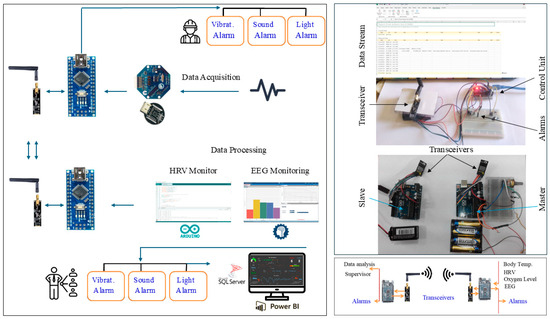
Figure 16.
The supervisor’s alerting and notification subsystem.
5.3.2. The Wireless Communication Subsystem
To wirelessly pair up/connect the master and slave control units, a pair of transceiver modules, nRF24L01, is utilized. The wireless communication subsystem was physically developed. The system’s design was developed to alert and notify both the user and the supervisor. The alerting and notification subsystem was designed as shown in Figure 16, consisting of a wireless communications unit, a PC displaying the data, and three types of alarms (light, sound, and vibratory motor) to be activated when an indicator’s value drops below or increases beyond specific thresholds.
5.4. Building the Overall System Prototype
Both design setups (head and upper arm) were built by integrating all the physically built circuits, modules, components, and subsystems into one overall system prototype. The developed prototypes, with the hardware integration and placement of all the components and subsystems, including the EEG module, sensors, actuators, alarms, wireless communication module, and power supply subsystems, are shown in Figure 17.
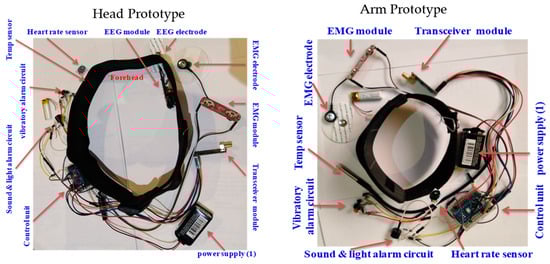
Figure 17.
Hardware integration and placement of components in developed prototype.
6. Results and Discussion
6.1. Results
The Arduino IDE (Version 2.3.4) was used to program and upload code to the microcontroller in C++. The features of HRV (HR, R-R, RMSSD, LF, HF, and LF/HF) were extracted using the designed code in real time. A detailed description of the code is provided in the Supplementary Materials. In addition, the EEG PSD data were extracted in all bands—delta, theta, alpha, beta, and gamma—using OpenBCI GUI software and then streamed to the network.
A total of 27 healthy participants volunteered to test the system and the HRV features extracted, as listed in Table 1.

Table 1.
HRV features from a sample of 27 participants.
Figure 18 summarizes the average HRV features across all participants, comparing males and females. The female sample shows a lower RMSSD (approximately 23.5 ms) compared to the males (37.2 ms) and a higher LF/HF ratio (1.5 compared to 1.3); this sample of females may have experienced more stress than the males.
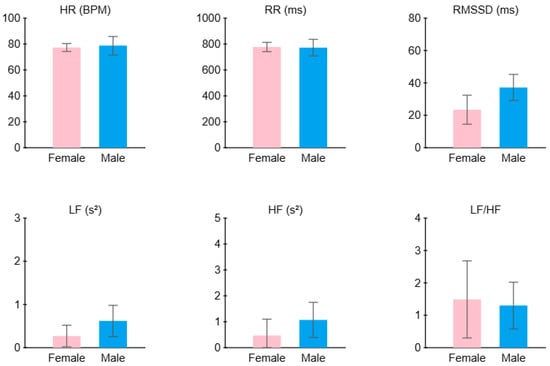
Figure 18.
Average HRV features across all participants: comparison between males and females.
The criteria used to classify the worker state (stressed, drowsy, or normal) were built based on previous studies and norms, as shown in Table 2.
Table 2.
Worker state classification criteria based on prior research.
6.2. System Visualization
Power BI software (Power BI 2.140.1577) was used to develop the supervisor dashboard for HRV, including time-domain measures such as the RMSSD and frequency-domain measures such as the LF, HF, and LF/HF. Additionally, the dashboard displays the EEG power spectral density (PSD) across all bands, as well as the EEG signal in the time domain. Other parameters, such as SpO2 levels, were integrated and also shown on the dashboard, as illustrated in Figure 19.
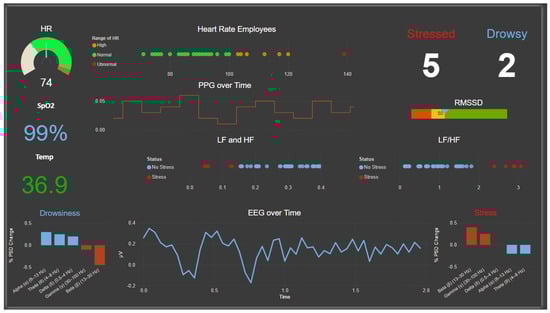
Figure 19.
The supervisor’s HMBI (BI dashboard).
6.3. Discussion
Wearable headbands and armbands make up the current system design. The headband weighs 109.6 g, and the armband weighs 79 g; this is effective, but could benefit from some ergonomic improvements to guarantee comfort throughout extended use, as confirmed by feedback from the user. For wearable technology, factors such as weight, material flexibility, and adaptability are crucial because prolonged use may cause discomfort. Accurate data collection depends on the quality of biosignal sensors, yet issues with signal dependability and noise interference remain. Stress states and HRV measurements (RMSSD and LF/HF ratio) do not typically exhibit consistent correlations, although stress generally reduces the RMSSD and raises the LF/HF. Accurately interpreting physiological data, which can differ depending on age, gender, and medical conditions, is essential to the system’s functionality. The system’s capacity to remember individual baselines, anticipate the start of stress or drowsiness, and examine complicated multimodal data for subtle patterns may be improved by incorporating machine learning (ML) methods.
7. Conclusions
Stress and drowsiness at work are serious issues that have a negative impact on worker safety, productivity, and well-being. This study developed a complete prototype system for monitoring stress and drowsiness. Advanced signal processing, wireless connection, and warning mechanisms are all incorporated into the system to alert supervisors and users to critical physical and mental situations. Through changes in temperature, SpO2 levels, HRV measures, and EEG brainwave patterns, the design’s adaptability, which includes headband and armband combinations, ensures comfort and usefulness in a range of work environments. This technology offers a non-invasive way to lower workplace accidents, increase productivity, and boost employee well-being by incorporating neuroergonomics concepts. To further evaluate the system’s effectiveness, future research should concentrate on improving the design, including machine learning for predictive analytics, and using the system in various industrial and health care settings. Additionally, advanced sensors with higher accuracy and better noise-cancelation capabilities can be integrated. Furthermore, machine learning models that can learn and adapt to individual baseline physiological metrics can be developed and incorporated. Adaptive thresholding techniques that personalize state detection parameters can be utilized. In addition, efforts should be made to redesign wearable components (headbands and armbands) to make them more ergonomic, lightweight, and comfortable for extended use. Flexible materials and adjustable fittings should be used. This system can be adapted to critical work environments, such as operating rooms in health care facilities, where human errors can have severe consequences.
Supplementary Materials
The following supporting information can be downloaded at https://www.mdpi.com/article/10.3390/pr13041074/s1.
Funding
This research was funded by Taif University, Saudi Arabia, Project No. TU-DSPP-2024-240.
Institutional Review Board Statement
The study was conducted in accordance with the guidelines of the Ethics Committee of Taif University for studies involving humans, from which it received approval (HAO-02-T-105; 12 July 2021).
Informed Consent Statement
Informed consent was obtained from all the subjects involved in the study.
Data Availability Statement
The data are contained within the article.
Acknowledgments
The authors extend their appreciation to Taif University, Saudi Arabia, for supporting this work through project number TU-DSPP-2024-240.
Conflicts of Interest
The author declares no conflicts of interest.
References
- Bickford, M. Stress in the Workplace: A General Overview of the Causes, the Effects, and the Solution; Canadian Mental Health Association Newfoundland and Labrador Division: St. John’s, NL, Canada, 2005; Volume 8, pp. 1–3. [Google Scholar]
- Wu, X.; Li, Y.; Yao, Y.; Luo, X.; He, X.; Yin, W. Development of construction workers job stress scale to study and the relationship between job stress and safety behavior: An empirical study in Beijing. Int. J. Environ. Res. Public Health 2018, 15, 2409. [Google Scholar] [CrossRef] [PubMed]
- Leung, M.-Y.; Liang, Q.; Olomolaiye, P. Impact of job stressors and stress on the safety behavior and accidents of construction workers. J. Manag. Eng. 2016, 32, 04015019. [Google Scholar]
- Barkhordari, A.; Malmir, B.; Malakoutikhah, M. An analysis of individual and social factors affecting occupational accidents. Saf. Health Work 2019, 10, 205–212. [Google Scholar]
- Day, A.J.; Brasher, K.; Bridger, R.S. Accident proneness revisited: The role of psychological stress and cognitive failure. Accid. Anal. Prev. 2012, 49, 532–535. [Google Scholar]
- Cowan, R.; Sanditov, B.; Weehuizen, R. Productivity effects of innovation, stress and social relations. J. Econ. Behav. Organ. 2011, 79, 165–182. [Google Scholar]
- Ekienabor, E. Impact of job stress on employees’ productivity and commitment. Int. J. Res. Bus. Manag. Account. 2016, 2, 124–133. [Google Scholar]
- Mark, G.; Smith, A.P. Effects of occupational stress, job characteristics, coping, and attributional style on the mental health and job satisfaction of university employees. Anxiety Stress Coping 2012, 25, 63–78. [Google Scholar]
- Fernandez, R. Help your team manage stress, anxiety, and burnout. Harv. Bus. Rev. 2016, 53. [Google Scholar]
- Park, Y.-M.; Kim, S.Y. Impacts of job stress and cognitive failure on patient safety incidents among hospital nurses. Saf. Health Work 2013, 4, 210–215. [Google Scholar]
- Lee, W.Y. The interacting effects of cognitive failure, consciousness and job stress on safety behavior and accidents. Korean J. Ind. Organ. Psychol. 2006, 19, 475–497. [Google Scholar]
- Mastoras, G.; Poulin, C.; Norman, L.; Weitzman, B.; Pozgay, A.; Frank, J.R.; Posner, G. Stress Testing the Resuscitation Room: Latent Threats to Patient Safety Identified During Interprofessional In Situ Simulation in a Canadian Academic Emergency Department. AEM Educ. Train. 2020, 4, 254–261. [Google Scholar]
- Chen, Q.; Liang, M.; Li, Y.; Guo, J.; Fei, D.; Wang, L.; He, L.; Sheng, C.; Cai, Y.; Li, X. Mental health care for medical staff in China during the COVID-19 outbreak. Lancet Psychiatry 2020, 7, e15–e16. [Google Scholar] [PubMed]
- Adams, J.G.; Walls, R.M. Supporting the health care workforce during the COVID-19 global epidemic. JAMA 2020, 323, 1439–1440. [Google Scholar]
- Xiao, H.; Zhang, Y.; Kong, D.; Li, S.; Yang, N. The effects of social support on sleep quality of medical staff treating patients with coronavirus disease 2019 (COVID-19) in January and February 2020 in China. Med. Sci. Monit. Int. Med. J. Exp. Clin. Res. 2020, 26, e923549-1. [Google Scholar]
- Park, S.-C.; Park, Y.C. Mental health care measures in response to the 2019 novel coronavirus outbreak in Korea. Psychiatry Investig. 2020, 17, 85. [Google Scholar] [PubMed]
- Lai, J.; Ma, S.; Wang, Y.; Cai, Z.; Hu, J.; Wei, N.; Wu, J.; Du, H.; Chen, T.; Li, R. Factors associated with mental health outcomes among health care workers exposed to coronavirus disease 2019. JAMA Netw. Open 2020, 3, e203976. [Google Scholar]
- Tsou, M.-T.; Chang, B.C.-C. Association of depression and excessive daytime sleepiness among sleep-deprived college freshmen in northern Taiwan. Int. J. Environ. Res. Public Health 2019, 16, 3148. [Google Scholar] [CrossRef] [PubMed]
- Ramey, S.; MacQuarrie, A.; Cochrane, A.; McCann, I.; Johnston, C.W.; Batt, A.M. Drowsy and dangerous? Fatigue in paramedics: An overview. Irish Journal of Paramedicine. 2019, 4, 1–9. [Google Scholar] [CrossRef]
- Åkerstedt, T.; Knutsson, A.; Westerholm, P.; Theorell, T.; Alfredsson, L.; Kecklund, G. Work organisation and unintentional sleep: Results from the WOLF study. Occup. Environ. Med. 2002, 59, 595–600. [Google Scholar]
- Åkerstedt, T.; Fredlund, P.; Gillberg, M.; Jansson, B. A prospective study of fatal occupational accidents–relationship to sleeping difficulties and occupational factors. J. Sleep Res. 2002, 11, 69–71. [Google Scholar]
- Melamed, S.; Oksenberg, A. Excessive daytime sleepiness and risk of occupational injuries in non-shift daytime workers. Sleep 2002, 25, 315–322. [Google Scholar] [CrossRef] [PubMed]
- Parasuraman, R.; Rizzo, M. Neuroergonomics: The Brain at Work; Oxford University Press: Oxford, UK, 2008; Volume 3. [Google Scholar]
- Karwowski, W. The discipline of ergonomics and human factors. In Handbook of Human Factors and Ergonomics; Wiley: Hoboken, NJ, USA, 2006; Volume 3. [Google Scholar]
- Karwowski, W. International Encyclopedia of Ergonomics and Human Factors; CRC Press: Boca Raton, FL, USA, 2006; Volume 3. [Google Scholar]
- Karwowski, W. Handbook of Standards and Guidelines in Ergonomics and Human Factors; CRC Press: Boca Raton, FL, USA, 2005. [Google Scholar]
- Mehta, R.K.; Parasuraman, R. Neuroergonomics: A review of applications to physical and cognitive work. Front. Hum. Neurosci. 2013, 7, 889. [Google Scholar]
- Rahman, M.; Karwowski, W.; Fafrowicz, M.; Hancock, P.A. Neuroergonomics applications of electroencephalography in physical activities: A systematic review. Front. Hum. Neurosci. 2019, 13, 182. [Google Scholar] [CrossRef] [PubMed]
- Momin, B.; Kalas, M.S. Study and implementation of advanced neuroergonomic techniques. Adv. Comput. 2012, 3, 9. [Google Scholar] [CrossRef]
- Karwowski, W.; Siemionow, W.; Gielo-Perczak, K. Physical neuroergonomics: The human brain in control of physical work activities. Theor. Issues Ergon. Sci. 2003, 4, 175–199. [Google Scholar]
- Aljuaid, A.M. Theoretical design of EEG-based Neuroergonomics integrated portable system, applying direct Psychophysiological indicators. In Proceedings of the 2019 Industrial & Systems Engineering Conference (ISEC), Jeddah, Saudi Arabia, 19–20 January 2019. [Google Scholar]
- Mai, J.K.; Paxinos, G. The Human Nervous System; Academic Press: Cambridge, MA, USA, 2011. [Google Scholar]
- Seo, S.-H.; Lee, J.-T. Stress and EEG. Converg. Hybrid Inf. Technol. 2010, 1, 413–424. [Google Scholar]
- Kreibig, S.D. Autonomic nervous system activity in emotion: A review. Biol. Psychol. 2010, 84, 394–421. [Google Scholar]
- Dinges, D.F. An overview of sleepiness and accidents. J. Sleep Res. 1995, 4, 4–14. [Google Scholar]
- Niedermeyer, E.; da Silva, F.H.L. Electroencephalography: Basic Principles, Clinical Applications, and Related Fields; Wolters Kluwer Health: Philadelphia, PA, USA, 2005. [Google Scholar]
- Khalifa, W.; Salem, A.; Roushdy, M.; Revett, K. A survey of EEG based user authentication schemes. In Proceedings of the 2012 8th International Conference on Informatics and Systems (INFOS), Giza, Egypt, 14–16 May 2012. [Google Scholar]
- Al-Shargie, F.; Kiguchi, M.; Badruddin, N.; Dass, S.C.; Hani, A.F.M.; Tang, T.B. Mental stress assessment using simultaneous measurement of EEG and fNIRS. Biomed. Opt. Express 2016, 7, 3882–3898. [Google Scholar]
- Saeed, S.M.U.; Anwar, S.M.; Majid, M.; Bhatti, A.M. Psychological stress measurement using low cost single channel EEG headset. In Proceedings of the 2015 IEEE International Symposium on Signal Processing and Information Technology (ISSPIT), Abu Dhabi, United Arab Emirates, 7–10 December 2015. [Google Scholar]
- Saeed, S.M.U.; Anwar, S.M.; Majid, M. Quantification of human stress using commercially available single channel eeg headset. IEICE Trans. Inf. Syst. 2017, 100, 2241–2244. [Google Scholar]
- Zanetti, M.; Faes, L.; Nollo, G.; De Cecco, M.; Pernice, R.; Maule, L.; Pertile, M.; Fornaser, A. Information dynamics of the brain, cardiovascular and respiratory network during different levels of mental stress. Entropy 2019, 21, 275. [Google Scholar] [CrossRef]
- Hafeez, M.A.; Shakil, S.; Jangsher, S. Stress effects on exam performance using EEG. In Proceedings of the 2018 14th International Conference on Emerging Technologies (ICET), Islamabad, Pakistan, 21–22 November 2018. [Google Scholar]
- Sulaiman, N.; Ying, B.S.; Mustafa, M.; Jadin, M.S. Offline LabView-based EEG Signals Analysis for Human Stress Monitoring. In Proceedings of the 2018 9th IEEE Control and System Graduate Research Colloquium (ICSGRC), Shah Alam, Malaysia, 3–4 August 2018. [Google Scholar]
- Minguillon, J.; Perez, E.; Lopez-Gordo, M.A.; Pelayo, F.; Sanchez-Carrion, M.J. Portable system for real-time detection of stress level. Sensors 2018, 18, 2504. [Google Scholar] [CrossRef]
- Lee, J.H.; Gamper, H.; Tashev, I.; Dong, S.; Ma, S.; Remaley, J.; Holbery, J.D.; Yoon, S.H. Stress Monitoring using Multimodal Bio-sensing Headset. In Proceedings of the Extended Abstracts of the 2020 CHI Conference on Human Factors in Computing Systems Extended Abstracts, Honolulu HI USA, 25–30 April 2020. [Google Scholar] [CrossRef]
- Putman, P.; Verkuil, B.; Arias-Garcia, E.; Pantazi, I.; van Schie, C. EEG theta/beta ratio as a potential biomarker for attentional control and resilience against deleterious effects of stress on attention. Cogn. Affect. Behav. Neurosci. 2014, 14, 782–791. [Google Scholar] [PubMed]
- Borghini, G.; Astolfi, L.; Vecchiato, G.; Mattia, D.; Babiloni, F. Measuring neurophysiological signals in aircraft pilots and car drivers for the assessment of mental workload, fatigue and drowsiness. Neurosci. Biobehav. Rev. 2014, 44, 58–75. [Google Scholar] [PubMed]
- Ohsuga, M.; Kamakura, Y.; Inoue, Y.; Noguchi, Y.; Shimada, K.; Mishiro, M. Estimation of driver’s arousal state using multi-dimensional physiological indices. In Proceedings of the International Conference on Engineering Psychology and Cognitive Ergonomics, Orlando, FL, USA, 9–14 July 2011; Springer: Berlin/Heidelberg, Germany, 2011. [Google Scholar]
- Pal, N.R.; Chuang, C.-Y.; Ko, L.-W.; Chao, C.-F.; Jung, T.-P.; Liang, S.-F.; Lin, C.-T. EEG-based subject-and session-independent drowsiness detection: An unsupervised approach. EURASIP J. Adv. Signal Process. 2008, 2008, 519480. [Google Scholar]
- Correa, A.G.; Orosco, L.; Laciar, E. Automatic detection of drowsiness in EEG records based on multimodal analysis. Med. Eng. Phys. 2014, 36, 244–249. [Google Scholar]
- Kaida, K.; Takahashi, M.; Åkerstedt, T.; Nakata, A.; Otsuka, Y.; Haratani, T.; Fukasawa, K. Validation of the Karolinska sleepiness scale against performance and EEG variables. Clin. Neurophysiol. 2006, 117, 1574–1581. [Google Scholar]
- Ogino, M.; Mitsukura, Y. Portable drowsiness detection through use of a prefrontal single-channel electroencephalogram. Sensors 2018, 18, 4477. [Google Scholar] [CrossRef]
- Nguyen, T.; Ahn, S.; Jang, H.; Jun, S.C.; Kim, J.G. Utilization of a combined EEG/NIRS system to predict driver drowsiness. Sci. Rep. 2017, 7, 43933. [Google Scholar]
- Akselrod, S.; Gordon, D.; Ubel, F.A.; Shannon, D.C.; Berger, A.; Cohen, R.J. Power spectrum analysis of heart rate fluctuation: A quantitative probe of beat-to-beat cardiovascular control. Science 1981, 213, 220–222. [Google Scholar]
- Taelman, J.; Vandeput, S.; Spaepen, A.; Van Huffel, S. Influence of mental stress on heart rate and heart rate variability. In Proceedings of the 4th European Conference of the International Federation for Medical and Biological Engineering, Antwerp, Belgium, 23–27 November 2008; Springer: Berlin/Heidelberg, Germany, 2009. [Google Scholar]
- Pumprla, J.; Howorka, K.; Groves, D.; Chester, M.; Nolan, J. Functional assessment of heart rate variability: Physiological basis and practical applications. Int. J. Cardiol. 2002, 84, 1–14. [Google Scholar] [CrossRef] [PubMed]
- Malik, M.; Bigger, J.T.; Camm, A.J.; Kleiger, R.E.; Malliani, A.; Moss, A.J.; Schwartz, P.J. Heart rate variability: Standards of measurement, physiological interpretation, and clinical use. Eur. Heart J. 1996, 17, 354–381. [Google Scholar] [CrossRef]
- Kim, D.; Seo, Y.; Salahuddin, L. Decreased long term variations of heart rate variability in subjects with higher self reporting stress scores. In Proceedings of the 2008 Second International Conference on Pervasive Computing Technologies for Healthcare, Tampere, Finland, 30 January–1 February 2008. [Google Scholar]
- Sun, F.-T.; Kuo, C.; Cheng, H.-T.; Buthpitiya, S.; Collins, P.; Griss, M. Activity-aware mental stress detection using physiological sensors. In Mobile Computing, Applications, and Services, Proceedings of the Second International ICST Conference, MobiCASE 2010, Santa Clara, CA, USA, 25–28 October 2010; Springer: Berlin/Heidelberg, Germany, 2010. [Google Scholar]
- Kim, H.-G.; Cheon, E.-J.; Bai, D.-S.; Lee, Y.H.; Koo, B.-H. Stress and heart rate variability: A meta-analysis and review of the literature. Psychiatry Investig. 2018, 15, 235. [Google Scholar] [CrossRef] [PubMed]
- Li, Z.; Snieder, H.; Su, S.; Ding, X.; Thayer, J.F.; Treiber, F.A.; Wang, X. A longitudinal study in youth of heart rate variability at rest and in response to stress. Int. J. Psychophysiol. 2009, 73, 212–217. [Google Scholar] [CrossRef]
- Taelman, J.; Vandeput, S.; Vlemincx, E.; Spaepen, A.; Van Huffel, S. Instantaneous changes in heart rate regulation due to mental load in simulated office work. Eur. J. Appl. Physiol. 2011, 111, 1497–1505. [Google Scholar] [CrossRef]
- Schubert, C.; Lambertz, M.; Nelesen, R.; Bardwell, W.; Choi, J.-B.; Dimsdale, J. Effects of stress on heart rate complexity—A comparison between short-term and chronic stress. Biol. Psychol. 2009, 80, 325–332. [Google Scholar] [CrossRef] [PubMed]
- Hjortskov, N.; Rissén, D.; Blangsted, A.K.; Fallentin, N.; Lundberg, U.; Søgaard, K. The effect of mental stress on heart rate variability and e during computer work. Eur. J. Appl. Physiol. 2004, 92, 84–89. [Google Scholar] [CrossRef]
- Papousek, I.; Nauschnegg, K.; Paechter, M.; Lackner, H.K.; Goswami, N.; Schulter, G. Trait and state positive affect and cardiovascular recovery from experimental academic stress. Biol. Psychol. 2010, 83, 108–115. [Google Scholar] [CrossRef]
- Traina, M.; Cataldo, A.; Galullo, F.; Russo, G. Heart rate variability in healthy subjects. Minerva Psichiatr 2011, 227, 31. [Google Scholar]
- Castaldo, R.; Melillo, P.; Bracale, U.; Caserta, M.; Triassi, M.; Pecchia, L. Acute mental stress assessment via short term HRV analysis in healthy adults: A systematic review with meta-analysis. Biomed. Signal Process. Control 2015, 18, 370–377. [Google Scholar] [CrossRef]
- Rodriguez-Ibañez, N.; García-Gonzalez, M.A.; de la Cruz, M.A.F.; Fernández-Chimeno, M.; Ramos-Castro, J. Changes in heart rate variability indexes due to drowsiness in professional drivers measured in a real environment. In Proceedings of the 2012 Computing in Cardiology, Krakow, Poland, 9–12 September 2012. [Google Scholar]
- Hu, S.; Bowlds, R.L.; Gu, Y.; Yu, X. Pulse wave sensor for non-intrusive driver’s drowsiness detection. In Proceedings of the 2009 Annual International Conference of the IEEE Engineering in Medicine and Biology Society, Minneapolis, MN, USA, 3–6 September 2009. [Google Scholar]
- Awais, M.; Badruddin, N.; Drieberg, M. A non-invasive approach to detect drowsiness in a monotonous driving environment. In Proceedings of the TENCON 2014-2014 IEEE Region 10 Conference, Bangkok, Thailand, 22–25 October 2014. [Google Scholar]
- Furman, G.D.; Baharav, A.; Cahan, C.; Akselrod, S. Early detection of falling asleep at the wheel: A heart rate variability approach. In Proceedings of the 2008 Computers in Cardiology, Bologna, Italy, 14–17 September 2008. [Google Scholar]
- Murata, A.; Hiramatsu, Y. Evaluation of drowsiness by HRV measures-basic study for drowsy driver detection. In Proceedings of the Fourth International Workshop on Computational Intelligence & Applications, Shanghai, China, 15–18 September 2008. IEEE SMC Hiroshima Chapter. [Google Scholar]
- Mahachandra, M.; Sutalaksana, I.Z.; Suryadi, K. Sensitivity of heart rate variability as indicator of driver sleepiness. In Proceedings of the 2012 Southeast Asian Network of Ergonomics Societies Conference (SEANES), Langkawi, Malaysia, 9–12 July 2012. [Google Scholar]
- Zhuo, K.; Gao, C.; Wang, X.; Zhang, C.; Wang, Z. Stress and sleep: A survey based on wearable sleep trackers among medical and nursing staff in Wuhan during the COVID-19 pandemic. Gen. Psychiatry 2020, 33, e100260. [Google Scholar]
- Shabani, H.; Mikaili, M.; Noori, S.M.R. Assessment of recurrence quantification analysis (RQA) of EEG for development of a novel drowsiness detection system. Biomed. Eng. Lett. 2016, 6, 196–204. [Google Scholar]
- Kistler, A.; Mariauzouls, C.; von Berlepsch, K. Fingertip temperature as an indicator for sympathetic responses. Int. J. Psychophysiol. 1998, 29, 35–41. [Google Scholar]
- Ohsuga, M.; Shimono, F.; Genno, H. Assessment of phasic work stress using autonomic indices. Int. J. Psychophysiol. 2001, 40, 211–220. [Google Scholar] [PubMed]
- Bando, S.; Oiwa, K.; Nozawa, A. Evaluation of dynamics of forehead skin temperature under induced drowsiness. IEEJ Trans. Electr. Electron. Eng. 2017, 12, S104–S109. [Google Scholar]
- Zubair, M.; Yoon, C. Multilevel mental stress detection using ultra-short pulse rate variability series. Biomed. Signal Process. Control 2020, 57, 101736. [Google Scholar]
- Bušek, P.; Vaňková, J.; Opavský, J.; Salinger, J.; Nevšímalová, S. Spectral analysis of heart rate variability in sleep. Physiol. Res. 2005, 54, 369–376. [Google Scholar]


Disclaimer/Publisher’s Note: The statements, opinions and data contained in all publications are solely those of the individual author(s) and contributor(s) and not of MDPI and/or the editor(s). MDPI and/or the editor(s) disclaim responsibility for any injury to people or property resulting from any ideas, methods, instructions or products referred to in the content. |
© 2025 by the author. Licensee MDPI, Basel, Switzerland. This article is an open access article distributed under the terms and conditions of the Creative Commons Attribution (CC BY) license (https://creativecommons.org/licenses/by/4.0/).