1. Introduction
The urgency of the problem of e-waste recycling in the present stage of civilization’s development is undeniable [
1]. Environmental risks associated with the toxicity of e-waste [
2,
3,
4] and the depletion of mineral resources due to the growth of mining for the production of electronic equipment [
5] are key issues that require immediate solutions. At present, the main approaches to solving the issues related to the accumulation and recycling of e-waste can be outlined in accordance with the following trends:
- -
Re-use, either completely (after repair) or partially (as spare parts for repairs or the manufacturing of new equipment) [
6,
7,
8];
- -
Extraction of ferrous and non-ferrous metals by hydro-pyrometallurgical methods, with/without preliminary separation from non-metals by various methods. Researchers point out the importance of pre-separation and beneficiation in e-waste recycling, where the most effective strategy is called “disassemble and sort”, using AI [
9]. Traditionally, e-waste (waste printed circuit board—WPCB) is recycled by biometallurgical and hydrometallurgical approaches using inorganic acids such as H
2SO
4, HNO
3, and HCl or pyrometallurgical methods that require high temperature operations. Recently, the use of ionic liquids, organic acids, and amino acids has been developing dynamically. It has been observed that non-ferrous metals show good recovery in an acidic medium, while precious metals can be easily extracted in an alkaline medium [
10]. The conducted analysis of hydrometallurgical methods of processing electronic waste shows advantages of hydrometallurgical methods over biological leaching from an economic point of view. The solvents used were HCl, HNO
3, H
2SO
4, C
2H
4O
2, and C
6H
8O
7. The WPCBs had dimensions of 2 × 2, 4 × 4 and 6 × 6 cm in order to establish the possibility of efficient metal extraction without fine grinding of the material. It was concluded that leaching of metals was possible, and the best performance was obtained with an aqueous HCI solution of 100 mL, concentration = 1 M, on a 4 × 4 cm piece of WPCB. The stirring speed was 150 rpm. The process was carried out at room temperature with prior removal of protective coatings using NaOH. The metal was transferred into solution completely within 22 h. In addition to the leaching of Sn and Pb, complete dissolution of Cu was also observed [
11]. A method for low-temperature alkali melting of electronic waste is reported. When the WPCB/alkali ratio is 1:3 and a two-step heating temperature of 723/973 K is maintained for 45 min for each step, the separation rates of metallic elements Al, Pb, Si, Sn, and Zn can reach 99.5%, 81.6%, 97.8%, 88.4%, and 95.7%, respectively [
12]. The combination of pyro- and hydrometallurgical methods can recycle e-waste quite efficiently. Shredded PCB waste after heat treatment (T = 1023 K, t = 7 h) was sub-treated using deep eutectic solvents and ionic liquids. The extraction efficiency of metal ions in the liquid phase ranged from 60 to 100% [
13];
- -
Recycling of e-waste plastics into energy [
14], fuel [
15] lubricants [
16] chemicals [
17], and filaments for 3D printing [
18,
19,
20];
- -
Obtaining new materials based on printed circuit boards and plastic from e-waste [
21,
22,
23];
- -
Use of e-waste plastic and other nonmetals as fillers for construction [
24,
25,
26] and other materials [
27].
Analyzing the above studies, we can say that the most rational solution to the problem of e-waste is its re-use. This approach requires mostly organizational solutions at the legislative level, in terms of control over the circulation, collection, and interaction with producers and consumers regarding electronic equipment; for instance, following the example of South Korea, which has issued some of the most ideal legislation in the field of e-waste management and recycling, its re-use can reach 100% [
28,
29]. European Union countries, guided by Directive 2008/98/EC [
30], have identified priority approaches (as shown in
Figure 1), where the most acceptable is the re-use of serviceable electronic devices for their intended purpose or hypothetical prevention (the level to which it is necessary to strive).
In practice, however, most waste electronic devices are either hopelessly outdated or damaged. In this case, the best solution is to recycle them. Metals are often the main valuable components in terms of recycling. At the same time, the plastics of housings and circuit boards make up a large part of the weight of electronic waste, and so their recycling is no less important [
32]. Turning plastics into energy by burning them or using them as additives in the production of building materials means removing plastics from the production cycle of electronic devices and encouraging the production of new ones from petroleum products, thus increasing the carbon footprint of the product [
33]. The optimal solution in this context is plastic recycling for the purpose of re-manufacturing components of electronic equipment, with some modification, as the recycling of plastic slightly changes its properties [
34]. Developing new structural materials with the required performance characteristics is a high-priority process. Modification of the characteristics of such materials is possible with the use of different fillers. By changing the types of fillers, as well as their quantities and combinations, it is possible to achieve the required characteristics [
35]. Glass [
36], natural fibers [
37], carbon and glass fibers [
38], natural fillers (e.g., walnut shells) [
39], fly ash, and sand [
40] can be used as fillers. These works demonstrate the possibility of manufacturing new materials based on plastic from electronic waste with high-performance properties for various needs. Obtaining electronic waste from plastic components of electronic equipment (housings, etc.) is currently not considered for various reasons. The use of carbon and glass fibers will make the product more expensive. The use of natural sand makes the material heavy and unsuitable for re-use as an electronic device housing. Against this background, microspheres of fly ash, which is a technogenic product derived from the combustion of power coals, present favorable differences. In particular, these microspheres have high strength properties and low bulk density: they are characterized by low density (0.2–0.8 g/cm
3), high mechanical strength (210–350 kg/cm
2), low thermal conductivity (0.1–0.2 W/m∙K), and high thermal stability (1000 °C) [
41]. Therefore, materials based on e-waste plastic and fly ash microspheres as a filler should be expected to have high mechanical properties and relatively low density. The large amount of raw materials in some regions of Kazakhstan makes fly ash microspheres a cheap raw material, as they have been stored in lagoons in large quantities for many decades. In this context, Ekibastuz GRES 1, operating on Ekibastuz coal, with a capacity of 3500 MW, has been in operation since 1980 [
42]. The use of fly ash microspheres, in addition to economic benefits, will also serve to reduce environmental risks.
The purpose of this work is to obtain a new structural material for the manufacturing of housings and other components of electronic equipment, based on the use of ABS FR plastic from electronic waste as a matrix and microspheres of Ekibastuz coal combustion fly ash as a filler, in order to study its characteristics. The novelty of the article lies in the study of the influence of microspheres of fly ash obtained from the combustion of Ekibastuz coal at Ekibastuz GRES 1 on the mechanical properties and thermal characteristics of composite material based on ABS FR plastic obtained from electronic industry waste.
2. Materials and Methods
All of the experiments were carried out at the NJSC ‘D. Serikbayev East-Kazakhstan Technical University’ (
https://www.ektu.kz/divisions/veritas.aspx/; accessed on 3 January 2025). ABS plastic (
Figure 2c,d) from used computer cases (
Figure 2a) and other office equipment (
Figure 2b) was selected for the experiments. The plastic type of the enclosures was determined according to the typical labeling, as shown in
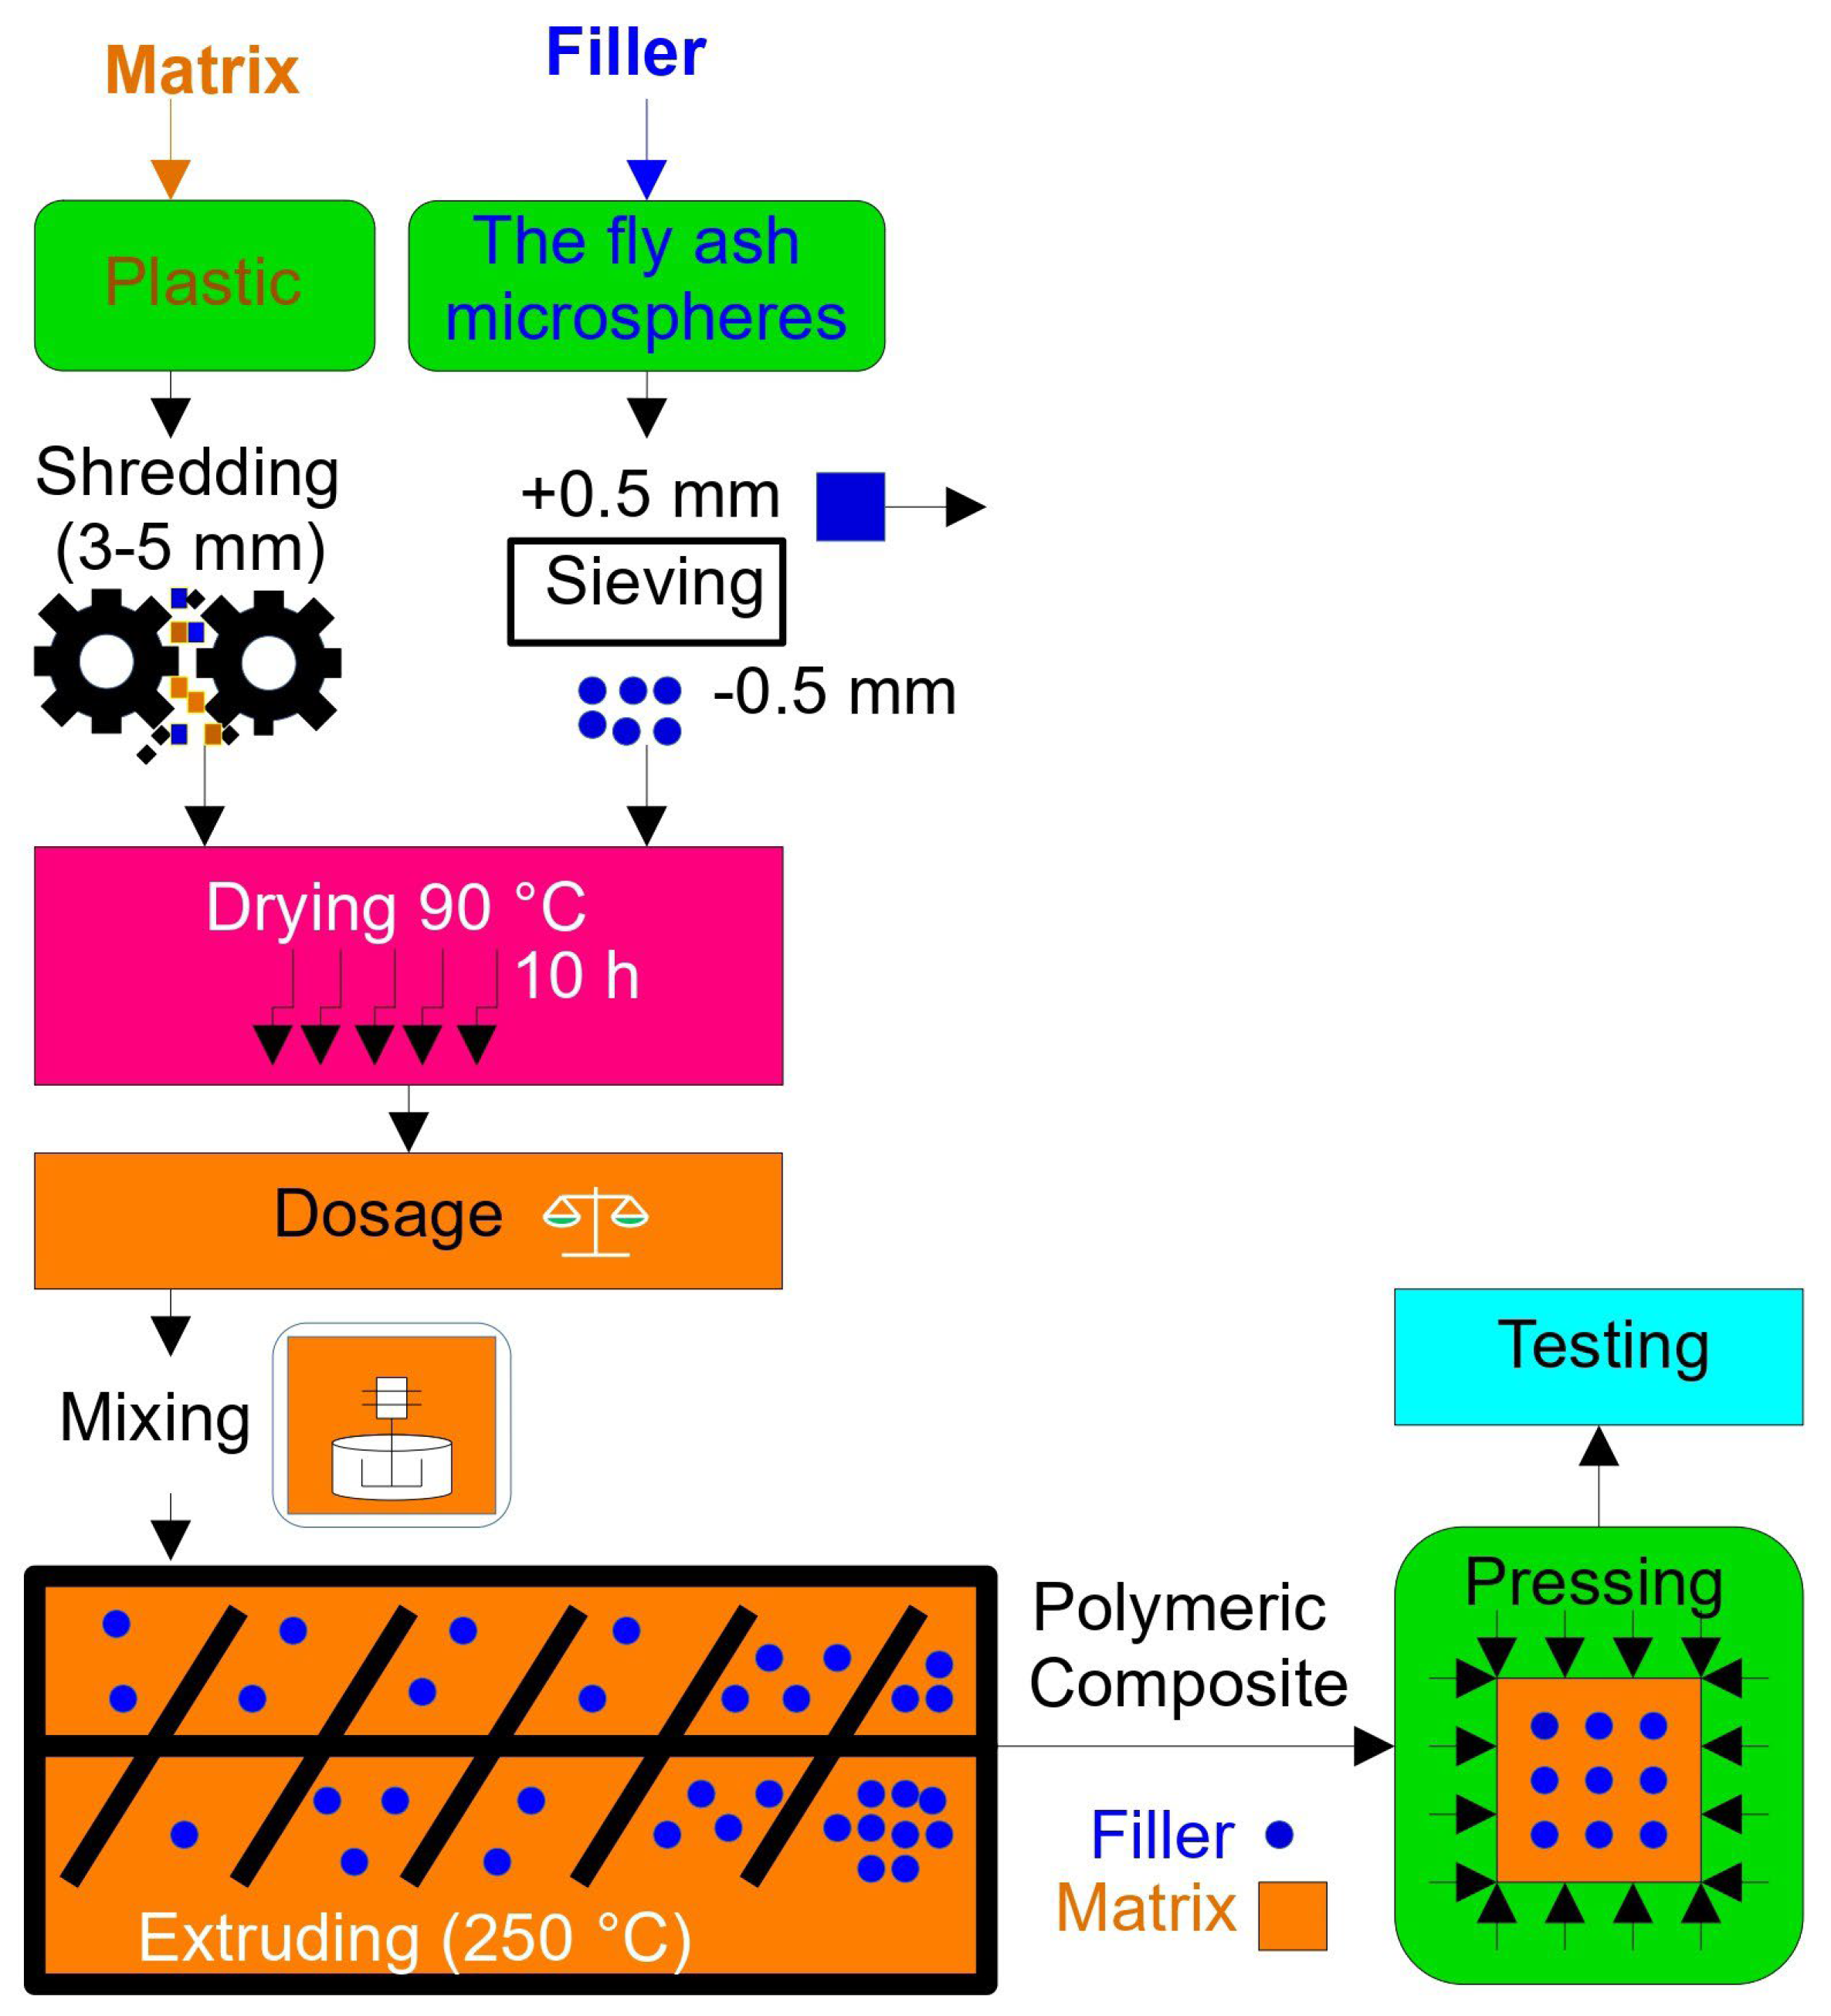
Figure 2e. As can be seen from the labeling, it is ABS FR (flame retardant). The plastic parts of the e-waste were shredded using a drum crusher to a fraction of 4–5 mm (
Figure 2f) and dried before melting for 10 h at 90 °C. Microspheres (
Figure 2g), obtained as Ekibastuz coal fly ash from Ekibastuz GRES 1 (
https://gres1.kz/; accessed on 3 January 2025), were pre-dried for 10 h at 90 °C and sieved to a fraction of less than 0.5 mm for use as a filler. Floating microspheres of fly ash from Ekibastuz GRES 1 (non-magnetic) were obtained from the water surface of the ash collector, where its natural enrichment takes place. It was preliminary cleaned from unburned coal, as well as from various debris. The granulometric composition of microspheres was determined by a laser diffraction method using the laser granulometric analyzer ANALYSETTE 22 NeXT, FRITSCH GmbH (Idar-Oberstein, Germany).
Next, the properties of the microspheres were studied. The bulk density was measured. An X’Pert PRO X-ray diffractometer manufactured by the “PANalitical” company was used for X-ray phase analysis. The topography and microstructure of the sample surfaces, including elemental microanalysis at point areas, were studied using a JSM-6390LV scanning electron microscope manufactured by JEOL Ltd. (Tokyo, Japan), with the INCA Energy Penta FET X3 energy-dispersive microanalysis system manufactured by OXFORD Instruments Analytical Limited (Abingdon, UK). To obtain composite materials on the basis of ABS plastic from electronic waste and microspheres and to determine the optimal ratio of matrix and filler, five compositional variants (10 kg each) were developed, in which the microsphere/plastic ratios were 10/90, 20/80, 30/70, 40/60, and 50/50. A control sample without filler was also prepared. The mixtures were pre-mixed in a construction mixer and then placed in a laboratory extruder with a production capacity of 30 kg/hour. The general scheme of the study is shown in
Figure 3.
As the plastic and microspheres had different densities, they could only be uniformly distributed volumetrically using a specially designed extruder. The extruder was used to produce a homogeneous composite and consists of a tube (
Figure 4a) with three heating zones and a specially designed screw. The auger speed is 25 rpm, and the power of the screw drive motor is 7.5 kW. The extruder has 3 heating elements with a total power of 15 kW. The samples were fed into the extruder, which had been pre-heated to 250 °C (±1.5 °C). Then, the mixture was heated for 30 min. The extruder screw is not a solid screw but, instead, is constructed in the form of blades (see
Figure 4b); therefore, the material is fed forward but has the possibility to return when the extruder outlet window is closed. Thus, after the plastic has been melted by repeated mixing, a uniform distribution of the filler material throughout the die can be achieved. This procedure should presumably have a positive effect on the performance of the composite material. To select the optimal mixing time, each of the five composite variants was divided into two parts. The first part was discharged from the extruder after 2 min of mixing.
The second part was discharged from the extruder after 5 min of mixing. After extrusion, the composite mass was weighed and compressed at 50 bar in a steel mold preheated to 60 °C in order to obtain samples in the form of rectangles with dimensions of 12.7∙12.7∙25.4 mm for compressive strength testing (ASTM D695, Standard Test Method for Compressive Properties of Rigid Plastics, West Conshohocken, USA, 2023), 4 mm square plates with 75 mm sides for Charpy impact strength testing (ISO 179, Plastics—Determination of Charpy impact properties, Vernier, Geneva, Switzerland, 2023), and 3.2 mm square plates with 50 mm sides for tensile strength testing (ASTM D638, Standard Test Method for Tensile Properties of Plastics, West Conshohocken, USA, 2022).
Then, the densities of the obtained composite materials were determined according to ASTM D792, (Standard Test Methods for Density and Specific Gravity (Relative Density) of Plastics by Displacement, West Conshohocken, USA, 2020). Next, the obtained samples were subjected to thermal property analysis using a thermogravimetric analyzer, i.e., TGA/DSC 2 METTLER TOLEDO (Im Langacher Greifensee, Switzerland), with a heating rate of 10 °C/min to 400 °C in atmosphere. The sample weight was 27 ± 0.2 mg. Charpy impact strength was assessed using a pendulum copter according to ISO 179 (1J pendulum, room temperature, 70∙10∙4 mm samples, 2 mm notch) and Rockwell hardness (ASTM D785, Standard Test Method for Rockwell Hardness of Plastics and Electrical Insulating Materials, West Conshohocken, USA, 2023). The tensile strength of specimens was assessed according to ASTM D638 (type I). Compressive strength was studied using a WDW-200 universal tensile compression testing machine. All tests were performed twice. If the error was greater than 1%, the tests were repeated. The surface morphology of specimens was studied with the help of a BX-51 microscope (Olympus, Tokyo, Japan), while the topography and microstructure of the specimen surface, with elemental microanalysis in point areas, were assessed with the help of a JSM-6390LV scanning electron microscope (JEOL Ltd., Tokyo, Japan), with an INCA Energy Penta FET X3 energy-dispersive microanalysis system (OXFORD Instruments Analytical Limited, Abingdon, UK).
3. Results
3.1. Properties of Ekibastuz Coal Microspheres
Figure 5 shows the topography and microstructure of the surface of a fly ash microsphere sample (
Figure 5a), with a map of the distribution of elements in the selected area (
Figure 5b).
Table 1 shows the elemental analysis of spectra 1, 2, and 3 shown in
Figure 5a. It can be seen that mainly oxygen (≥40.57%), aluminum (≥10.65%), silicon (≥17.01%), calcium (≥0.82%), and iron (≥29.86%) are present in the studied spectra.
The bulk density of the microspheres was approximately 0.61 g/m
3. Particle size distribution: 1 µm, 0.4%; 3 µm, 1.7%; 5 µm, 1.7%; 10 µm, 3.1%; 30 µm, 11.6%; 50 µm, 20.9%; 100 µm, 42.2%; and 300 µm, 18.4%. From the X-ray phase analysis data, it follows that the microspheres contained up to 58.3% mullite and 37.8% sillimanite. The main chemical compounds were SiO
2, 57.44%; Al
2O
3, 36.16%; Fe
2O
3, 1.77%; CaO, 0.83%; TiO
2, 0.21%; MgO, 0.35%; K
2O, 0.47%; Na
2O, 0.54%; and other up to 2.33%, with LOI of 2.3%. The obtained data differ slightly, but in general agree with the results of earlier studies of Ekibastuz coal fly ash microspheres [
43]. The large amount of mullite provides the microspheres with thermal stability, low thermal expansion, high creep resistance, high crack propagation resistance, and high thermal shock resistance [
44]. Therefore, the application of microspheres can enhance the performance properties of building materials [
45]. Consequently, their application as a filler can possibly improve the fire resistance and mechanical performance of ABS plastic-based composites.
3.2. Study of Properties of the Obtained Composite Material
Figure 6 shows images of samples with filler (microsphere) contents of 10%, 30%, and 50%, as these best visually represent the effects of differences in the amount of filler. At a mixing time of 2 min, the filler distribution was not uniform (
Figure 6a,c,e), with the microspheres being grouped (highlighted in red). In all cases where the mixing time was 5 min (
Figure 6b,d,f), the distribution of microspheres on the surface of the samples was more uniform. Therefore, it was decided to perform all other tests with the materials obtained and delivered for molding after 5 min of mixing in the extruder.
3.2.1. Density of the Obtained Composite Material
As a result, composite material samples were obtained with microsphere/plastic mass ratios of 10/90 (1), 20/80 (2), 30/70 (3), 40/60 (4), and 50/50 (5), as well as a control sample without microspheres (0). The densities of the materials (g/cm
3) were determined, as detailed in
Table 2. As can be seen from
Table 2, the density of the material decreased with the addition of microspheres from 1.201 g/cm
3 in the control sample without microspheres to 1.052 g/cm
3 at a microsphere/plastic ratio of 10/90 and to 0.812 g/cm
3 at a microsphere/plastic ratio of 50/50.
3.2.2. Thermal Properties of the Obtained Composite Material
The heating response is the main characteristic of ABS flame-retardant (FR) plastic, besides its mechanical properties [
46]. We studied the effect of heating up to 400 °C in an atmosphere with a heating rate of 10 °C/min on the composite material. These heating rates are often used in similar studies [
47].
Figure 7 shows the TGA (
Figure 7a) and DSC (
Figure 7b) analysis of ABS RF plastic samples without microspheres, labeled (0), and samples with added microspheres in microsphere/plastic ratios ranging from 10/90 to 50/50, labeled 1 to 5, respectively. For sample 0, the DSC plot shows three peaks at 113.98 (exothermic process); 272.9 (endothermic process), and 313.34 °C (exothermic process). In the TGA plot, the onset of weight loss process of the sample is observed from a temperature of 185 °C. The first stage of weight loss = 0.42%. The second stage of weight loss = 2.25% from temperature ≈ 250 °C. Then, from temperature 296 °C to 400 °C, a sharp weight loss of the sample, i.e., 24.696%, is observed. The TGA and DSC results of the ABS FR plastic sample with the addition of microspheres, amounting to 10% of the total weight of the sample, are shown as number 1. The DSC plot shows two peaks at 128 and 349.29 °C (exothermic processes). In the TGA plot, the beginning of the sample mass loss process is observed at sample temperature ≈ 210 °C, i.e., 0.22%. Then, from temperature ≈ 236 °C to 400 °C, there is a sharp mass loss of 19.26% of the sample. The results of the TGA and DSC analysis of the ABS FR plastic sample with the addition of microspheres, amounting to 20% of the total weight of the sample, are shown in
Figure 2. The DSC plot shows two peaks at 127.81 and 368.39 °C (exothermic processes). The TGA plot shows the beginning of the sample weight loss process (2.73%) from temperature ≈ 270 °C. Then, from temperature ≈ 326 °C up to 400 °C, there is a sharp mass loss of the sample, i.e., 19.2%.
The number 3 denotes the TGA and DSC analysis of the ABS FR plastic sample with the addition of microspheres at 30% of the total mass of the sample. The DSC plot shows two peaks at 126.62 and 379.37 °C (exothermic processes). The TGA plot shows the beginning of the sample mass loss process from temperature ≈ 260 °C, i.e., 3.76%. Then, from temperature 331 °C to 400 °C, a sharp mass loss of 19.58% of the sample is observed. The number 4 indicates the TGA and DSC analysis of the ABS FR plastic sample with the addition of microspheres at 40% of the total mass of the sample. The DSC plot shows two peaks at 124.45 and 359.57 °C (exothermic processes). The TGA plot shows the onset of weight loss of the sample from a temperature of ≈265 °C, i.e., 0.76%. This is followed by a sharp weight loss of 19.62% from temperature 293 °C to 400 °C. The number 5 indicates the results of the TGA and DSC analysis of the ABS FR plastic sample with the addition of microspheres at 50% of the total weight of the sample. The DSC plot shows two peaks at 124.91 and 367.84 °C (exothermic processes). The TGA graph shows the beginning of the sample weight loss process from temperature ≈ 260 °C, i.e., 1.31%. Then, from temperature 307 °C to 400 °C, a sharp weight loss of 18.01% is observed.
The thermogravimetric analysis curves for experimental polymer samples with further addition of microspheres were similar. The following characteristic sections can be distinguished (
Table 3):
- -
The first part of the curve ranged from the temperature at the beginning of the experiment to the temperature at the beginning of mass loss, T1 ≈ 185–270 °C. The temperature peak of the heat flux of the exothermic reaction for the control sample in this first part was t1 = 113.98 °C, while those for samples 1–5 were greater by approximately 10–14 °C (124–128 °C). In this part, drying of samples with sample mass loss ΔP1 occurred.
- -
The second section for samples 1–5 was defined from the temperature at the end of mass loss of the sample in the first section (T2) up to 400 °C. Here, plastic decomposition occurred, leading to a sharp change in sample mass ΔP2, which was accompanied by exothermic transformation. Temperature peaks of heat flux for the exothermic reaction (t2) for samples 1, 2, 3, 4, and 5 were 349.29 °C, 368.39 °C, 379.37 °C, 359.67 °C, and 367.84 °C, respectively. For the control sample, the second section was located from the temperature denoting the end of mass loss of the sample in the first section (T2) up to approximately 250.07 °C. The temperature peak of the heat flux for the endothermic reaction was t2 = 272.90 °C.
- -
The third part of the curve, from temperature at the end of the mass loss of the sample in the second part up to 400 °C, was observed only for the control sample. The temperature peak of heat flux for the exothermic reaction was t3 = 313.3 °C.
3.2.3. Mechanical Properties of the Obtained Samples
The mechanical characteristics of the obtained samples, according to the experimental results, are presented in
Table 4. From the presented data, it can be seen that the concentration of microspheres leads to a gradual increase in the hardness value. The introduction of microspheres continuously up to 50% increases the hardness of the material from 96 (without microspheres) to 104 Rockwell units (R). The compressive strength value increases when the microsphere content is increased up to 20% from 50.34 MPa (without microspheres) to 52.84 MPa, and then the compressive strength value decreases with increasing number of microspheres. The value of the impact toughness firstly increases but then decreases with increasing microsphere content. The value of the impact strength increases up to a microsphere content = 20% from 1.83 (without microspheres) to 2.08 J/cm
2 and then decreases to 1.74 J/cm
2 at a microsphere content = 50%. The value of tensile strength, as seen in the graph, increases and then starts to decrease smoothly. The value of the tensile strength increases up to the content of microspheres = 20% from 36.12 (without microspheres) to 39.45 MPa and then decreases to 29.78 MPa at a microsphere content = 50%.
Figure 8 shows SEM images demonstrating the morphology of the samples with 20% (
Figure 8a,b) and 30% (
Figure 8c,d) microsphere content. It can be seen that there are areas of microsphere agglomeration, with microsphere particles closely spaced (
Figure 8a, circled in red). Around the microsphere particle, there is a different colored foamy space (
Figure 8a, circled in green); the same particle is enlarged in
Figure 8b. When the microsphere content increases to 30%, areas appear where microspheres cluster into larger agglomerations (
Figure 8c, circled in red). This agglomeration of microsphere particles is magnified in
Figure 8d.
4. Discussion
The introduction of microspheres of fly ash derived from coal combustion at Ekibastuz GRES 1 as a filler in the composition of composite materials based on e-waste ABS RF plastic led to an increase in the thermal stability of the obtained composite materials.
After conditional division into sections, the first section of the TGA and DSC graphs revealed a shift in the peak of the thermal effects of samples with microspheres in relation to the control sample by +15 °C, and the onset temperature of mass loss was shifted by approximately 25–80 °C. The mass loss in the first section for the control sample was 0.42%. With the introduction of microspheres at an amount of 10%, the mass loss was decreased to 0.22%. Meanwhile, with the introduction of microspheres at amounts of 20% and greater, the mass loss increased sharply, amounting to more than 1%; however, it should be noted that this was associated with a higher (+70–80 °C) temperature associated with the beginning of mass loss.
In the second section of the curves, a similar trend was observed, with the introduction of microspheres increasing the temperature of the reaction peaks by approximately 80 °C when compared to the control sample. The mass loss in the second section for the control sample was much lower than that for the samples with the addition of microspheres (2.25% vs. 19% on average for the samples with additives). Moreover, the process for the control sample was endothermic. The control sample also presented a third mass loss section where exothermic processes occurred, with a mass loss of 24.696% from 296 °C to 400 °C. The temperature peak of the exothermic reaction was 313.34 °C, which, on average, was 50 °C less than the exothermic reaction peaks for the materials with added microspheres.
The data obtained differ slightly from those of earlier studies available in open literature sources. It has been reported that, in an atmosphere containing oxygen, the ABS degradation process presented two stages: the first up to 490 °C and the second from 490 °C to approximately 590 °C [
48]. According to other sources, the degradation of butadiene, styrene, and acrylonitrile started at around 340 °C, 350 °C, and 400 °C, respectively [
49]. The closest data were indicated in this study, with the beginning of ABS degradation found to start at 260 °C. However, it was also indicated that the decomposition proceeds in one step [
50]. Thus, the data obtained may indicate the more complex nature of the degradation of ABS plastics and differences in composition, leading to the differences between the thermal effects obtained in this study and those previously described in the literature. However, it can be stated with certainty that the introduction of microspheres changes the thermal stability of ABS in the direction of increased resistance to heat.
The temperature peaks at temperatures from 113 to 127 °C are apparently associated with thermal degradation processes by chain breaking and cross-linking in the polybutadiene phase [
51]. The beginning of mass loss and decomposition of samples from temperatures in the temperature ranges of 185–270 °C is associated with the onset of auto-oxidation and then with thermal degradation, which is consistent with earlier studies showing the initial temperature of auto-oxidation at 193 °C and then the temperature of degradation in the temperature range of 200 °C to 400 °C [
52].
The density of the obtained material decreased, compared to that of the control sample, by 12.4% when the plastic/microsphere ratio was 10/90 and by 32.4% when the plastic/microsphere ratio was 50/50.
Considering the influence of coal combustion fly ash microspheres on mechanical properties, it can be concluded that the impact toughness, tensile, and compressive strength all increased up to a microsphere content of 20%. Then, these characteristics began to decrease, while hardness increased continuously up to a microsphere content of 50%.
This fact can be explained by the high mechanical properties of microspheres [
53]. It is well known that solids do not work well under tension [
54]. In addition, it is reported that a filler with good physical or chemical interaction with the matrix increases the efficiency of the deformation mechanism. However, when the amount of filler increases, the small distance between the particles significantly reduces the mechanical properties due to the imposition of a stress field [
55]. The decrease in impact toughness can be attributed to the effect of decreasing filler adhesion by the matrix when the amount of filler increases [
56]. The effects of microspheres on the mechanical performance of ABS plastic-based composite derived from e-waste were similar to those of microspheres on the mechanical performance of cement mortar-based composites. While the introduction of microspheres increased the mechanical performance of the composite, an excessive increase in the ratio can lead to extreme porosity (
Figure 8c,d) and a decrease in the mechanical performance of the material, which is in agreement with other studies in this area [
57].
5. Conclusions
As a result of the conducted research, materials based on ABS RF plastic from electronic waste and microspheres of fly ash from coal combustion at Ekibastuz GRES 1 were obtained. According to the mechanical characteristics and thermal stability of the obtained material, it can be considered to be perfectly suitable for the manufacturing of electronic device housings (e.g., for laptops, printers, and so on).
The conducted research shows the following:
- -
The introduction of microspheres increases the temperature of the beginning of the thermal effects of decomposition and mass loss of the composite on average by 40–45 °C. The total mass loss when heating up to 400 °C in relation to the control sample (without microspheres) decreases by 5–7%.
- -
The density of the obtained material in comparison with the control sample (without microspheres) decreases from 12.4% at a microsphere/plastic ratio of 10/90 to 32.4% at a microsphere/plastic ratio of 50/50. Consequently, the amount of ABS plastic for product manufacturing can be reduced.
- -
Optimal mechanical properties (Rockwell hardness (R) = 99; impact toughness 22.8 °C = 2.08 J/cm2; compressive strength = 52.84 MPa; tensile strength = 39.45 MPa) and heat resistance (mass loss when heated to 400 °C = 21.93%) showed the composition of microsphere/plastic = 20/80. Material density = 1.016 g/cm3.
The competitive advantages of the material are a reduction in material density while preserving (or even increasing) mechanical properties. No complex equipment is required for production. Floating microspheres of fly ash do not require additional technological operations, i.e., flotation or magnetic separation. Enrichment occurs naturally. This material can be used for the manufacturing of housings and other elements of electronic equipment. The production of competitive products from municipal solid waste on the basis of ABS RF plastic from electronic and technogenical waste in addition to microspheres derived from coal combustion fly ash can be expected to lead to a reduced carbon footprint, considering the involvement of ABS RF plastic from electronic waste and the consequent reduction in primary production.
Author Contributions
Conceptualization, N.K. and R.S.; methodology, N.K. and R.S.; validation, M.S. and N.K.; formal analysis, R.S. and N.K.; investigation, N.K., M.S. and R.S.; resources, N.K., Z.S. and R.S.; data curation, N.K. and R.S.; writing—original draft preparation, N.K. and R.S.; writing—review and editing, R.S., N.K. and Z.S.; visualization, R.S. and N.K.; supervision, N.K.; project administration, N.K.; funding acquisition, N.K. All authors have read and agreed to the published version of the manuscript.
Funding
This research was funded by the Committee of Science of the Ministry of Science and Higher Education of the Republic of Kazakhstan (Grant No. AP23488821 “Development of a reagentless energy and resource saving technology for the extraction of non-ferrous metals from electronic waste”).
Data Availability Statement
The data are unavailable due to privacy, as they are a trade secret.
Conflicts of Interest
The authors declare no conflicts of interest.
References
- Baldé, C.P.; Kuehr, R.; Yamamoto, T.; McDonald, R.; D’Angelo, E.; Althaf, S.; Bel, G.; Deubzer, O.; Fernandez-Cubillo, E.; Forti, V.; et al. Electronic Waste Rising Five Times Faster than Documented E-waste Recycling: UN. Available online: https://ewastemonitor.info/the-global-e-waste-monitor-2024/ (accessed on 5 November 2024).
- Adenuga, A.A.; Amos, O.D.; Olajide, O.D.; Eludoyin, A.O.; Idowu, O.O. Environmental impact and health risk assessment of potentially toxic metals emanating from different anthropogenic activities related to E-wastes. Heliyon 2022, 8, e10296. [Google Scholar] [CrossRef]
- Brindhadevi, A.K.; Barceló, D.; Lan Chi, N.T.; Rene, E.R. E-waste management, treatment options and the impact of heavy metal extraction from E-waste on human health: Scenario in Vietnam and other countries. Environ. Res. 2023, 217, 114926. [Google Scholar] [CrossRef]
- Cai, K.; Song, Q.; Yuan, W.; Yang, G.; Li, J. Composition changes, releases, and potential exposure risk of PBDEs from typical E-waste plastics. J. Hazard. Mater. 2022, 424, 127227. [Google Scholar] [CrossRef]
- Stratiotou Efstratiadis, V.; Michailidis, N. Sustainable Recovery, Recycle of Critical Metals and Rare Earth Elements from Waste Electric and Electronic Equipment (Circuits, Solar, Wind) and Their Reusability in Additive Manufacturing Applications: A Review. Metals 2022, 12, 794. [Google Scholar] [CrossRef]
- Debnath, B.; Roychowdhury, P.; Kundu, R. Electronic Components (EC) Reuse and Recycling—A New Approach towards WEEE Management. Procedia Environ. Sci. 2016, 35, 656–668. [Google Scholar] [CrossRef]
- Maurice, A.A.; Dinh, K.N.; Charpentier, N.M.; Brambilla, A.; Gabriel, J.-C.P. Dismantling of Printed Circuit Boards Enabling Electronic Components Sorting and Their Subsequent Treatment Open Improved Elemental Sustainability Opportunities. Sustainability 2021, 13, 10357. [Google Scholar] [CrossRef]
- Zhao, W.; Xu, J.; Fei, W.; Liu, Z.; He, W.; Li, G. The reuse of electronic components from waste printed circuit boards: A critical review. Environ. Sci. Adv. 2023, 2, 196–214. [Google Scholar] [CrossRef]
- Xia, D.; Lee, C.; Charpentier, N.M.; Deng, Y.; Yan, Q.; Gabriel, J.-C.P. Drivers and Pathways for the Recovery of Critical Metals from Waste-Printed Circuit Boards. Adv. Sci. 2024, 11, 2309635. [Google Scholar] [CrossRef]
- Oke, E.A.; Potgieter, H. Recent chemical methods for metals recovery from printed circuit boards: A review. J. Mater. Cycles Waste Manag. 2024, 26, 1349–1368. [Google Scholar] [CrossRef]
- Jadhav, U.; Hocheng, H. Hydrometallurgical Recovery of Metals from Large Printed Circuit Board Pieces. Sci. Rep. 2015, 5, 14574. [Google Scholar] [CrossRef]
- Chen, B.; He, J.; Sun, X.; Zhao, J.; Jiang, H.; Zhang, L. Separating and recycling metal mixture of pyrolyzed waste printed circuit boards by a combined method. Waste Manag. 2020, 107, 113–120. [Google Scholar] [CrossRef] [PubMed]
- Domańska, U.; Wiśniewska, A.; Dąbrowski, Z. Recovery of Strategic Metals from Waste Printed Circuit Boards with Deep Eutectic Solvents and Ionic Liquids. Processes 2024, 12, 530. [Google Scholar] [CrossRef]
- Islam, M.K.; Khatun, M.S.; Arefin, M.A.; Islam, M.R.; Hassan, M. Waste to energy: An experimental study of utilizing the agricultural residue, MSW, and E-waste available in Bangladesh for pyrolysis conversion. Heliyon 2021, 7, e08530. [Google Scholar] [CrossRef]
- Dai, L.; Zhou, N.; Lv, Y.; Cheng, Y.; Wang, Y.; Liu, Y.; Cobb, K.; Chen, P.; Lei, H.; Ruan, R. Pyrolysis technology for plastic waste recycling: A state-of-the-art review. Prog. Energy Combust. Sci. 2022, 93, 101021. [Google Scholar] [CrossRef]
- Fan, S.; Zhang, Y.; Cui, L.; Maqsood, T.; Nižetić, S. Cleaner production of aviation oil from microwave-assisted pyrolysis of plastic wastes. J. Clean. Prod. 2023, 390, 136102. [Google Scholar] [CrossRef]
- Vollmer, I.; Jenks, M.J.F.; Roelands, M.C.P.; White, R.J.; van Harmelen, T.; de Wild, P.; van der Laan, G.P.; Meirer, F.; Keurentjes JT, F.; Weckhuysen, B.M. Beyond Mechanical Recycling: Giving New Life to Plastic Waste. Angew. Chem. Int. Ed. 2020, 59, 15402. [Google Scholar] [CrossRef]
- Vaibhav, G.; Anirban, G.; Sagar, C.; Aditya, R.; Mei, I.; Veena, S. Transformation of E-Waste Plastics into Sustainable Filaments for 3D Printing. ACS Sustain. Chem. Eng. 2018, 6, 14432–14440. [Google Scholar] [CrossRef]
- Spirio, A.; Arrigo, R.; Frache, A.; Tuccinardi, L.; Tuffi, R. Plastic waste recycling in additive manufacturing: Recovery of polypropylene from WEEE for the production of 3D printing filaments. J. Environ. Chem. Eng. 2024, 12, 112474. [Google Scholar] [CrossRef]
- de Oliveira, R.; Araújo Silva, M.H.; Agrawal, P.; de Figueiredo Brito, G.; Cunha, C.T.C.; Alves de Mélo, T.J. Recycling of Acrylonitrile Butadiene Styrene from Electronic Waste for the Production of Eco-Friendly Filaments for 3D Printing. 3d Print. Addit. Manuf. 2024, 11, e1132–e1140. [Google Scholar] [CrossRef]
- Verma, A.; Narang, N.; Singh, D.; Varma, G.D. Development of e-waste based composite microwave absorbing material. Def. Sci. J. 2021, 71, 365–371. [Google Scholar] [CrossRef]
- Raja, T.; Ayyakkannu, V.; Rathinasamy, T. Experimental analysis of mechanical properties of e-waste composite materials with dual glass fibers. J. Reinf. Plast. Compos. 2024, 43, 713–726. [Google Scholar] [CrossRef]
- Aradoaei, M.; Ciobanu, R.C.; Schreiner, C.; Ursan, A.G.; Hitruc, E.G.; Aflori, M. Thermoplastic Electromagnetic Shielding Materials from the Integral Recycling of Waste from Electronic Equipment. Polymers 2023, 15, 3859. [Google Scholar] [CrossRef]
- Aydın, M.; Bulut, H.A. Evaluation of the effect of E-waste on the permeability properties of polymer concrete composites and their behavior in aggressive environments. Arch. Civ. Mech. Eng. 2024, 24, 194. [Google Scholar] [CrossRef]
- Devi, K.; Kumar, A. Perspective of E-Waste in Concrete: A review. J. Build. Mater. Sci. 2020, 2, 33–37. [Google Scholar] [CrossRef]
- Kumar, G.; Bansal, T.; Haq, M.; Sharma, U.; Kumar, A.; Jha, P.; Sharma, D.; Kamyab, H.; Valencia, E.A.V. Utilizing E-Waste as a Sustainable Aggregate in Concrete Production: A Review. Buildings 2024, 14, 2495. [Google Scholar] [CrossRef]
- Farhan, A.; Qureshi, M.I.; Ahmad, Z. Influence of nano graphite platelets on the behavior of concrete with E-waste plastic coarse aggregates. Constr. Build. Mater. 2022, 316, 125980. [Google Scholar] [CrossRef]
- Law Viewer. Act on Resource Recycling of Electric Electronic Equipment and Vehicles. 2008. Available online: https://elaw.klri.re.kr/eng_mobile/viewer.do?hseq=63675&type=part&key=39 (accessed on 5 November 2024).
- Yoo, K.-Y.; Horvath, B.; Chowdhury, S.; Adiwal, J. Sustainable Development Goals Policy Brief Series No.7. E-Waste Management in Korea: Focusing on Seoul. Available online: https://www.undp.org/sites/g/files/zskgke326/files/migration/seoul_policy_center/USPC-SDG-Policy-Brief-7-E-waste.pdf (accessed on 5 November 2024).
- European Union. Directive 2008/98/EC of the European Parliament and of the Council of 19 November 2008 on Waste and Repealing Certain Directives (Text with EEA Relevance). Available online: https://eur-lex.europa.eu/legal-content/EN/TXT/?uri=celex%3A32008L0098 (accessed on 5 November 2024).
- D’Inverno, G.; Carosi, L.; Romano, G. Meeting the challenges of the waste hierarchy: A performance evaluation of EU countries. Ecol. Indic. 2024, 160, 111641. [Google Scholar] [CrossRef]
- Elgarahy, A.M.; Eloffy, M.G.; Priya, A.K.; Hammad, A.; Zahran, M.; Maged, A.; Elwakeel, K.Z. Revitalizing the circular economy: An exploration of e-waste recycling approaches in a technological epoch. Sustain. Chem. Environ. 2024, 7, 100124. [Google Scholar] [CrossRef]
- Gabisa, E.W.; Ratanatamskul, C.; Gheewala, S.H. Recycling of Plastics as a Strategy to Reduce Life Cycle GHG Emission, Microplastics and Resource Depletion. Sustainability 2023, 15, 11529. [Google Scholar] [CrossRef]
- Oliveira, I.M.; Gimenez, J.C.F.; Xavier, G.T.M.; Ferreira, M.A.B.; Silva, C.M.P.; Camargo, E.R.; Cruz, S.A. Recycling ABS from WEEE with Peroxo-Modified Surface of Titanium Dioxide Particles: Alteration on Antistatic and Degradation Properties. J. Polym. Environ. 2024, 32, 1122–1134. [Google Scholar] [CrossRef]
- Seghiri, M.; Boutoutaou, D.; Kriker, A.; Hachani, M.I. The Possibility of Making a Composite Material from Waste Plastic. Energy Procedia 2017, 119, 163–169. [Google Scholar] [CrossRef]
- Worku, B.G.; Alemneh Wubieneh, T. Composite material from waste poly (ethylene terephthalate) reinforced with glass fiber and waste window glass filler. Green Chem. Lett. Rev. 2023, 16, 2169081. [Google Scholar] [CrossRef]
- Nurazzi, N.; Asyraf, M.R.M.; Rayung, M.; Norrrahim, M.N.F.; Shazleen, S.S.; Rani, M.S.A.; Shafi, A.R.; Aisyah, H.A.; Radzi, M.H.M.; Sabaruddin, F.A.; et al. Thermogravimetric Analysis Properties of Cellulosic Natural Fiber Polymer Composites: A Review on Influence of Chemical Treatments. Polymers 2021, 13, 2710. [Google Scholar] [CrossRef] [PubMed]
- De Fazio, D.; Boccarusso, L.; Formisano, A.; Viscusi, A.; Durante, M. A Review on the Recycling Technologies of Fibre-Reinforced Plastic (FRP) Materials Used in Industrial Fields. J. Mar. Sci. Eng. 2023, 11, 851. [Google Scholar] [CrossRef]
- Oleiwi, J.K. Study of Polymeric Composite Reinforced with Natural Particles: Measurement and Evaluation. Int. Inf. Eng. Technol. Assoc. 2022, 21, 113–117. [Google Scholar] [CrossRef]
- Karedla, A.B.; Schuster, J.; Shaik, Y.P. Possibility of Making Plastic Roof Tiles from Waste Plastic, Sand, and Fly Ash. Constr. Mater. 2024, 4, 597–610. [Google Scholar] [CrossRef]
- Haustein, E.; Kuryłowicz-Cudowska, A. The Effect of Fly Ash Microspheres on the Pore Structure of Concrete. Minerals 2020, 10, 58. [Google Scholar] [CrossRef]
- Ekibastuz GRES-1 LLP. Available online: https://gres1.kz/ (accessed on 3 January 2025).
- Fomenko, E.V.; Anshits, N.N.; Vasilieva, N.G.; Mikhaylova, O.A.; Rogovenko, E.S.; Zhizhaev, A.M.; Anshits, A.G. Characterization of fly ash cenospheres produced from the combustion of Ekibastuz coal. Eng. Fuels 2015, 29, 5390–5403. [Google Scholar] [CrossRef]
- Haustein, E.; Kuryłowicz-Cudowska, A. Effect of Particle Size of Fly Ash Microspheres (FAMs) on the Selected Properties of Concrete. Minerals 2022, 12, 847. [Google Scholar] [CrossRef]
- Wang, X.; Yuan, J.; Wei, P.; Zhu, M. Effects of fly ash microspheres on sulfate erosion resistance and chlorion penetration resistance in concrete. J. Therm. Anal. Calorim. 2020, 139, 3395–3403. [Google Scholar] [CrossRef]
- Carrasco, F.; Santana, O.O.; Cailloux, J.; Sánchez-Soto, M.; Maspoch, M.L. Thermal degradation of poly (lactic acid) and acrylonitrile-butadiene-styrene bioblends: Elucidation of reaction mechanisms. Thermochim. Acta 2017, 654, 157–167. [Google Scholar]
- Zanoni, M.A.; Rein, G.; Yermán, L.; Gerhard, J.I. Thermal and oxidative decomposition of bitumen at the Microscale: Kinetic inverse modelling. Fuel 2020, 264, 116704. [Google Scholar]
- Alonso, A.; Lázaro, M.; Lázaro, D.; Alvear, D. Thermal characterization of acrylonitrile butadiene styrene-ABS obtained with different manufacturing processes. J. Therm. Anal. Calorim. 2023, 148, 10557–10572. [Google Scholar] [CrossRef]
- Suzuki, M.; Wilkie, C.A. The thermal degradation of acrylonitrile-butadiene-styrene terpolymei as studied by TGA/FTIR. Polym Degrad. Stab. 1995, 47, 217–221. [Google Scholar] [CrossRef]
- Ghonjizade-Samani, F.; Haurie, L.; Malet, R.; Pérez, M.; Realinho, V. Phosphorus-Based Flame-Retardant Acrylonitrile Butadiene Styrene Copolymer with Enhanced Mechanical Properties by Combining Ultrahigh Molecular Weight Silicone Rubber and Ethylene Methyl Acrylate Copolymer. Polymers 2024, 16, 923. [Google Scholar] [CrossRef]
- Tiganis, B.E.; Burn, L.S.; Davis, P.; Hill, A.J. Thermal degradation of acrylonitrile–butadiene–styrene (ABS) blends. Polym. Degrad. Stab. 2002, 76, 425–434. [Google Scholar] [CrossRef]
- Duh, Y.-S.; Ho, T.-C.; Chen, J.-R.; Kao, C.-S. Study on Exothermic Oxidation of Acrylonitrile-butadiene-styrene (ABS) Resin Powder with Application to ABS Processing Safety. Polymers 2010, 2, 174–187. [Google Scholar] [CrossRef]
- Arunachalam, K.P.; Avudaiappan, S.; Flores, E.I.S.; Parra, P.F. Experimental Study on the Mechanical Properties and Microstructures of Cenosphere Concrete. Materials 2023, 16, 3518. [Google Scholar] [CrossRef]
- Jiang, B.; Ding, Y.; Guo, Y.; Li, Y. Comparative study on the dynamic compressive, tensile and flexural properties of soda-lime silicate glass. Constr. Build. Mater. 2023, 388, 131708. [Google Scholar] [CrossRef]
- Carvalho, G.B.; Canevarolo, S.V., Jr.; Sousa, J.A. Influence of interfacial interactions on the mechanical behavior of hybrid composites of polypropylene/short glass fibers/hollow glass beads. Polym. Test. 2020, 85, 106418. [Google Scholar] [CrossRef]
- Ferreira, T.R.M.; Lechtman, M.A.; Dias, F.L.; Silva, A.B. Effect of hollow glass microspheresaddition on density reduction and mechanical properties of PA6/glass fibers composites. Polím. Ciênc. Tecnol. 2022, 32, e2022001. [Google Scholar] [CrossRef]
- Hanif, A.; Lu, Z.; Diao, S.; Zeng, X.; Li, Z. Properties investigation of fiber reinforced cement-based composites incorporating cenosphere fillers. Constr. Build. Mater. 2017, 140, 139–149. [Google Scholar] [CrossRef]
| Disclaimer/Publisher’s Note: The statements, opinions and data contained in all publications are solely those of the individual author(s) and contributor(s) and not of MDPI and/or the editor(s). MDPI and/or the editor(s) disclaim responsibility for any injury to people or property resulting from any ideas, methods, instructions or products referred to in the content. |
© 2025 by the authors. Licensee MDPI, Basel, Switzerland. This article is an open access article distributed under the terms and conditions of the Creative Commons Attribution (CC BY) license (https://creativecommons.org/licenses/by/4.0/).


