Article

A Novel Experimental Technique to Facilitate Determination of the Light Extinction Characteristics of Photocatalyst Dispersions

by
Vasilis C. Sarasidis
and
Anastasios J. Karabelas
*
Laboratory of Natural Resources and Renewable Energies, Chemical Process and Energy Resources Institute, Centre for Research and Technology-Hellas (CERTH), Thermi, 57001 Thessaloniki, Greece
*
Author to whom correspondence should be addressed.
Processes 2025, 13(4), 1007; https://doi.org/10.3390/pr13041007
Submission received: 7 March 2025 / Revised: 23 March 2025 / Accepted: 25 March 2025 / Published: 27 March 2025
(This article belongs to the Section Environmental and Green Processes)

Abstract

:
There is a need to develop facile methods for the determination of UV light extinction characteristics of photocatalysts. For this task, a novel technique is proposed, applicable to dispersed photocatalyst processes of practical interest. The technique is demonstrated by obtaining fairly extensive data sets of transmittance and extinction coefficients, using TiO2 particle suspensions at various concentrations and pH values ~3, ~5, and ~8, with light lamps of different irradiation types (i.e., UVC and UVA), immersed in the medium. To estimate the light absorption coefficient, under various tested conditions, the simplified Kubelka–Munk model is employed. The results obtained, regarding both the total light extinction and absorption coefficient, are in accord with similar literature data. The demonstrated technique is considered useful for process development studies and the design of photocatalytic reactors.

1. Introduction

A reliable determination of the light-extinction parameters (particularly the coefficients of absorption κ and scattering σ) is essential for the development of comprehensive models of the complicated photocatalytic reaction processes (e.g., [1,2]). Such process models are necessary for research and development as well as for the scale-up from laboratory/pilot to large/commercial size photocatalytic systems intensely pursued in recent decades [3,4,5]. This work deals with the catalyst slurry/suspension type photocatalytic reactors. In this area, despite fairly extensive work [2,6,7,8], significant issues remain to be resolved, particularly for the reliable and facile determination of light absorption, due to the multitude of interacting process parameters, including the light characteristics (commonly of quite a broad wavelength), the catalyst particle physico-chemical/material properties and concentration as well as the fluid conditions (pH and composition). Notable complications arise due to the well-known tendency of the catalyst particles (of a primary size in the 10 to 102 nm range [9]) to form aggregates and agglomerates of a rather broad distribution, with a mean size well above 1 μm, depending on fluid pH, composition, and sonication [10,11].
Quite a few interesting studies have been performed [12,13,14,15,16,17,18] to determine light extinction characteristics, usually under specific/idealized photocatalytic conditions, such as monochromatic UV light and controlled (through sonication) catalyst particle size. Some of these studies, briefly outlined here, have led to an improved understanding of the light extinction phenomena including the influence of key parameters.
In their seminal papers, Cabrera et al. [12] and later Satuf et al. [13] have used diffuse reflectance and transmittance spectrophotometric measurements of various TiO2 dispersions to determine the variability of absorption and scattering coefficients (κ and σ) for monochromatic UV light in the range 275 nm to ~405 nm and mean agglomerate/particle sizes 300 nm to 900 nm. A fairly rigorous approach was followed involving the basic radiative transfer equation (RTE). For the determination of κ and σ from the measured extinction coefficient β, they used a model for the system under study, to describe the radiation field in the test cell and through an application of a nonlinear optimization program to adjust/fit the model predictions to the experimental data. The results obtained [13] are considered a good reference, for the employed test conditions; however, the combined experimental and computational effort involved in this approach is quite intricate and demanding, particularly for routine use.
In papers [14,15,16], appearing at about the same time, a test cell with external irradiation was used to obtain transmittance I/Io data and a simplified approach was implemented for the determination of the light-extinction parameters of photocatalyst dispersions. Specifically, making several assumptions, the Schuster–Schwarzschild approximation [19] to the basic RTE was obtained, which models the monochromatic radiation field in terms of two oppositely directed fluxes (and respective equations), i.e., a forward flux (I) due to irradiation and a backward flux (J) due to light scattering. For these model equations, the well-known (in the field of diffuse reflectance) hyperbolic solution of Kubelka–Munk (K-M) [20,21] is employed to determine the extinction parameters κ and σ. Of particular interest to this work (as will be subsequently discussed), are the experimental results obtained by Yurdakal et al. [15], by employing this approach for TiO2 (Degussa P25) dispersions and a monochromatic UV light of 310 nm and 370 nm. In a more recent study by Calza et al. [17], the approach based on the Κ-Μ expression was also employed to estimate the adsorption coefficient κ as well as the spatial variability of transmittance I/Io, which were further used in a simplified expression of the photocatalytic reaction rate, as will be subsequently discussed. These authors [17] used several commercial TiO2 catalysts and a UVA light of wavelength ~350 nm to ~400 nm. Comparing the results on β, κ, and σ, obtained in the above-mentioned typical studies [13,15,17], it should be noted that there are differences that need to be clarified, particularly when different experimental techniques are used, with commercial UV lamps of a fairly broad wavelength spectrum and particles of a broad distribution.
Studies focusing on the effect of fluid medium properties on the dispersion and aggregation characteristics of photocatalysts are complementary to the work on their light extinction characteristics. Suttiponparnit et al. [10] studied the effect of aqueous medium properties on the dispersion characteristics of TiO2 particles, including Degussa P25. By reducing the pH below 6 (IEP for P25 at pH~6.2), their data show a significant increase of the particle-specific surface area (in cm2/g), obviously associated with agglomerate size reduction; size reduction is also observed for pH < 8. The reported average hydrodynamic diameter tends to increase (well above 1 μm) with an increasing NaCl solution ionic strength. Also, at a fixed pH, an increase in TiO2 mass concentration leads to a higher degree of agglomeration, which is attributed to the increased particle collision frequency. These results hold only for rather simple aqueous dispersions. However, as noted by Sharma [22], little is known about the effect of natural organic matter (ever present in effluents to be treated) on the aggregation of nano-TiO2. This implies that specific experimental effort should be devoted to determine the light extinction characteristics of the particular effluents under study. Along the same lines, it should be noted that the absorption by particles of the short wavelength UVC light, commonly used for the direct decontamination of water from biological species, has a negative effect as it reduces the availability of photons for this function [23].
The preceding brief literature review suggests that experimental light extinction data for practical applications should be taken under realistic conditions, representative of the process under investigation and/or development. Furthermore, appropriate experimental tools are necessary for this task. In this paper, a novel experimental technique is presented which greatly facilitates the collection of UV light extinction data and the determination of absorption and scattering coefficients. This technique is demonstrated by employing a common commercial TiO2 photocatalyst (Degussa P25) in dispersions of various concentrations, at three pH values and two types of irradiation, i.e., UVA and UVC. Such complete data sets, particularly with UVC light, are rarely reported in the open literature, even though UVC light has been employed successfully at a pilot scale [4,5,24].

2. Theoretical Background

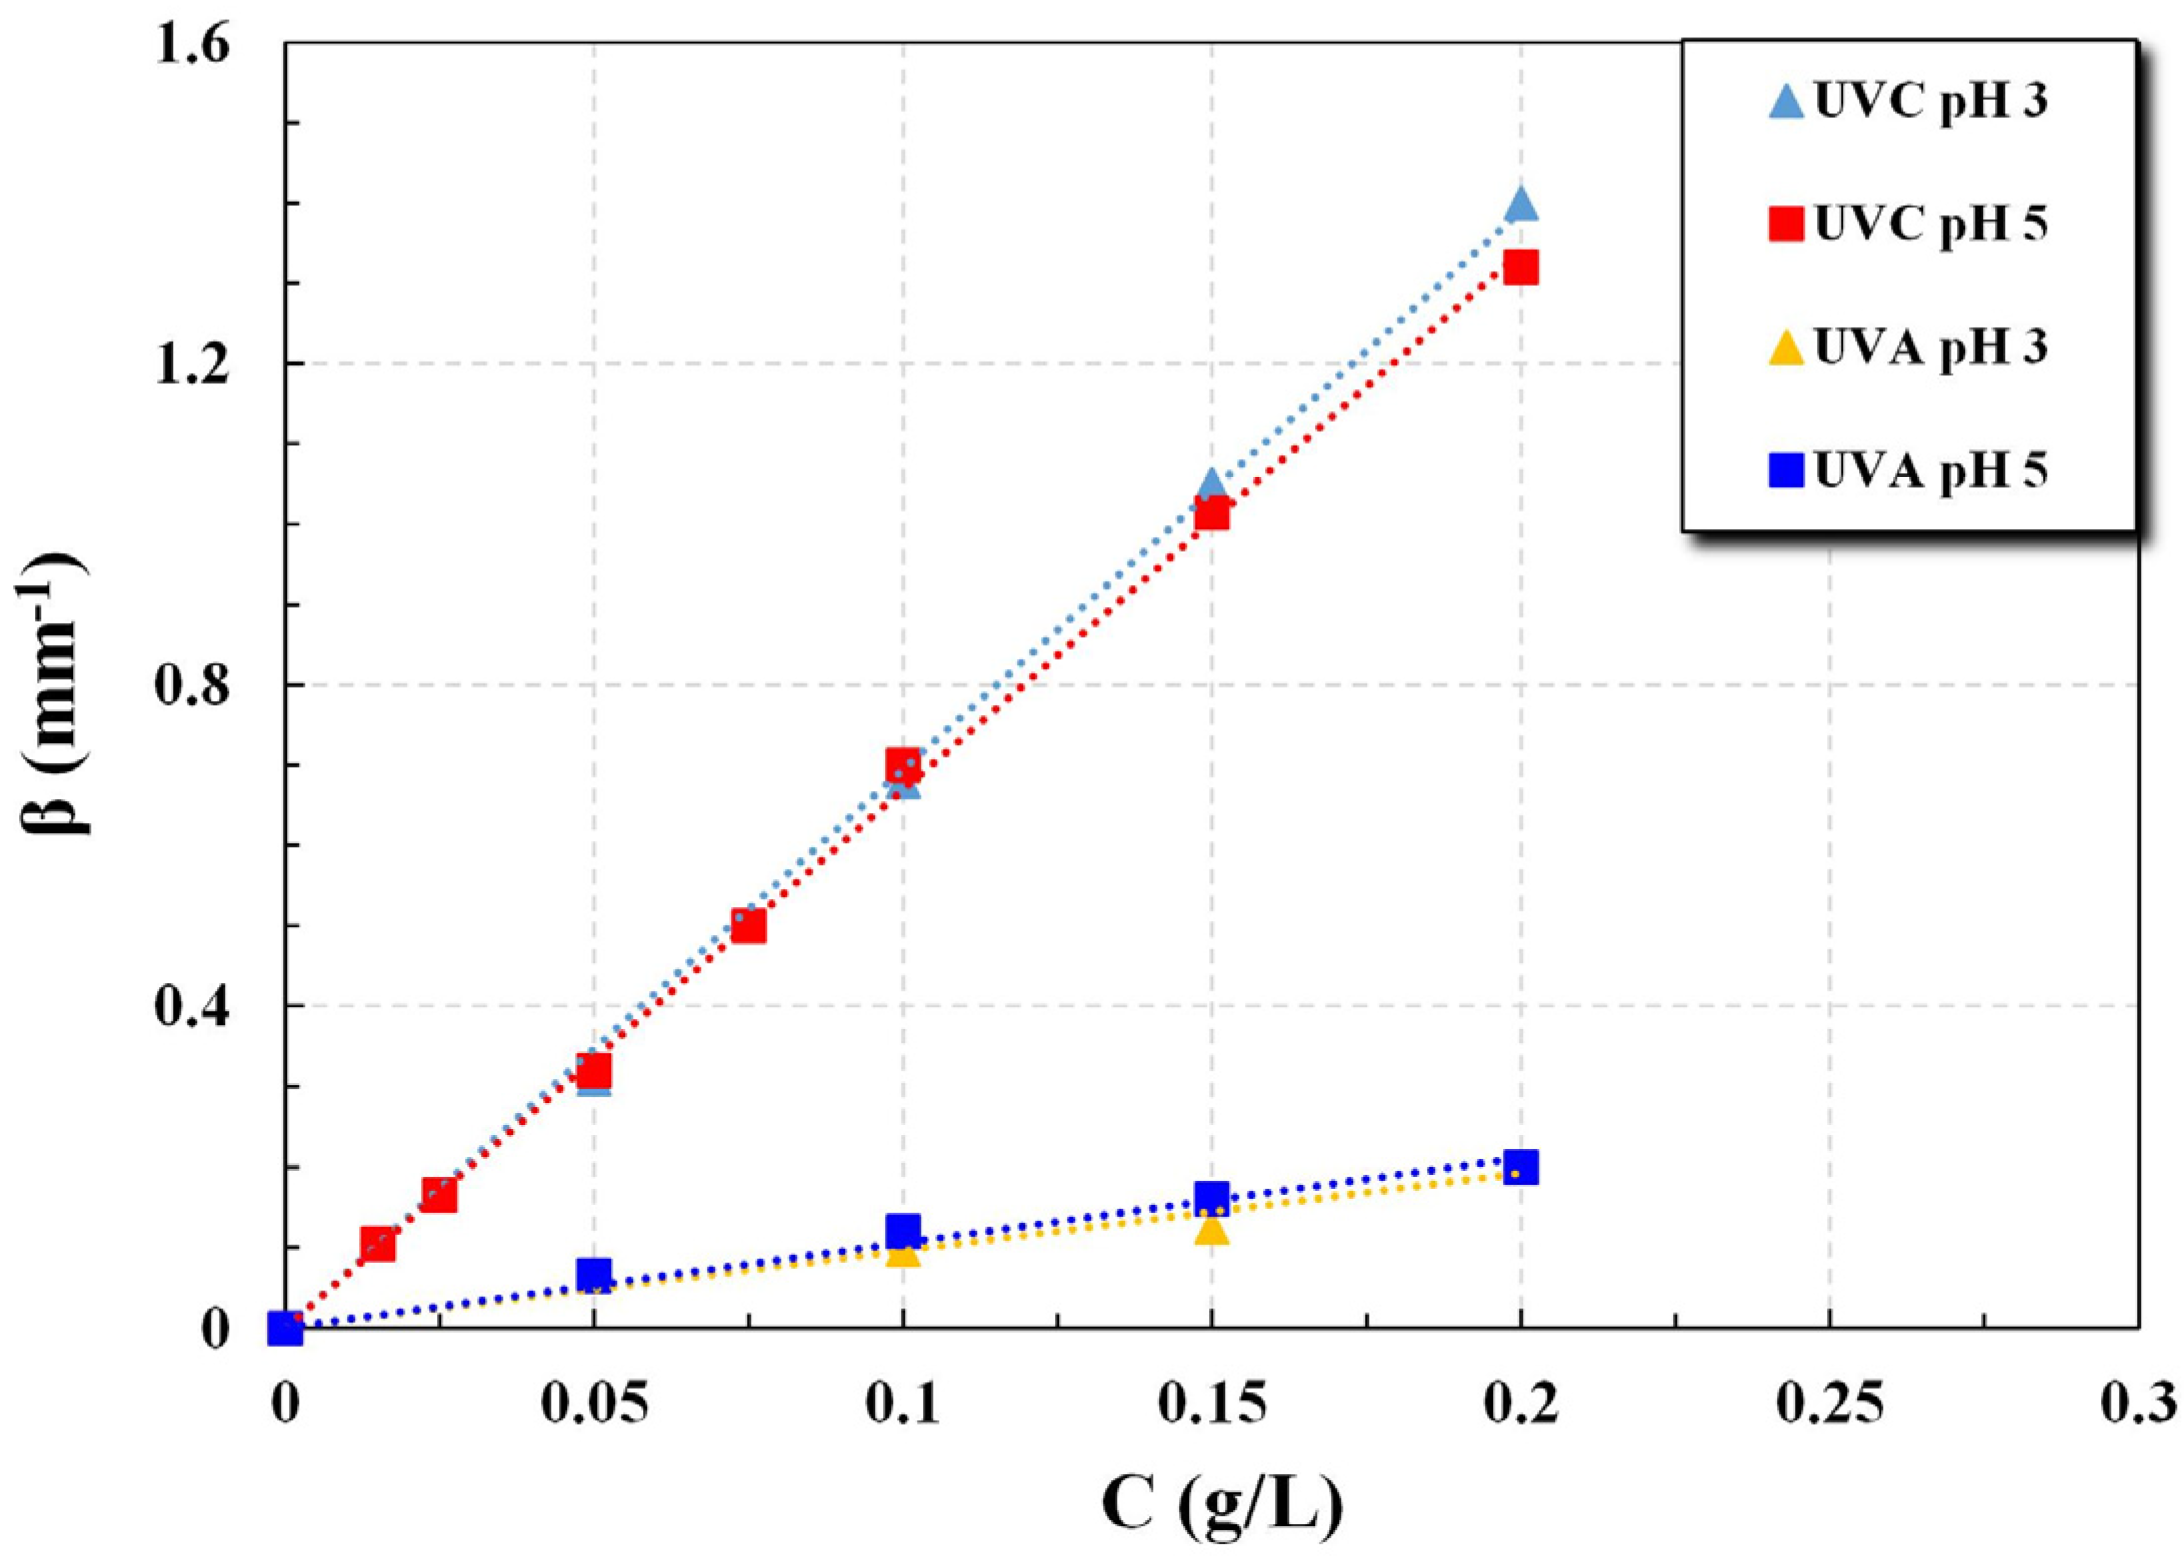
The experimental data sets of light transmittance I(z)/Io variation with a depth of irradiation field z, for a fixed catalyst particle mass concentration C, were used to determine the total extinction coefficient β (mm−1) in the range of concentration C = 0.015 to 0.20 g/L. Further, these data were employed to estimate the coefficients of absorption κ and scattering σ by fitting the above-mentioned hyperbolic K-M solution [20,21], which is of the form:
I z = ν I o u · sinh ν σ z + ν · cosh ( ν σ z )
where
β = ( σ + κ )
u =   β σ
ν = ( u 2 1 ) 1 / 2
Further, the spectral albedo as follows:
ω = σ σ + κ
which is strongly dependent on the wavelength of incident light [13,15], is commonly used in the literature to designate the fraction of scattered and absorbed light. As shown above (Equations (2)–(5)), both parameters u and v are functions of albedo ω, only.
As indicated in the Introduction, the Κ-Μ solution (Equation (1)) is applicable to the problem at hand under several simplifying assumptions discussed in the literature [14,21,25]. The main assumption is that the medium, subjected to diffuse monochromatic radiation, is comprised of parallel layers (in the form of slabs), with the incident radiation impinging perpendicularly. Additionally, only a forward flux (I) due to irradiation and a backward flux (J) due to light scattering are taken into account. The experimental set-up and the data reported herein are assessed by considering these assumptions, as will be subsequently discussed.
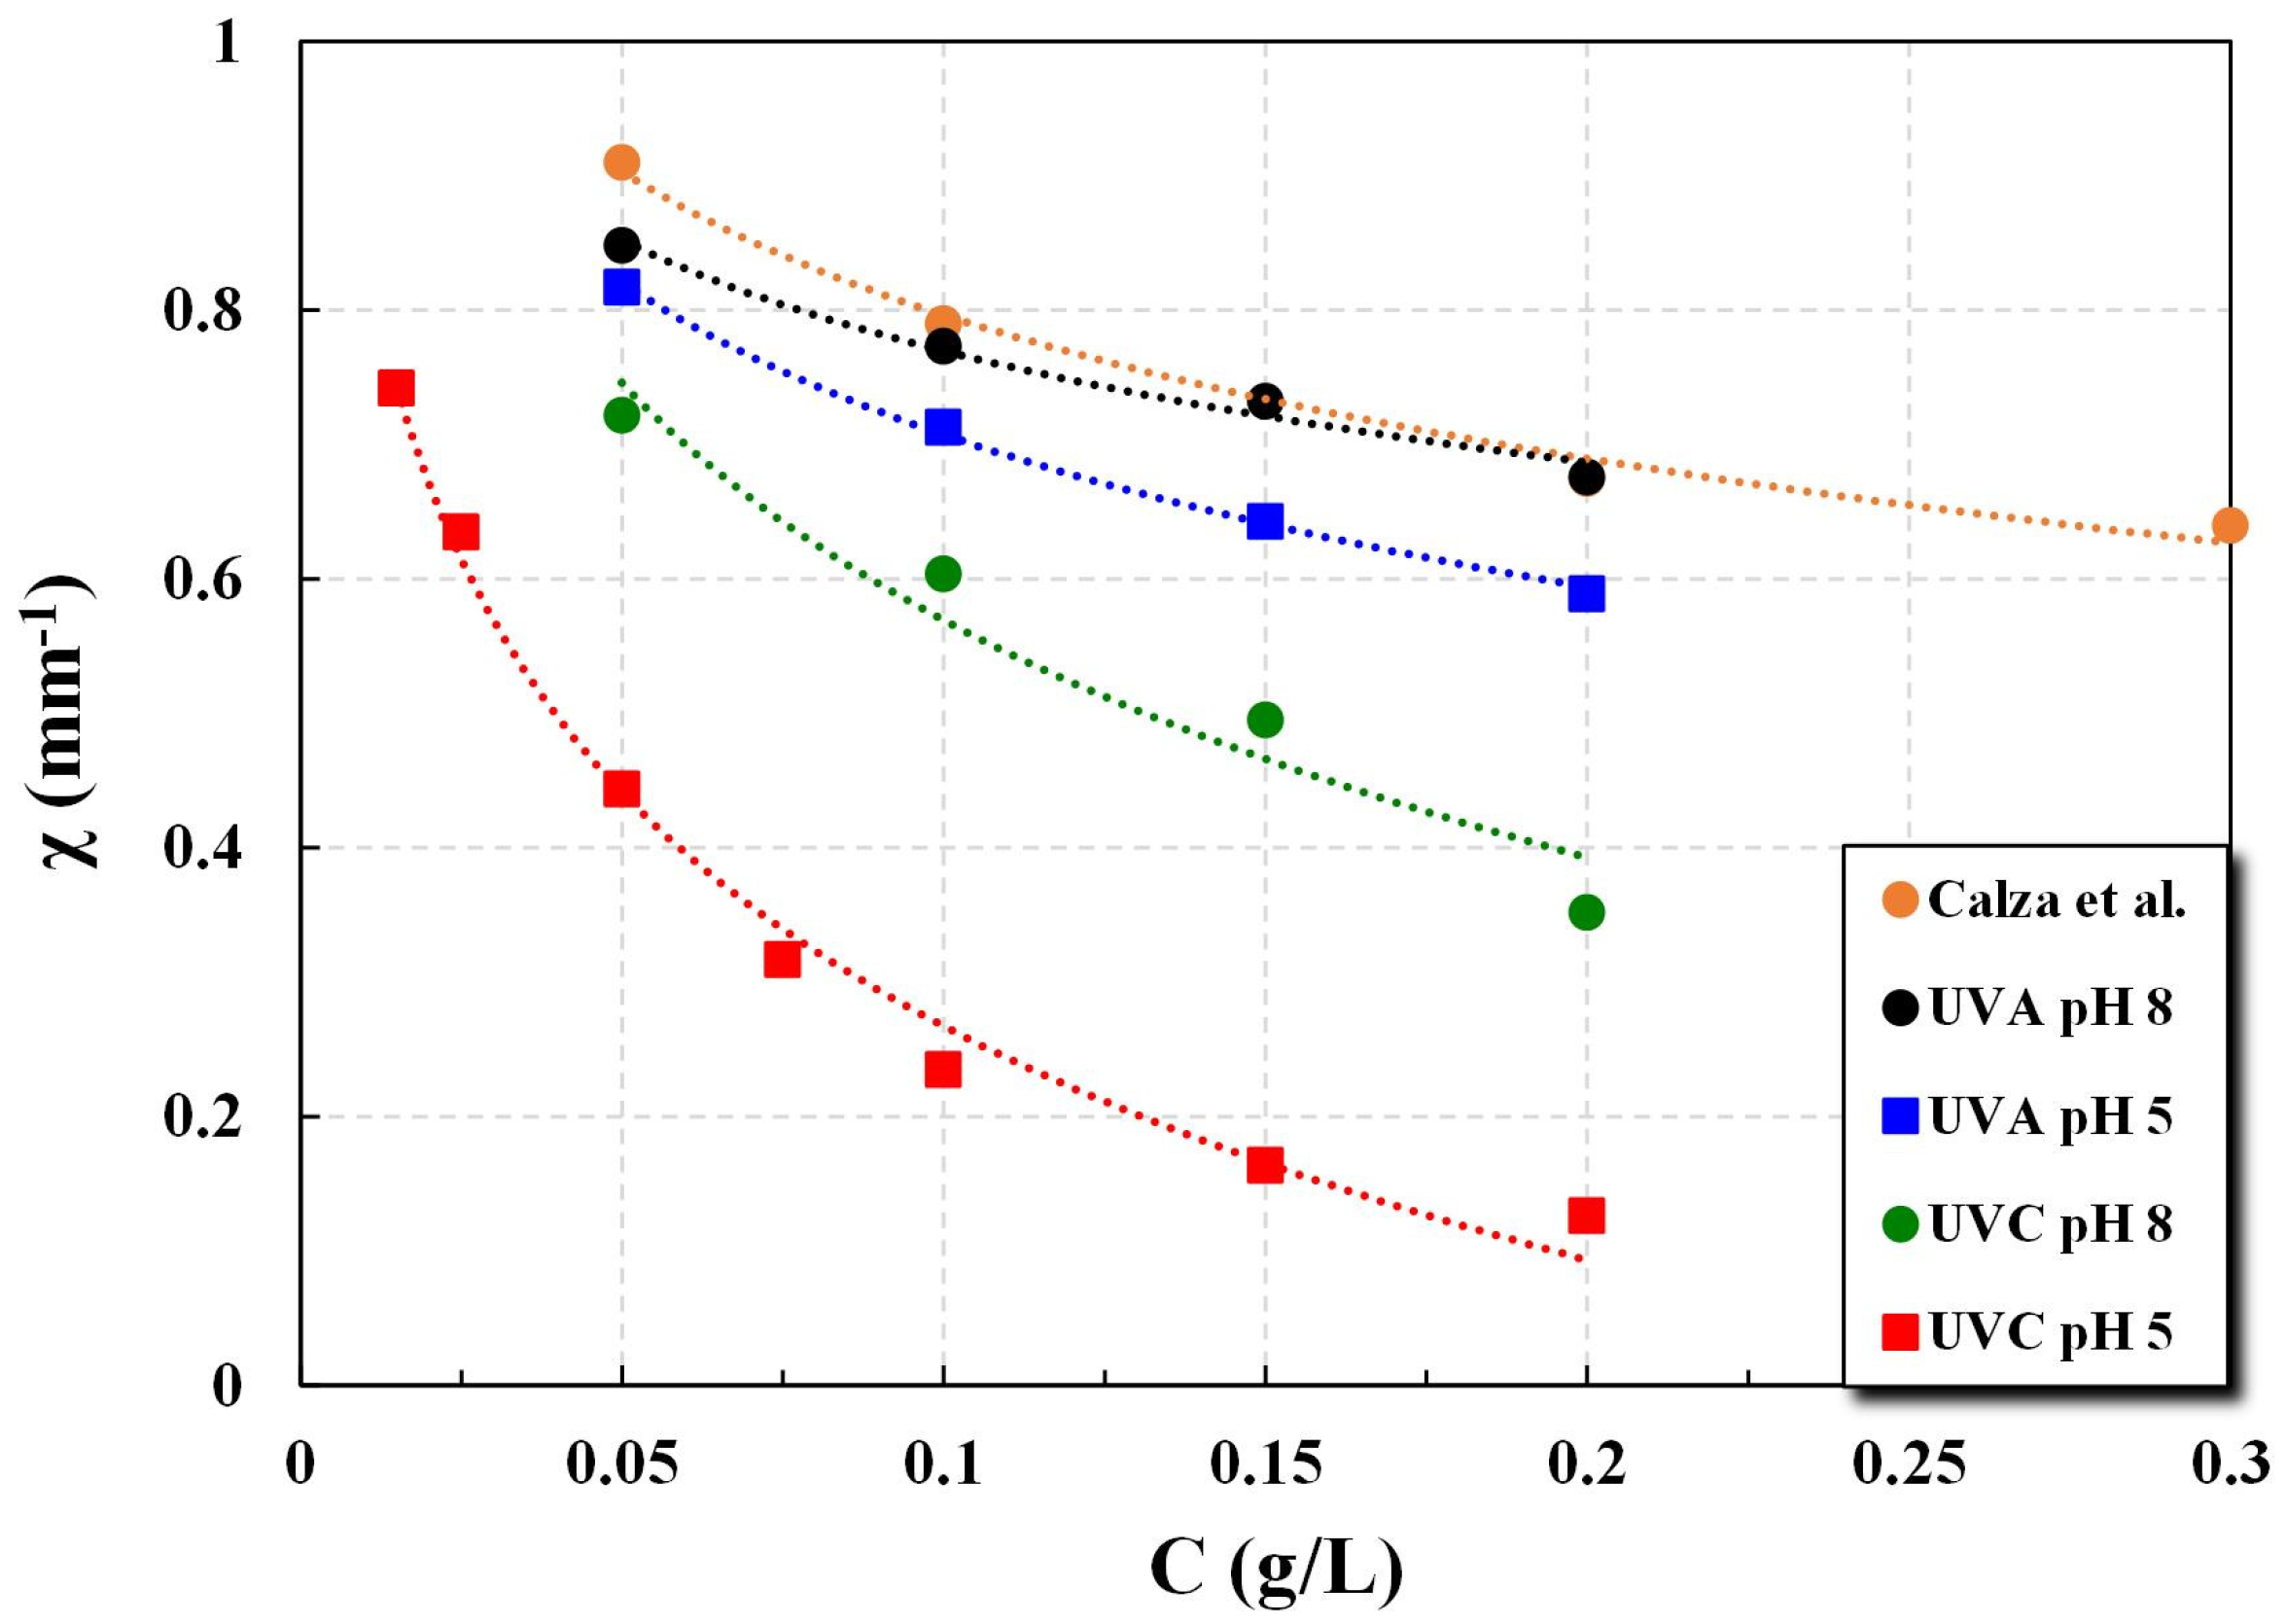
The estimated absorption coefficient κ and the associated transmittance data sets I(z)/Io can be used to determine the rate of specific photocatalytic reactions, employing various approaches proposed in the literature. Calza et al. [17] proposed such a simplified approach and a related rate expression, which (in addition to κ) is a function of a parameter χ, defined as the average square root of light transmittance in the reactor over a depth z between zero and b, as follows:
χ = 1 b 0 b I ( z ) I o   d z
The transmittance I(z)/Io data sets, obtained in this study under various conditions, can be used to determine the respective parameter χ values.

3. Experimental Part

3.1. Experimental Set-Up—Instrumentation

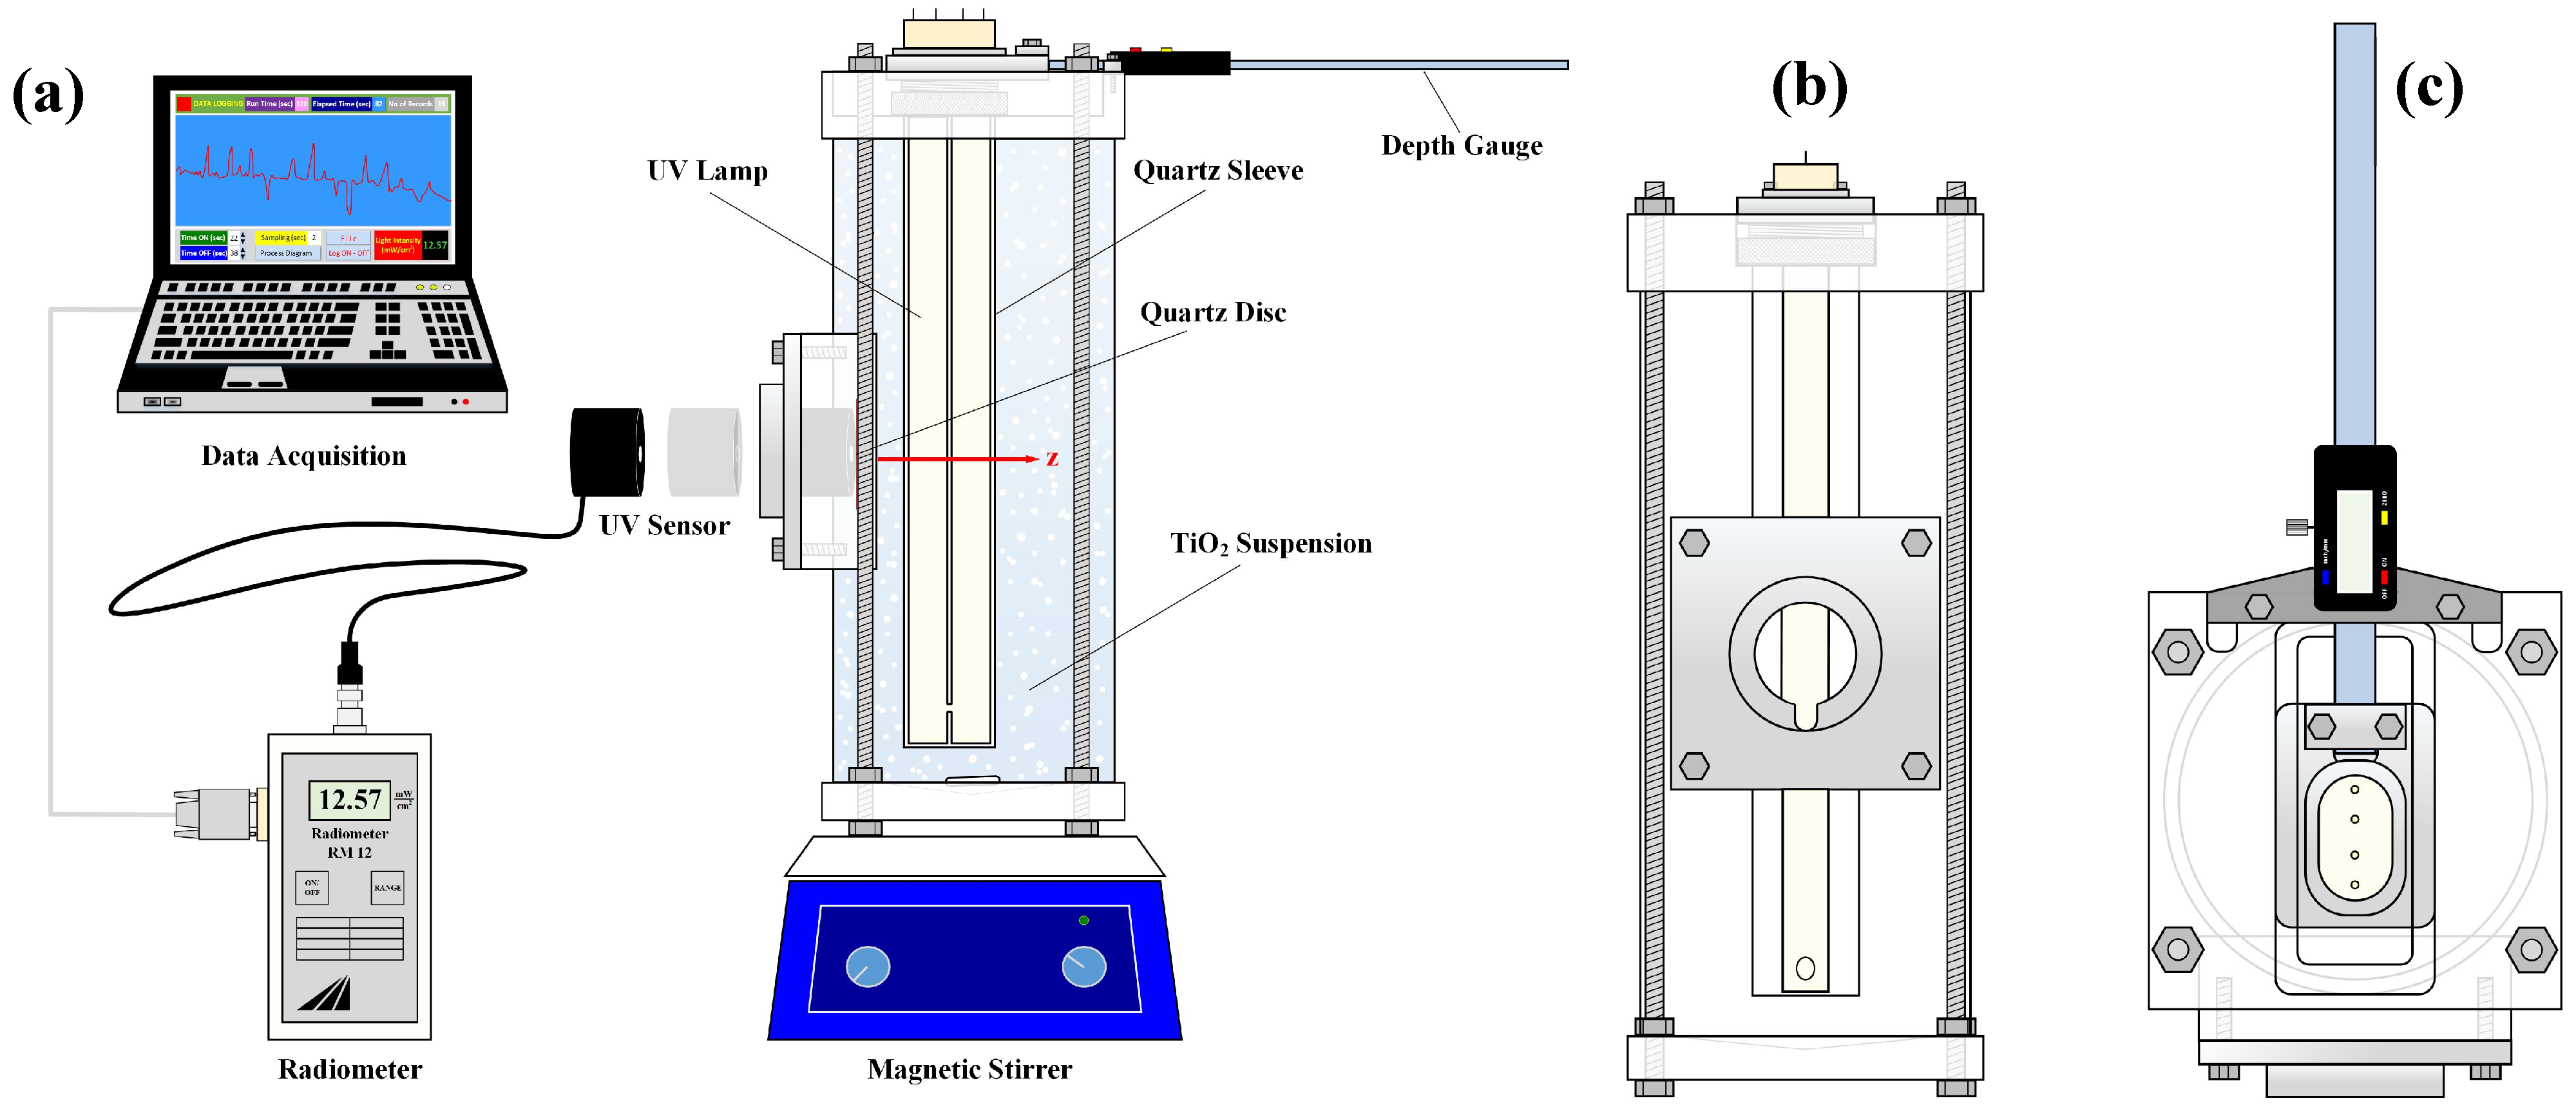
The experimental set-up employed in this study is presented in Figure 1. The photoreactor was designed and constructed in the authors’ NRRE/CPERI/CERTH laboratory; it was made of a cylindrical Plexiglas® vessel (33 cm high and 12 cm ID), two Plexiglas® square end-plates (14 × 14 cm), and a square shaped “window” for the light intensity measurements. The two end-plates, of a thickness of 3 and 1.7 cm, were fixed to the top and the base of the vessel, respectively, through four holes drilled symmetrically and connected together (water-tight) with four threaded steel bars (Figure 1a,b). The base plate was smooth (specially machined) and pan-shaped, to prevent catalyst particle deposition and facilitate cleaning. In the top-plate surface, a special channel was machined, 2 cm deep with a cross section of 12 × 5.5 cm (Figure 1c) to accommodate the depth gauge device for light-source movement. The UV lamp, employed as a light source, was inserted in a cylindrical closed-end tube (sleeve) made of quartz glass (30 cm height and 4.5 cm OD), which was fixed/supported over this channel, and placed vertically inside the vessel, a few centimeters from the bottom. This quartz sleeve was fixed on the radially moving depth gauge bar, with a specially machined component, which was mounted on the top-plate channel. The depth gauge bar was fabricated in such a manner that it could move radially (controlled and adjusted manually), sliding over the channel surface and covering a radial distance up to 4.5 cm from its initial position. A digital gauge (E-DP15J, Kanon, Japan) with a high accuracy (10−2 mm) was employed for the measurement of the depth of the irradiation field.
Therefore, this device allowed for the control and precise measurement of the radial distance z of the UV lamp quartz-sleeve from the flat UV sensor “window” where the UV light sensor was located (Figure 1b). Images of the depth-gauge mechanism and of the photoreactor vessel are included in Supplementary Figure S1. To install the window, a piece of approx. 10 × 10 cm from the cylindrical Plexiglas® vessel was removed, where a flat Plexiglas® piece was fixed (Figure 1b). Another specially designed metal piece was fixed over the window’s face and perforated to support a quartz disc of a 5 cm diameter and a 0.2 cm thickness. This quartz disc (in contact with the suspension) was properly sealed on the back side part of the metal piece, ensuring smoothness. A hole of a 4 cm diameter was opened on the external side of the metal piece, where the UV sensor was placed. Geometrical details at the vessel cross-section where the measurements are made are depicted in Supplementary Figure S2.
A continuous mixing of the catalyst suspensions was maintained with the aid of a magnetic stirring device on which the photoreactor vessel rested. The total working volume of the photoreactor was 3 L. The pH and the temperature of the catalyst dispersion were measured with sensors (744 Metrohm, Herisau, Switzerland) immersed in the vessel. The UV light intensity was recorded with a portable UV-Vis radiometer (RM-12, Dr Grobel, Ettlingen, Germany ), where suitable UVA and UVC sensors were adapted with 315–400 nm and 200–280 nm operating ranges, respectively. For each specific lump location (i.e., depth of field), five to ten light intensity measurements were taken (varying within a narrow range of ±5%) and the median value was retained. All data were monitored, recorded, and stored with the aid of a data acquisition system consisting of a PC, a microSD card, and a software (Advantech GeniDAQ, version 4.0, Germany). Finally, particle size distribution measurements were made with a particle size analyzer Mastersizer S (Malvern Instruments, Malvern, UK).

3.2. Materials

Titanium dioxide (Aeroxide® P25, Evonik, Essen, Germany) powder was used as a photocatalyst in the experiments without any pretreatment. As reported by the manufacturer, this product is a mixture of 75% anatase and 25% rutile; some of its main characteristics include the 50 m2/g BET surface area, 3.18 eV energy band gap, and a 21 nm primary average particle size. Deionized water (DI) (pH 5.8–6.8, eC < 1 μS/cm, and TOC concentration < 0.05 mg/L) was used in all of the experiments of this study, except for some preliminary tests where laboratory tap water was employed. Aqueous solutions of 1 M sodium hydroxide (NaOH) and 1 M hydrochloric acid (HCl), reagent grade (purchased from Riedel-de Haën), were used for the pH adjustment of tested catalyst suspensions.
Two lamps of different irradiation types were employed as light sources, i.e., Philips Actinic BL PL-L 24W UVA and Philips Germicidal TUV PL-L 24W UVC (Philips, Eindhoven, The Netherlands). Both lamps were of a nominal power 24 Watts, U-shaped, and single-ended, with 4 pins in the upper part for a connection to a power supply converter. As shown in Supplementary Figure S3, the UVC lamp emits nearly monochromatic light at wavelength 253.7 nm, whereas the emission spectrum of the UVA lamp is much broader with a peak value at wavelength ~365 nm according to the manufacturer [26].

3.3. Experimental Procedure

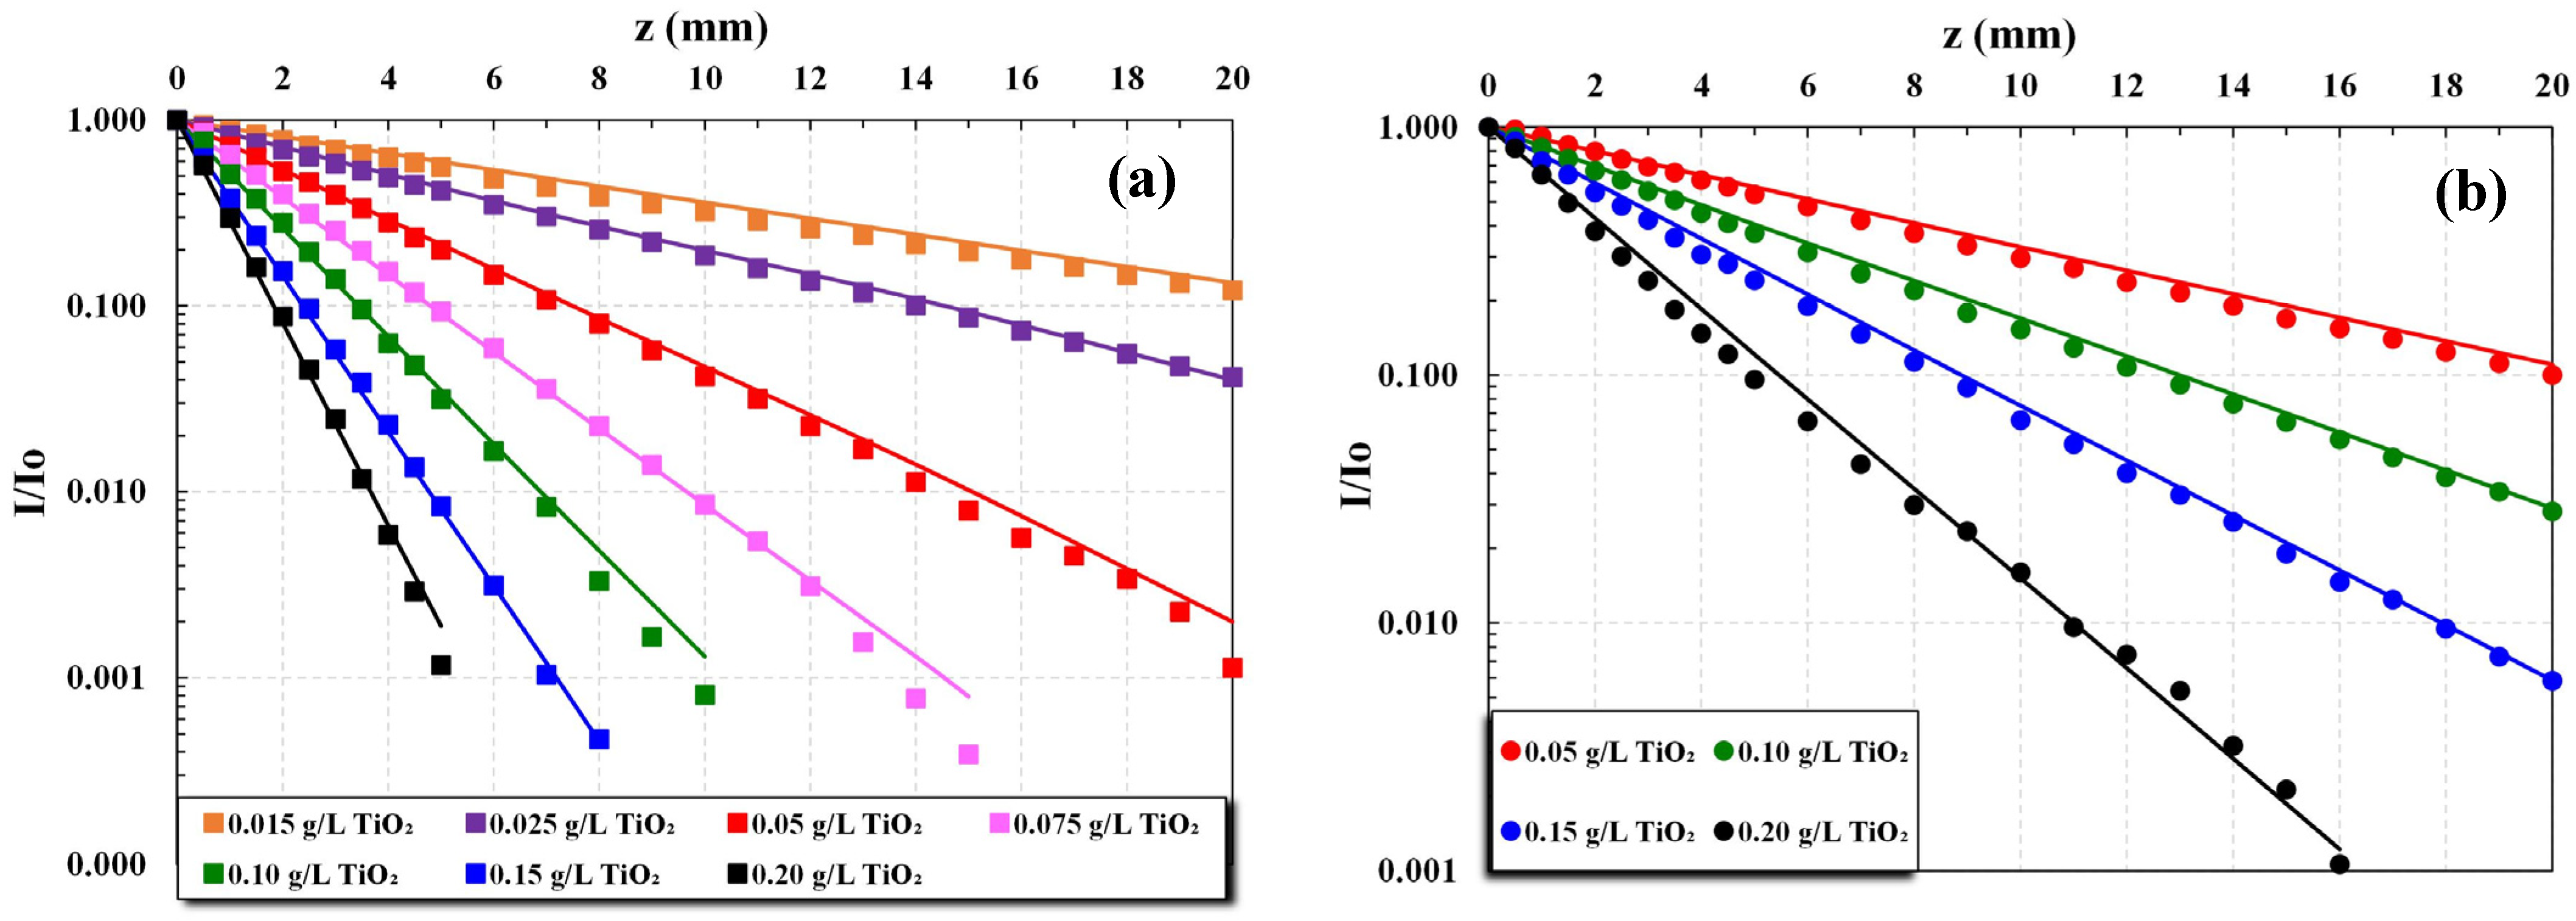
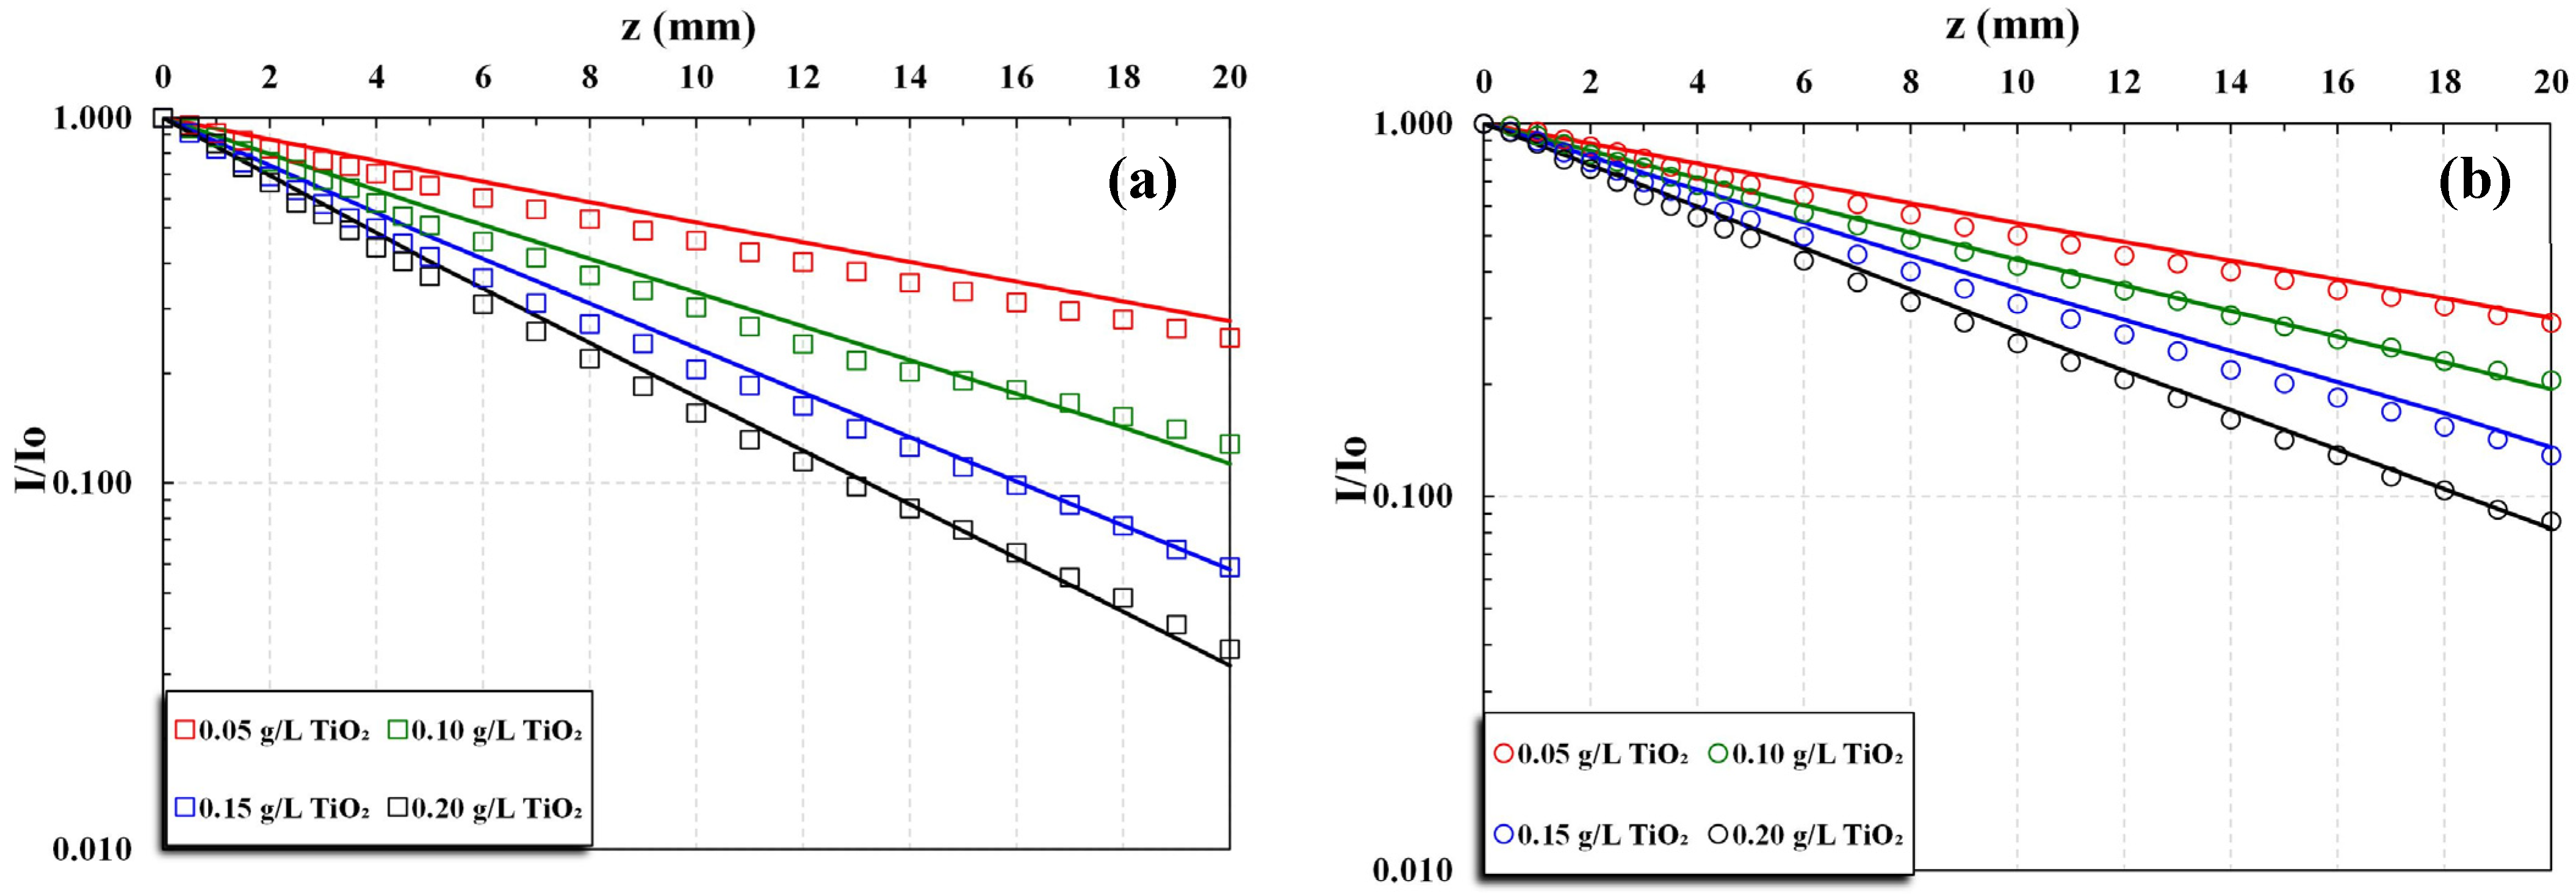
Experiments were carried out with several catalyst loadings, in the range of 0.015 to 0.2 g/L, three pH narrow ranges (~3, ~5, and ~8), and two types of UV irradiation, i.e., UVC and UVA. Each experiment with a fixed TiO2 concentration lasted, at most, 45 min. The temperature of the photoreactor fluid was rising by approx. 2 °C at the end of each experiment, due to heat dissipated by the lamps, ranging from 25 to 32 °C. The main experimental conditions and extinction coefficient β values of all data sets are listed in Table S1, Supplementary Materials.
As a first step in preparing the catalyst suspension, TiO2 powder at the desirable concentration was mixed in DI and vigorously stirred for about 4 h. Next, the pH adjustment was made by using either a NaOH or HCl solution, for preparation of the ~3 L dispersion solution, added to the photoreactor vessel. Magnetic stirring ensured a sufficient mixing and uniformity of the catalyst concentration. Afterwards, the UV lamp was turned on for approx. 15 min until the light intensity reached a maximum value and stabilized. To start the measurements, the moving lamp/quartz sleeve was placed in contact with the window quartz disc, which corresponds to zero radial distance (z = 0) and local UV light intensity Io. Then, the lamp/quartz sleeve was displaced away from the vessel wall, by manually controlling the depth gauge bar. The radial distance intervals of this movement dz were precisely controlled, i.e., by intervals dz = 0.5 mm for the first 5 mm and dz = 1 mm for the next 15 mm. The depth gauge path could be extended to z ~ 45 mm, where the light intensity is zero or negligible. The radial irradiance profile for each experiment, with a fixed TiO2 concentration, was obtained by recording value pairs of UV light intensity I and distance z from the photoreactor inside wall/window, employing the radiometer and depth gauge indications, respectively. At the end of each test, the experimental set-up was meticulously cleaned to remove catalyst deposits and other contaminants. Specifically, the reactor vessel and the quartz sleeve were first rinsed well with water and then the quartz sleeve was placed in the chamber of an ultrasonic cleaner. Finally, the window quartz disc, the UV lamp, and the quartz sleeve were wiped out with a soft tissue and an appropriate detergent.
Concerning the particle size distribution measurements, both the preparation of the catalyst dispersion and the pH adjustment were executed exactly as mentioned above. However, all the suspensions tested were of the same catalyst loading, 0.05 g/L. A suspension volume of 600 mL was placed in the instrument sampling vessel and remained there under moderate stirring (~1350 rpm) for 15 min, the recommended time for dispersion stabilization. Then, measurements for each sample after 2, 5, and 15 min were taken. With all samples, duplicate measurements were made, showing very good repeatability regarding the values of percentiles d50 (median value) and d90.

4. Results and Discussion

4.1. Particle Size Distribution

As is already mentioned (Section 3.2), the primary average particle size of the specific catalyst used in this work, i.e., TiO2 P25, is 21 nm according to the manufacturer. However, it is well known [6,10] that, depending on pH and other fluid conditions (ionic strength), TiO2 aqueous dispersions tend to form relatively large agglomerates in the range of micrometers. Following the aforementioned procedure, measurements were taken at different times, i.e., 2, 5, and 15 min. Figure 2 depicts the measured bimodal TiO2 volume-based size distributions (Figure 2a) as well as d50 and d90 size percentiles (Figure 2b) in the pH range employed in this work. Typical cumulative size distributions at 2 min, facilitating the determination of d50 and d90, are shown in Figure S4. In accordance with the literature results [10], a significant increase of d50 is observed for pH < 6 and a reduction for pH > 8. Noticeable is also an increase of d50 with time, apparently due to additional aggregation.

4.2. Transmittance and Total Extinction Coefficient β

The measured transmittance I/Io variation with a depth of field z, for various TiO2 concentrations C, g/L, and fluid pH ~5 and ~8, are plotted in Figure 3 and Figure 4 for UVC and UVA irradiation, respectively. Table S1 in the Supplementary Materials includes the main experimentally determined parameters for the various data sets, as will be subsequently discussed. For each UV irradiation type, the three data groups based on fluid pH are referred to here as pH ~3, pH ~5, and pH ~8 despite the small pH variability in each group, as shown in Table S1. The tested dispersions designated as pH ~5 were prepared by simply mixing TiO2 P25 particles with DI water and the resulting pH values were in general agreement with the pH values reported in the literature [10] for similar dispersions.
All data sets (each for fixed catalyst concentration C), depicted in Figure 3 and Figure 4, are described quite well by the Lambert–Beer law exponential function, where attenuation is due to the extinction coefficient β. It should be noted that the listed values in Table S1 of extinction coefficient β have been obtained by a simple least-squares fitting of the raw data; the respective lines are slightly different than the fitting lines depicted in Figure 3 and Figure 4, which are based on the K-M model (Equation (1)), as will be subsequently discussed. The strong effect of particle concentration C on light attenuation is evident in all cases. Furthermore, as shown in Figure 3, the data obtained with UVC irradiation of a relatively smaller wavelength (nearly monochromatic in this case) exhibit significantly greater attenuation and β values, compared to data taken under similar conditions using UVA irradiation (Figure 4). These general trends are well documented in the literature [13,15].
The extinction coefficient β (mm−1) values obtained from the above data (listed in Table S1), if plotted versus the respective catalyst concentration C (g/L), allow for an estimation of the specific extinction coefficient β* (cm2/g) for each group of data. Figure 5 shows such a plot for data groups of pH ~5 and pH ~8, with both UVC and UVA irradiation. One observes the fairly good quality of these data (particularly of those with high coefficient β values), that exhibit a smooth linear variation with slope β*, as expected [2,12]. Evident are the significantly greater β* values in the case of pH ~5 (particularly with UVC irradiation) compared to those of pH ~8. However, Figure 6, where data sets are compared for the groups with pH ~3 and pH ~5, shows that there is a rather insignificant difference of β* values for both types of irradiation, UVC and UVA.
The difference of light extinction between acidic and basic dispersions can be attributed to the different particle size distributions, due to different degrees of the agglomeration of primary TiO2 particles depending on fluid properties. This interpretation is supported both by measurements made in this study (Figure 2) and by published results [9,10,11] (as noted in the Introduction), showing that a reduction of pH below 6 leads to a significant increase of the particle-specific surface area, associated with reduced agglomerate/particle size. Furthermore, several studies [9,11] have concluded that UV light extinction tends to increase in dispersions of reduced mean particle size.
The experimentally determined transmittance I/Io, under various conditions, listed in Table S1, can be used to determine light extinction parameter values employed in photocatalytic reaction models. Such parameter χ (Equation (6)), defined as the average square root of light transmittance in the reactor over a depth z = b, was proposed by Calza et al. [17]. Figure 7 shows the variation of parameter χ in the reactor, over a depth z = 12 mm, as a function of photocatalyst concentration C, for various studied cases (data from Table S1). As expected, the case with the greatest extinction coefficients β (i.e., UVC, pH~5), exhibits the greatest decline of χ with increasing concentration C. Additionally, the data are quite consistent, with a tendency to reach the limiting value χ = 1 for C = 0. Figure 7 also depicts values of χ reported by Calza et al. [20], obtained with UVA irradiation. These values and the general trend are fairly close to the present data for UVA (pH ~5 and pH ~8), even though they were obtained with a quite different experimental technique.

4.3. Specific Absorption and Extinction Coefficients κ* and β*

To estimate the absorption coefficients for the various cases, the K-M model was fitted to the measured transmittance data sets, such as those in Figure 3 and Figure 4, where the lines represent the best fit. The estimated specific absorption (κ*) and total extinction (β*) coefficients for the various data groups are listed in Table 1. The previously discussed general trend of a greater extinction of the smaller wavelength, nearly monochromatic UVC irradiation (particularly for pH ~5 and pH ~3), is reflected in the much greater β* values, compared to those for the case of UVA irradiation of a broader wavelength.
For a comparison of the above κ* and β* values with similar literature results, it is convenient to use the scattering albedo parameter ω (defined as in Equation (5)), i.e.,
ω = σ * ( σ * + κ * ) = σ * β *
The aforementioned results by Cabrera et al. [12] and Satuf et al. [13], obtained with monochromatic UV light and TiO2 P25 particles of size 700 nm (dispersed in DI), show that ω = 0 at wavelength λ = 410 nm. However, ω significantly decreases with a decreasing λ, reaching a value ω = 0.5 at λ ~320 nm. Further, with reduced λ, a relatively mild reduction of ω is observed, which attains a value of ω = 0.4 at λ ~295 nm. The new data, obtained with DI (pH ~ 5), for both UVC (λ = 253.7 nm) and UVA, are in accord with the above results, exhibiting ω = 0.32 and ω = 0.50, respectively. Moreover, the β* value, i.e., approx. 6.70 × 104 cm2/g of the new UVC irradiation at pH ~5 data, appears to be in good agreement with the respective literature results (Figure 6 in [13]), which exhibit a similar β* value at their smallest employed λ ~295 nm. However, the new data with UVA irradiation at pH ~5 exhibit a significantly smaller β* value (approx. 1.0 × 104 cm2/g) compared to those reported in [13], in a similar range of λ. This apparent discrepancy may be attributed to the much broader λ range of UVA employed in the present work compared to the monochromatic light used in [13]. At this point, it should be mentioned that it was impossible to locate UVC (~250 nm) data in the literature, similar to the fairly complete data sets of this work, for comparison.
Yardakal et al. [15] reported extinction data obtained for dispersions of Degussa P25 particles of a mean size d = 1.7, 2.2, and 2.5 μm, and UVA monochromatic light with λ = 370 nm and 310 nm. These data were treated with the K-M model to estimate absorption coefficients. For λ = 370 nm, the albedo ω varied between 0.7 and 0.8, whereas the extinction coefficient β* was ~0.60 × 10⁴ to ~1.0 × 104 cm2/g. However, for λ = 310 nm, the light absorption was significantly increased as follows: ω = 0.20 and β* ~0.86 × 10⁴ to ~1.35 × 104 cm2/g. Interesting is also the observed increase of κ* and β* with a decreasing particle size. The new data (Table 1) obtained with UVA of a relatively broad range (λ ~ 350 to 390 nm) appear to be in fair agreement with these results, regarding both the magnitude of β* as well as the trend of ω reduction with a decreasing λ.
As noted earlier (Figure 7), the results by Calza et al. [17], obtained with UVA light, are in agreement with the new data regarding the parameter χ. They also report β* ~0.81 × 104 cm2/g, which is relatively close to the respective β* values in Table 1; however, they report a significantly greater albedo ω = 0.80. Finally, Ramos-Huerta et al. [27] implemented a new technique, employing a flow-through cell with a UVA/LED light source emitting at 375–400 nm, but quite a small TiO2 concentration, i.e., 0.01–0.02 g/L. They reported coefficient β* = 3.90 ± 0.3 × 104 cm2/g and albedo ω = 0.83 ± 0.03.
In summary, the new results obtained with nearly monochromatic UVC irradiation (λ = 253.7 nm), are in good agreement (regarding the magnitude of β*and ω as well as the general trend) with similar data by Satuf et al. [13] taken at a somewhat greater wavelength (λ ~295 nm). Also, the new β*and ω data with UVA light of a rather broad λ spectrum are in a general/fair agreement with similar literature data [15,17], even though there is a discrepancy with the ω value reported in [17]. Additionally, it is noted that there are possible improvements of the experimental equipment, including the Plexiglas® material used for the test vessel; specifically, despite the advantages of this material, regarding machining/fabrication and irradiation absorption, there were signs of degradation after the extended exposure to UV irradiation.

5. Conclusions

A commonly used technique to determine the extinction coefficient β (for fixed catalyst concentration C, with external irradiation) involves sequential single-point (z) measurements of transmittance I/Io through the repeated addition of a small dispersion volume to the test cell to adjust/increase the depth of field z; this is obviously tedious and prone to error. Regarding another type of set-up, with a UV lamp immersed in the test section, only single measurements are usually taken for a fixed depth z, thus greatly limiting the acquired values of a I/Io data set. However, the proposed technique, applicable to immersed UV lamps, facilitates the acquisition of complete I/Io data sets, for a fixed C, through a mechanism ensuring the precision adjustment and measurement of the depth of field z. Also, realistic photocatalytic dispersions can be assessed in this novel experimental set-up.
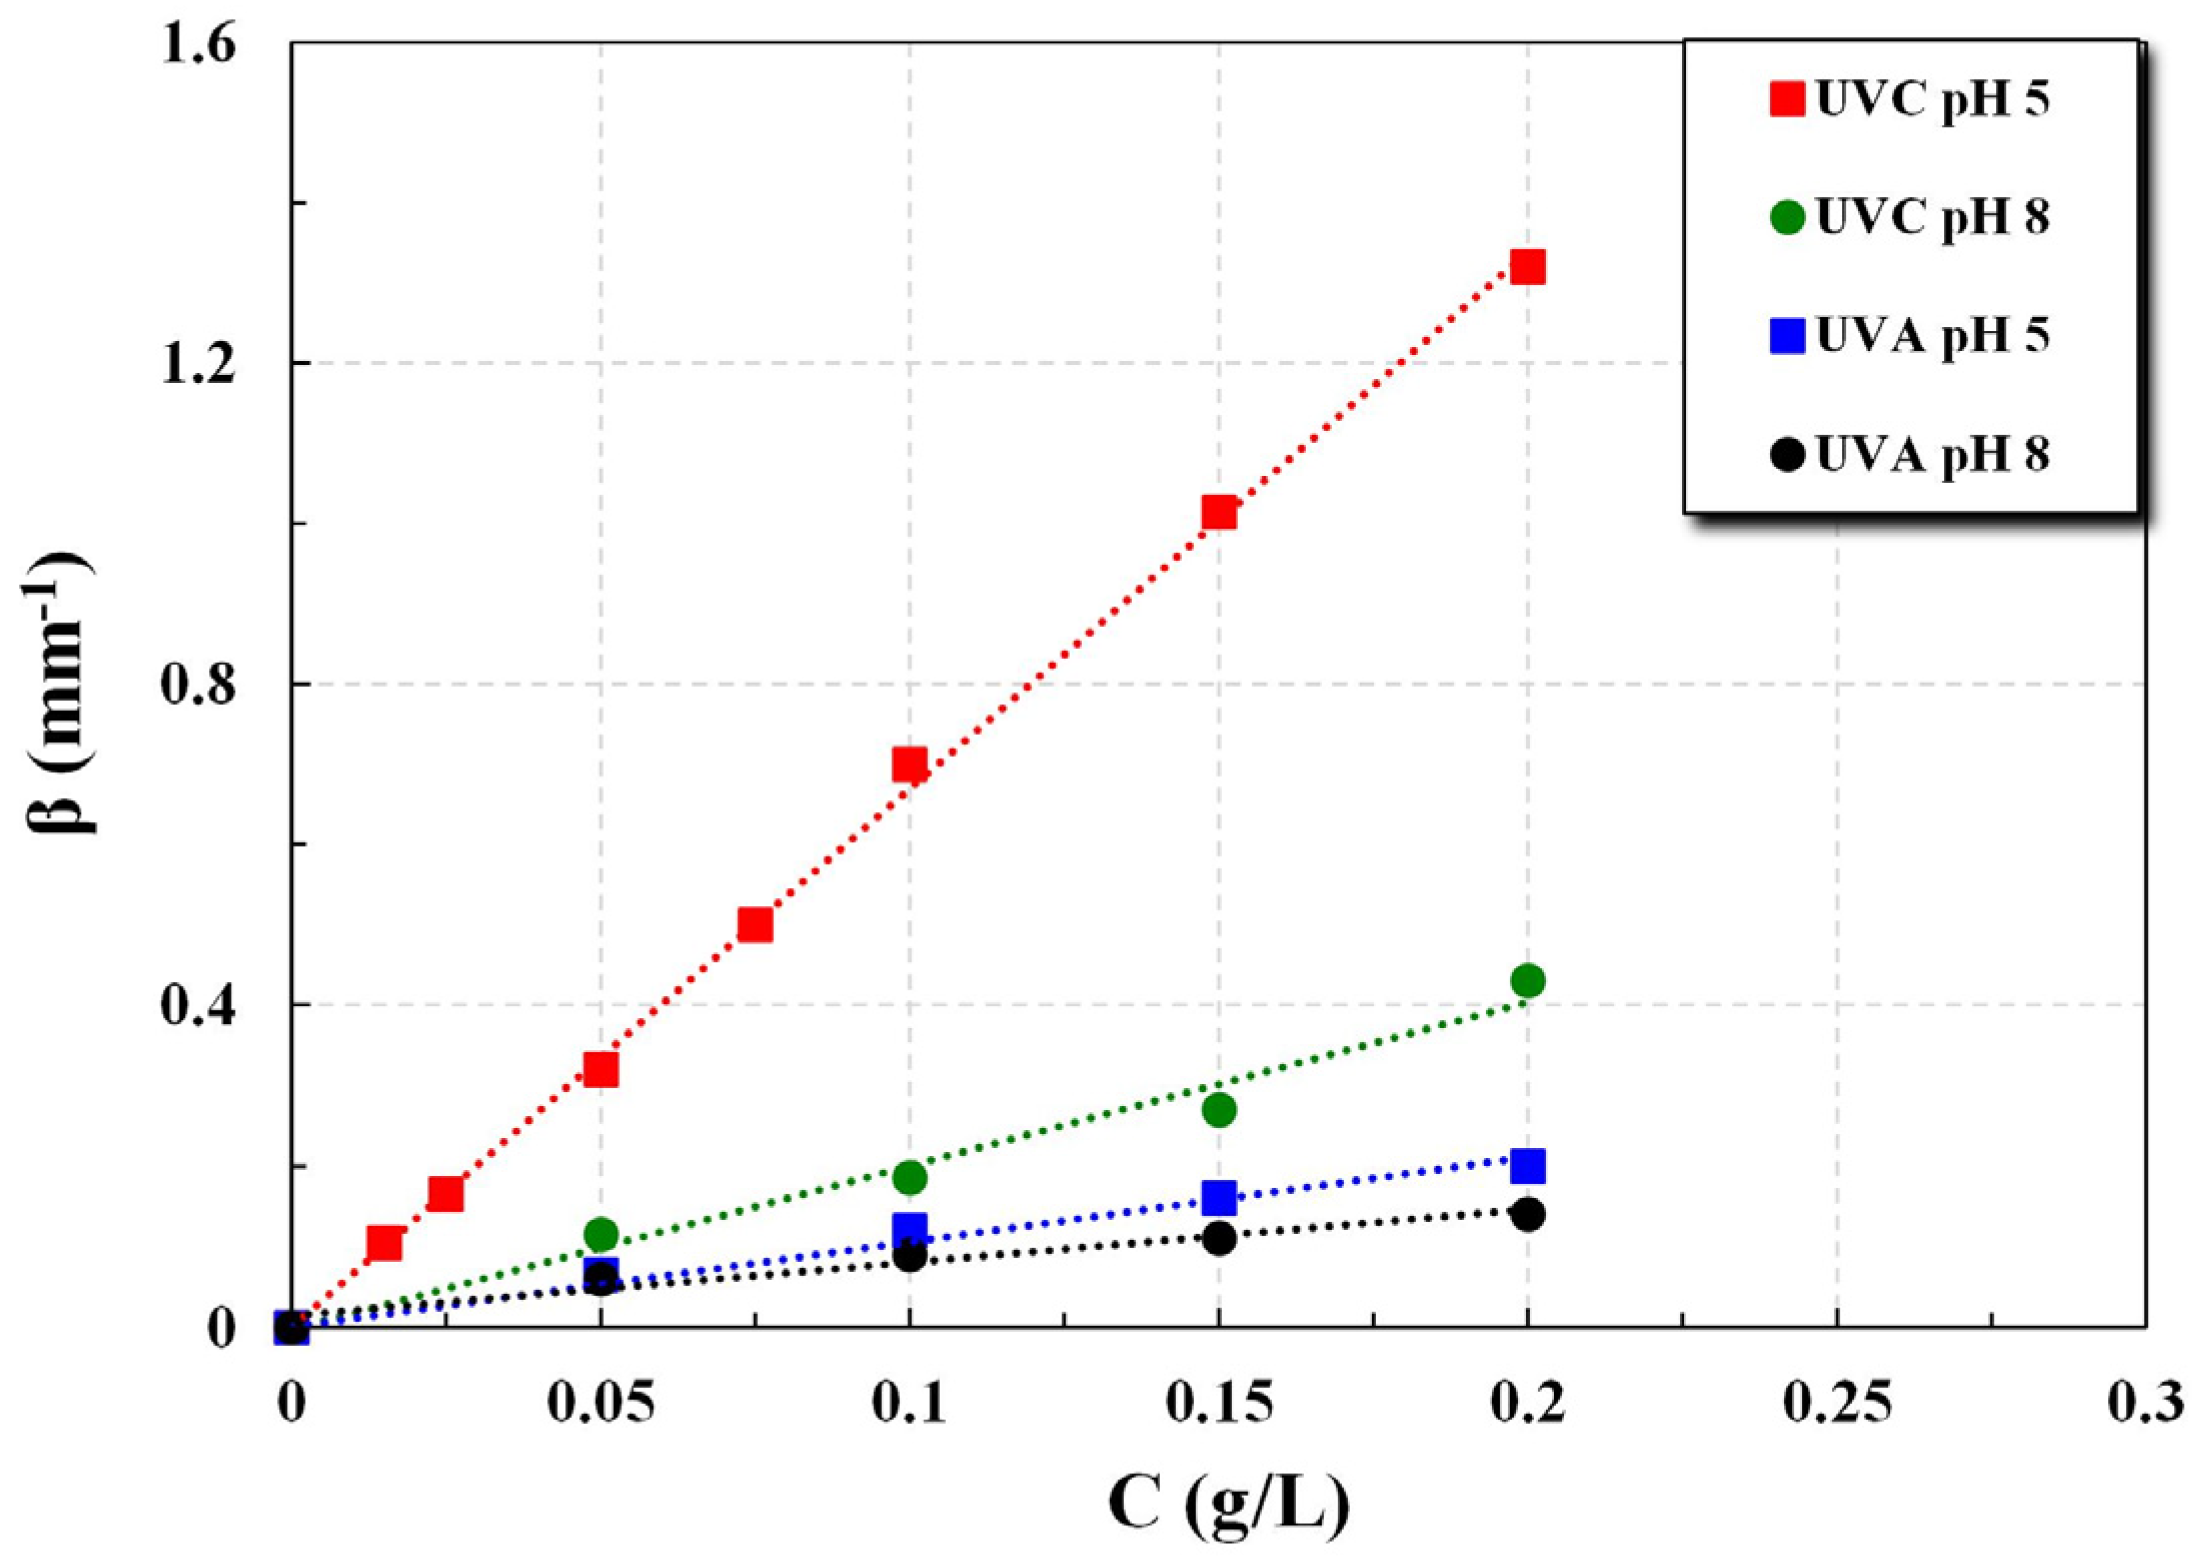
Regarding parameters β* and ω, the data for groups obtained with the new technique under various conditions (i.e., different irradiation types and pH values), are in fair agreement overall with literature results from several credible studies. The simplified Kubelka–Munk model, employed to estimate the albedo ω and absorption coefficient κ values, appears to perform satisfactorily. Therefore, the proposed technique is considered quite useful for implementation in photocatalytic process development and design studies. Nevertheless, additional work may be needed for possible improvements of both the K-M (or similar) model and the experimental set-up overall performance.

Supplementary Materials

The following supporting information can be downloaded at https://www.mdpi.com/article/10.3390/pr13041007/s1; Figure S1: Pictures, (a) front view and (b) top view of the experimental set-up; Figure S2: Reactor cross-section in detail (dimensions in mm); Figure S3: Photometric data of (a) Actinic BL PL-L 24W (UVA) and (b) Germicidal TUV PL-L 24W (UVC) lamps. Data retrieved from www.lighting.philips.com; Figure S4: Volume based particle size cumulative distributions of 0.05 g/L TiO2 suspensions, for various pH values at sampling time 2 min; Table S1: Values of extinction coefficient β, specific extinction coefficient β*, and parameter χ determined from all data sets of this study using UVC and UVA irradiation.

Author Contributions

V.C.S.: Investigation, visualization, writing original draft, writing—review and editing, A.J.K.: validation, writing original draft, writing—review and editing. All authors have read and agreed to the published version of the manuscript.

Funding

This research received no external funding.

Data Availability Statement

The data presented in this study are available on request from the corresponding author.

Acknowledgments

The authors acknowledge the expert support of the technical staff at NRRE/CPERI/ CERTH Messrs A. and M. Lekkas in the fabrication of experimental equipment. Thanks are also due to the Analytical Services Unit at CPERI/CERTH for assistance in the particle size measurements.

Conflicts of Interest

The authors declare no conflicts of interest.

References

  1. Ray, A.K. Photocatalytic Reactor Configurations for Water Purification: Experimentation and Modeling. Adv. Chem. Eng. 2009, 36, 145–184. [Google Scholar] [CrossRef]
  2. Alfano, O.M.; Cassano, A.E.; Brandi, R.J.; Satuf, M.L. A methodology for modeling slurry photocatalytic reactors for degradation of an organic pollutant in water. In Photocatalysis and Water Purification: From Fundamentals to Recent Applications; Pichat, P., Ed.; Wiley-VCH Verlag GmbH & Co.: Weinheim, Germany, 2013. [Google Scholar]
  3. Loeb, S.K.; Alvarez, P.J.J.; Brame, J.A.; Cates, E.L.; Choi, W.; Crittenden, J.; Dionysiou, D.D.; Li, Q.; Li-Puma, G.; Quan, X.; et al. The Technology Horizon for Photocatalytic Water Treatment: Sunrise or Sunset? Environ. Sci. Technol. 2019, 53, 2937–2947. [Google Scholar] [CrossRef] [PubMed]
  4. Karabelas, A.J.; Plakas, K.V.; Sarasidis, V.C. How far are we from Large-Scale PMR applications? In Current Trends and Future Developments on (Bio) Membranes: Photocatalytic Membranes and Photocatalytic Membrane Reactors; Elsevier: Amsterdam, The Netherlands, 2018; Chapter 9; pp. 233–295. ISBN 978-012813549-5. [Google Scholar]
  5. Zhang, J.; Wu, H.; Shi, L.; Wu, Z.; Zhang, S.; Wang, S.; Sun, H. Photocatalysis coupling with membrane technology for sustainable and continuous purification of wastewater. Sep. Purif. Technol. 2024, 329, 125225. [Google Scholar] [CrossRef]
  6. Schneider, J.; Matsuoka, M.; Takeuchi, M.; Zhang, J.; Horiuchi, Y.; Anpo, M.; Bahnemann, D.W. Understanding TiO2 Photocatalysis: Mechanisms and Materials. Chem. Rev. 2014, 114, 9919–9986. [Google Scholar] [CrossRef]
  7. Romero, R.L.; Alfano, O.M.; Cassano, A.E. Radiation Field in an Annular, Slurry Photo-catalytic Reactor. 2. Model and Experiments. Ind. Eng. Chem. Res. 2003, 42, 2479–2488. [Google Scholar] [CrossRef]
  8. Moreira, X.J.; Serrano, B.; Ortiz, A.; de Lasa, H. Evaluation of Photon Absorption in an Aqueous TiO2 Slurry Reactor Using Monte Carlo Simulations and Macroscopic Balance. Ind. Eng. Chem. Res. 2010, 49, 10524–10534. [Google Scholar] [CrossRef]
  9. Egerton, T. UV-Absorption—The Primary Process in Photocatalysis and Some Practical Consequences. Molecules 2014, 19, 18192–18214. [Google Scholar] [CrossRef]
  10. Suttiponparnit, K.; Jiang, J.; Sahu, M.; Suvachittanont, S.; Charinpanitkul, T.; Biswas, P. Role of Surface Area, Primary Particle Size, and Crystal Phase on Titanium Dioxide Nanoparticle Dispersion Properties. Nanoscale Res. Lett. 2011, 6, 27. [Google Scholar]
  11. Pellegrino, F.; Pellutiè, L.; Sordello, F.; Minero, C.; Ortel, E.; Hodoro, V.-D.; Maurino, V. Influence of agglomeration and aggregation on the photocatalytic activity of TiO2 nanoparticles. Appl. Catal. B Environ. 2017, 216, 80–87. [Google Scholar] [CrossRef]
  12. Cabrera, M.I.; Alfano, O.M.; Cassano, A.E. Absorption and Scattering Coefficients of Titanium Dioxide Particulate Suspensions in Water. J. Phys. Chem. 1996, 100, 20043–20050. [Google Scholar] [CrossRef]
  13. Satuf, M.L.; Brandi, R.J.; Cassano, A.E.; Alfano, O.M. Experimental Method to Evaluate the Optical Properties of Aqueous Titanium Dioxide Suspensions. Ind. Eng. Chem. Res. 2005, 44, 6643–6649. [Google Scholar] [CrossRef]
  14. Loddo, V.; Addamo, M.; Augugliaro, V.; Palmisano, L.; Schiavello, M. Optical Properties and Quantum Yield Determination in Photocatalytic Suspensions. AIChE J. 2006, 52, 2565–2574. [Google Scholar] [CrossRef]
  15. Yurdakal, S.; Loddo, V.; Bayarri Ferrer, B.; Palmisano, G.; Augugliaro, V.; Farreras, J.G.; Palmisano, L. Optical Properties of TiO2 Suspensions: Influence of pH and Powder Concentration on Mean Particle Size. Ind. Eng. Chem. Res. 2007, 46, 7620–7626. [Google Scholar] [CrossRef]
  16. Minero, C.; Vione, D. A quantitative evaluation of the photocatalytic performance of TiO2 slurries. Appl. Catal. B Environ. 2006, 67, 257–269. [Google Scholar] [CrossRef]
  17. Calza, P.; Minella, M.; Demarchis, L.; Sordello, F.; Minero, C. Photocatalytic rate dependence on light absorption properties of different TiO2 specimens. Catal. Today 2020, 340, 12–18. [Google Scholar] [CrossRef]
  18. Manassero, A.; Satuf, M.L.; Alfano, O.M. Photocatalytic reactors with suspended and immobilized TiO2: Comparative efficiency evaluation. Chem. Eng. J. 2017, 326, 29–36. [Google Scholar] [CrossRef]
  19. Modest, M.F. Radiative Heat Transfer; McGraw-Hill: New York, NY, USA, 2003. [Google Scholar]
  20. Kubelka, P. New contributions to the optics of intensely light scattering materials. Part I. J. Opt. Soc. Am. 1948, 38, 448–457. [Google Scholar] [CrossRef]
  21. Ciani, A.; Goss, K.U.; Schwarzenbach, R.P. Light penetration in soil and particulate minerals. Eur. J. Soil Sci. 2005, 56, 561–574. [Google Scholar] [CrossRef]
  22. Sharma, V.K. Aggregation and toxicity of titanium dioxide nanoparticles in aquatic environment—A review. J. Environ. Sci. Health Part A 2009, 44, 1485–1495. [Google Scholar] [CrossRef]
  23. Dillert, R.; Siemon, U.; Bahnemann, D. Photocatalytic disinfection of municipal wastewater. Chem. Eng. Technol. 1998, 21, 356–360. [Google Scholar] [CrossRef]
  24. Plakas, K.V.; Sarasidis, V.S.; Patsios, S.I.; Lambropoulou, D.A.; Karabelas, A.J. Novel pilot scale continuous photocatalytic membrane reactor for removal of organic micropollutants from water. Chem. Eng. J. 2016, 304, 335–343. [Google Scholar] [CrossRef]
  25. Kokhanovsky, A.A. Physical interpretation and accuracy of the Kubelka–Munk theory. J. Phys. D Appl. Phys. 2007, 40, 2210–2216. [Google Scholar] [CrossRef]
  26. Philips Products, Commercial Leaflets. Available online: www.lighting.philips.com (accessed on 12 December 2020).
  27. Ramos-Huerta, L.A.; Valadés-Pelayo, P.J.; Llanos, A.G.; Ruiz, R.S.; Cabello, J.J.; Castillo-Araiza, C.O. Development of a New Methodology to Determine Suspended Photocatalyst Optical Properties. Chem. Eng. J. 2021, 413, 127458. [Google Scholar] [CrossRef]
Figure 1. (a) Experimental set-up: (b) the side view and (c) top view of the photoreactor.
Processes 13 01007 g001
Figure 2. (a) Volume-based particle size distributions at 2 min and (b) d50 and d90 particle diameters of 0.05 g/L TiO2 suspensions at different sampling times, as a function of pH.
Processes 13 01007 g002
Figure 3. The measured transmittance I/Io variation with a depth of field z for various TiO2 concentrations: (a) UVC pH ~5 and (b) UVC pH ~8. The lines represent data fitting to the K-M model, Equation (1).
Processes 13 01007 g003
Figure 4. The measured transmittance I/Io variation with a depth of field z for various TiO2 concentrations: (a) UVA pH ~5 and (b) UVA pH ~8. The lines represent data fitting to the K-M model, Equation (1).
Processes 13 01007 g004
Figure 5. The effect of TiO2 concentration on light extinction coefficient β, for UVA and UVC irradiation, at pH ~5 and pH ~8, displaying smaller light attenuation in the latter case.
Processes 13 01007 g005
Figure 6. The effect of TiO2 concentration on light extinction coefficient β, for UVA and UVC light. Data displaying similar specific extinction coefficient β*, cm2/g, for pH ~3 and pH ~5.
Processes 13 01007 g006
Figure 7. The effect of TiO2 concentration on transmitted light parameter χ in the reactor, over a depth z = 12 mm, for UVA and UVC light, at pH ~5 and ~8. Data by Calza et al. [17] are also plotted.
Processes 13 01007 g007
Table 1. Specific absorption and extinction coefficients, including scattering albedo ω, determined from the new data sets, with different UV irradiation and pH values.
pHUVCUVA
ωβ* × 10−4 (cm2/g)κ* × 10−4 (cm2/g)ωβ* × 10−4 (cm2/g)κ* × 10−4 (cm2/g)
30.326.90 ± 0.104.69 ± 0.060.501.10 ± 0.250.55 ± 0.12
50.326.70 ± 0.304.56 ± 0.200.501.20 ± 0.200.60 ± 0.10
80.322.05 ± 0.251.39 ± 0.170.501.00 ± 0.300.50 ± 0.15
Disclaimer/Publisher’s Note: The statements, opinions and data contained in all publications are solely those of the individual author(s) and contributor(s) and not of MDPI and/or the editor(s). MDPI and/or the editor(s) disclaim responsibility for any injury to people or property resulting from any ideas, methods, instructions or products referred to in the content.

